d&b’s global economic outlook to 2018 - country risk · 2 global economic outlook: improving...
TRANSCRIPT

Around the World – Regional Insights, Upgrades and Downgrades
The Americas n Western and Central Europe n Eastern Europe and Central Asia
Asia Pacific n Middle East and North Africa n Sub-Saharan Africa
D&B’s Global Economic Outlook to 20182013 Year-End Update

2
Global Economic Outlook: Improving Long Term SentimentsIn the six months since our mid-year 2013 report, we have become more optimistic about the recovery from the 2008-09 recession. Nevertheless, the global economy is still far from achieving trend growth, making the recovery the most protracted in the past century. Of the 132 countries D&B assesses, 93 are rated worse than at the start of 2008, of which 55 are rated at least three quartiles lower. In contrast, only 15 economies have seen their rankings improve over
this period, and only two are rated more than two quartiles better. Furthermore, this far into the recovery, we would expect to be raising the risk ratings for the majority of our countries. However, in 2013, the risk ratings of 22 countries (16.7 percent of the countries covered) finished the year lower than they started it and with only eight (6.1 percent) countries improving.
TABLE 1: CHANGES IN RISK RATING JANUARY 2013 TO JANUARY 2014 BY REGION
Global Risk Insights nThe recovery from the 2008-09 recession remains the most challenging in the past century.
nHowever, we are more optimistic about growth in 2014 and beyond, particularly in the U.S.
nHeadwinds remain in the form of potential policy errors related to quantitative easing tapering, the healing process in advanced economies, and imbalances in the emerging markets.
nAusterity programs are also increasing political and social unrest.
Our increasing confidence in the slow recovery is highlighted by the improved forecasts for 2014 onward compared to one year ago. The forecast for real global growth for 2014 has increased from 2.5 percent to 2.7 percent, while the forecasts for the next three years have climbed to 2.9 percent in 2015, 3 percent in 2016, and 3.1 percent in 2017. However, the headline figure hides disparities across regions; our view of North America is considerably more optimistic, with growth
forecast at 2.8 percent to 3 percent between 2014 and 2017, compared with an average of 2.3 percent one year ago. We are also cautiously optimistic about average annual growth in Western and Central Europe, which we have increased by 0.2 percentage points (pp) to 1.8 percent in 2014-17. Growth in Sub-Saharan Africa will also increase by an average 0.2 pp over the same period, while Asia-Pacific’s growth figures have increased by an average 0.1 pp to 3.9 percent. In contrast, we are more pessimistic about growth in Latin America and the Caribbean (down an average 0.4 pp), the Middle
East and North Africa (down 0.7 pp), and Eastern Europe and Central Asia (down 1.1 pp).
REAL GDP GROWTH (%) UPGRADED SAME DOWNGRADED
Sub-Saharan Africa 0 20 1
MENA 1 11 7
Western Europe 4 20 6
Eastern Europe & Central Asia 2 13 1
Asia Pacific 1 18 4
The Americas 0 20 3
Total 8 102 22

3
Potential for Policy Error Undermines the Risk OutlookAlthough we are more optimistic about longer-term global growth trends, driven by a stronger U.S. private sector, potential for policy error is still high. Political and social tensions could also distract politicians from addressing their specific economic challenges. There is little margin for error in the pace and timing of the Federal Reserve’s decision to end its quantitative easing program (similar programs will eventually end in the EU, Japan, and U.K.). In addition, economic policy-makers in developed countries are still walking a tightrope in attempting to reduce high levels of public debt while supporting growth in their economies. Furthermore, the need to accelerate structural reform is key to long-term sustainable growth in developing markets. In both cases, political expediency rather than economic necessity could derail progress made to date. Finally, austerity programs across the globe have hit the middle classes in countries such as Brazil and Turkey, raising social unrest. Governments will be tempted to ensure short-term stability and boost their chances for re-election by adopting populist economic policies at the cost of ensuring long-term economic growth.
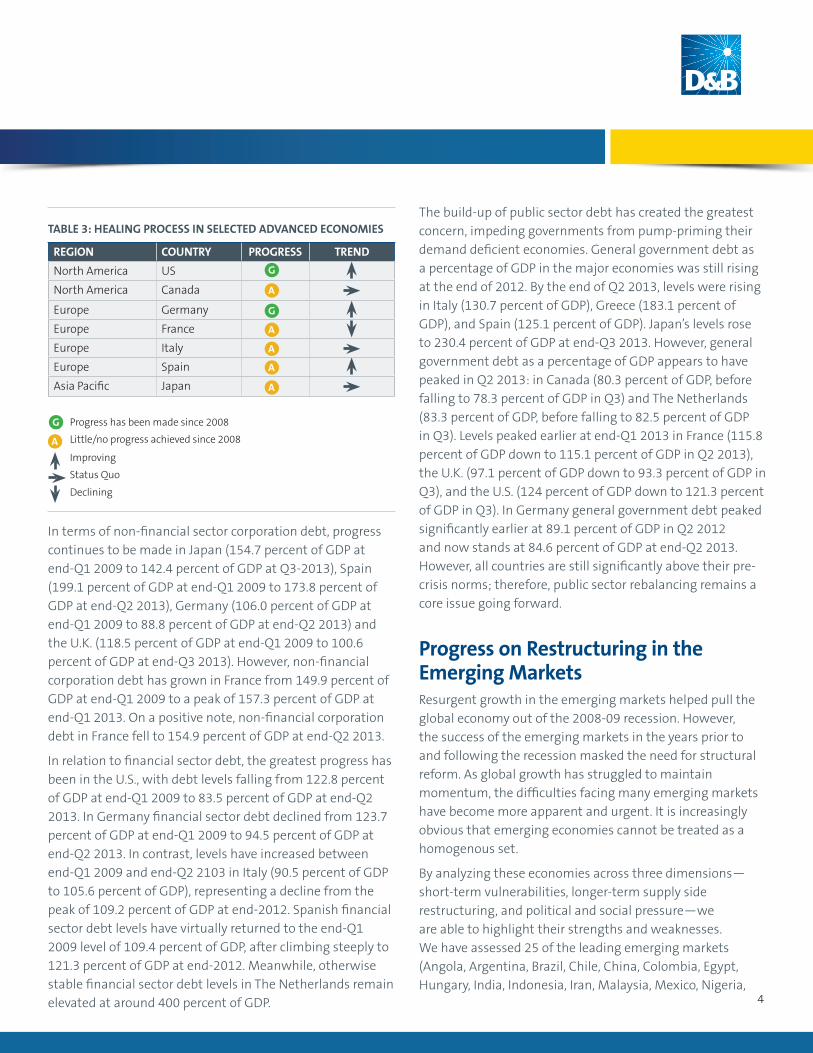
Progress on the Healing Process in the Advanced EconomiesDuring the 2008-2009 recession debt levels in advanced economies became a major risk issue. Levels of household and corporate debt had become unsustainable, fuelled by years of cheap credit. Public sector debt increased significantly as tax revenues fell and governments hiked spending to revive their ailing economies and rescue their banks. The healing process in advanced economies is underway but uneven (see table 3 for our assessment of the situation).
In terms of household debt, levels in the U.S. have fallen from a peak of 95.5 percent of GDP at end-Q1 2009 to 77.4 percent of GDP at end Q3 2013, while those in the U.K. have fallen from 108.7 percent of GDP to 94.4 percent of GDP. In Japan levels have fallen from a peak of 82.7 percent of GDP to 75.3 percent of GDP in the same period. In contrast, household debt levels have climbed in The Netherlands from 116.1 percent of GDP at end-Q1 2008 to a peak of 141.4 percent of GDP at end-Q1 2013. Since then it has fallen slightly to a still worrisome 139.7 percent of GDP at end-Q3 2013. In Canada household debt levels jumped from 68.3 percent of GDP at end-Q1 2006 to 93.2 percent of GDP at end-Q3 2013. Similarly, French household debt levels continue to increase, albeit to a less concerning level of 67 percent of GDP at end-Q2 2013 from 51.2 percent of GDP at end-Q1 2006.
TABLE 2: REAL GDP BY REGION 2012-2018
REAL GDP GROWTH (%) 2012 2013E 2014F 2015F 2016F 2017F 2018F
North America 2.7 1.9 2.8 2.9 3.0 3.0 2.9
Europe -0.3 0.1 1.2 1.8 2.1 2.2 2.3
Asia Pacific 4.3 4.1 4.1 4.0 3.6 4.0 3.6
Latin America & Caribbean 3.0 2.5 3.1 3.4 3.7 3.7 3.7
Eastern Europe & Central Asia 2.7 2.2 2.7 3.0 3.4 3.7 3.9
Middle East & North Africa 4.4 3.3 3.4 3.9 4.1 4.5 4.8
Sub-Saharan Africa 4.3 4.5 4.8 5.0 5.2 5.1 5.1
World 2.3 2.0 2.7 2.9 3.0 3.1 3.1
4
In terms of non-financial sector corporation debt, progress continues to be made in Japan (154.7 percent of GDP at end-Q1 2009 to 142.4 percent of GDP at Q3-2013), Spain (199.1 percent of GDP at end-Q1 2009 to 173.8 percent of GDP at end-Q2 2013), Germany (106.0 percent of GDP at end-Q1 2009 to 88.8 percent of GDP at end-Q2 2013) and the U.K. (118.5 percent of GDP at end-Q1 2009 to 100.6 percent of GDP at end-Q3 2013). However, non-financial corporation debt has grown in France from 149.9 percent of GDP at end-Q1 2009 to a peak of 157.3 percent of GDP at end-Q1 2013. On a positive note, non-financial corporation debt in France fell to 154.9 percent of GDP at end-Q2 2013.
In relation to financial sector debt, the greatest progress has been in the U.S., with debt levels falling from 122.8 percent of GDP at end-Q1 2009 to 83.5 percent of GDP at end-Q2 2013. In Germany financial sector debt declined from 123.7 percent of GDP at end-Q1 2009 to 94.5 percent of GDP at end-Q2 2013. In contrast, levels have increased between end-Q1 2009 and end-Q2 2103 in Italy (90.5 percent of GDP to 105.6 percent of GDP), representing a decline from the peak of 109.2 percent of GDP at end-2012. Spanish financial sector debt levels have virtually returned to the end-Q1 2009 level of 109.4 percent of GDP, after climbing steeply to 121.3 percent of GDP at end-2012. Meanwhile, otherwise stable financial sector debt levels in The Netherlands remain elevated at around 400 percent of GDP.
The build-up of public sector debt has created the greatest concern, impeding governments from pump-priming their demand deficient economies. General government debt as a percentage of GDP in the major economies was still rising at the end of 2012. By the end of Q2 2013, levels were rising in Italy (130.7 percent of GDP), Greece (183.1 percent of GDP), and Spain (125.1 percent of GDP). Japan’s levels rose to 230.4 percent of GDP at end-Q3 2013. However, general government debt as a percentage of GDP appears to have peaked in Q2 2013: in Canada (80.3 percent of GDP, before falling to 78.3 percent of GDP in Q3) and The Netherlands (83.3 percent of GDP, before falling to 82.5 percent of GDP in Q3). Levels peaked earlier at end-Q1 2013 in France (115.8 percent of GDP down to 115.1 percent of GDP in Q2 2013), the U.K. (97.1 percent of GDP down to 93.3 percent of GDP in Q3), and the U.S. (124 percent of GDP down to 121.3 percent of GDP in Q3). In Germany general government debt peaked significantly earlier at 89.1 percent of GDP in Q2 2012 and now stands at 84.6 percent of GDP at end-Q2 2013. However, all countries are still significantly above their pre-crisis norms; therefore, public sector rebalancing remains a core issue going forward.
Progress on Restructuring in the Emerging MarketsResurgent growth in the emerging markets helped pull the global economy out of the 2008-09 recession. However, the success of the emerging markets in the years prior to and following the recession masked the need for structural reform. As global growth has struggled to maintain momentum, the difficulties facing many emerging markets have become more apparent and urgent. It is increasingly obvious that emerging economies cannot be treated as a homogenous set.
By analyzing these economies across three dimensions—short-term vulnerabilities, longer-term supply side restructuring, and political and social pressure—we are able to highlight their strengths and weaknesses. We have assessed 25 of the leading emerging markets (Angola, Argentina, Brazil, Chile, China, Colombia, Egypt, Hungary, India, Indonesia, Iran, Malaysia, Mexico, Nigeria,
REGION COUNTRY PROGRESS TREND
North America US
North America Canada
Europe Germany
Europe France
Europe Italy
Europe Spain
Asia Pacific Japan
A
A
A
A
A
G
G
A
G Progress has been made since 2008
Improving
Little/no progress achieved since 2008
Status Quo
Declining
TABLE 3: HEALING PROCESS IN SELECTED ADVANCED ECONOMIES

5
Philippines, Poland, Romania, Russia, Saudi Arabia, South Africa, Thailand, Turkey, Ukraine, Venezuela, and Vietnam) to ascertain the risks and opportunities of cross-border trade and investment with counterparties in these countries.
By assessing 15 separate macro-economic and financial indicators over the past five years (significant indicators of domestic banking distress and financial crisis), we have created an analytical framework that scores the short-term vulnerability of these 25 major emerging economies against each other comparably. Our analysis includes an evaluation of the relative growth of asset prices and credit extension, as well as of the build-up of public and external debt, while accounting for mitigating factors such as high foreign exchange (FX) reserves. Countries most vulnerable to short-term financial pressures are South Africa, Malaysia, India, Turkey, Brazil, and Venezuela. Countries such as Saudi Arabia, Angola, Vietnam, Russia, Nigeria, and China were considered to be less vulnerable to the negative impacts of sudden short-term capital outflows. This was due primarily to the strength of their FX reserves, lower relative capital inflows, and reduced financial openness to global capital markets.
Short-term vulnerabilities can hide more positive news about the strength of the economy in the longer term. Countries that appear to be able to weather short-term crisis are less well-structured to grow at their maximum potential. We have assessed changes in four pillars on the
supply side over the past decade to ascertain how well the country has used the capital inflows experienced during the boom years. The four pillars are 1) human capital, in which we measure the quantity and quality of a country’s labor force; 2) physical capital, in which we measure gains in productive capacity through infrastructure and innovation; 3) competitiveness of the economy, in which the comparative advantage over its peers is assessed; and 4) openness of the economy, in which the country’s integration with the rest of the world is assessed.
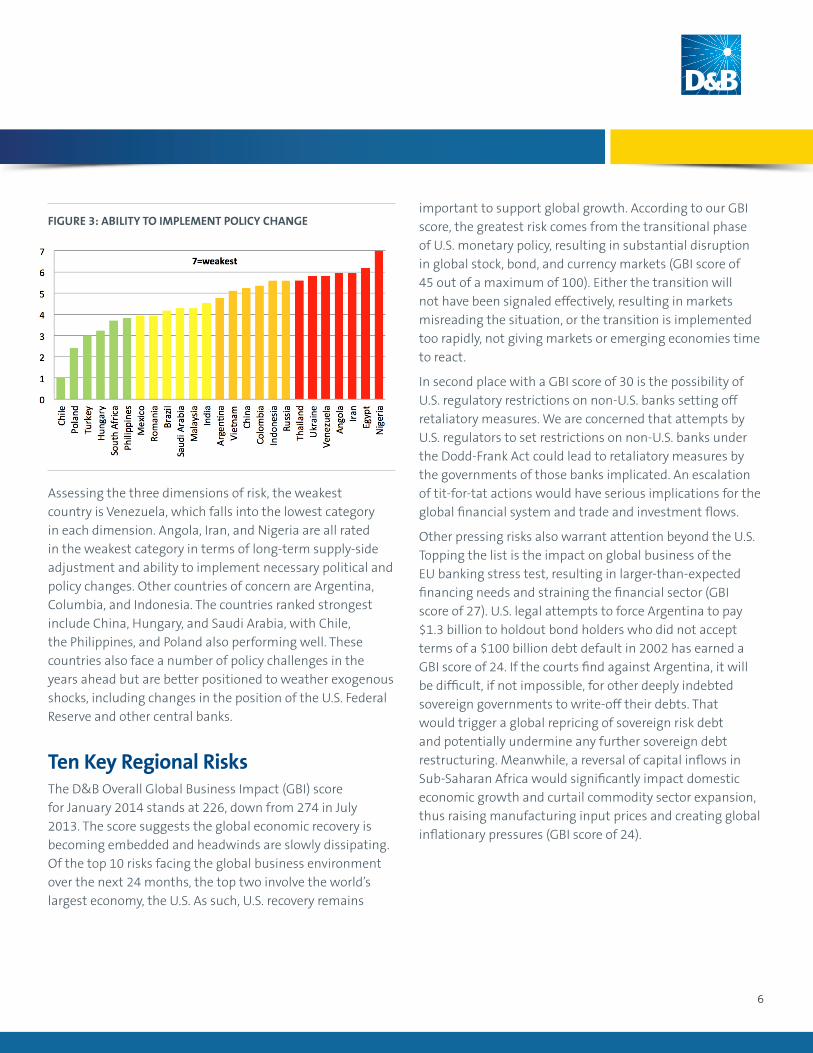
The third leg of our assessment accounts for political factors, which can impede or assist with the implementation of the necessary supply-side restructuring. By assessing the timing of elections (the closer to January 2014, the less likely the country is to start on a painful restructuring path), the capability of the institutions to implement policy change, and the type of political system, we highlight seven countries in which impediments to change and positive reaction are high. These are Thailand, Ukraine, Venezuela, Angola, Iran, Egypt, and Nigeria. In contrast, Chile, Poland, Turkey, Hungary South Africa, and the Philippines have political environments and institutions that would be able to better adapt to and cope with a sudden change in global investor sentiment.
FIGURE 1: SHORT-TERM VULNERABILITY SCORE
FIGURE 2: LONGER-TERM SUPPLY SIDE RESTRUCTURING
6
Assessing the three dimensions of risk, the weakest country is Venezuela, which falls into the lowest category in each dimension. Angola, Iran, and Nigeria are all rated in the weakest category in terms of long-term supply-side adjustment and ability to implement necessary political and policy changes. Other countries of concern are Argentina, Columbia, and Indonesia. The countries ranked strongest include China, Hungary, and Saudi Arabia, with Chile, the Philippines, and Poland also performing well. These countries also face a number of policy challenges in the years ahead but are better positioned to weather exogenous shocks, including changes in the position of the U.S. Federal Reserve and other central banks.
Ten Key Regional RisksThe D&B Overall Global Business Impact (GBI) score for January 2014 stands at 226, down from 274 in July 2013. The score suggests the global economic recovery is becoming embedded and headwinds are slowly dissipating. Of the top 10 risks facing the global business environment over the next 24 months, the top two involve the world’s largest economy, the U.S. As such, U.S. recovery remains
important to support global growth. According to our GBI score, the greatest risk comes from the transitional phase of U.S. monetary policy, resulting in substantial disruption in global stock, bond, and currency markets (GBI score of 45 out of a maximum of 100). Either the transition will not have been signaled effectively, resulting in markets misreading the situation, or the transition is implemented too rapidly, not giving markets or emerging economies time to react.
In second place with a GBI score of 30 is the possibility of U.S. regulatory restrictions on non-U.S. banks setting off retaliatory measures. We are concerned that attempts by U.S. regulators to set restrictions on non-U.S. banks under the Dodd-Frank Act could lead to retaliatory measures by the governments of those banks implicated. An escalation of tit-for-tat actions would have serious implications for the global financial system and trade and investment flows.
Other pressing risks also warrant attention beyond the U.S. Topping the list is the impact on global business of the EU banking stress test, resulting in larger-than-expected financing needs and straining the financial sector (GBI score of 27). U.S. legal attempts to force Argentina to pay $1.3 billion to holdout bond holders who did not accept terms of a $100 billion debt default in 2002 has earned a GBI score of 24. If the courts find against Argentina, it will be difficult, if not impossible, for other deeply indebted sovereign governments to write-off their debts. That would trigger a global repricing of sovereign risk debt and potentially undermine any further sovereign debt restructuring. Meanwhile, a reversal of capital inflows in Sub-Saharan Africa would significantly impact domestic economic growth and curtail commodity sector expansion, thus raising manufacturing input prices and creating global inflationary pressures (GBI score of 24).
FIGURE 3: ABILITY TO IMPLEMENT POLICY CHANGE

7
Another concerning risk includes political unrest in Brazil resulting from unfulfilled middle-class aspirations following the global downturn. Such a scenario threatens to spread into other emerging markets, a possibility we rate at 30 percent. The trigger is likely to be different in each country but the result would damage policy stability and erode investor confidence, triggering capital outflows. In seventh place with a GBI score of 16 (down from third in the July 2013 ranking of 32) is the political uncertainty of the U.S. budget deficit. Until resolved, global markets will remain volatile when activity in Washington, DC, heats up.
Two Asia-Pacific risks share eighth place with GBI scores of 14. First, government policies could lead to a substantial correction in Chinese property prices, significantly undermining attempts to increase the domestic demand share of economic growth. Potential problems in the Chinese financial sector and a freezing of the interbank market—leading to mid-tier banks seeking a government bailout—pose an additional challenge. Second, a break-up of Syria into a series of mini-fiefdoms would destabilize neighboring countries and create a base for launching attacks on western interests across the globe.
TABLE 4: TOP 10 RISKS BY D&B GLOBAL BUSINESS IMPACT SCORE FOR THE GLOBAL BUSINESS ENVIRONMENT
REGION RISKLIKELIHOOD
OF EVENT (%)
GLOBAL IMPACT
(1-5)
GLOBAL BUSINESS
IMPACT SCORE (1-100)
North AmericaTransitional phase of US monetary policy results in substantial disruption in global financial markets
45 5 45
North AmericaUS regulatory restrictions on non-US banks sets off retaliatory measures
50 3 30
West & Central EuropeEU banking stress test leads to bigger than expected refinancing needs
45 3 27
Latin AmericaA US Supreme Court ruling against Argentina results in global re-pricing of sovereign risk
40 3 24
Sub-Saharan AfricaEpisodes of reversal in foreign capital inflows as SSA countries adjust to the varying pace of monetary withdrawal in the U.S.
40 3 24
Latin America Anti-government protests inspired by Brazil spread through emerging markets, damaging policy stability and global investor sentiment
30 3 18
North AmericaPolitical standoff over fiscal re-balancing fosters continued policy uncertainty
20 4 16
Asia PacificMacroprudential policies to rein in credit growth trigger a substantial correction in China’s property market
35 2 14
Asia PacificChina’s interbank market freezes and mid-tier banks require emergency capital issues and seek state rescues
35 2 14
Middle East & North Africa Syria breaks up into mini-fiefdoms and violence spreads into neighboring countries
70 1 14

8
Key Observations nGlobal rebalancing is underway but growth will
remain below previous trend rates into the medium term
nThe recovery process will not be a straight line and businesses should be prepared for ups and downs
nThe end of quantitative easing programs will bring further uncertainty, particularly if timed badly or signaled poorly
n The importance of the recovery becoming embedded in the US is highlighted by the D&B Global Business Impact scores in relation to the transitory phases of monetary easing and fiscal rebalancing
nIn addition, structural imbalances in China and other emerging economies need to be handled with care, not just for the Chinese economy but also businesses across the globe

9
Regional Outlook
We anticipate a modest recovery in 2014, with regional growth of 3.1 percent (up from 2.5 percent in 2013) as the U.S. recovery strengthens, the euro zone continues to heal, and the global economy improves. Despite some moderation, demand for hard commodities (particularly by China) is likely to stabilize in 2014, thereby maintaining export receipts by commodity-driven economies. While the U.S. Fed continues to draw down quantitative easing in Q1, key currencies will remain relatively strong in the near term. Pressures on current account balances will persist as domestic consumption builds toward the second half of the year. We anticipate stable foreign direct investment (FDI) inflows to
Brazil, Chile, and Mexico as investor confidence and expectations (particularly for the two latter economies) improve.
Mexico is poised for growth with the passage of legislation to enable private sector investment in key sectors (particularly energy), projected real GDP growth of 2.9 percent for the U.S., and higher government spending. Consequently, we are projecting real GDP to expand from 1.2 percent in 2013 to 3.4 percent in 2014. In contrast, our outlook for Brazil is less confident. Supply-side constraints and government reluctance to implement political and economic reform weigh heavily on near-term prospects. We anticipate Brazil’s real GDP to inch up to 2.6 percent in 2014 from 2.5 percent in 2013. Barring radical political and economic reform, the commercial environment in Venezuela and Argentina will deteriorate further in 2014. Heavy government intervention and a sharply weakening external position will lead to real GDP growth of 3.5 percent for Argentina and 0.9 percent for Venezuela.
RecommendationsnExpect a continuation of economic policy for governments
facing elections in the next year…
n…but expect higher tax liabilities in the post-election period as some incoming candidates favored to win have signaled funding social reform through higher taxation
nExpect a hike in protest action as legislative and presidential elections draw near. Take appropriate action to lessen the impact on business operations
nLook out for deteriorating commercial climates in Venezuela and Argentina in early 2014 as market intervention by governments deepens and FX controls tighten to stem the outflow of foreign reserves
nIdentify and explore potential investment opportunities in large infrastructure projects as key governments lean toward more public-private partnership arrangements to facilitate capital works
Headline Regional Issues nRegional economies are expected to gather pace (to
varying degrees) in 2014 as the U.S. recovery accelerates and the global economy continues to heal
nDownside risks linked to commodity price volatility and the impact of U.S. Fed tapering will continue in the near term
nVenezuela, Argentina, and Brazil will face stubborn price pressures in Q1, with other economies likely to see an uptick in the second half as spare capacity is utilized
nEconomic reform is unlikely to be undertaken in the near term by incumbents facing re-election 2014; instead stop-gap measures to appease disenchanted voters are likely to be implemented
nInternational reserves are broadly solid, providing adequate buffers against moderate external shocks in the near term, but current account balances will remain under pressure in Q1
Trend: Stable
Regional Insight: The Americas

10
Regional Outlook
Despite emerging from recession in Q2 2013, and although preliminary and forward-looking data support our view of an ongoing recovery, the euro zone faces a period of below-trend growth in the next few years. In addition, the long-term survival of the common currency area is still at risk. While the situation seems under control at the moment, far-reaching reforms (including harmonization and power transfers to EU level) are required to prevent the euro area from collapsing. Also, the ultra-supportive monetary policy of the ECB has not led to better refinancing conditions in the euro zone periphery, where companies still report complicated credit access. Interest rates are prohibitively high and lending terms are tight. In combination with muted demand, insolvency risk is still on the rise, while payment performance is poorer than normal.
Positively, we expect real GDP growth in the five biggest economies in the region to pick up in 2014: the U.K. (2 percent) and Germany (1.7 percent) will outperform France (0.7 percent), Spain (0.1 percent), and Italy (-0.3 percent). In addition, Sweden (2 percent) will also see a healthy recovery, supporting its trading partners around the Baltic Sea. Although the recovery in the Mediterranean region lags the North, optimism is returning to the region as a whole. Spain’s Q3 2013 real GDP data shows that the country has emerged from its two-year recession, while the EU’s Economic Sentiment Indicator (combining consumer, industrial, retail, services, and construction sector confidence indicators) is at its highest level since July 2011.
RecommendationsnDespite recent improvements, expect the recovery in the
euro zone and the wider region to remain shaky and weak as downside risks remain significant
nAlthough not our core scenario, a sudden break-up of the euro zone cannot be ruled out. Monitor the news flow closely due to the high frequency of events
nMaintain tight payment terms for customers in the Mediterranean countries as insolvency risk is on the rise and payment performance is still poor
Headline Regional Issues nFor the first time in the recent past, and despite the
persistence of downside risks, the outlook for Western Europe is improving
nThe euro zone emerged from recession in Q2 2013. The biggest country outside the common currency area, the U.K., shows signs of a strong and sustained recovery
nHowever, high unemployment rates remain a pressing issue in most countries and the long-term survival of the euro zone is far from guaranteed
nStress tests by the European Central Bank (ECB) began in November 2013 (to be completed in November 2014), assessing the potential refinancing needs and the stability of the euro zone’s 124 biggest banks
Trend: Improving
Regional Insight: Western and Central Europe

11
Regional Outlook
The Eastern Europe and Central Asia region encompasses a large variety of economies with diverse growth perspectives. Growth in emerging Europe was around 2.4 percent in 2013 and will be 3 percent in 2014, thanks mainly to relatively strong performance in the Baltics: they rebounded strongly in 2011-12 after economic re-balancing following the financial crisis. Export links to Russia, which supported their quick recovery, will become less helpful in 2014 as Russia slows. A timid recovery in the euro area (the Baltic states’ other principal export market) will not be able to compensate for Russia’s deceleration.
In contrast, net export producers in Central Asia will perform at a strong 5.8 percent in 2013-14, underpinned by relatively high commodity prices and growing production volumes. European CIS countries will be the worst performers in the region, with expected growth at only 0.9 percent in 2013, slowing from 1.7 percent in 2012. They are expected to grow below their potential due to supply-side constraints and
slow progress in structural changes needed to resume pre-crisis growth levels. Regional economies, especially European CIS countries, have been moderately hit by global financial market volatility, and we expect the start of “tapering” of asset purchases to have only limited impact on them. Owing to their limited integration in the global financial system, Central Asian countries were almost unaffected by the global market turbulence, and they will remain isolated in the future. Monetary policies, which could be employed to tackle the slowdown in the European CIS economies, might be constrained by the risk of surging inflation as economies run at almost full capacity.
The region’s key economy, Russia, is seeing economic expansion ease: the output gap has essentially closed and the economy is running near a lower potential. The Russian slowdown will generate negative spillover effects for some Central Asian countries through workers’ remittances, as well as for a wider range of regional economies through trade and capital. After contraction in 2013, we expect Ukraine to bounce back and grow at around 1.3 percent in 2014. The bail-out package it received from Russia in December 2013 will avert its current account crisis, but will do little to tackle its structural imbalances. We do not exclude a recurrence of political crisis in the country should Ukraine keep relying on Russia’s sponsorship without fixing its economic imbalances. Meanwhile, Kazakhstan’s rate of growth remains higher than other major economies, supported by increasing oil production but dragged down by its close links to Russia.
RecommendationsnDownside risks for doing business in the region prevail;
moreover, different combinations of downside risks in different locations require an in-depth assessment of particular countries
nStrict trade terms are recommended, especially in Central Asia and European CIS countries
nAdequate political risk/trade credit insurance should be considered
Headline Regional Issues nWe expect the Eastern European and Central Asian
region overall to grow in line with the global average in 2014, with Central Asian and emerging European countries advancing faster than average and European Commonwealth of Independent States (CIS) countries falling behind
nThe balance of risks to the regional outlook is mixed: downside risks include re-balancing in China and the end of the commodities supercycle, whereas the long-awaited euro zone recovery is an upside
nPolitical and security risks remain high in Central Asian and European CIS countries
Trend: Stable
Regional Insight: Eastern Europe and Central Asia

12
Regional Outlook
The Asia-Pacific region faces an ambiguous period. It enjoys freedom from major negative supply shocks, liquidity remains plentiful, and emerging markets boast good demographics and continued growth, particularly in lower-income countries. The region’s manufacturing supply chains have also recovered since 2008. Asia’s real GDP can grow by close to 4 percent again in 2014, as in 2013, provided global liquidity and external demand conditions remain supportive. But higher average medium-term growth will be better assured with moderated near-term credit growth and sustainable asset valuations.
Asia’s structural and cyclical positives nonetheless fall under the shadow of tighter U.S. monetary policy in 2014-15. That could pop asset and debt bubbles by reversing capital flows, making both hard to identify as bubbles save in retrospect. Meanwhile, Asia will be impacted in 2014 by turning points for all the major global economies – the U.S., Europe, China, and Japan. A stronger dollar and tightening short-term liquidity in the U.S. could resound globally and hit foreign assets exposed to interest rate risk. The Fed fears such a reprise of the global bond market shock of 1994-95.
China may be safer from a hard landing than it was in 2012, but periodic shortages of short-term liquidity in the banking system, even if policy-induced, suggest hidden strains. China’s shallow bond yield curve, flatter than that of any other major regional market, also foretells flat economic growth. Meanwhile, the lack of a high-quality GDP deflator that controls for property prices accurately means that published GDP data become less meaningful as the property boom continues.
For its part, Japan’s large corporations may report the best results in six years at end-Q1 2014; but behind the spin of bold, innovative policy, its policymakers are pursuing quite traditional expedients to finesse its fiscal imbalances and structural negatives. These include competitive devaluation via a weaker yen and a deliberate stoking of inflation. The latter is not yet self-sustaining and stems from the exchange rate, a benefit which will come at the expense of South Korea and Taiwanese corporate earnings in sectors such as electronics.
2014 will bring divergences between emerging markets in Asia. More countries with balance-of-payments vulnerability are grappling with sustained inflation. Indonesia and Vietnam join India and Pakistan in this regard. Whether India can avoid a credit crunch and stagflation in 2014 is not guaranteed, although we expect a mild recovery in growth (5 percent). Its near-10 percent consumer price index (CPI) inflation reflects not just supply-side barriers but redistributive policy choices that are slowing consumption growth. The Philippines’ peso, buoyed by skilled expatriates’ remittances, is emerging as a more stable currency than Indonesia’s. Indonesia has raised interest rates to retain external balance, while Thailand faces a cyclical but politically amplified slowdown and a need for looser monetary policy.
RecommendationsnBe prepared to move to open-account (OA) terms to grow market
share in one sector but to tighten terms for another as economies diversify and the near-term picture gets more complex
nUse your negotiations over trade terms to gauge customer and supplier liquidity and optimism in what will be a complex, shifting picture in 2014, with positive and negative factors combining
nMonitor FX liquidity in countries with balance-of-payments difficulties and weakening currencies
nBe prepared to give more generous terms in cyclical sectors as industrial production in Asia consolidates from the slowdown caused by recession in eastern China and the EU in 2012-13
Headline Regional Issues nFX outflows and weakening currencies have abated with the
retreat of fears that the Fed’s policy switch to downsize asset purchases would curtail global liquidity, but 2014 could see such fears return
nThe Chinese economy has re-accelerated slightly. However, limits of the current reform paradigm and the toxic results of market-blind lending decisions since 2008 are becoming clearer
nIndonesia, India, Vietnam, and Pakistan will face continued balance-of-payments pressures; they can avoid external financing woes provided U.S. policy adjustment is not too abrupt and domestic policy is sound
Trend: Stable
Regional Insight: Asia-Pacific

13
Regional Outlook
Despite a relatively flat oil price, government spending of oil revenues will drive growth in oil-rich countries through large infrastructure projects. Meanwhile, oil-poor countries will continue to benefit from job opportunities, trade, investment, and economic assistance from oil-rich countries. Overall, we expect regional growth to rebound: we forecast growth of 3.3 percent in 2014 and 3.9 percent in 2015, following a decline from 4.3 percent in 2012 to 3 percent in 2013. However, in the short term, negative forecast risks result from global economic uncertainties, particularly the fallout from the crisis in Europe and ongoing regional political and security issues. In the medium term, the impact of U.S. shale oil and gas on global oil prices and restructuring in emerging markets will pose a downside risk.
After several years of falling growth the region’s largest economy, Saudi Arabia, will see real GDP growth rise slowly from 3 percent in 2013 to 3.6 percent in 2014 and 4.2 percent in 2015. Such growth will be driven by infrastructure spending. Similarly, Qatar’s prodigious double-digit growth rate in 2006-11 has slowed but will still average 6.3 percent in 2014-15 before picking up as government expenditures increase ahead of the 2020 World Cup. In addition, the United Arab Emirates will continue to recover from its 2009-10 debt crisis, expanding by 5.1 percent in 2014 and 5.3 percent in 2015. Although progress on the nuclear issue continues, the impact of international sanctions will continue to curtail growth in Iran, with the economy remaining almost stagnant.
Meanwhile, in larger non-hydrocarbon-dependent economies, Egypt will see stronger but still weak growth in 2014 (3.2 percent) but will grow significantly more in 2015 at 4.9 percent (compared to 2.1 percent in 2013). Similarly, the Israeli economy will record relatively weak growth in 2014 (2.8 percent) despite the development of the new gas sector, but will rebound in 2015 to 3.7 percent. Meanwhile, the importance of the agriculture sector is reflected in the volatile growth in Morocco: 4.7 percent in 2013, 3.2 percent in 2014, and 3.8 percent in 2015.
RecommendationsnNote that opportunities related to the construction
sector and upstream/downstream hydrocarbon sectors will be available in oil-rich countries as they boost their infrastructure and production capacities
nClosely monitor political developments in all countries—particularly in Algeria, Bahrain, Egypt, Iran, Iraq, Jordan, Lebanon, Libya, Syria, and Yemen—as these will impact business risk
nClosely monitor negotiations between Iran and the international community over the nuclear issue; a resolution would open the Iranian economy to significant opportunities, particularly in the upstream/downstream hydrocarbon sectors
Headline Regional Issues nGovernment spending of hydrocarbon export revenues
is the growth driver across the region
nAverage annual oil prices will be slightly stronger in 2014 ($113.5 billion) and 2015 ($117.8 billion) than in 2013 ($109.2 billion), although spot prices will be volatile
nSecurity issues related to the Arab Spring and difficulties in Europe will continue to impact negatively on growth across the region
nThe ongoing civil war in Syria is increasingly spilling over into neighboring countries, raising concerns about widespread regional instability
nThe risk of military strikes against Iran’s nuclear sector has receded in the short term
Trend: Deteriorating
Regional Insight: Middle East and North Africa

14
Regional Outlook
Sub-Saharan Africa starts the year on solid footing as one of the best-placed regions to benefit from the pickup in global growth. Domestic demand, which provided a solid growth engine and absorbed much of the drag from the global recession, will remain important. A fast-growing population is fuelling strong consumption spending, while aggressive investment in infrastructure-building is the main factor behind the steady contribution from government spending. FDI and portfolio investment flows are also strong and will remain a support, especially in industries linked to resource extraction.
As headwinds to global growth diminish in 2014, a revival in export markets will join the above-mentioned drivers to boost regional growth. Commodity exporters will perform better than others, as in previous years. Resource-based economies have done little in recent years to diversify their sources of growth. However, the ongoing structural transformation of the Chinese economy from a heavy industry-led growth model to
a consumer demand-driven growth model could finally force these countries to rethink their overdependence on commodity exports. At the same time, this could create new industries in sub-Saharan Africa and foster much-needed diversification.
While average growth for the region will be solid, the outlook varies significantly from country to country. The South African economy, the largest in the region, will continue to expand at a sluggish, subpar pace over the near term. Growth in 2013 is expected to be below 2 percent, slowly rising to 2.8 percent in 2014. External demand for the country’s exports will remain weak, as a strong recovery has yet to begin in the euro zone. On the other hand, domestic demand has faltered lately with lower consumer confidence in the recovery, providing less support in the next few months.
Nigeria remains on track to post near-7 percent growth for 2013. Latest estimates show that real GDP expanded 6.8 percent year-over-year in Q3, compared to the 6.2 percent pace set in Q2. As in the past few quarters, weakness in the key energy extraction sector was offset by the strength of the non-oil sector, particularly robust agriculture. Kenya’s economy continues to expand at a stable pace, underlining our estimate of 5 percent growth in 2013. The government plans to take advantage of favorable investor interest by issuing its first Eurobond in early 2014. One of the best performers of East Africa over the last decade, Ethiopia’s country risk profile remains stable and we estimate growth in calendar 2013 of 7.5 percent (compared with 7 percent in 2012).
RecommendationsnCompanies in mining should be aware that they are at
high risk of being targeted by militias
nInvestors should beware of forced contract renewals as governments attempt to maximize returns and as resource nationalism rises
nWe recommend stricter trade terms for local counterparties
nMonitor FX liquidity in countries with balance-of-payments difficulties and weak currencies
nCompanies are advised to take out adequate security and political risk insurance coverage
Headline Regional Issues nSub-Saharan Africa’s growth is set to pick up modestly in
2014 thanks to healthy domestic demand and improving export demand as the global economy recovers
nThe ongoing structural shift in China’s economy could reduce demand for resources over the medium term...
n...but could also create new opportunities for favorable diversi-fication
nThe withdrawal of monetary stimulus by the U.S. Fed will expose many regional economies to increased volatility in the near term. Central banks will need to intervene frequently to support FX reserves
nRegional inflation remains on a downward trend and does not pose a significant risk to growth
Trend: Stable
Regional Insight: Sub-Saharan Africa

Dun & Bradstreet (D&B) 103 JFK Parkway Short Hills, NJ 07078
www.dnb.com
© Dun & Bradstreet, Inc. 2014. All rights reserved. (DB-3730 1/14)
For more information, visit our website at www.dnb.com, or contact our Customer Service Center at 1.800.234.3867. If you are interested in our Country Insight solutions, email us at [email protected].
For up-to-date economic reports and perspectives from D&B’s Global Data, Insights & Analytics team, follow us on Twitter @DnBEconomy.
About Dun & Bradstreet® (D&B)Dun & Bradstreet (NYSE:DNB) is the world’s leading source of commercial information and insight on businesses, enabling companies to Decide with Confidence® for 172 years. D&B’s global commercial database contains more than 230 million business records. The database is enhanced by D&B’s proprietary DUNSRight® Quality Process, which provides our customers with quality business information. This quality information is the foundation of our global solutions that customers rely on to make critical business decisions.
D&B provides two solution sets that meet a diverse set of customer needs globally. Customers use D&B Risk Management Solutions™ to mitigate credit and supplier risk, increase cash flow and drive increased profitability; and D&B Sales & Marketing Solutions™ to provide data management capabilities that provide effective and cost efficient marketing solutions and to convert prospects into clients by enabling business professionals to research companies, executives and industries.
For more information, please visit www.dnb.com.