dbs group research may 2020 china e-commerce platforms
TRANSCRIPT

DBS Group Research • May 2020
DBS Asian Insights86SECTOR BRIEFING
China E-Commerce Platforms Who Will Make Money in Lower-Tier Cities?

19
DBS Asian Insights SECTOR BRIEFING 8602
China E-Commerce PlatformsWho Will Make Money in Lower-Tier Cities?
Produced by:
Asian Insights Office • DBS Group Research
go.dbs.com/research
@dbsinsights
Geraldine Tan EditorMartin Tacchi Art Director
Susanna CHUI [email protected]
Tsz-Wang [email protected]

19
DBS Asian Insights SECTOR BRIEFING 86
03
04
05
09
23
29
35
51
11
Executive Summary
E-commerce’s Share of China’s Retail Pie to Grow
Understanding Different Tiered Cities’ e-Commerce Customers
Analysing e-Commerce Platforms’ 4P Marketing Mix in Lower-Tier CitiesWhy Do We Use 4P Marketing Mix?
E-commerce Platforms’ Market Share Change in Terms of GMVMarket Share in Next Three Years
E-commerce Platforms’ Monetisation RateMonetisation Rate in Next Three Years
E-commerce Business ProfitabilityE-commerce Business Profitability in Next Three Years
Appendix

We expect China’s e-commerce retail GMV to deliver 26% CAGR during 2019-2021F, accounting for 35% of China’s retail sales in 2021F from 25% in 2019. To ride on this growth, China’s e-commerce platforms are raising e-commerce penetration rate in lower-tier cities with low online penetration. There are currently three dominant players in this space, namely Alibaba, JD and Pinduoduo. We spoke to industry experts and used the 4P marketing mix to assess how they will fare in the next three years.
E-commerce platforms that can secure users with demand for high-traffic necessities in lower-tier cities will gain market share in terms of GMV. Price advantage is most important for high-traffic necessities in lower-tier cities, which is Pinduoduo’s advantage.
Pinduoduo is a rising star in our eyes, with GMV share to increase from 10% in 2019 to 16% in 2021. We expect Alibaba to be a dominant player, with GMV share to remain relatively steady at 64% by 2021 from 66% in 2019, given its user advantage. Meanwhile, JD’s logistics advantage is less important for high-traffic necessities in lower-tier cities. Hence, we expect JD to lose ground, with GMV share to drop from 21% in 2019 to 19% in 2021.
E-commerce platforms that can raise GMV portion of high-profitability apparel products could increase monetisation rate. Promotion advantage is most important for apparel, which is an advantage enjoyed by Alibaba and Pinduoduo. We expect Alibaba’s and Pinduoduo’s monetisation rate to increase from 3.6% and 3.0% in 2019 to 3.8% and 3.5% in 2021F. Meanwhile, logistics, which is JD’s advantage, is less important for apparel. JD’s monetisation rate is expected to decline from 4.5% in 2019 to 4.0% in 2021F.
E-commerce platforms that can lift monetisation rate led by increasing high-profitability apparel GMV proportion could be profitable in lower-tier cities. We expect Alibaba’s and Pinduoduo’s non-GAAP net margin to rise from 78.7% and -14.6% in 2019 to 81.4% and 14.1% in 2021F, on increasing monetisation rate from increasing apparel GMV proportion. JD’s is projected to decline from 2.5% in 2019 to 1.8% in 2021F, with decreasing monetisation rate and decreasing apparel GMV proportion.
Executive SummaryChina’s e-commerce retail GMV to deliver
26% CAGR during 2019-2021F
Key to securing users in lower-tier cities
Pinduoduo is a rising star; JD set to lose
ground
Increase monetisation rate by raising GMV
portion of high-profitability apparel
products
E-commerce platforms could be profitable in
lower-tier cities
DBS Asian Insights SECTOR BRIEFING 8604

E-commerce’s Share of China’s Retail Pie to Grow
China’s e-commerce retail GMV to expand at 26% CAGR during
2019-2021F
DBS Asian Insights SECTOR BRIEFING 86
05
We expect China’s e-commerce retail gross merchandise volume (GMV) to deliver 26% CAGR during 2019-2021F, accounting for 35% of China’s retail sales in 2021F from 25% in 2019.
China’s e-commerce retail GMV as percentage of total retail sales grew from 9% in 2014 to 21% in 2018, which is high relative to key developed countries. Therefore, China’s e-commerce platforms are raising e-commerce penetration rate in (1) product categories with low online penetration and (2) lower-tier cities.
China’s e-commerce retail GMV
Global retail e-commerce penetration (2018)
Source: National Bureau of Statistics of China, DBS HK
Source: National Bureau of Statistics of China, eMarketer, DBS HK
6,200 8,000 10,165 12,413 16,221
30,426 30,09931,000 30,975
29,98716.9%21.0%
24.7%28.6%
35.1%
-15%
-5%
5%
15%
25%
35%
45%
05,000
10,00015,00020,00025,00030,00035,00040,00045,000
2017 2018 2019F 2020F 2021F
Rmb bn
Offline retail GMV (LHS)E-commerce retail GMV (LHS)E-commerce as % of China's retail sales (RHS)
21.0% 20.6%
17.5%
9.8%
7.3%
0%
5%
10%
15%
20%
25%
China UK SouthKorea
US Australia

Raising e-commerce penetration rate in
product categories with low online penetration
Raising e-commerce penetration rate of
lower-tier cities
Higher tier cities Lower-tier cities
City-tier classification
Tier 1 Tier 2 Tier 3 Tier 4
GDP >US$300bn US$68-299bn US$18-67bn <US$17bn
Political administration of the city
Directly controlled municipalities and leading provincial
capital cities
Directly controlled municipalities, provincial
capital cities, and economically important cities
Provincial capital cities and prefecture-level
cities
Prefecture-level cities and county-
level cities
Population >15m 3-15m 0.15-3m <0.15m
Number of cities
4 30 138 480
Lower-tier cities will deliver 34% CAGR
during 2019-2021F, accounting for 43% of
China’s e-commerce retail GMV in 2021F.
DBS Asian Insights SECTOR BRIEFING 8606
As a percentage of retail sales, computer, communication & consumer electronics (3C) products, and apparel & shoes, recorded high online shopping penetration rates of 32-45% in 2018. But homewares and home furnishings, and food & drinks have low online penetration rates of 10-11% due to perishability, logistics and involvement issues.
To bridge this, China’s e-commerce platforms have launched new retail initiatives which takes the best of both online and offline worlds to address perishability, logistics and involvement issues, to help product categories with low online penetration to go online. (For details, please refer to Asian Insights SparX: China Internet Sector: Who will be the winners in new retail?)
Another key driver is growth from lower-tier cities, which will deliver 34% CAGR during 2019-2021F, accounting for 43% of China’s e-commerce retail GMV in 2021F from 38% in 2019. This is driven by (a) rising online penetration and (b) rising consumption power.
Online penetration of key product categories in China (2018)
China’s city-tier classification by GDP, political administration, and population
Source: Euromonitor, DBS HK
Source: DBS HK
44.8%38.3%
31.8%27.4%
22.2%
11.1% 10.2%
0%
10%
20%
30%
40%
50%
Cons
umer
ele
ctro
nics
Cons
umer
App
lianc
es
Appa
rel &
Foot
wea
r
Beau
ty &
per
sona
l car
e
Cons
umer
Hea
lth
Food
& d
rinks
Hom
ewar
es a
nd H
ome
Furn
ishin
gs
Low online penetration

Rural online penetration rate was 38% in 2018, versus urban’s 75%, according to China Internet Network Information Center (CNNIC). This was because some of the rural population do not own or use PCs/smartphones.
The gap has widened from 32% in 2013 to 36% in 2016 but stabilised since 2016. This was because mobile phone makers Oppo and Vivo, which focus on tier 3 or below cities, have become popular since 2016. Their low-end smartphones with average selling price (ASP) of c.Rmb1,000 are affordable to the rural population. Their offline franchise stores can reach non-online rural population and provide face-to-face instruction on how to use smartphones.
There is a discrepancy between consumption in tier 1-2 cities and tier 3 or below cities. According to QuestMobile, tier 3 or below cities accounted for 55% of the total mobile Internet users in 2018, but they made up only 36% of China’s e-commerce retail GMV.
Rising online penetration
Rising consumption power
DBS Asian Insights SECTOR BRIEFING 86
07
Tier 1-2 cities and Tier 3 or below cities’ mobile Internet users and e-commerce retail GMV (2018)
China’s e-commerce retail GMV breakdown China’s online penetration
Source: iResearch, National Bureau of Statistics of China, DBS HK
Source: National Bureau of Statistics of China, DBS HK Source: CNNIC, DBS HK
45.3%64.1%
54.7%35.9%
0%
20%
40%
60%
80%
100%
Mobile Internet users E-commerce retail GMVTier 1-2 cit ies Tier 3 or above cit ies
4,174 5,126 6,291 7,208 8,8432,0262,874
3,8744,839
6,569
02,0004,0006,0008,000
10,00012,00014,00016,00018,000
2017 2018 2019F 2020F 2021F
Rmb bn
Tier 1-2 cit ies Tier 3 or below cities
60.3% 62.8% 65.8% 69.1% 71.0%74.6%
28.1% 28.8% 31.6% 33.1% 35.4% 38.4%
0%
10%
20%
30%
40%
50%
60%
70%
80%
2013 2014 2015 2016 2017 2018Urban area Rural area
4,174 5,126 6,291 7,208 8,8432,0262,874
3,8744,839
6,569
02,0004,0006,0008,000
10,00012,00014,00016,00018,000
2017 2018 2019F 2020F 2021F
Rmb bn
Tier 1-2 cit ies Tier 3 or below cities

This can be attributed to lower per capita disposable income in lower-tier cities. According to National Bureau of Statistics of China, per capita disposable income in rural areas was Rmb14,617 in 2018, which was 37% of urban’s Rmb39,251. However, the gap has been narrowing, with per capita disposable income in rural areas expanding by 9% CAGR during 2013-2018, versus urban’s CAGR of 8%. The per capita disposable income growth in rural areas is outpacing urban’s, which can translate to rising consumption power in lower-tier cities.
Consumption power in lower-tier cities set
to rise as per capita disposable income
grows in rural areas.
DBS Asian Insights SECTOR BRIEFING 8608
China’s per capita disposable income
Source: National Bureau of Statistics of China, DBS HK
31,19533,616
36,39639,251
42,359
11,422 12,363 13,432 14,617 16,021
0
5,000
10,000
15,000
20,000
25,000
30,000
35,000
40,000
45,000
2015 2016 2017 2018 2019
Rmb
Urban area Rural area

End customersPrice sensitivity of end customers in lower-tier cities is higher, with their lower income level. They are less aware of brands and demand is usually towards more targeted recommendations, compared to higher-tier cities.
Logistics service providersKey logistics service providers are similar in lower- and higher-tier cities, and include (i) express logistics platforms, (ii) warehouse service providers, and (iii) express delivery service providers. There are concerns that logistics costs will increase due to lower order density and higher last-mile delivery cost in sparsely populated lower-tier cities. However, logistics service providers have expressed that logistics cost per order in lower-tier cities is close to that in higher-tier cities.
Understanding Different Tiered Cities’ e-Commerce Customers
Higher-tier cities Lower-tier cities
Warehouse costs
Warehouse costs are mostly due to rental. Rental cost per sqm is 30%+ cheaper in lower-tier cities versus higher-tier cities.
(c.50% of total logistics cost)
Higher warehouse costs Lower warehouse costs
Delivery costs
(50% of total logistics cost)
Delivery cost is mostly labour cost. Despite per capita disposable income in rural areas being c.60% lower than urban areas, labour cost per order will be higher in lower-tier cities versus higher-tier cities due to lower order density and higher last-mile delivery cost. Population density is c.5-200 people per
square kilometre in lower-tier cities versus c.200-4,000 per square kilometre in higher-tier cities. At the same time, purchase frequency in lower-tier cities is around 30% below that of higher-tier cities.
However, pick-up and drop-off points for parcel delivery could be concentrated at one point and hence, lower last-mile delivery costs in sparsely populated lower-tier cities.
Lower delivery cost Higher delivery cost
Total logistics cost
Similar total logistics cost Similar total logistics cost
DBS Asian Insights SECTOR BRIEFING 86
09
Logistics costs in lower-tier cities versus higher-tier cities
Source: DBS HK

MerchantsMerchants targeting lower-tier cities are those selling unbranded products at lower prices and focusing on a few stock-keeping units (SKUs). Meanwhile, merchants targeting higher-tier cities are inclined toward branded products involving numerous SKUs.
Value chain for e-commerce platforms
DBS Asian Insights SECTOR BRIEFING 8610
Source: DBS HK
Merchants Pickup outlets
Regional sorting hubs
Regional sorting hubs
Delivery outlets
End customers
Firstmile
Shorthaul
Shorthaul
Linehaul
Lastmile
(2) Logistics service providers

Analysing e-commerce platforms’ 4P marketing mix in lower-tier cities
Analysing e-Commerce Platforms’ 4P Marketing Mix in Lower-Tier Cities
We interviewed industry experts and analysed e-commerce platforms’ 4P marketing mix in fast growing lower-tier cities. 4P refers to: (1) products, (2) price, (3) place, and (4) promotions. We compared the importance of these four factors in lower-tier cities versus higher-tier cities, and e-commerce platforms’ strengths and weaknesses in respect of these four factors.
In the following sections, we did an analysis to determine e-commerce platforms’ (a) market share in terms of GMV, given the different competitive landscape between lower- and higher-tier cities; (b) monetisation rate; (c) e-commerce business profitability in the next three years.
&"'()*+,
-
(1) Compare importance of 4P marketing mix in lower tier cities
Products Price Place Promotion
(a) GMV (b) Monetisation (c) Profitability
(2) Compare e-commerce platforms' strengths and weaknesses
(3) Analysis of e -commerce platforms' GMV share, monetisation, and profitability for next three years
Products Price Place Promotion
DBS Asian Insights SECTOR BRIEFING 86
11
Source: DBS HK

Sales of key product categories in China (2018)
Source: Euromonitor, DBS HK
Why Do We Use 4P Marketing Mix?
Jack Ma, founder of China’s largest e-commerce platform Alibaba, emphasised that there is no market that is the same, e.g. New York and Chicago are different. But e-commerce business is the same as it focuses on the customer. This is the reason why the 4P framework is one of the most commonly used frameworks for analysing marketing strategies (products, price, place and promotion centred around the customer) in targeted lower-tier cities.
1. ProductsProducts means “what are the products”. E-commerce platforms’ product strategies are important to gain market share in terms of GMV, monetisation rate, and profitability in both higher- and lower-tier cities. We analyse the three largest product categories in China’s retail sales market: (i) necessities, (ii) apparel, and (iii) computer, communication & consumer electronics products (3C products). Product categories can be classified into two dimensions, namely traffic and profitability.
(i) Necessities. Necessities (i.e. food and fast-moving consumer goods or FMCG) are high traffic products with purchase frequency estimated at 52 times per user per year, but with mid-level profitability and monetisation rate of 3-4%.
(ii) Apparel. Apparel are high profitability items with estimated monetisation rate of 4-8% but are mid traffic products with purchase frequency of 12 times per user per year.
(iii) 3C products. These products are low traffic with estimated purchase frequency at 1 time per user per year, and low profitability with monetisation rate of 1-3%.
DBS Asian Insights SECTOR BRIEFING 8612
2,1261,906
1,594
712351 220
0
500
1,000
1,500
2,000
2,500
Appa
rel &
Foot
wea
r
Food
& d
rinks
Com
pute
r,Co
mm
unica
tion
and
Cons
umer
Ele
ctro
nic
Hom
ewar
es a
ndHo
me
Furn
ishin
gs
Beau
ty &
pers
onal
care
Cons
umer
Heal
th
Rmb bn

Key product categories’ purchase frequency and revenue
Source: DBS HK
Source: DBS HK
As such, industry experts expect e-commerce platforms to focus on high-traffic necessities (i.e. food and FMCG) first to gain users and lock in user stickiness from lower-tier cities, before introducing high-profitability apparel to monetise users.
The other marketing mix parameters help to determine the success of e-commerce platforms in these product categories.
2. PricePrice means “at what price to sell various products”. Price advantage is important in lower-tier cities as price sensitivity is high, given the lower income level. On the top of these factors, price strategies are more important for necessities, compared to apparel and 3C products. Price sensitivity is high for necessities due to its nature of frequent purchases.
Comparison of e-commerce platforms:
(i) Price difference between products with different positioning. Pinduoduo focuses on unbranded products with lower prices, as demonstrated by its portfolio made up of only 100 brands. Meanwhile, JD and Alibaba are inclined towards branded products with price premium, as they have around 0.2m brands each on their platforms.
"Necessities (i.e. food and FMCG)"
Apparel 3C products
Retail sales (Rmb m) 1,905,799 2,125,552 1,593,792
Online penetration Low (11.1%) High (31.8%) High (42.1%)
Online retail sales (Rmb m) 211,544 675,925 671,514
Purchase frequency (times / year) 52 12 1
Ticket size 40 200 1,000
GMV/user/year 2,080 2,400 1,000
Advertising budget as of paying merchants' GMV
10-15% 15-30% 5-10%
Paying ratio 25%+ 25%+ 25%+
Monetisation rate 3-4% 4-8% 1-3%
Revenue/user/year (lower range) 62 360 50
Revenue/user/year (upper range) 83 720 100
Usage High traffic and mid profitability
High profitability and mid traffic
Low profitability and low traffic
DBS Asian Insights SECTOR BRIEFING 86
13

E-commerce platforms’ sales and marketing expenses as % of GMV (2019)
Source: Company, DBS HK
(ii) Price difference between the same SKU. We discovered that for the same SKUs, Pinduoduo’s products are priced at discounts of 1-15% to Alibaba and JD based on sample checks to compare prices of major product categories across e-commerce platforms.
The market may attribute the lower price to higher subsidies (i.e. coupons). Pinduoduo’s sales and marketing expenses as a percentage of GMV was relatively high at 3% in 2019, versus 1% for Alibaba and JD. However, even we assume all sales and marketing expenses are related to coupons, we consider the subsidy to be small versus product price discounts of 1-15%.
We attributed the lower price to Pinduoduo’s differentiated recommendation feed-based business model, which focuses on recommending top-selling SKUs to targeted users to gain better economies of scale. While Alibaba ‘s and JD’s search-based business model offers numerous SKUs through users’ searches. Therefore, Pinduoduo has a price advantage in lower-tier cities, especially for high-traffic necessities with high price sensitivity.
Alibaba and JD introduced recommendation feeds in 2018 and 2019 respectively, but industry experts believe they are not able to completely replicate Pinduoduo’s business model. This is because Pinduoduo has a narrower SKU selection, providing better economies of scale, while Alibaba has numerous SKUs, as indicated by its tie-ups with 10m merchants versus Pinduoduo’s 3.6m merchants and JD’s 0.2m.
0.7%
1.0%
2.6%
0.0%
0.5%
1.0%
1.5%
2.0%
2.5%
3.0%
Alibaba JD Pinduoduo
Alibaba and JD unlikely to be able to completely replicate
Pinduoduo’s business model
Price advantage is important in lower-tier
cities as price sensitivity is high, given the lower
income level.
DBS Asian Insights SECTOR BRIEFING 8614
Alibaba JD Pinduoduo

Price comparison across e-commerce platforms
Source: BP PLC, DBS Bank
Corou tissue paper – 120 sheets x 10 packs
HLA oxford Shirt (male) HSTYLE printing t-shirt (female)
iPhone 11
Alibaba Rmb69.8 Rmb98 Rmb38 Rmb5,499
JD Rmb69.8 Rmb98 N.A. Rmb5,499
Pinduoduo Rmb59.6 Rmb97 Rmb37.5 Rmb5,099
3. PlacePlace means “how do they sell their products” (i.e. via e-commerce platforms with high traffic, such as those with a large number of [i] customers and [ii] merchants) and “how do they deliver products?” (i.e. e-commerce platforms with strong [iii] logistic capabilities).
(i) Number of customers. The number of customers is important for all three product categories (necessities, apparel, 3C products) in both higher- and lower-tier cities.
Comparison of e-commerce platforms: Alibaba is the clear leader in terms of annual active customers in both higher- (340m in 2019) and lower-tier (336m) cities. JD (190m) and Pinduoduo (236m) are neck and neck in higher-tier cities, but Pinduoduo (276m) has substantially more than JD (142m) in lower-tier cities.
DBS Asian Insights SECTOR BRIEFING 86
15

(ii) Number of merchants. The number of merchants is less important in lower-tier cities, versus higher-tier cities. E-commerce platforms tend to focus on recommending top-selling SKUs from a smaller merchant base to users in lower-tier cities, versus offering numerous SKUs from a larger number of merchants to users in higher-tier cities via searches.
Comparison of e-commerce platforms: Alibaba and Pinduoduo are leading in number of merchants with c.10m and c.3.6m merchants as of 2019, while JD has only c.0.2m.
(iii) Logistics capabilities. E-commerce platform’s logistics capabilities are less important in lower-tier cities, versus higher-tier cities. This is because (a) user demand in lower-tier cities for timely delivery is less; (b) necessity goods and apparel merchants targeting lower-tier cities are usually small and focus only on a few SKUs, while merchants targeting higher-tier cities need to
China’s e-commerce platforms – Annual active customers (m, 2019)
China’s e-commerce platforms – Number of merchants (2019)
Source: Jiguang Big Data, DBS HK
Source: Company, DBS HK
340190 236
336
142
276
0
100
200
300
400
500
600
700
800
Alibaba JD Pinduoduo
Tier 1 and 2 cities Tier 3 or below cities
10
0.2
3.6
0
2
4
6
8
10
12
Alibaba JD Pinduoduo
(m)
Alibaba JD Pinduoduo
DBS Asian Insights SECTOR BRIEFING 8616
Alibaba JD Pinduoduo

Logistics requirements are less in lower-tier cities for key product categories
Source: DBS HK
handle logistics involving numerous SKUs; (c) logistics services in lower-tier cities for unbranded 3C products do not require serial number management. The 3C merchants targeting higher-tier cities need to handle logistics services involving serial number management, in order to ensure that products are delivered to the correct warehouses and customers.
Comparison of e-commerce platforms: There are three ways for e-commerce platforms to set up their logistics systems: (a) building their own logistics network (i.e. JD); (b) creating a third-party logistic platform which connects third-party logistic service providers (i.e. warehouse service providers, express delivery service providers) with real-time logistic data sharing (i.e. Alibaba, Pinduoduo); and (c) employing third-party express delivery service providers.
JD, which has set up its own logistics network, could have significantly better inventory and sales forecasts with real-time logistic data, enabling it to optimise its self-built logistics network using a higher level of logistics technology and automation. As such, JD should be able to offer better fulfilment (i.e. high on-time rate, low error rate, and low damage rate) to differentiate itself from other e-commerce platforms.
Alibaba’s Cainiao Logistics, a third-party logistics platform, has strategically invested in integrated logistics services providers (i.e. warehouses and express delivery) such as BEST (百世), and express delivery partners such as ZTO (中通), YTO (圓通), and STO (申通), which are China’s three largest express delivery service providers. Third-party logistics platforms may help to enhance real-time logistics data sharing between Alibaba’s Cainiao Logistics and its logistic partners to improve fulfilment efficiency, but would not be able to optimise the latter’s logistics network at their discretion like a self-built logistics network.
Pinduoduo had employed third-party express delivery service providers until 1Q19. It found that it was unable to obtain real-time logistics data from third-party express delivery service providers to share with its clients and improve fulfilment efficiency. To tackle this, Pinduoduo set up a third-party logistics platform like Alibaba in 1Q19, with seven logistics partners including BEST, ZTO, YTO, STO, Yunda, SF, and EMS. But Pinduoduo’s network is different from Alibaba’s
Food and drinks Apparel 3C products
Higher-tier cities
Lower-tier cities Higher-tier cities
Lower-tier cities Higher-tier cities
Lower-tier cities
Timely delivery ***** *** ***** *** ***** ***
SKU management
***** * *** * * *
Serial number management
* * * ***** ***
DBS Asian Insights SECTOR BRIEFING 86
17

as it does not plan to invest in warehouses and express delivery service providers. However, industry experts expressed that collaboration between Pinduoduo and its logistic partners may be weak without investments made in their logistic partners, versus that between Alibaba and its strategic investments in logistics partners.
In conclusion, as e-commerce platforms’ logistics capabilities are less important in lower-tier cities versus higher-tier cities, JD’s logistics advantage over Alibaba and Pinduoduo is diminishing in lower-tier cities.
E-commerce platforms’ logistics capabilities are less important in lower-tier cities versus higher-
tier cities.
Three ways for e-commerce platforms to build their logistics systems
Source: Company, DBS HK
Self-built logistic network Third-party logistic platform Third-party logistic providers
Representatives JD Alibaba, Pinduoduo Other smaller e-commerce platforms
Advantages Self-built logistic networks could have significantly better inventory & sales forecasts with real-time logistic data.
Self-built logistics network can be optimised using human-less logistics technology. Offer better fulfilment (i.e. high on-time rate, low error rate, and low damage rate).
Light asset model. Third-party logistics platforms able to enhance real-time logistic data sharing between Alibaba’s Cainiao Logistics and its logistic partners to improve fulfilment efficiency.
Light asset model.
Disadvantages Heavy asset model Third-party logistics platforms may not be able to optimise their logistic partners’ logistics network at their discretion unlike having a self-built logistics network. Collaboration between third-party logistics platforms and their logistic partners may be weak without making investments in their logistic partners.
E-commerce platforms cannot have real-time logistic data from third-party express delivery service providers to share with clients and improve fulfilment efficiency.
DBS Asian Insights SECTOR BRIEFING 8618

Promotion is more important for apparel,
compared to necessities and 3C products.
4. PromotionPromotion means “how they promote products”. Promotion through user data analytics capabilities for product recommendations is more important in lower-tier cities, as users are less aware of brands and targeted recommendations could drive demand.
On the top of these, promotion is more important for apparel, compared to necessities and 3C products. Apparel are unstandardized and fragmented with the top 10 brands garnering a 10% market share. Accurate targeted recommendations could help users to decide what they want to buy among the various fragmented brands and numerous apparel SKUs, and thus increase customers’ purchase probability.
Despite fragmentation being high in the necessity goods market with the top 10 brands garnering 14% of the market, most customers are indifferent to brands for necessities. It is thus easier for users to decide what to buy in terms of necessities. For 3C products, the market is concentrated with the top 10 consumer electronics/consumer appliance brands having 74%/53% market share. Buying 3C products is less difficult given the narrower selection of brands and SKUs.
Comparison of e-commerce platforms:We analyse e-commerce platforms’ user data analytics capabilities in three dimensions: (i) data history, (ii) data variety, and (iii) network data.
(i) Data volume. Alibaba and JD, which were established in 2003 and 2004 respectively, are leading in this area, while Pinduoduo was established only in 2015. However, according to industry experts, Pinduoduo’s annual number of orders per buyer was 49x in 2019 versus Alibaba’s 50x and JD’s 16x, and the sample size is enough to obtain sufficient statistical power.
Market share of top 10 brands (2018)
Source: Euromonitor, DBS HK
9.6%14.4%
74.0%
52.8%
0%
10%
20%
30%
40%
50%
60%
70%
80%
Apparel Food anddrinks
Consumerelectronics
Consumerappliances
DBS Asian Insights SECTOR BRIEFING 86
19

(ii) Data variety. Alibaba, which is an Internet conglomerate, has a variety of data sources from its wide ecosystem of e-commerce, new retail, services e-commerce, logistics, payment, cloud computing, and digital media & entertainment, etc. Meanwhile, JD and Pinduoduo, which focus on e-commerce businesses, mainly have consumption data on their e-commerce platforms.
(iii) Network data. Pinduoduo has interactive consumption data of users and their family and friends, while Alibaba and JD only have consumption data of individual users. This is because Pinduoduo’s users tend to invite their family and friends to make a “team purchase” on WeChat (China’s largest social e-commerce platform), which further improves the accuracy of targeted recommendations and promotions. Alibaba and JD introduced “team purchase” in 2019, but industry experts believe they are not able to completely replicate Pinduoduo’s business model. This is because the success of Pinduoduo’s “team purchase” is attributed to the support of Tencent, which is its second-largest shareholder with a 16.9% stake. Alibaba and JD are unable to replicate this. Alibaba’s users are not able to share Alibaba’s links on Tencent’s WeChat. Meanwhile, JD has Tencent’s support as its largest shareholder with a 17.8% stake. However, JD‘s low traffic and 3C product focus fail to match traffic in lower-tier cities despite sharing the “team purchase” link on WeChat.
The market believes Alibaba is invincible in user data analytics capabilities with its wide data variety from its extensive ecosystem. However, industry experts have expressed that Pinduoduo could narrow the gap with Alibaba, with its network data (i.e. interactive consumption data) from its “team purchase” business model.
E-commerce platforms’ user data analytics capabilities
Source: DBS HK
Alibaba JD Pinduoduo
Data volume Established in 2003 Annual number of orders per buyer: 50
Established in 2004 Annual number of orders per buyer: 16
Established in 2015 Annual number of orders per buyer: 49
***** ***** ***
Data variety A variety of data from its wide ecosystem of e-commerce, new retail, services e-commerce, logistics, payment, cloud computing, and digital media & entertainment, etc.
Mainly consumption data on its e-commerce platforms
Mainly consumption data on its e-commerce platforms
***** * *
Network data Individual consumption data Individual consumption data Individual consumption data + interaction consumption data between users and their family and friends
* * *****
DBS Asian Insights SECTOR BRIEFING 8620

Comparing importance of 4P marketing mix in lower-tier cities versus higher-tier cities
Source: DBS HK
4P marketing mix Importance in lower-tier cities versus higher-tier cities
Product E-commerce platforms’ product strategies are important for market share in terms of GMV, monetisation rate and profitability in both higher- and lower-tier cities.
Price Price advantage is important in lower-tier cities, as price sensitivity is high. On the top of these, price sensitivity is high for necessities, as these products are frequently purchased.
Place (i) Number of customers. The number of customers is important for these three categories in both higher- and lower-tier cities. (ii) Number of merchants. E-commerce platforms focusing on recommending top-selling SKUs from a concentrated base of merchants to users in lower-tier cities, versus offering numerous SKUs from numerous merchants through users’ search in higher-tier cities. (iii) Logistics capabilities. Logistics capabilities are less important for 3C, necessities, and apparel products in lower-tier cities. There is more demand for unbranded 3C products in lower-tier cities, and this does not require serial number management services. Necessity and apparel merchants targeting lower-tier cities are small and focus on a few SKUs, which does not require SKU management services.
Promotion Promotion (i.e. user data analytics capabilities for product recommendations) is more important in lower-tier cities, as users are less aware of brands and demand for targeted recommendations. On top of this, promotion is more important for apparel, due to market fragmentation, compared to necessities and 3C products.
DBS Asian Insights SECTOR BRIEFING 86
21

E-commerce platforms’ strengths and weaknesses in 4P marketing mix in lower-tier cities:
Alibaba JD Pinduoduo
Product Alibaba’s user advantage is important for high-traffic necessities in lower-tier cities Promotion advantage is most important for apparel, a high profitability product
JD’s logistics advantage is less important for high-traffic necessities and high-profitability apparel
Pinduoduo’s price advantage is important for high-traffic necessities in lower-tier cities Promotion advantage is most important for high-profitability apparel products
***** * *****
Price Alibaba‘s search-based business model - offering numerous SKUs through users’ searches - does not have economies of scale
JD’s search-based business models - offering numerous SKUs through users’ searches - does not have economies of scale
Pinduoduo’s differentiated recommendation feed-based business model focuses on recommending top-selling SKUs to targeted users, offering better economies of scale
* * *****
Place (i) Number of customers: 336m (ii) Number of merchants: 10m (iii) Logistics capabilities: Third-party logistic platform
(i) Number of customers: 142m (ii) Number of merchants: 0.2m (iii) Logistics capabilities: Self-built logistics network
(i) Number of customers: 276m (ii) Number of merchants: 3.6m (iii) Logistics capabilities: Third-party logistic platform
*** *** ***
Promotion A variety of data from its wide ecosystem of e-commerce, new retail, e-commerce services, logistics, payment, cloud computing, and digital media & entertainment, etc.
Mainly individual consumption data on its e-commerce platform
Individual consumption data + interaction consumption data between users and their family & friends
***** * ***
Source: DBS HK
DBS Asian Insights SECTOR BRIEFING 8622

Alibaba, JD and Pinduoduo accounted for 97% of market share in terms of GMV in 2019. Alibaba and JD are China’s largest and second-largest e-commerce platforms with 66% and 21% market share, respectively, in terms of GMV in 2019. Established in 2015, Pinduoduo is catching up as China’s third-largest e-commerce platform, with 10% market share in terms of GMV, while its number of annual active customers and merchants stood at 512m and c.4m merchants as of 2019, higher than JD’s 332m annual active customers, and c.0.2m merchants.
E-commerce Platforms’ Market Share Change in Terms of GMVPinduoduo catching up
with Alibaba and JD
Market share of China’s e-commerce platforms in terms of GMV (2019)
Annual active customers on China’s e-commerce platforms (2019)
Source: National Bureau of Statistics of China, DBS HK Source: Company, DBS HK
Alibaba66%
JD21%
Pinduoduo10%
Others3%
676
333
512
0
100
200
300
400
500
600
700
800
Alibaba JD Pinduoduo
(m)
Alibaba JD Pinduoduo
Pinduoduo
DBS Asian Insights SECTOR BRIEFING 86
23

Market Share in Next Three Years
We interviewed industry experts and analysed e-commerce platforms’ 4P marketing mix in lower-tier cities. We have done an analysis to determine the market share of various e-commerce platforms in terms of GMV in next three years, given the different competitive landscapes between lower- and higher-tier cities.
(1) Annual active customers. Based on analysing e-commerce platforms’ 4P marketing mix in lower-tier cities, we believe those that are able to gain users who purchase high-traffic necessities in lower-tier cities will be able to increase their market share in terms of GMV.
Price advantage is most important for high-traffic necessities in lower-tier cities, which is Pinduoduo’s advantage. Pinduoduo is a rising star, with fast growing annual active customer CAGR of 25% to 805m during 2019-2021F.
User advantage is also important for high-traffic necessities in lower-tier cities, and Alibaba has an advantage in this aspect. We expect Alibaba to be a dominant player, with annual active customer CAGR of 14% to 880m in 2019-2021F.
Meanwhile, logistics advantage is less important for high-traffic necessities in lower-tier cities. JD had an advantage in logistics. However, we expect JD to be losing ground, with annual active customer CAGR of 11% to 409m in 2019-2021F.
China’s e-commerce platforms – Number of merchants (2019)
Source: Company, DBS HK
10
0.2
3.6
0
2
4
6
8
10
12
Alibaba JD Pinduoduo
(m)
Alibaba JD Pinduoduo
DBS Asian Insights SECTOR BRIEFING 8624

Source: Jiguang Big Data, DBS HK
Source: Jiguang Big Data, DBS HK
Source: Jiguang Big Data, DBS HK
Alibaba - annual active customers
JD - annual active customers
Pinduoduo - annual active customers
236 319 346 373 399
245272
336405
481
0100200300400500600700800900
1,000
2017 2018 2019 2020 2021
m
Tier 1 and 2 cities Tier 3 or above cit ies
153 187 193 209 224
111120 140
161185
050
100150200250300350400450
2017 2018 2019 2020 2021
m
Tier 1 and 2 cities Tier 3 or below cities
51173 236 286 324
91
188
276373
481
0100200300400500600700800900
2017 2018 2019 2020 2021
m
Tier 1 and 2 cities Tier 3 or below cities
DBS Asian Insights SECTOR BRIEFING 86
25
153 187 193 209 224
111120 140
161185
050
100150200250300350400450
2017 2018 2019 2020 2021
m
Tier 1 and 2 cities Tier 3 or below cities

(2) Average annual spending per customer. We expect Pinduoduo’s average annual spending per buyer in lower-tier cities to deliver 2019-2021F CAGR of 27%, driven by a narrowing purchase frequency gap between low- and high-tier cities, with its price advantage in necessities and promotion advantage in apparel.
We expect Alibaba’s purchase frequency gap between low- and high-tier cities to narrow as well, with its user advantage in necessities and promotion advantage in apparel. However, we expect Alibaba to deliver a relatively moderate rise in average annual spending per buyer of 9% CAGR in 2019-2021F, as increasing purchase frequency will be partly offset by low ticket sizes in lower-tier cities.
Source: Company, DBS HK
Source: Jiguang Big Data, DBS HK
Pinduoduo - Average annual spending per customer
Alibaba - Average annual spending per customer
1,5321,813
2,743
3,410
4,364
687 8421,336
1,746
2,361991
1,308
1,9672,468
3,167
0500
1,0001,5002,0002,5003,0003,5004,0004,5005,000
2017 2018 2019 2020 2021
Rmb
Tier 1 and 2 cities Tier 3 or below citiesOverall
13,22612,368
13,427 13,887
15,825
5,927 5,7436,503 7,030
8,418
9,503 9,3209,989 10,302
11,774
4,000
6,000
8,000
10,000
12,000
14,000
16,000
18,000
2017 2018 2019 2020 2021
Rmb
Tier 1 and 2 cities Tier 3 or below citiesOverall
DBS Asian Insights SECTOR BRIEFING 8626

We expect JD’s purchase frequency gap between low- and high-tier cities to narrow but at a moderate rate, as its logistics advantage is less important for necessities and apparel in lower-tier cities. We expect JD to deliver relatively moderate rise in average annual spending per buyer of 11% CAGR in 2019-2021F.
(3) GMV. Driven by growth in annual active customers and average annual spending per buyer, we expect Pinduoduo’s GMV to expand by 58% CAGR in 2019-2021F. Meanwhile, due to moderate growth of annual active customers and average annual spending per buyer, we expect Alibaba’s and JD’s GMV to moderately increase by 24% and 23% CAGR in 2019-2021F.
Source: Jiguang Big Data, DBS HK
Source: National Bureau of Statistics of China, DBS
JD - Average annual spending per customer
Alibaba - GMV
6,3976,915
8,0438,481
9,586
2,867 3,2113,820 4,120
4,800
4,9145,470
6,270 6,5797,422
2,000
3,000
4,000
5,000
6,000
7,000
8,000
9,000
10,000
2017 2018 2019 2020 2021
Rmb
Tier 1 and 2 cities Tier 3 or below citiesOverall
3,116 3,949 4,568 5,1356,309
1,4531,562
2,1822,849
4,051
0
2,000
4,000
6,000
8,000
10,000
12,000
2017 2018 2019F 2020F 2021F
Rmb bn
Tier 1 and 2 cities Tier 3 or below cities
DBS Asian Insights SECTOR BRIEFING 86
27

Source: National Bureau of Statistics of China, DBS
Source: National Bureau of Statistics of China, DBS
Source: National Bureau of Statistics of China, DBS
JD - GMV
Pinduoduo - GMV
Market shares of China’s e-commerce platforms in terms of GMV
9771,293 1,552 1,847
2,228317384
533694
921
0
500
1,000
1,500
2,000
2,500
3,000
3,500
2017 2018 2019F 2020F 2021F
Rmb bn
Tier 1 and 2 cities Tier 3 or below cities
63 158 368652
1,136
79 314
648
976
1,414
0
500
1,000
1,500
2,000
2,500
3,000
2017 2018 2019F 2020F 2021F
Rmb bn
Tier 1 and 2 cities Tier 3 or below cities
74% 69% 66% 65% 64%
21%21% 21% 20% 18%
2% 6% 10% 14% 17%3% 4% 3% 2% 1%
0%10%20%30%40%50%60%70%80%90%100%
2017 2018 2019F 2020F 2021F
Alibaba JD Pinduoduo OthersAlibaba JD OthersPinduoduo
DBS Asian Insights SECTOR BRIEFING 8628

55%
100%
45%
100%
0%
10%
20%
30%
40%
50%
60%
70%
80%
90%
100%
Alibaba JD Pinduoduo
1P 3P Source: Company, DBS
Source: DBS HK
GMV breakdown (2019)
Monetisation avenues of China’s e-commerce platforms
There are first-party (1P) e-commerce platforms and third-party (3P) e-commerce platforms. (1) 1P e-commerce platforms procure products from suppliers and sell them to customers on a cost-plus basis, with low gross profit margin (GPM) of 6-8%. (2) 3P e-commerce platforms are platforms through which merchants sell their products to customers. 3P e-commerce platforms mainly monetise through online advertising and transaction-based commission, with high GPM of 80-90%. Online advertising and transaction-based commission are thus major high-margin monetisation avenues of e-commerce platforms’ GMV.
Alibaba and Pinduoduo are 3P e-commerce platforms (3P: 100% of 2019 GMV). JD is hybrid e-commerce platform (1P: 55% of 2019 GMV, 3P: 45% of 2019 GMV).
E-commerce Platforms’ Monetisation Rate
Business models Description Monetisation ways Gross profit margin
First-party (1P) e-commerce platforms
1P e-commerce platforms procure products from suppliers and sell them to customers on cost-plus basis
Price spread 6-8%
Third-party (3P) e-commerce platforms
3P e-commerce platforms are platforms through which merchants sell their products to customers
Online advertising and transaction-based commission
80-90%
DBS Asian Insights SECTOR BRIEFING 86
29

Current Monetisation Rate
JD’s, Alibaba’s, and Pinduoduo’s monetisation rate (commission and advertising revenue as percentage of 3P GMV) were 4.5%, 3.6%, and 3.0% respectively in 2019.
Monetisation Rate in Next Three Years
We interviewed industry experts, such as advertising agents and merchants, and analysed advertising budgets of merchants. Market is concerned that penetrating lower-tier cities will drag down the monetisation rate, however we believe e-commerce platforms could increase monetisation rate if they are able to increase the proportion of apparel in terms of GMV.
(1) Advertising budget as % of paying merchants’ GMV. According to industry experts, apparel merchants spend 15-30% of GMV on e-commerce ads, 10-15% for necessity merchants, 5-10% for 3C merchants. Merchants with a higher scale and profitability will tend to spend a higher percentage of GMV on e-commerce ads.
Source: Company, DBS HK
Source: Company, DBS HK
E-commerce platforms’ monetisation rate in 2019
Advertising budget as % of GMV on different product categories
3.6%
4.5%
3.0%
0.0%
0.5%
1.0%
1.5%
2.0%
2.5%
3.0%
3.5%
4.0%
4.5%
5.0%
Alibaba JD Pinduoduo
10%
15%
5%
15%
30%
10%
0%
5%
10%
15%
20%
25%
30%
35%
Necessit ies (i.e.food and FMCG)
Apparel 3C products
Alibaba
Necessities (i.e. food and FMCG)
JD Pinduoduo
DBS Asian Insights SECTOR BRIEFING 8630

Source: DBS HK
Alibaba’s GMV mix
35% 32% 29% 28%
10% 9% 8% 8%
35% 36% 38% 38%
20% 23% 25% 26%
0%
20%
40%
60%
80%
100%
2018 2019 2020 2021Necessit ies (i.e. food and FMCG)ApparelComputer, Communication and Consumer ElectronicOthers
Therefore, e-commerce platforms that are able to increase the proportion of GMV from high-profitability apparel would have a higher advertising budget as a percentage of GMV from paying merchants who place advertisements.
E-commerce platforms’ promotion advantage is most important for high-profitability apparel, which is Alibaba’s advantage. As a percentage of total GMV, we expect Alibaba’s contribution from necessities to rise from 23% in 2019 to 26% in 2021, as it gains users and user stickiness from lower-tier cities, while apparel’s is projected to rise from 36% in 2019 to 38% in 2021, as it increasingly monetises an already large user base from lower-tier cities. Meanwhile, we expect GMV contribution from low-traffic and low-profitability 3C and other products to drop from 41% in 2019 to 36% in 2021.
E-commerce platforms’ promotion advantage is most important for high-profitability apparel, which is Pinduoduo’s advantage. As a percentage of total GMV, Pinduoduo’s necessities contribution is projected to rise from 34% in 2019 to 38% in 2021, as it continues to gain users and user stickiness in lower-tier cities, while apparel’s contribution is estimated to rise from 34% in 2019 to 38% in 2021, as it increasingly monetises its already large user base in lower-tier cities. Meanwhile, we expect GMV contribution from low-traffic and low-profitability 3C and other products to drop from 31% in 2019 to 34% in 2021.
Necessities (i.e. food and FMCG)
DBS Asian Insights SECTOR BRIEFING 86
31

Logistics advantage, which is JD’s advantage, however, is less important for high-profitability apparel. As a percentage of total GMV, we expect JD’s necessities contribution to rise from 21% in 2019 to 24% in 2021, as it continues to gain users and user stickiness in lower-tier cities, while apparel’s contribution keeps at 20% from 2019 to 2021, as monetisation of its growing user base in lower-tier cities is moderate. Meanwhile, we expect GMV contribution from low-traffic and low-profitability 3C and other products to drop from 59% in 2019 to 55% in 2021.
(2) Paying ratio. We estimate JD’s paying ratio (merchants, which spend ad dollar on its e-commerce platform, as % of total merchants) to be c.55%, Alibaba c.32%, Pinduoduo c.25%. This means e-commerce platforms with a large merchant size (in terms of annual GMV per merchant) will have higher profitability and thus, higher paying ratio.
Source: Company, DBS HK
Source: Company, DBS HK
Pinduoduo’s GMV mix
JD’s GMV mix
30% 24% 20% 19%
10%8% 6% 5%
30%34% 37% 38%
30% 34% 37% 38%
0%
20%
40%
60%
80%
100%
2018 2019 2020 2021Necessit ies (i.e. food and FMCG)ApparelComputer, Communication and Consumer ElectronicOthers
5% 5% 5% 5%
55% 54% 52% 50%
20% 20% 20% 20%
20% 21% 23% 24%
0%
20%
40%
60%
80%
100%
2018 2019 2020 2021Necessit ies (i.e. food and FMCG)ApparelComputer, Communication and Consumer ElectronicOthers
Necessities (i.e. food and FMCG)
Necessities (i.e. food and FMCG)
DBS Asian Insights SECTOR BRIEFING 8632

We expect JD’s paying ratio to decrease from c.55% in 2019 to c.48% in 2021, with an increasing base of small and medium merchants with lower profitability offering value-for-money products.
Meanwhile, we expect Alibaba’s/Pinduoduo’s paying ratio to increase from c.32%/c.27% in 2019 to c.33%/c.30% in 2021. We expect Pinduoduo to expand towards large merchants with higher profitability to meet demand from users in lower-tier cities led by rising consumption power in the long term.
(3) Monetisation rate. We estimate Alibaba’s monetisation rate (commission and advertising revenue as a percentage of 3P GMV) to increase from 3.6% in 2019 to 3.8% in 2021F, led by a rise in advertising budget as a percentage of paying merchants’ GMV, with higher GMV contribution from higher-profitability apparel.
Source: Company, DBS HK
Source: Company, DBS HK
E-commerce platforms’ merchant paying ratio and annual GMV per merchant
E-commerce platforms’ paying ratio
0.7
10.4
0.3
32%
55%
27%
0%
10%
20%
30%
40%
50%
60%
0.0
2.0
4.0
6.0
8.0
10.0
12.0
Alibaba JD Pinduoduo
Annual GMV per merchant (Rmb m)
Annual GMV per merchant (Rmb m, LHS)Paying ratio (RHS)
31.8% 32.1% 32.5% 33.0%
54.6% 54.9%51.4%
47.7%
25.3% 26.9% 28.4% 30.0%
10%
20%
30%
40%
50%
60%
2018 2019 2020 2021
Alibaba JD PinduoduoAlibaba JD Pinduoduo
DBS Asian Insights SECTOR BRIEFING 86
33

We estimate Pinduoduo’s monetisation rate to increase from 3.0% in 2019 to 3.5% in 2021F, led by an increase in advertising budget as a percentage of paying merchants’ GMV, due to: (i) higher GMV contribution from higher-profitability apparel, as well as (ii) increasing paying ratio, as Pinduoduo includes larger merchants on its platform to meet demand from users in lower-tier cities in the long term.
In contrast, we estimate that JD’s monetisation rate will decrease from 4.5% in 2019 to 4.0% in 2021F, on (i) decreasing paying ratio with an increase in the number of small and medium merchants with lower profitability offering value-for-money products, as well as (ii) flattish advertising budget as a percentage of paying merchants’ GMV, due to a shift in GMV mix to small- and medium-scale merchants in the necessity product category to gain traffic in lower-tier cities.
Source: Company, DBS HK
E-commerce platforms’ monetisation rate
3.3%3.6% 3.6% 3.7% 3.8%
4.6% 4.5% 4.5%4.3%
4.0%
1.2%
2.8%3.0%
3.3%3.5%
0%
1%
2%
3%
4%
5%
2017 2018 2019 2020 2021Alibaba JD PinduoduoAlibaba JD Pinduoduo
DBS Asian Insights SECTOR BRIEFING 8634

Source: Company, DBS HK
E-commerce platforms’ non-GAAP core e-commerce net margin (2019)
78.7%
2.5%
-14.6%-20%
0%
20%
40%
60%
80%
100%
Alibaba JD Pinduoduo
E-commerce Business Profitability
There are concerns on profitability of e-commerce platforms in lower-tier cities. Therefore, we have done an analysis on e-commerce platforms’ cost structure and profitability.
Current e-commerce business profitability
E-commerce platforms’ current core business profitability varies. Alibaba and JD are profitable with non-GAAP marketplace-based core e-commerce (1P + 3P [online advertising and commission]) net margin of 78.7% and 2.5% respectively in 2019, while Pinduoduo, which focuses on lower-tier cities, was loss making with non-GAAP core e-commerce net margin of -14.6%.
E-commerce platforms’ e-commerce cost structure E-commerce platforms’ marketplace-based core e-commerce profitability is largely dependent on (1) their business models (i.e. JD’s estimated 1P non-GAAP net margin: -2.9%; estimated 3P non-GAAP net margin: 67.4%) and (2) whether their commission and advertising revenue is able to offset corresponding operating expenses.
We have broken down e-commerce platform’s cost structure. Sales and marketing expenses accounted for 19-99% of Alibaba’s and Pinduoduo’s core e-commerce revenue, while other
Alibaba JD Pinduoduo
DBS Asian Insights SECTOR BRIEFING 86
35

operating expenses (i.e. general & administrative expenses and research & development expenses) was 2-27%. Cost of revenue accounted for 85% of JD’s core e-commerce revenue, while sales and marketing expenses was only 4%, due to its low margin 1P business, while sales and marketing expenses was 23% of JD’s 3P core e-commerce revenue.
Sales and marketing expenses is thus a major cost item. Sales and marketing expenses as a percentage of revenue is one of the critical factors affecting the profitability of 3P e-commerce platforms.
2019
Alibaba JD - 1P Pinduoduo
As % of 1P GMV
1P direct sales revenue 0.0% 44.6% 0.0%
- Cost of revenue 0.0% -41.3% 0.0%
- Fulfilment cost 0.0% -3.2% 0.0%
- Sales and marketing expenses 0.0% -1.0% 0.0%
- Other operating expenses 0.0% -0.5% 0.0%
= Non-GAAP operating income 0.0% -1.3% 0.0%
As % of 1P revenue
1P direct sales revenue 0.0% 100.0% 0.0%
- Cost of revenue 0.0% -92.5% 0.0%
- Fulfilment cost 0.0% -7.1% 0.0%
- Sales and marketing expenses 0.0% -2.3% 0.0%
- Other operating expenses 0.0% -1.0% 0.0%
= Non-GAAP operating income 0.0% -2.9% 0.0%
Source: Company, DBS HK
E-commerce platforms’ marketplace-based core e-commerce cost structure - 1P
DBS Asian Insights SECTOR BRIEFING 8636
Cost of revenue is major cost item and one of the critical factors affecting the profitability of 1P e-commerce platforms

2019
Alibaba JD - 3P Pinduoduo
As % of 3P GMV
3P online advertising and commission revenue
3.6% 4.5% 3.00%
- Sales and marketing expenses -0.7% -1.0% -2.60%
- Other operating expenses -0.1% -0.5% -0.80%
= Non-GAAP operating income 2.9% 3.1% -0.40%
As % of 3P revenue
Online advertising and commission revenue
100.0% 100.0% 100.00%
- Sales and marketing expenses -19.2% -22.5% -87.30%
- Other operating expenses -1.8% -10.0% -27.30%
= Non-GAAP operating income 79.0% 67.4% -14.60%
Source: Company, DBS HK
E-commerce platforms’ marketplace-based core e-commerce cost structure - 3P
E-commerce Business Profitability in Next Three YearsAs discussed above, sales and marketing expenses as a percentage of revenue is one of critical factors impacting the profitability of 3P e-commerce platforms. We have interviewed industry experts, such as advertising agents, to help us analyse whether (1) an increase in sales and marketing expenses per annual active customer could be offset by (2) a rise in marketplace-based core e-commerce revenue per annual active customer (1P + 3P [online advertising and commission]), which is factor of (i) average annual spending per customer and (ii) monetisation rate, to determine (3) e-commerce platforms’ profitability.
1. Sales and marketing expenses per annual active customerThe market has concerns on the profitability of e-commerce platforms in lower-tier cities due to market perception of heavy sales and marketing expenses (i.e. subsidies) in underpenetrated markets.
However, advertising agents have indicated that sales and marketing expenses per annual active customer in lower-tier cities is c.Rmb50, which is around 50% lower than c.Rmb100 in higher-tier cities. This is because costs per thousand impressions (CPM) are similar in different tier cities, but the conversion rate is lower in higher-tier cities with a higher e-commerce penetration rate.
DBS Asian Insights SECTOR BRIEFING 86
37
Sales and marketing expenses is a major cost item and a critical factor impacting 3P e-commerce platform’s profitability

Assuming that user acquisition cost in lower-tier cities is at a 50% discount to that in higher-tier cities, we estimate Alibaba’s sales and marketing expenses per annual active customer was Rmb95 in tier 1-2 cities and Rmb47 in tier 3 or below cities in 2019, which is close to the market average.
With c.5% p.a. increase in CPM, we expect Alibaba’s sales and marketing expenses per annual active customer to increase by 5% p.a. to Rmb104 in tier 1-2 cities and 17% p.a. to Rmb64 in tier 3 or below cities in 2021F.
Source: DBS HK
Source: DBS HK
E-commerce platforms’ acquisition costs per annual active customer (2019)
E-commerce platforms’ acquisition costs per incremental annual active customer (2019)
100
50
0
20
40
60
80
100
120
Tier 1-2 cit ies Tier 3 or below cities
Rmb
95
8170
4741
35
7164
51
0102030405060708090
100
Alibaba JD Pinduoduo
Rmb
Tier 1-2 cit ies Tier 3 or below cities OverallAlibaba JD Pinduoduo
DBS Asian Insights SECTOR BRIEFING 8638

We estimate Pinduoduo’s acquisition costs per annual active customer is much lower at Rmb70 in tier 1-2 cities and Rmb35 in tier 3 or below cities in 2019, which is c.70% of the market average. This is because Pinduoduo occupies one of the “online shopping” portals on WeChat’s mobile wallet (with other e-commerce platforms, JD, Vipshop and Mogu), leveraging WeChat’s user base. Besides, Pinduoduo’s traffic could come from sharing of the “team purchase” link among buyers’ existing social networks (i.e. buyers’ family and friends) on social communication platforms, such as Tencent’s WeChat. The sharing of this link also promotes Pinduoduo’s products as well as its platform to more potential buyers without incurring additional expenses. The benefit will be “buying one user, getting more users free”. That is why Pinduoduo’s acquisition costs per incremental annual active customer is c.20% of market average. The success of its “team purchase” link is attributed to support from Tencent, its second largest shareholder with 16.9% stake. This cannot be replicated by Alibaba as buyers are not able to share Alibaba’s links on Tencent’s WeChat.
With c.5% p.a. increase in CPM, we expect Pinduoduo’s acquisition costs per annual active customer to increase moderately by 17% p.a. to Rmb96 in tier 1-2 cities and 5% p.a. to Rmb39 in tier 3 or below cities in 2021F.
Source: DBS HK
Source: DBS HK
Alibaba - sales and marketing expenses per annual active customer
Pinduoduo - sales and marketing expenses per annual active customer
E-commerce platforms’ acquisition costs per incremental annual active customer (2019)
8395 100 104
41 4755
6464
71 7683
0
20
40
60
80
100
120
2018 2019 2020 2021
Rmb
Tier 1-2 cit ies Tier 3 or below cities Overall
49
7082
96
2435 37 39
3651 57 62
0
20
40
60
80
100
120
2018 2019 2020 2021
Rmb
Tier 1-2 cit ies Tier 3 or below cities Overall
Pinduoduo’s acquisition costs per annual active
customer is much lower
DBS Asian Insights SECTOR BRIEFING 86
39
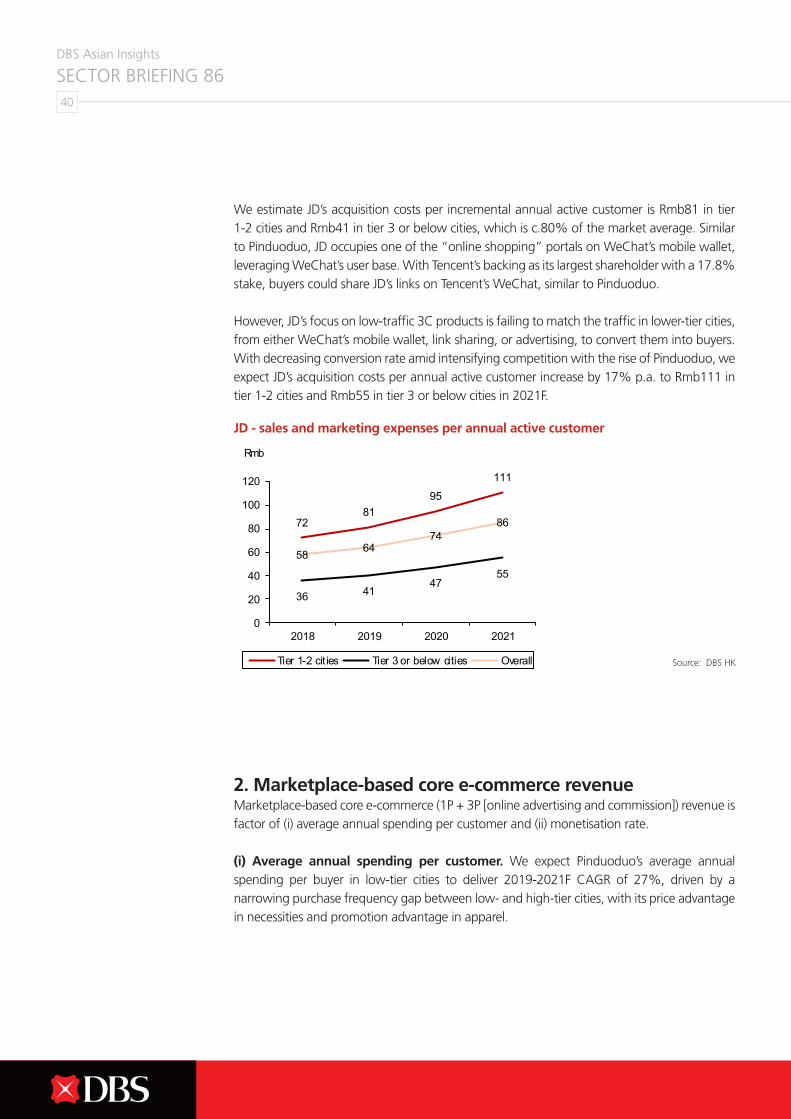
We estimate JD’s acquisition costs per incremental annual active customer is Rmb81 in tier 1-2 cities and Rmb41 in tier 3 or below cities, which is c.80% of the market average. Similar to Pinduoduo, JD occupies one of the “online shopping” portals on WeChat’s mobile wallet, leveraging WeChat’s user base. With Tencent’s backing as its largest shareholder with a 17.8% stake, buyers could share JD’s links on Tencent’s WeChat, similar to Pinduoduo.
However, JD’s focus on low-traffic 3C products is failing to match the traffic in lower-tier cities, from either WeChat’s mobile wallet, link sharing, or advertising, to convert them into buyers. With decreasing conversion rate amid intensifying competition with the rise of Pinduoduo, we expect JD’s acquisition costs per annual active customer increase by 17% p.a. to Rmb111 in tier 1-2 cities and Rmb55 in tier 3 or below cities in 2021F.
2. Marketplace-based core e-commerce revenueMarketplace-based core e-commerce (1P + 3P [online advertising and commission]) revenue is factor of (i) average annual spending per customer and (ii) monetisation rate.
(i) Average annual spending per customer. We expect Pinduoduo’s average annual spending per buyer in low-tier cities to deliver 2019-2021F CAGR of 27%, driven by a narrowing purchase frequency gap between low- and high-tier cities, with its price advantage in necessities and promotion advantage in apparel.
Source: DBS HK
JD - sales and marketing expenses per annual active customer
7281
95
111
36 4147
55
58 6474
86
0
20
40
60
80
100
120
2018 2019 2020 2021
Rmb
Tier 1-2 cit ies Tier 3 or below cities Overall
DBS Asian Insights SECTOR BRIEFING 8640

We expect Alibaba’s purchase frequency gap between low- and high-tier cities to narrow as well, with its user advantage in necessities and promotion advantage in apparel. However, we expect Alibaba to deliver a relatively moderate rise in average annual spending per buyer of 9% CAGR in 2019-2021F, as increasing purchase frequency will be partly offset by low ticket sizes in lower-tier cities.
We expect JD’s purchase frequency gap between low- and high-tier cities to narrow but at a moderate rate, as its logistics advantage is less important for necessities and apparel in lower-tier cities. We expect JD to deliver relatively moderate rise in average annual spending per buyer of 11% CAGR in 2019-2021F.
Source: Company, DBS HK
Source: Company, DBS HK
Pinduoduo - Average annual spending per customer
Alibaba - Average annual spending per customer
1,5321,813
2,743
3,410
4,364
687 8421,336
1,746
2,361991
1,308
1,9672,468
3,167
0500
1,0001,5002,0002,5003,0003,5004,0004,5005,000
2017 2018 2019 2020 2021
Rmb
Tier 1 and 2 cities Tier 3 or below citiesOverall
13,22612,368
13,427 13,887
15,825
5,927 5,7436,503 7,030
8,418
9,503 9,3209,989 10,302
11,774
4,000
6,000
8,000
10,000
12,000
14,000
16,000
18,000
2017 2018 2019 2020 2021
Rmb
Tier 1 and 2 cities Tier 3 or below citiesOverall
DBS Asian Insights SECTOR BRIEFING 86
41

(ii) Monetisation rate. We estimate Alibaba’s monetisation rate (commission and advertising revenue as a percentage of 3P GMV) to increase from 3.6% in 2019 to 3.8% in 2021F, aided by increasing advertising budget as a percentage of paying merchants’ GMV, and shift in GMV mix to higher margin apparel category to monetise traffic from lower-tier cities.
We estimate Pinduoduo’s monetisation rate to increase from 3.0% in 2019 to 3.5% in 2021F, supported by an increase in the advertising budget as a percentage of paying merchants’ GMV and increasing paying ratio, with a shift in mix to larger merchants and apparels.
We estimate JD’s monetisation rate to decrease from 4.5% in 2019 to 4.0% in 2021F, with decreasing paying ratio and flattish advertising budget as a percentage of paying merchants’ GMV, with a shift in the merchant mix to small and medium scale and necessity category to gain traffic from lower-tier cities.
Source: Company, DBS HK
Source: Company, DBS HK
JD - Average annual spending per customer
E-commerce platforms’ monetisation rate
6,3976,915
8,0438,481
9,586
2,867 3,2113,820 4,120
4,800
4,9145,470
6,270 6,5797,422
2,000
3,000
4,000
5,000
6,000
7,000
8,000
9,000
10,000
2017 2018 2019 2020 2021
Rmb
Tier 1 and 2 cities Tier 3 or below citiesOverall
3.3%3.6% 3.6% 3.7% 3.8%
4.6% 4.5% 4.5%4.3%
4.0%
1.2%
2.8%3.0%
3.3%3.5%
0%
1%
2%
3%
4%
5%
2017 2018 2019 2020 2021
Alibaba JD PinduoduoAlibaba JD Pinduoduo
DBS Asian Insights SECTOR BRIEFING 8642

We expect Alibaba’s/Pinduoduo’s sales and marketing expenses as a percentage of marketplace-based core e-commerce revenue to decrease from 19.6%/87.3% in 2019 to 16.9%/55.6% in 2021 led by: (1) a moderate increase in sales and marketing expenses per annual active customer (3%/10% CAGR for each player during 2019-2021), offset by (2) rising marketplace-based core e-commerce revenue (11%/37% CAGR during 2019-2021) driven by (i) an increase in average annual spending per customer and (ii) higher monetisation rate, supported by Alibaba’s/Pinduoduo’s advantage in necessities and apparel.
However, JD’s sales and marketing expenses as a percentage of marketplace-based core e-commerce revenue is expected to increase from 2.1% in 2019 to 2.3% in 2021 as (1) the increase in sales and marketing expenses per annual active customer by 16% CAGR during 2019-2021 is unlikely to be fully offset by (2) a slower increase in marketplace-based core e-commerce revenue (10% CAGR during 2019-2021). Therefore, JD’s marketplace e-commerce revenue growth will be led by (i) a moderate increase in average annual spending per customer and (ii) a decrease in monetisation rate, as its logistics advantage is less important for necessities and apparel in lower-tier cities.
Source: DBS HK
Alibaba - Sales and marketing expenses as % of marketplace-based core e-commerce revenue
2018 2019 2020 2021
Tier 1-2 cities
Sales and marketing expenses per annual active customer
83 95 100 104
Average annual spending per customer 12,368 13,427 13,887 15,825
Sales and marketing expenses as % of GMV 0.7% 0.7% 0.7% 0.7%
Monetisation rate 3.9% 3.9% 4.0% 4.0%
Online advertising and commission revenue per annual active customers
478 527 554 638
Sales and marketing expenses as % of revenue 17.4% 18.0% 18.0% 16.4%
Tier 3 or below cities
Sales and marketing expenses per annual active customer
41 47 50 52
Average annual spending per customer 5,743 6,503 7,030 8,418
Sales and marketing expenses as % of GMV 0.7% 0.7% 0.7% 0.6%
Monetisation rate 2.8% 3.1% 3.3% 3.5%
Online advertising and commission revenue per annual active customers
163 199 232 295
Sales and marketing expenses as % of revenue 25.4% 23.8% 21.5% 17.7%
Overall
Sales and marketing expenses per annual active customer
64 71 73 76
Average annual spending per customer 9,320 9,989 10,302 11,774
Sales and marketing expenses as % of GMV 0.7% 0.7% 0.7% 0.6%
Monetisation rate 3.6% 3.6% 3.7% 3.8%
Online advertising and commission revenue per annual active customers
333 364 386 451
Sales and marketing expenses as % of revenue 19.2% 19.6% 19.1% 16.9%
DBS Asian Insights SECTOR BRIEFING 86
43

JD - Sales and marketing expenses as % of marketplace-based core e-commerce revenue
2018 2019 2020 2021
Tier 1-2 cities
Sales and marketing expenses per annual active customer
72 81 95 111
Average annual spending per customer 6,915 8,043 8,846 9,934
Sales and marketing expenses as % of GMV 1.0% 1.0% 1.1% 1.1%
1P monetisation rate 44.6% 44.6% 44.6% 44.6%
3P monetisation rate 4.5% 4.5% 4.5% 4.6%
Direct sales, Online advertising and commission revenue per annual active customers
1,889 2,171 2,356 2,612
Sales and marketing expenses as % of revenue 3.8% 3.7% 4.0% 4.2%
Tier 3 or below cities
Sales and marketing expenses per annual active customer
36 41 47 55
Average annual spending per customer 3,211 3,820 4,297 4,975
Sales and marketing expenses as % of GMV 1.1% 1.1% 1.1% 1.1%
1P monetisation rate 44.6% 44.6% 44.6% 44.6%
3P monetisation rate 4.5% 4.5% 3.5% 2.5%
Direct sales, Online advertising and commission revenue per annual active customers
877 1,030 1,121 1,254
Sales and marketing expenses as % of revenue 4.1% 3.9% 4.2% 4.4%
Overall
Sales and marketing expenses per annual active customer
58 64 74 86
Average annual spending per customer 5,470 6,270 6,862 7,692
Sales and marketing expenses as % of GMV 1.1% 1.0% 1.1% 1.1%
1P monetisation rate 44.6% 44.6% 44.6% 44.6%
3P monetisation rate 4.5% 4.5% 4.3% 4.0%
Direct sales, Online advertising and commission revenue per annual active customers
1,467 1,664 1,793 1,977
Sales and marketing expenses as % of revenue 4.0% 3.9% 4.1% 4.3%
Source: DBS HK
DBS Asian Insights SECTOR BRIEFING 8644

Pinduoduo - Sales and marketing expenses as % of marketplace-based core e-commerce revenue
2018 2019 2020 2021
Tier 1-2 cities
Sales and marketing expenses per annual active customer
49 70 82 96
Average annual spending per customer 1,813 2,743 3,410 4,364
Sales and marketing expenses as % of GMV 2.7% 2.6% 2.4% 2.2%
Monetisation rate 2.8% 3.0% 3.3% 3.5%
Online advertising and commission revenue per annual active customers
50 82 112 152
Sales and marketing expenses as % of revenue 96.9% 85.7% 73.4% 62.9%
Tier 3 or below cities
Sales and marketing expenses per annual active customer
24 35 37 39
Average annual spending per customer 842 1,303 1,746 2,361
Sales and marketing expenses as % of GMV 2.9% 2.7% 2.1% 1.6%
Monetisation rate 2.8% 3.0% 3.3% 3.5%
Online advertising and commission revenue per annual active customers
23 39 58 83
Sales and marketing expenses as % of revenue 104.3% 90.2% 64.1% 46.6%
Overall
Sales and marketing expenses per annual active customer
36 51 57 62
Average annual spending per customer 1,308 1,967 2,468 3,167
Sales and marketing expenses as % of GMV 2.8% 2.6% 2.3% 1.9%
Monetisation rate 2.8% 3.0% 3.3% 3.5%
Online advertising and commission revenue per annual active customers
36 59 81 111
Sales and marketing expenses as % of revenue 99.4% 87.3% 69.7% 55.6%
Source: DBS HK
Source: DBS HK
Sales and marketing expenses as % of marketplace-based core e-commerce revenue
19.2% 19.6% 19.1% 16.9%3.9% 3.9% 4.1% 4.3%
99.4%87.3%
69.7%55.6%
0.0%
20.0%
40.0%
60.0%
80.0%
100.0%
120.0%
2018 2019 2020 2021
Alibaba JD PinduoduoAlibaba JD Pinduoduo
DBS Asian Insights SECTOR BRIEFING 86
45

3. E-commerce platforms’ core e-commerce profitabilityAs discussed above, sales and marketing expenses as a percentage of revenue is one of critical factors impacting the profitability of 3P e-commerce platforms. With decreasing sales and marketing expenses as a percentage of marketplace-based core e-commerce revenue, we expect Alibaba’s/Pinduoduo’s non-GAAP core e-commerce net margin to increase from 78.7%/-14.6% in 2019 to 81.4%/14.1% in 2021F aided by a higher monetisation rate due to Alibaba’s/Pinduoduo’s advantage in necessities and apparel.
We expect JD’s non-GAAP core e-commerce net margin to decrease from 2.5% in 2019 to 1.8% in 2021F, on a decreasing monetisation rate as its logistics advantage is less important for necessities and apparel in lower-tier cities.
DBS Asian Insights SECTOR BRIEFING 8646
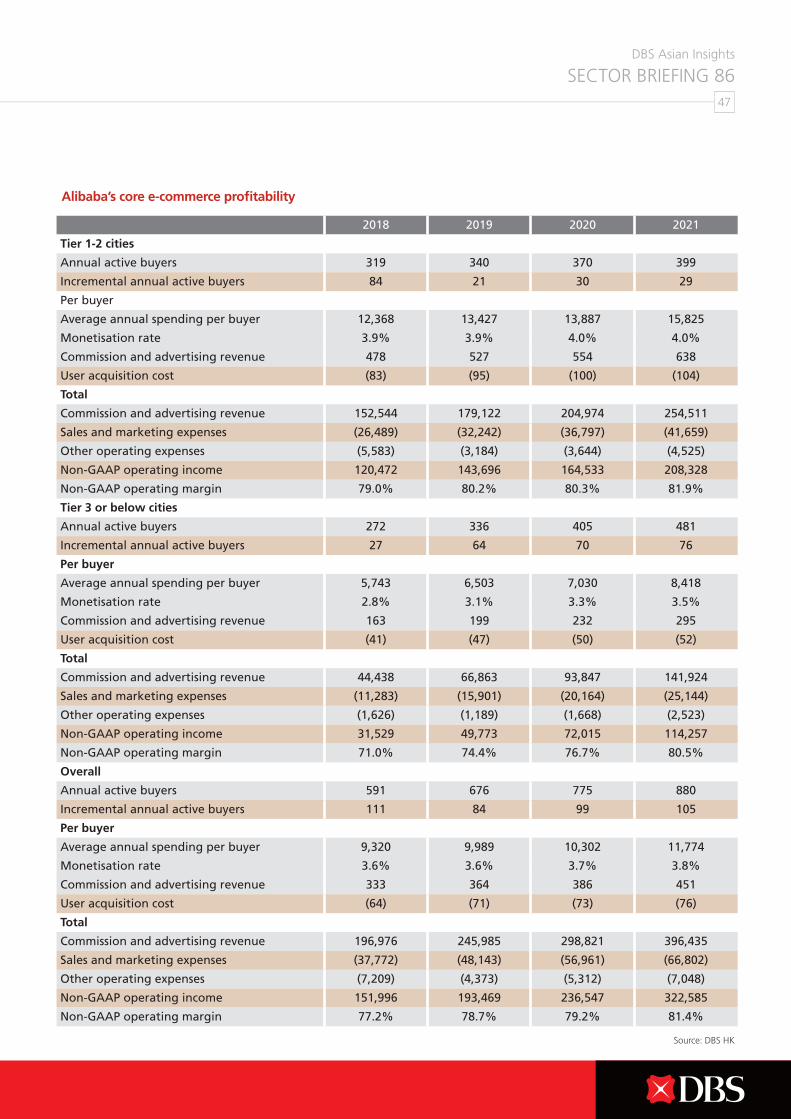
Alibaba’s core e-commerce profitability
2018 2019 2020 2021
Tier 1-2 cities
Annual active buyers 319 340 370 399
Incremental annual active buyers 84 21 30 29
Per buyer
Average annual spending per buyer 12,368 13,427 13,887 15,825
Monetisation rate 3.9% 3.9% 4.0% 4.0%
Commission and advertising revenue 478 527 554 638
User acquisition cost (83) (95) (100) (104)
Total
Commission and advertising revenue 152,544 179,122 204,974 254,511
Sales and marketing expenses (26,489) (32,242) (36,797) (41,659)
Other operating expenses (5,583) (3,184) (3,644) (4,525)
Non-GAAP operating income 120,472 143,696 164,533 208,328
Non-GAAP operating margin 79.0% 80.2% 80.3% 81.9%
Tier 3 or below cities
Annual active buyers 272 336 405 481
Incremental annual active buyers 27 64 70 76
Per buyer
Average annual spending per buyer 5,743 6,503 7,030 8,418
Monetisation rate 2.8% 3.1% 3.3% 3.5%
Commission and advertising revenue 163 199 232 295
User acquisition cost (41) (47) (50) (52)
Total
Commission and advertising revenue 44,438 66,863 93,847 141,924
Sales and marketing expenses (11,283) (15,901) (20,164) (25,144)
Other operating expenses (1,626) (1,189) (1,668) (2,523)
Non-GAAP operating income 31,529 49,773 72,015 114,257
Non-GAAP operating margin 71.0% 74.4% 76.7% 80.5%
Overall
Annual active buyers 591 676 775 880
Incremental annual active buyers 111 84 99 105
Per buyer
Average annual spending per buyer 9,320 9,989 10,302 11,774
Monetisation rate 3.6% 3.6% 3.7% 3.8%
Commission and advertising revenue 333 364 386 451
User acquisition cost (64) (71) (73) (76)
Total
Commission and advertising revenue 196,976 245,985 298,821 396,435
Sales and marketing expenses (37,772) (48,143) (56,961) (66,802)
Other operating expenses (7,209) (4,373) (5,312) (7,048)
Non-GAAP operating income 151,996 193,469 236,547 322,585
Non-GAAP operating margin 77.2% 78.7% 79.2% 81.4%
Source: DBS HK
DBS Asian Insights SECTOR BRIEFING 86
47

Pinduoduo’s core e-commerce profitability
2018 2019 2020 2021
Tier 1-2 cities
Annual active buyers 173 236 286 324
Incremental annual active buyers 122 63 50 38
Per buyer
Average annual spending per buyer 1,813 2,743 3,410 4,364
Monetisation rate 2.8% 3.0% 3.3% 3.5%
Commission and advertising revenue 50 82 112 152
User acquisition cost (49) (70) (82) (96)
Total
Commission and advertising revenue 8,729 19,390 32,009 49,349
Sales and marketing expenses (8,456) (16,615) (23,503) (31,027)
Other operating expenses (2,355) (5,300) (9,300) (14,931)
Non-GAAP operating income -2,082 -2,524 -794 3,392
Non-GAAP operating margin -23.8% -13.0% -2.5% 6.9%
Tier 3 or below cities
Annual active buyers 188 276 373 481
Incremental annual active buyers 96 88 98 108
Per buyer
Average annual spending per buyer 842 1,303 1,746 2,361
Monetisation rate 2.8% 3.0% 3.3% 3.5%
Commission and advertising revenue 23 39 58 83
User acquisition cost -24 -35 -37 -39
Total
Commission and advertising revenue 4,391 10,751 21,531 40,024
Sales and marketing expenses (4,580) (9,699) (13,797) (18,669)
Other operating expenses (1,185) (2,939) (6,256) (12,110)
Non-GAAP operating income -1,374 -1,886 1,479 9,245
Non-GAAP operating margin -31.3% -17.5% 6.9% 23.1%
Overall
Annual active buyers 361 512 660 805
Incremental annual active buyers 218 151 148 145
Per buyer
Average annual spending per buyer 1,308 1,967 2,468 3,167
Monetisation rate 2.8% 3.0% 3.3% 3.5%
Commission and advertising revenue 36 59 81 111
User acquisition cost -36 -51 -57 -62
Total
Commission and advertising revenue 13,120 30,142 53,541 89,373
Sales and marketing expenses (13,036) (26,313) (37,300) (49,696)
Other operating expenses (3,540) (8,238) (15,556) (27,041)
Non-GAAP operating income -3,456 -4,410 685 12,637
Non-GAAP operating margin -26.3% -14.6% 1.3% 14.1%
Source: DBS HK
DBS Asian Insights SECTOR BRIEFING 8648
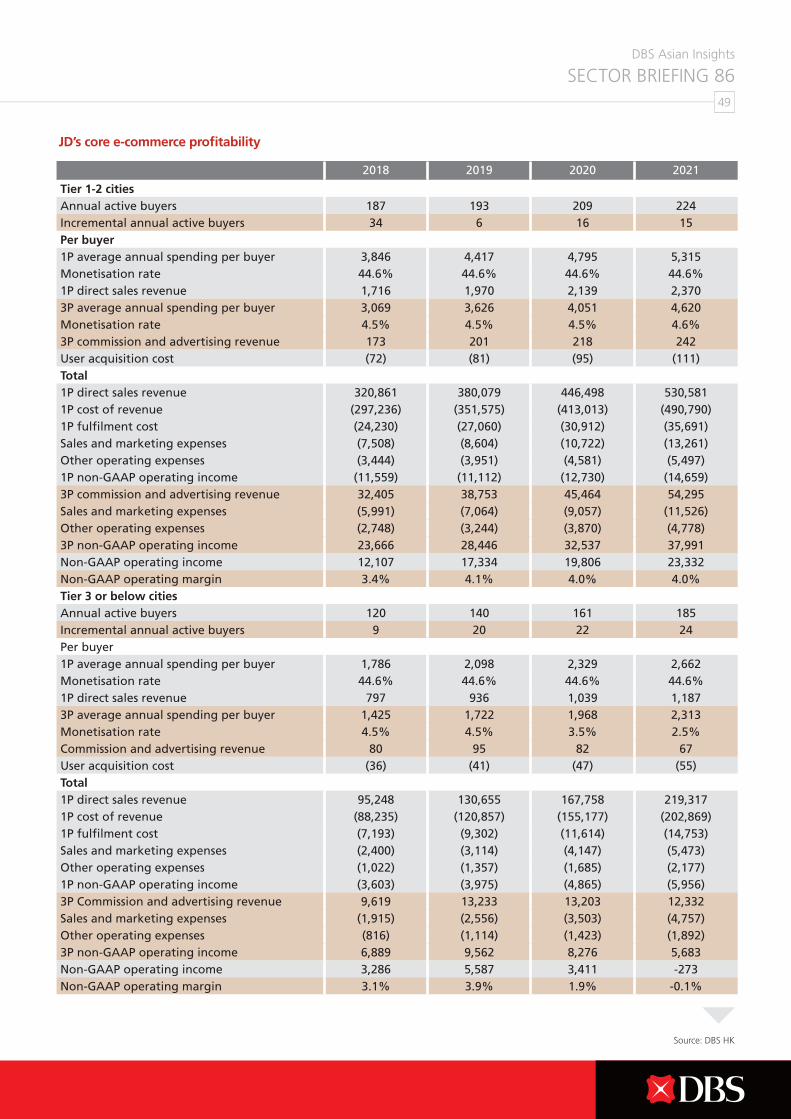
JD’s core e-commerce profitability
2018 2019 2020 2021
Tier 1-2 cities Annual active buyers 187 193 209 224Incremental annual active buyers 34 6 16 15Per buyer1P average annual spending per buyer 3,846 4,417 4,795 5,315Monetisation rate 44.6% 44.6% 44.6% 44.6%1P direct sales revenue 1,716 1,970 2,139 2,3703P average annual spending per buyer 3,069 3,626 4,051 4,620Monetisation rate 4.5% 4.5% 4.5% 4.6%3P commission and advertising revenue 173 201 218 242User acquisition cost (72) (81) (95) (111)Total1P direct sales revenue 320,861 380,079 446,498 530,5811P cost of revenue (297,236) (351,575) (413,013) (490,790)1P fulfilment cost (24,230) (27,060) (30,912) (35,691)Sales and marketing expenses (7,508) (8,604) (10,722) (13,261)Other operating expenses (3,444) (3,951) (4,581) (5,497)1P non-GAAP operating income (11,559) (11,112) (12,730) (14,659)3P commission and advertising revenue 32,405 38,753 45,464 54,295Sales and marketing expenses (5,991) (7,064) (9,057) (11,526)Other operating expenses (2,748) (3,244) (3,870) (4,778)3P non-GAAP operating income 23,666 28,446 32,537 37,991 Non-GAAP operating income 12,107 17,334 19,806 23,332Non-GAAP operating margin 3.4% 4.1% 4.0% 4.0%Tier 3 or below citiesAnnual active buyers 120 140 161 185Incremental annual active buyers 9 20 22 24Per buyer1P average annual spending per buyer 1,786 2,098 2,329 2,662Monetisation rate 44.6% 44.6% 44.6% 44.6%1P direct sales revenue 797 936 1,039 1,1873P average annual spending per buyer 1,425 1,722 1,968 2,313Monetisation rate 4.5% 4.5% 3.5% 2.5%Commission and advertising revenue 80 95 82 67User acquisition cost (36) (41) (47) (55)Total1P direct sales revenue 95,248 130,655 167,758 219,3171P cost of revenue (88,235) (120,857) (155,177) (202,869)1P fulfilment cost (7,193) (9,302) (11,614) (14,753)Sales and marketing expenses (2,400) (3,114) (4,147) (5,473)Other operating expenses (1,022) (1,357) (1,685) (2,177)1P non-GAAP operating income (3,603) (3,975) (4,865) (5,956)3P Commission and advertising revenue 9,619 13,233 13,203 12,332Sales and marketing expenses (1,915) (2,556) (3,503) (4,757)Other operating expenses (816) (1,114) (1,423) (1,892)3P non-GAAP operating income 6,889 9,562 8,276 5,683 Non-GAAP operating income 3,286 5,587 3,411 -273Non-GAAP operating margin 3.1% 3.9% 1.9% -0.1%
Source: DBS HK
DBS Asian Insights SECTOR BRIEFING 86
49

JD’s core e-commerce profitability cont.
2018 2019 2020 2021
OverallAnnual active buyers 307 333 370 409Incremental annual active buyers 43 26 38 39Per buyer
1P average annual spending per buyer 3,043 3,443 3,720 4,115Monetisation rate 44.6% 44.6% 44.6% 44.6%1P direct sales revenue 1,358 1,536 1,659 1,8353P average annual spending per buyer 2,428 2,827 3,142 3,577Monetisation rate 4.5% 4.5% 4.3% 4.0%Commission and advertising revenue 109 128 134 141User acquisition cost (58) (64) (74) (86)Total
1P direct sales revenue 416,109 510,734 614,256 749,8971P cost of revenue (385,472) (472,432) (568,190) (693,660)1P fulfilment cost (31,423) (36,363) (42,526) (50,444)Sales and marketing expenses (9,908) (11,718) (14,868) (18,733)Other operating expenses (4,384) (5,220) (6,181) (7,593)1P non-GAAP operating income (15,079) (14,999) (17,511) (20,532)3P commission and advertising revenue 33,532 42,680 49,559 57,909Sales and marketing expenses (7,906) (9,620) (12,560) (16,282)Other operating expenses (3,498) (4,286) (5,222) (6,599)3P non-GAAP operating income 22,128 28,774 31,777 35,027 Non-GAAP operating income 7,049 13,775 14,267 14,495Non-GAAP operating margin 1.6% 2.5% 2.1% 1.8%
Source: DBS HK
DBS Asian Insights SECTOR BRIEFING 8650

Merchants, e-commerce platforms, online advertising service providers, logistics service providers (i.e. warehouse service providers, express delivery service providers), and mobile payment service providers are anticipated to ride on increasing e-commerce penetration rate in lower-tier cities.
(1) Merchants. Users in higher-tier cities are more aware of branded merchants, while users in lower-tier cities tend to demand unbranded products with lower price points (i.e. Corou [tissue OEM supplier], Sunvim [textile OEM supplier], MTC [TV OEM supplier]) and targeted recommendations. Besides, recommendation feed-based business model – focusing on recommending top-selling SKUs to targeted users – may enable unbranded merchants to achieve better economies of scale and profitability.
(2) E-commerce platforms. E-commerce platforms, such as Alibaba, JD and Pinduoduo could increase addressable GMV in lower-tier cities and monetise through commissions or advertising fees.
(3) Online advertising service providers. (i) Internet platforms, such as Baidu, Tencent, and Bytedance, and (ii) online advertising agencies, such as Duiba, could offer user acquisition solutions to e-commerce platforms and monetise through advertising fees.
(4) Logistics service providers. (i) Express logistics platforms, such as Alibaba’s Cainiao (菜鳥物流) and JD’s JD Logistics (京東物流), (ii) warehouse service providers, such as GLP, ESR, CNLP, and (iii) express delivery service providers, such as ZTO Express (中通快遞), YTO Express (圓通速遞), STO Express (申通快遞), Yunda Express (韻達速遞), SF Express (順豐速運), EMS (中國郵政速遞物流) should be able to offer warehouse and delivery solutions to merchants and monetise through logistic fees.
(5) Mobile payment service providers. (i) Mobile payment platforms, such as Alibaba’s Alipay (支付寶) and Tencent’s Tenpay (財付通), and (ii) acquirers such as banks (i.e. ICBC, CCB) or third-party payment companies (i.e. Huifu [匯付天下] and Hisun’s SXF [隨行付]), could offer payment solutions to merchants and monetise through payment fees.
Appendix
DBS Asian Insights SECTOR BRIEFING 86
51
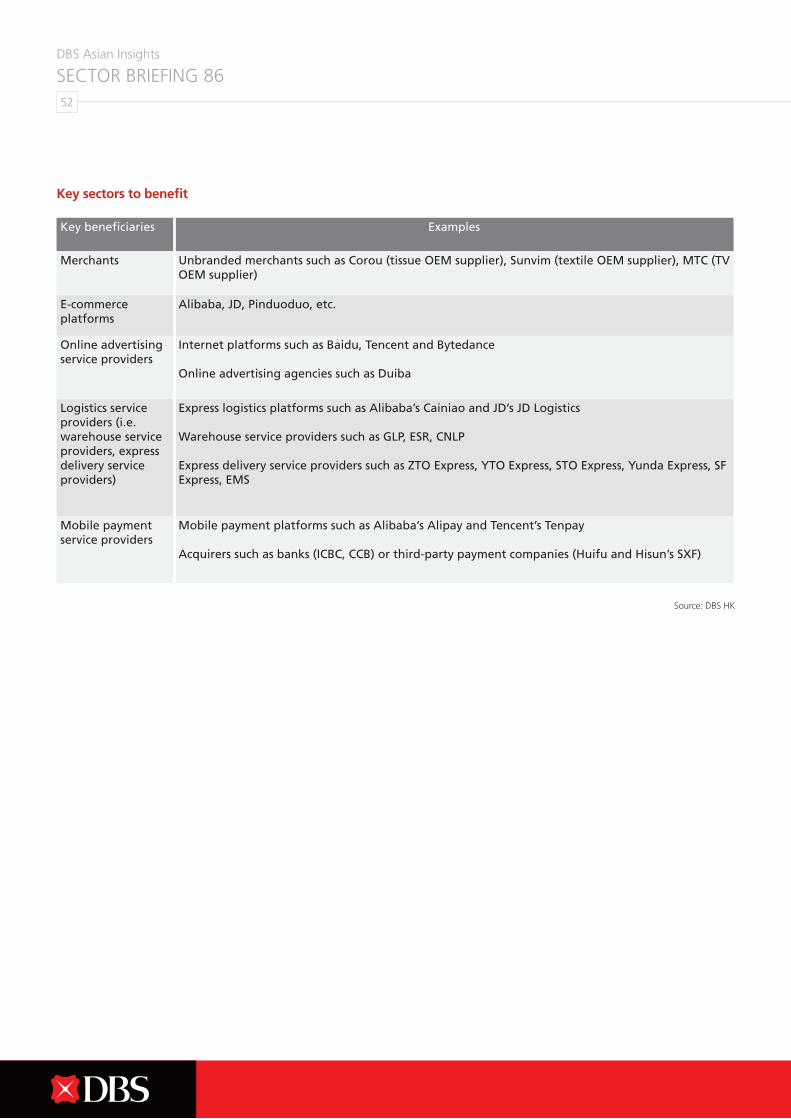
Key sectors to benefit
Source: DBS HK
Key beneficiaries Examples
Merchants Unbranded merchants such as Corou (tissue OEM supplier), Sunvim (textile OEM supplier), MTC (TV OEM supplier)
E-commerce platforms
Alibaba, JD, Pinduoduo, etc.
Online advertising service providers
Internet platforms such as Baidu, Tencent and Bytedance Online advertising agencies such as Duiba
Logistics service providers (i.e. warehouse service providers, express delivery service providers)
Express logistics platforms such as Alibaba’s Cainiao and JD’s JD Logistics Warehouse service providers such as GLP, ESR, CNLP Express delivery service providers such as ZTO Express, YTO Express, STO Express, Yunda Express, SF Express, EMS
Mobile payment service providers
Mobile payment platforms such as Alibaba’s Alipay and Tencent’s Tenpay Acquirers such as banks (ICBC, CCB) or third-party payment companies (Huifu and Hisun’s SXF)
DBS Asian Insights SECTOR BRIEFING 8652

DBS Asian Insights SECTOR BRIEFING 86
53
Disclaimers and Important Notices
The information herein is published by DBS Bank Ltd (the “Company”). It is based on information obtained from sources believed to be reliable, but the Company does not make any representation or warranty, express or implied, as to its accuracy, completeness, timeliness or correctness for any particular purpose. Opinions expressed are subject to change without notice. Any recommendation contained herein does not have regard to the specific investment objectives, financial situation and the particular needs of any specific addressee.
The information herein is published for the information of addressees only and is not to be taken in substitution for the exercise of judgement by addressees, who should obtain separate legal or financial advice. The Company, or any of its related companies or any individuals connected with the group accepts no liability for any direct, special, indirect, consequential, incidental damages or any other loss or damages of any kind arising from any use of the information herein (including any error, omission or misstatement herein, negligent or otherwise) or further communication thereof, even if the Company or any other person has been advised of the possibility thereof.
The information herein is not to be construed as an offer or a solicitation of an offer to buy or sell any securities, futures, options or other financial instruments or to provide any investment advice or services. The Company and its associates, their directors, officers and/or employees may have positions or other interests in, and may effect transactions in securities mentioned herein and may also perform or seek to perform broking, investment banking and other banking or financial services for these companies.
The information herein is not intended for distribution to, or use by, any person or entity in any jurisdiction or country where such distribution or use would be contrary to law or regulation.
DBS Asian Insights SECTOR BRIEFING 86
53

www.dbs.com
Live more, Bank less