dc and ac power supply systems in data centres
TRANSCRIPT
Technical Series, Edition 15DC and AC Power Supply Systems in Data Centres
Totally Integrated Power
www.siemens.com/tip-cs
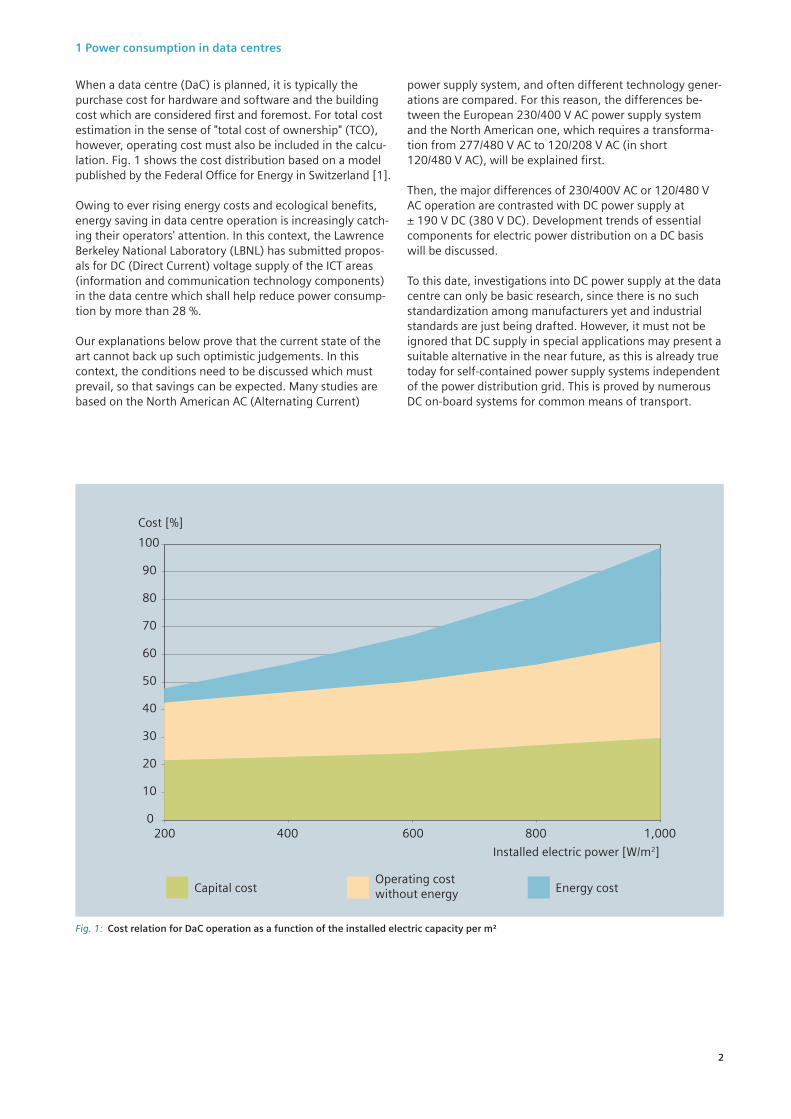
When a data centre (DaC) is planned, it is typically the purchase cost for hardware and software and the building cost which are considered first and foremost. For total cost estimation in the sense of "total cost of ownership" (TCO), however, operating cost must also be included in the calcu-lation. Fig. 1 shows the cost distribution based on a model published by the Federal Office for Energy in Switzerland [1].
Owing to ever rising energy costs and ecological benefits, energy saving in data centre operation is increasingly catch-ing their operators' attention. In this context, the Lawrence Berkeley National Laboratory (LBNL) has submitted propos-als for DC (Direct Current) voltage supply of the ICT areas (information and communication technology components) in the data centre which shall help reduce power consump-tion by more than 28 %.
Our explanations below prove that the current state of the art cannot back up such optimistic judgements. In this context, the conditions need to be discussed which must prevail, so that savings can be expected. Many studies are based on the North American AC (Alternating Current)
1 Power consumption in data centres
power supply system, and often different technology gener-ations are compared. For this reason, the differences be-tween the European 230/400 V AC power supply system and the North American one, which requires a transforma-tion from 277/480 V AC to 120/208 V AC (in short 120/480 V AC), will be explained first.
Then, the major differences of 230/400V AC or 120/480 V AC operation are contrasted with DC power supply at ± 190 V DC (380 V DC). Development trends of essential components for electric power distribution on a DC basis will be discussed.
To this date, investigations into DC power supply at the data centre can only be basic research, since there is no such standardization among manufacturers yet and industrial standards are just being drafted. However, it must not be ignored that DC supply in special applications may present a suitable alternative in the near future, as this is already true today for self-contained power supply systems independent of the power distribution grid. This is proved by numerous DC on-board systems for common means of transport.
Fig. 1: Cost relation for DaC operation as a function of the installed electric capacity per m²
0
10
20
30
40
50
60
70
80
90
100
800600400200 1,000
Cost [%]
Capital costOperating costwithout energy Energy cost
Installed electric power [W/m2]
2
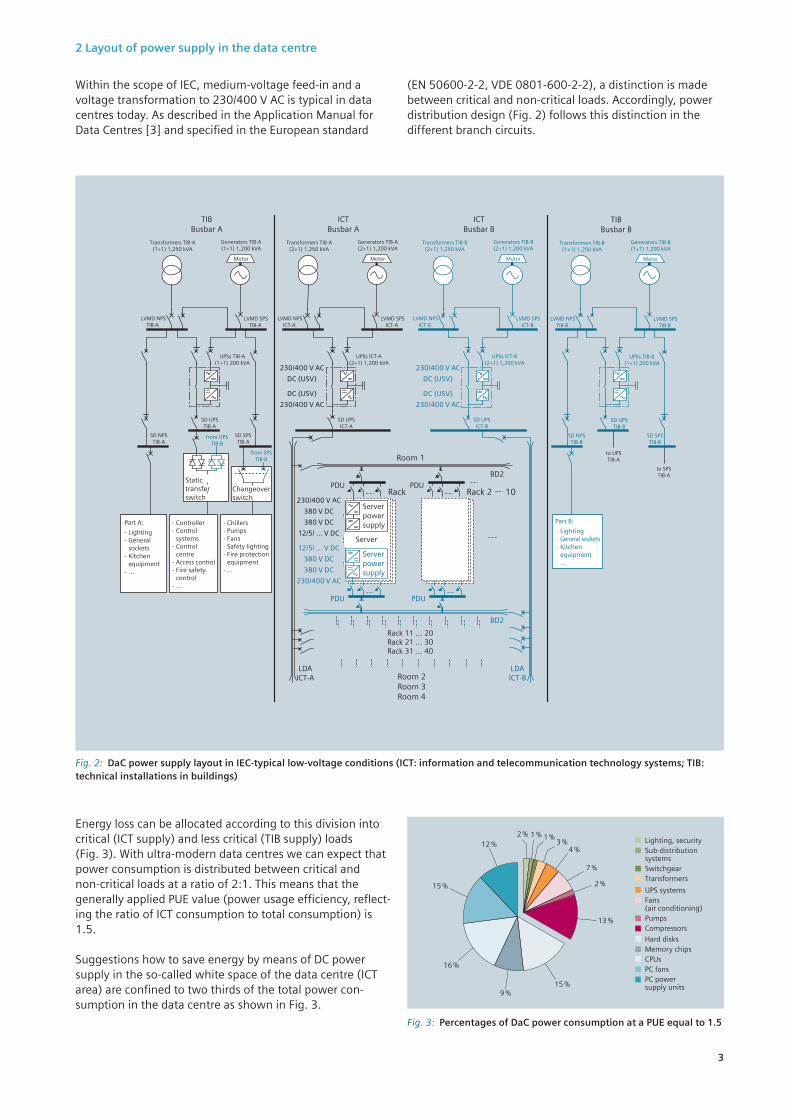
Within the scope of IEC, medium-voltage feed-in and a voltage transformation to 230/400 V AC is typical in data centres today. As described in the Application Manual for Data Centres [3] and specified in the European standard
2 Layout of power supply in the data centre
Fig. 2: DaC power supply layout in IEC-typical low-voltage conditions (ICT: information and telecommunication technology systems; TIB: technical installations in buildings)
LDAICT-A
LDAICT-B
Rack 11 … 20 Rack 21 … 30 Rack 31 … 40
Room 2Room 3Room 4
Rack
Room 1
BD2
BD2
PDU
Server
Serverpowersupply
230/400 V AC
380 V DC
380 V DC
12/5/ ... V DC
PDURack 2 10
PDU
Serverpowersupply
12/5/ ... V DC
380 V DC
380 V DC
230/400 V AC
PDU
230/400 V AC
DC (USV)
DC (USV)
230/400 V AC
230/400 V AC
DC (USV)
DC (USV)
230/400 V AC
ControllerControl systemsControl centreAccess controlFire safety control…
--
-
--
-
ChillersPumpsFansSafety lightingFire protection equipment…
-----
-
Static transfer switch
Changeover switch
Part B:
LightingGeneral socketsKitchen equipment…
---
-
Part A:
LightingGeneralsocketsKitchen equipment…
--
-
-
TIBBusbar A
Transformers TIB-A(1+1) 1,250 kVA
LVMD NPSTIB-A
Generators TIB-A(1+1) 1,200 kVA
Motor
LVMD SPSTIB-A
UPSs TIB-A(1+1) 200 kVA
SD NPSTIB-A
SD SPSTIB-A
from UPSTIB-B
from SPSTIB-B
SD UPSTIB-A
ICTBusbar A
Transformers TIB-A(2+1) 1,250 kVA
LVMD NPSICT-A
Generators TIB-A(2+1) 1,200 kVA
Motor
LVMD SPSICT-A
UPSs ICT-A(2+1) 1,200 kVA
SD UPSICT-A
ICTBusbar B
Transformers TIB-B(2+1) 1,250 kVA
LVMD NPSICT-B
Generators TIB-B(2+1) 1,200 kVA
Motor
LVMD SPSICT-B
UPSs ICT-B(2+1) 1,200 kVA
SD UPSICT-B
to UPSTIB-A
to SPSTIB-A
TIBBusbar B
Transformers TIB-B(1+1) 1,250 kVA
LVMD NPSTIB-B
Generators TIB-B(1+1) 1,200 kVA
Motor
LVMD SPSTIB-B
UPSs TIB-B(1+1) 200 kVA
SD NPSTIB-B
SD SPSTIB-B
SD UPSTIB-B
(EN 50600-2-2, VDE 0801-600-2-2), a distinction is made between critical and non-critical loads. Accordingly, power distribution design (Fig. 2) follows this distinction in the different branch circuits.
Energy loss can be allocated according to this division into critical (ICT supply) and less critical (TIB supply) loads (Fig. 3). With ultra-modern data centres we can expect that power consumption is distributed between critical and non-critical loads at a ratio of 2:1. This means that the generally applied PUE value (power usage efficiency, reflect-ing the ratio of ICT consumption to total consumption) is 1.5.
Suggestions how to save energy by means of DC power supply in the so-called white space of the data centre (ICT area) are confined to two thirds of the total power con-sumption in the data centre as shown in Fig. 3.
12 %
13 %
2 %
7 %
4 %3 %
1 %1 %2 %
15 %
16 %
9 %15 %
Hard disksMemory chipsCPUsPC fansPC power supply units
UPS systemsFans(air conditioning)PumpsCompressors
Lighting, securitySub-distribution systemsSwitchgearTransformers
Fig. 3: Percentages of DaC power consumption at a PUE equal to 1.5
3

The AC power distribution system which is typical in North America is more sophisticated owing to the additional voltage transformation required than the one introduced before, which is common in the IEC world (Fig. 4). In North America, the voltage is transformed from 277/480 V AC to 120/208 V AC (in short 120/480 V AC), before both critical
and less critical loads are supplied. Fig. 2 colour-marks the different voltage levels. It is not surprising that more energy loss is produced with 120/480 V AC, resulting from the additional transformation to a lower AC supply voltage, than in the 230/400 V AC power supply system which is common in Europe.
2.1 Typically North American DaC power supply
Fig. 4: DaC power supply layout for the low-voltage conditions prevailing in North America; differences to the European-type 230/400 V AC supply are marked in red
LDAICT-A
LDAICT-B
Rack 11 … 20 Rack 21 … 30 Rack 31 … 40
Room 2 Room 3 Room 4
Rack
Room 1
ControllerControl systemsControl centreAccess controlFire safety control…
--
-
--
-
ChillersPumpsFansSafety lightingFire protection equipment…
-----
-
Static transfer switch
Changeover switch
BD2
BD2
Part B:
LightingGeneral socketsKitchen equipment…
---
-
Part A:
LightingGeneralsocketsKitchen equipment…
--
-
-
TIBBusbar A
Transformers TIB-A(1+1) 1,250 kVA
LVMD NPSTIB-A
Generators TIB-A(1+1) 1,200 kVA
Motor
LVMD SPSTIB-A
UPSs TIB-A(1+1) 200 kVA
SD NPSTIB-A
SD SPSTIB-A
from UPSTIB-B
from SPSTIB-B
SD UPSTIB-A
ICTBusbar A
Transformers ICT-A(2+1) 1,250 kVA
LVMD NPSICT-A
Generators ICT-A(2+1) 1,200 kVA
Motor
LVMD SPSICT-A
UPSs ICT-A(2+1) 1,200 kVA
SD UPSICT-A
ICTBusbar B
Transformers ICT-B(2+1) 1,250 kVA
LVMD NPSICT-B
Generators ICT-B(2+1) 1,200 kVA
Motor
LVMD SPSICT-B
UPSs ICT-B(2+1) 1,200 kVA
SD UPSICT-B
to UPSTIB-A
to SPSTIB-A
TIBBusbar B
Transformers TIB-B(1+1) 1,250 kVA
LVMD NPSTIB-B
Generators TIB-B(1+1) 1,200 kVA
Motor
LVMD SPSTIB-B
UPSs TIB-B(1+1) 200 kVA
SD NPSTIB-B
SD SPSTIB-B
SD UPSTIB-B
480/277 V AC
DC (USV)
DC (USV)
480/277 V AC
480/277 V AC
DC (USV)
DC (USV)
480/277 V AC
208/120 V AC
380 V DC
380 V DC
12/5/ ... V DC
PDU
12/5/ ... V DC
380 V DC
380 V DC
208/120 V AC
PDU
480/277 V AC
208/120 V AC
Serverpowersupply
Serverpowersupply
PDU PDURack 2 10
Server
4

Standardising the large number of ICT components in data centres (servers, switches, routers, storage arrays, …) is advantageous due to the fact that spare parts keeping, maintenance and replacement will be facilitated. For this reason, data centre operators will rather be willing to have their components in the white space (rooms containing ICT equipment) supplied by direct voltage when it comes to planning DaC extensions if suitable hardware is offered on favourable terms. In case of TIB equipment, the item num-bers are much lower and DC supply of individual compo-nents can consequently be implemented on much less favourable terms.
ICT component manufacturers have gained ample DC experience from the telecommunications sector. But the technical building installations of telecommunication facili-ties were frequently supplied by alternating voltage, and over the years, the widespread distribution and easy han-dling of AC-supplied telecommunication servers and other ICT components have led to a drastic decline of DC-supplied telecommunication facilities.
Re-introducing DC power supply for ICT equipment shall now help cutting cost of DaC power consumption. Studies about DC power supply in data centres as well as in testing facilities and IT show rooms normally use a much higher DC voltage than the voltages common in telecommunications (48 or 60 V DC). For a number of server series and quite a few more components, the conversion to different voltages will be enabled by various power supply modules. However, there is no standardisation yet as to the DC input voltage, so that equipment manufacturers have not yet been able to offer equipment with standardized framework parameters. Consequently, data centre operators cannot apply uniform technology systems.
In order to demonstrate differences between voltage sys-tems, normal AC supply for the ICT part of a data centre will be replaced by a DC supply system with ± 190 V DC (380 V DC, see Fig. 5). The left section shows 230/400 V AC power supply (see Fig. 2) as it is typical in Europe and the right one 120/480 V AC as common in North America (see Fig. 4).
2.2 DC power supply for server rooms in the data centre
Fig. 5: DaC power supply layout for the white space, differences between AC and DC being identified – see left for the European AC power supply system and right for the North American power supply system. (The bypass line is usually not considered for DC supply, therefore it will be marked by a question mark in the comparison. You must, however, bear in mind that it does play a part in uptime assessments.)
?
?
?
?
?
?
?
?
LDAICT-A
LDAICT-B
Rack 11 … 20 Rack 21 … 30 Rack 31 … 40
Room 2Room 3Room 4
Rack
Room 1
BD2
BD2
Europe / ICTBusbar A
Transformers ICT-A(n+1)
LVMD NPSICT-A
Generators ICT-A(n+1)
Motor
LVMD SPSICT-A
UPS's ICT-A(n+1)
SD UPSICT-A
Europe / ICTBusbar B
Transformers ICT-B(n+1)
LVMD NPSICT-B
Generators ICT-B(n+1)
Motor
LVMD SPSICT-B
UPS's ICT-B(n+1)
SD UPSICT-B
PDU
Server
Serverpowersupply380 V DC
12/5/ ... V DC
PDURack 2 10
PDU
Serverpowersupply
12/5/ ... V DC
380 V DC
PDU
230/400 V AC
+/- 190 V DC
230/400 V AC
+/- 190 V DC
LDAICT-A
LDAICT-B
Rack 11 … 20 Rack 21 … 30 Rack 31 … 40
Room 2Room 3Rom 4
Rack
Room 1
BD2
BD2
North America / ICTBusbar A
Transformers ICT-A(n+1)
Generators ICT-A(n+1)
Motor
UPS's ICT-A(n+1)
SD UPSICT-A
North America / ICTBusbarg B
Transformers ICT-B(n+1)
Generators ICT-B(n+1)
Motor
UPS's ICT-B(n+1)
SD UPSICT-B
PDU
Server
Serverpowersupply380 V DC
12/5/ ... V DC
PDURack 2 10
PDU
Serverpowersupply
12/5/ ... V DC
380 V DC
PDU
480/277 V AC
+/- 190 V DC
480/277 V AC
+/- 190 V DC
480Y/277V AC
208Y/120V AC
LVMD NPSICT-A
LVMD SPSICT-A
LVMD NPSICT-B
LVMD SPSICT-B
5

Comparison of AC- and DC-fed power supply systems in the data centre
The agreement relating to the Kyoto Protocol [4], which came into force internationally in February 2005, lays down binding reduction goals for the emission of greenhouse gases. Consequently, many industrial countries have identi-fied energy saving as the most important leverage for achieving these goals. Since data centres are considered responsible for about one percent of the total global power consumption [5], manufacturers and operators have initi-ated a run for the highest level of efficiency.
Unfortunately, it is often forgotten in this context which framework parameters have lead to the results gained, and which further advantages and disadvantages need to be exploited and kept in mind respectively. Owing to the complexity of DaC operation, no detailed scientific treatise shall be presented here, but a qualitative assessment of findings relating to DC voltage supply.
Efficiency evaluation for DC and AC power supply
The previously mentioned comparison performed by LNBL [2] not only specified this widely quoted value of 28.2 % energy saved in favour of DC voltage supply to the data centre, but also values such as 5 % and 7 %. These consider-ably lower values naturally raise questions as to the cost and benefit of a doubled supply technology featuring DC as well as AC.
This high value of 28.2 % could only be obtained, because completely different approaches were chosen for AC and DC:
• Older UPS technology in case of AC supply using an out-put transformer (efficiency of only 85 %)
• AC power supply according to the North American system including an additional transformation from 277/480 V AC to 120/208 V AC and a corresponding voltage step-up when rectifying 120/208 V AC to 380 V DC
• Based on real-application products of the years 2007/2008 (73 % efficiency), servers with AC power sup-ply units were compared to newly developed servers with high-efficiency DC power supply units
The values specified for AC technology are typical for an equipment mix, as it was in use in 2008. Compared to the
state of the art in 2008, this data is clearly less favourable. Moreover, the LBNL approach in [2] neglects all of the other energy losses in the process chain of DaC power supply so that the percentage difference gets numerically extremely high. In terms of figures, it is not the entire DaC power supply system which is assessed, but only its different components. For a comparison based on equal conditions, the current state of the art will always be considered for the systems under assessment in the following sections.
In double-converter mode, AC-type UPS systems today attain 95 % efficiency and better [6], and this is true for a degree of utilisation which ranges from about 40 % to 100 % of the nominal capacity. Even with small rack-type UPS devices, the efficiency in double-converter mode is already above 90 %.
With the new UPS operating modes – which rather monitor than convert power supply – even fewer losses are possible. Similar levels of efficiency, meaning 96 % to 99 % maxi-mum, are common for DC-type UPS systems, so that the difference between AC- and DC-type UPS systems should be about one to four percentage points at most. It goes with-out saying that this, too, only applies to the current top-notch technology versions of DC-type UPS systems.
6

Tab. 1: Minimum level of efficiency for AC power supplies according to 80 PLUS
Minimum efficiency at a given voltage and load
Voltagenot internally redundant internally redundant
Certificate10 % load 20 % load 50 % load 100 % load 10 % load 20 % load 50 % load 100 % load
230 V
- 82 % 85 %1 82 % not specified 80 PLUS
- 85 % 88 %1 85 % - 81 % 85 %1 81 % 80 PLUSBronze
- 87 % 90 %1 87 % - 85 % 89 %1 85 % 80 PLUSSilver
- 90 % 92 %1 89 % - 88 % 92 %1 88 % 80 PLUSGold
- 92 % 94 %1 90 % - 90 % 94 %2 91 % 80 PLUSPlatinum
90 % 94 %2 96 % 94% 90 % 94 %2 96 % 91 % 80 PLUSTitanium
Voltagenot internally redundant Industry
Certificate10 % load 20 % load 50 % load 100 % load 10 % load 25 % load 50 % load 100 % load
115 V
- 80 % 80 % 80 %1 not specified 80 PLUS
- 82 % 85 %1 82 % not specified 80 PLUSBronze
- 85 % 88 %1 85 % 80 % 85 %1 88 % 85 % 80 PLUSSilver
- 87 % 90 %1 87 % 82 % 87 %1 90 % 87 % 80 PLUSGold
- 90 % 92 %2 89 % 85 % 90 %2 92 % 90 % 80 PLUSPlatinum
90 % 92 %2 94% 90 % not specified 80 PLUSTitanium
1 Power factor correction (PFC) to 0.90 2 Power factor correction (PFC) to 0.95
Power supply units have faced a similar development in terms of converter efficiency. Labelling according to the 80 PLUS specifications [7] documents this trend (see Tab. 1). The data given by Hewlett Packard about the "Com-mon Slot Power Supplies" (power supply modules which can be plugged into a server slot) show that losses between 380 V DC power supplies [8] and 230 V AC types in accord-ance with 80 PLUS Platinum are virtually identical (about 94 % efficiency at a 50 % load). In comparison with 80 PLUS Gold the DC power supply unit features two percentage points less loss. This means when ultra-efficient compo-nents are used, the differences between AC and DC power supplies are insignificant.
A general assessment of differences in efficiency must bear in mind that only about 30 % of the power supply unit loss can be accounted to the AC/DC conversion in the supply unit. Mathematically, a 380 V DC power supply unit loaded with 20 % to 100 % may be four percentage points better than a power supply unit featuring 80 PLUS Gold (30 % of the 12 % losses for a 80 PLUS Gold AC power supply unit means 92 % efficiency of the DC power supply unit).
All in all, 50 % load for the DC power supply (UPS + power supply unit) returns efficiency benefits of one to six percent-age points (UPS: 1 % - 4 %¸DC power supply unit compared to 80 PLUS Gold: 2 %).
7

Fig. 6: Comparison of DaC power supply systems using the "Power Configuration Efficiency Estimator" provided by The Green Grid (http://greengrid.froginteractive.com/pcc)
83 %
90 %
91 %
88 %
84 %
85 %
89 %
86 %
87 %
0 % 10 % 90 %80 % 100 %20 % 70 %60 %50 %40 %30 %
Effi
cien
cy
Load
480 V AC - 120 V AC (AC/AC double-conversion UPS; AC-PDU with transformer 408Y/277V to 208Y/120V; AC/DC power supply unit)
480 V AC - 380 V DC (AC/DC rectifier; DC/DC power supply unit)
400 V AC - 230 V AC (AC/AC double-conversion UPS; AC/DC power supply unit)
< 3 %
< 2 %
The efficiency curves given by The Green Grid relating to the three above described power supply layouts using state-of-the-art technology have been entered in Fig. 6. The maxi-mal deviations between them are indicated in percent. The following systems were compared:
• European system: 230/400 V AC with state-of-the-art dou-ble-converter UPS technology and AC/DC power supplies with a comparable technological level as DC/DC power supplies ("The Green Grid Best Known 1Q10")
• North American system: 120/480 V AC with state-of-the-art double-converter UPS technology, a PDU which is transformed from 277/480 V AC to 120/208 V AC, and AC/DC power supplies with a comparable technological level as DC/DC power supplies ("The Green Grid" corre-sponding to [8])
• DC system with rectification of 480 V AC to 380 V DC and conversion of the 380 V DC supply voltage to the DC sup-ply voltages of the power supplies
In the performance range above 20 %, the end-to-end efficiency levels differ by a mere 3 percentage points. Here it becomes evident that the difference between the two AC supply solutions (120/480 V AC and 230/400 V AC) is largely determined by the transformer integrated in the PDU. For DC power supply there remains an efficiency advantage of max. 2 percentage points as compared to 230/400 V AC power supply if comparable technological standards are contrasted. As noted before, the total consumption assum-ing a PUE of 1.5 is only reduced by approximately one percentage point.
The Green Grid initiative already published an instructive efficiency analysis for various power supply systems in data centres in 2008 [9]. To complement this analysis, they also provide an online simulation of these power supply systems at http://greengrid.froginteractive.com/pcc (Fig. 6).
The findings confirm our previous judgements. The quality of the products applied can often contribute more to energy saving than the type of power supply system itself.
8
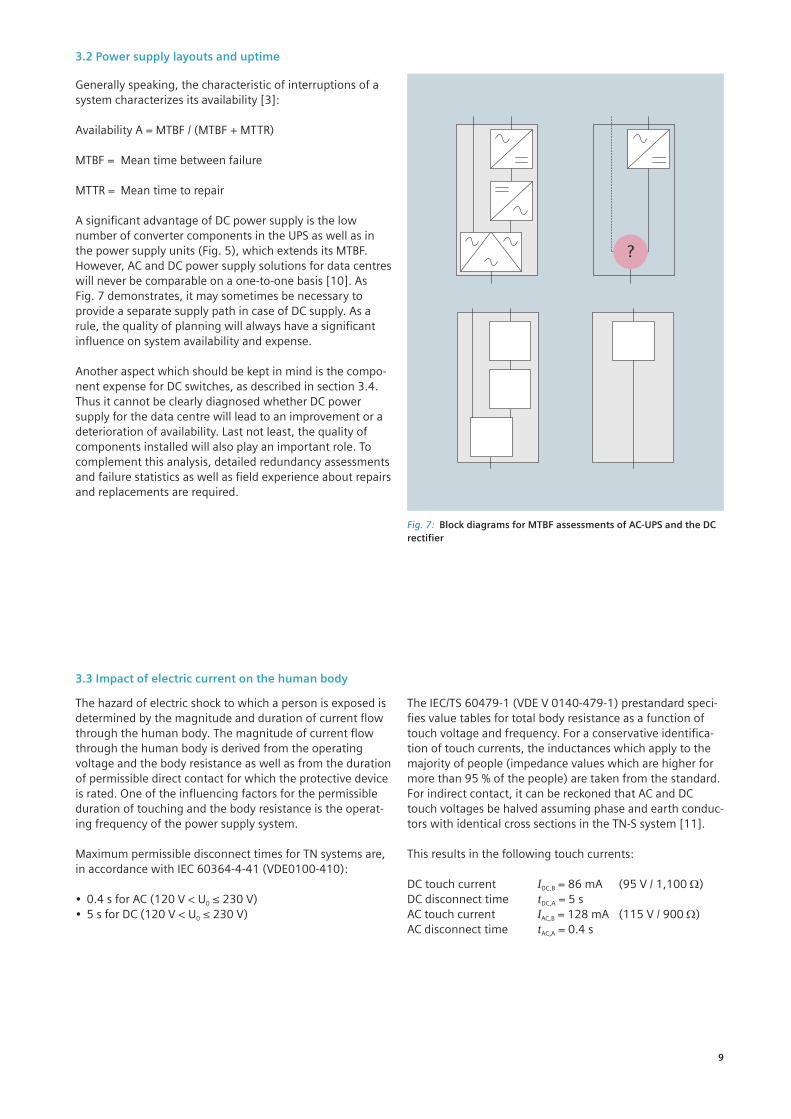
3.2 Power supply layouts and uptime
Generally speaking, the characteristic of interruptions of a system characterizes its availability [3]:
Availability A = MTBF / (MTBF + MTTR)
MTBF = Mean time between failure
MTTR = Mean time to repair
A significant advantage of DC power supply is the low number of converter components in the UPS as well as in the power supply units (Fig. 5), which extends its MTBF. However, AC and DC power supply solutions for data centres will never be comparable on a one-to-one basis [10]. As Fig. 7 demonstrates, it may sometimes be necessary to provide a separate supply path in case of DC supply. As a rule, the quality of planning will always have a significant influence on system availability and expense.
Another aspect which should be kept in mind is the compo-nent expense for DC switches, as described in section 3.4. Thus it cannot be clearly diagnosed whether DC power supply for the data centre will lead to an improvement or a deterioration of availability. Last not least, the quality of components installed will also play an important role. To complement this analysis, detailed redundancy assessments and failure statistics as well as field experience about repairs and replacements are required.
Fig. 7: Block diagrams for MTBF assessments of AC-UPS and the DC rectifier
?
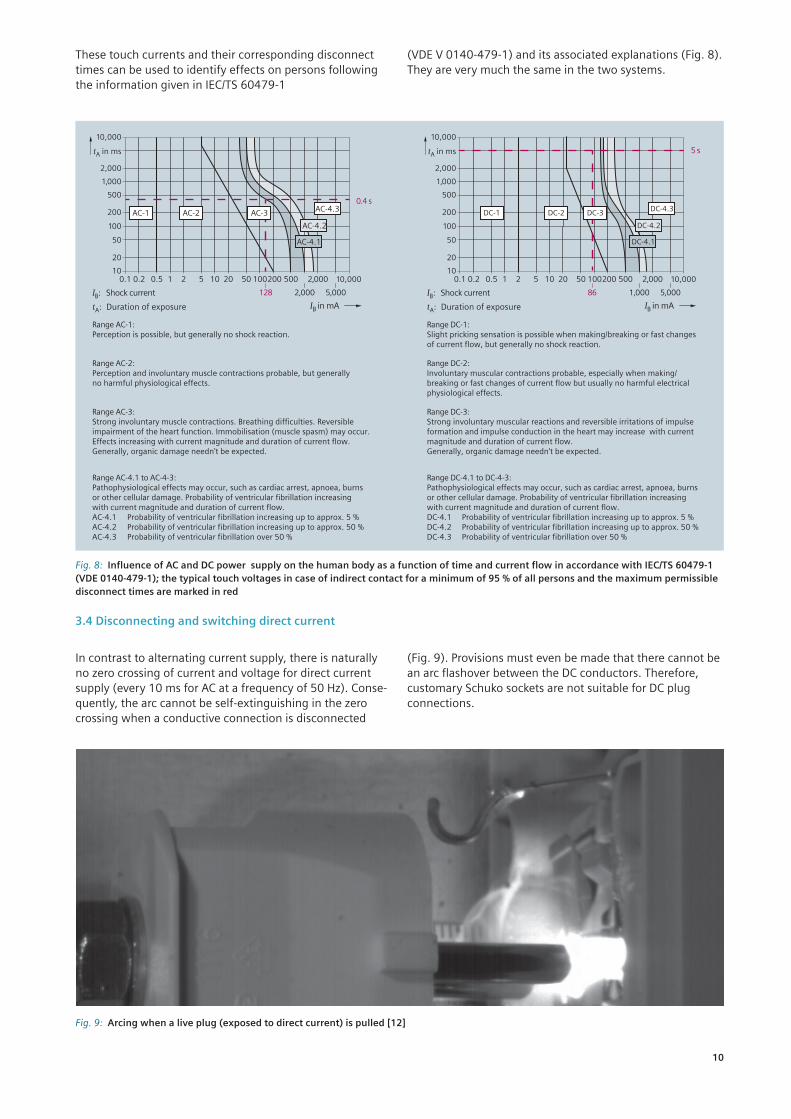
3.3 Impact of electric current on the human body
The hazard of electric shock to which a person is exposed is determined by the magnitude and duration of current flow through the human body. The magnitude of current flow through the human body is derived from the operating voltage and the body resistance as well as from the duration of permissible direct contact for which the protective device is rated. One of the influencing factors for the permissible duration of touching and the body resistance is the operat-ing frequency of the power supply system.
Maximum permissible disconnect times for TN systems are, in accordance with IEC 60364-4-41 (VDE0100-410):
• 0.4 s for AC (120 V < U0 ≤ 230 V)• 5 s for DC (120 V < U0 ≤ 230 V)
The IEC/TS 60479-1 (VDE V 0140-479-1) prestandard speci-fies value tables for total body resistance as a function of touch voltage and frequency. For a conservative identifica-tion of touch currents, the inductances which apply to the majority of people (impedance values which are higher for more than 95 % of the people) are taken from the standard. For indirect contact, it can be reckoned that AC and DC touch voltages be halved assuming phase and earth conduc-tors with identical cross sections in the TN-S system [11].
This results in the following touch currents:
DC touch current IDC,B = 86 mA (95 V / 1,100 W) DC disconnect time tDC,A = 5 s AC touch current IAC,B = 128 mA (115 V / 900 W) AC disconnect time tAC,A = 0.4 s
9
In contrast to alternating current supply, there is naturally no zero crossing of current and voltage for direct current supply (every 10 ms for AC at a frequency of 50 Hz). Conse-quently, the arc cannot be self-extinguishing in the zero crossing when a conductive connection is disconnected
3.4 Disconnecting and switching direct current
Fig. 9: Arcing when a live plug (exposed to direct current) is pulled [12]
These touch currents and their corresponding disconnect times can be used to identify effects on persons following the information given in IEC/TS 60479-1
Fig. 8: Influence of AC and DC power supply on the human body as a function of time and current flow in accordance with IEC/TS 60479-1 (VDE 0140-479-1); the typical touch voltages in case of indirect contact for a minimum of 95 % of all persons and the maximum permissible disconnect times are marked in red
2,000
2,000 5,000
0.1 0.2 0.5 1 2 5 10 20 50 100200 500
10,000
2,000
1,000
500
200
100
50
20
10,000
AC-4.1
AC-1 AC-3AC-2
AC-4.2
AC-4.3
Range AC-1:Perception is possible, but generally no shock reaction.
Range AC-2:Perception and involuntary muscle contractions probable, but generally no harmful physiological effects.
Range AC-3:Strong involuntary muscle contractions. Breathing difficulties. Reversible impairment of the heart function. Immobilisation (muscle spasm) may occur.Effects increasing with current magnitude and duration of current flow.Generally, organic damage needn't be expected.
Range AC-4.1 to AC-4-3:Pathophysiological effects may occur, such as cardiac arrest, apnoea, burns or other cellular damage. Probability of ventricular fibrillation increasingwith current magnitude and duration of current flow.AC-4.1 Probability of ventricular fibrillation increasing up to approx. 5 %AC-4.2 Probability of ventricular fibrillation increasing up to approx. 50 %AC-4.3 Probability of ventricular fibrillation over 50 %
IB: Shock current
tA: Duration of exposure IB in mA
tA in ms
102,000
1,000 5,000
0.1 0.2 0.5 1 2 5 10 20 50 100200 500
10,000
2,000
1,000
500
200
100
50
20
10,000
Range DC-1:Slight pricking sensation is possible when making/breaking or fast changes of current flow, but generally no shock reaction.
Range DC-2:Involuntary muscular contractions probable, especially when making/breaking or fast changes of current flow but usually no harmful electrical physiological effects.
Range DC-3:Strong involuntary muscular reactions and reversible irritations of impulse formation and impulse conduction in the heart may increase with current magnitude and duration of current flow. Generally, organic damage needn‘t be expected.
Range DC-4.1 to DC-4-3:Pathophysiological effects may occur, such as cardiac arrest, apnoea, burns or other cellular damage. Probability of ventricular fibrillation increasing with current magnitude and duration of current flow.DC-4.1 Probability of ventricular fibrillation increasing up to approx. 5 %DC-4.2 Probability of ventricular fibrillation increasing up to approx. 50 %DC-4.3 Probability of ventricular fibrillation over 50 %
IB: Shock current
tA: Duration of exposure IB in mA
tA in ms
10
DC-1 DC-3DC-2 DC-4.3
DC-4.1
DC-4.2
0.4 s
5 s
128 86
(VDE V 0140-479-1) and its associated explanations (Fig. 8). They are very much the same in the two systems.
(Fig. 9). Provisions must even be made that there cannot be an arc flashover between the DC conductors. Therefore, customary Schuko sockets are not suitable for DC plug connections.
10

Fig. 10: Arc length and arcing energy for various DC voltages and 230 V AC [12]
0 2 164 14121086
100
0
90
70
10
20
80
30
60
0 2 164 14121086
50
40
Arc
len
gth
in m
m
Current in A
Arc
ing
en
erg
y in
J
Current in A
48 V DC230 V AC
120 V DC
230 V DC
326 V DC
48 V DC230 V AC
120 V DC
230 V DC
326 V DC
16.0
0.0
14.0
10.0
2.0
4.0
12.0
6.0
8.0
Test results show that an arc will be present for a longer period of time at 230 V DC and that significantly more energy will be transformed (in a fault, risk of fire) than with
230 V AC (Fig. 10). In case of a current of 16 A being pres-ent, the arc will be approximately six times as long and the arcing energy will be twelve times as great [12].
Moreover, it may happen with high voltages and high currents being present, that the arc breaks away from the plug contacts when the plug is pulled and continues to burn in a curved form between the contacts inside the socket. For this reason, the customary Schuko socket is no solution for DC power supply. Manufacturer-specific solutions for plug-gable DC connectors in high-voltage environments are available. But in such conditions, a switching operation is often performed first, before an arrester mechanism is released so that the plug can be pulled off. This influence on cost and availability is neglected.
In principle, mechanical AC protection switches with arcing chambers (as well as fuses for protection) can be used for switching operations in DC distribution systems. Owing to their higher arcing energy and the greater arc lengths additional means of protection are required to ensure safe arc quenching. As an alternative, electronic switches can be employed. But they do not provide any electric isolation and will cause loss in normal operation. By means of combining mechanical and electronic switches in so-called hybrid switches [13] advantage shall be taken of each technology and disadvantages be minimized (Fig. 11).
Fig. 11: Schematic diagram of a hybrid switch for 380 V DC
E
G
CUd
id
UAF
S1
S3
S2
+
-
11
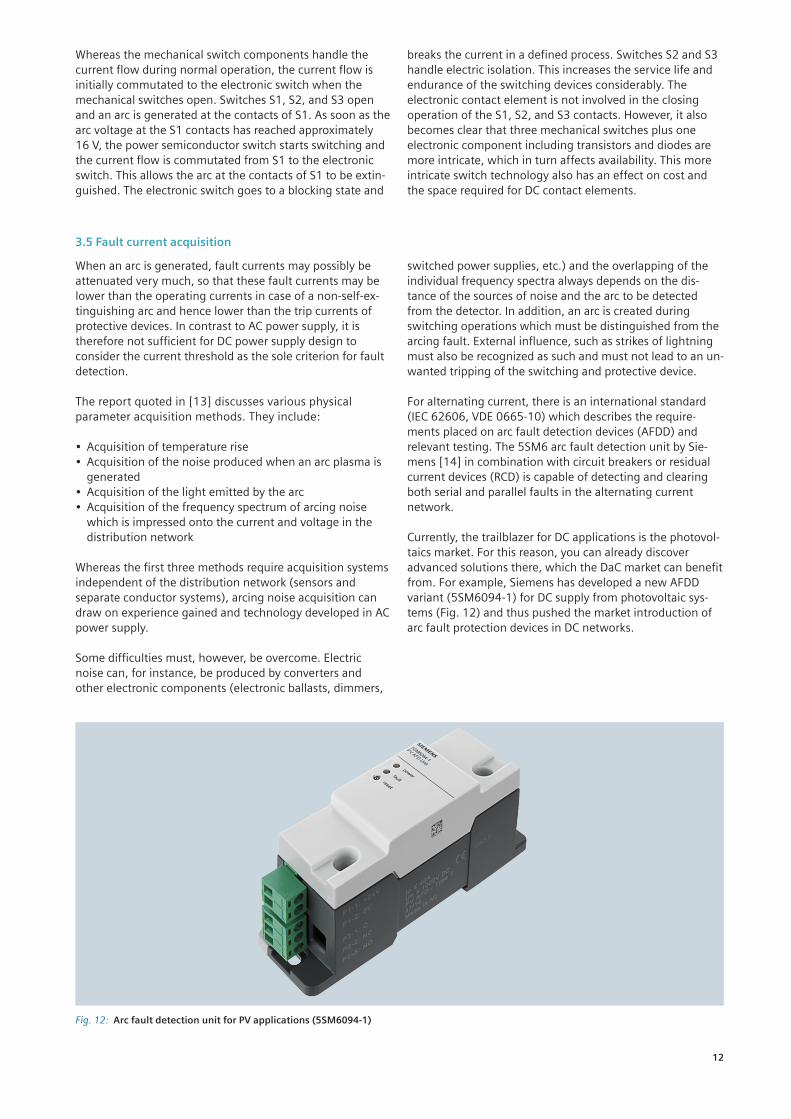
Fig. 12: Arc fault detection unit for PV applications (5SM6094-1)
Whereas the mechanical switch components handle the current flow during normal operation, the current flow is initially commutated to the electronic switch when the mechanical switches open. Switches S1, S2, and S3 open and an arc is generated at the contacts of S1. As soon as the arc voltage at the S1 contacts has reached approximately 16 V, the power semiconductor switch starts switching and the current flow is commutated from S1 to the electronic switch. This allows the arc at the contacts of S1 to be extin-guished. The electronic switch goes to a blocking state and
breaks the current in a defined process. Switches S2 and S3 handle electric isolation. This increases the service life and endurance of the switching devices considerably. The electronic contact element is not involved in the closing operation of the S1, S2, and S3 contacts. However, it also becomes clear that three mechanical switches plus one electronic component including transistors and diodes are more intricate, which in turn affects availability. This more intricate switch technology also has an effect on cost and the space required for DC contact elements.
When an arc is generated, fault currents may possibly be attenuated very much, so that these fault currents may be lower than the operating currents in case of a non-self-ex-tinguishing arc and hence lower than the trip currents of protective devices. In contrast to AC power supply, it is therefore not sufficient for DC power supply design to consider the current threshold as the sole criterion for fault detection.
The report quoted in [13] discusses various physical parameter acquisition methods. They include:
• Acquisition of temperature rise• Acquisition of the noise produced when an arc plasma is
generated• Acquisition of the light emitted by the arc• Acquisition of the frequency spectrum of arcing noise
which is impressed onto the current and voltage in the distribution network
Whereas the first three methods require acquisition systems independent of the distribution network (sensors and separate conductor systems), arcing noise acquisition can draw on experience gained and technology developed in AC power supply.
Some difficulties must, however, be overcome. Electric noise can, for instance, be produced by converters and other electronic components (electronic ballasts, dimmers,
switched power supplies, etc.) and the overlapping of the individual frequency spectra always depends on the dis-tance of the sources of noise and the arc to be detected from the detector. In addition, an arc is created during switching operations which must be distinguished from the arcing fault. External influence, such as strikes of lightning must also be recognized as such and must not lead to an un-wanted tripping of the switching and protective device.
For alternating current, there is an international standard (IEC 62606, VDE 0665-10) which describes the require-ments placed on arc fault detection devices (AFDD) and relevant testing. The 5SM6 arc fault detection unit by Sie-mens [14] in combination with circuit breakers or residual current devices (RCD) is capable of detecting and clearing both serial and parallel faults in the alternating current network.
Currently, the trailblazer for DC applications is the photovol-taics market. For this reason, you can already discover advanced solutions there, which the DaC market can benefit from. For example, Siemens has developed a new AFDD variant (5SM6094-1) for DC supply from photovoltaic sys-tems (Fig. 12) and thus pushed the market introduction of arc fault protection devices in DC networks.
3.5 Fault current acquisition
12
As long as the product-technical expense for the individual components in AC and DC power supply systems remains disregarded and the efficiency of the latest state-of-the-art equipment and systems is compared to ordinary standard equipment and systems currently in use, cost and uptime benefits of DC power supply can be calculated.
The white space in owner/operator-used data centres pro-vides the ideal test platform, since access needs to be granted to qualified authorized personnel only and well-matched, uniform product series can be used. If the addi-tional expense for safe power distribution and a system doubling for DC side by side with AC outside the white space also needs to be taken into account, a widespread shift to DC power supply cannot yet be foreseen today.
The path of development towards a DC power supply struc-ture has been explored and new products, such as AFDDs
4 Conclusion
are pushing into the market. However, more field experi-ence from projects implemented so far is urgently required. Often, tangible results relating to verifiable advantages and encountered problems are hardly made known after the project was started. Findings are limited to computational results from studies and estimations.
Manufacturers of DC switching products and DC-capable ICT equipment want to present their new technology in a most favourable light by means of efficiency advantages and try to bracket out possible problems encountered in the field. But it is so much more important to offer holistic solutions which are smart and well thought through – for AC and DC applications alike – which cover the entire project cycle from planning through installation and operation to maintenance and servicing. You can talk to your TIP contact partner about specific solutions that match your case of application.
Bibliography:
[1] Stromeffiziente Rechenzentren durch Sensibilisierung über eine transparente Kostenrechnung, Bundesamt für Energie BFE, Switzerland, 2008
[2] DC Power for Improved Data Center Efficiency, Lawrence Berkeley National Laboratory, 2008
[3] Application Models for Electric Power Distribution – Data Centres, Siemens AG, 2013
[4] Kyoto Protocol to the United Nations Framework Conven-tion on Climate Change, Secretariat of the Climate Frame-work Convention, 1998
[5] Zukunftsmarkt energieeffiziente Rechenzentren, Umweltbundesamt UBA, 2007
[6] Chloride Trinergy Uniterruptible Power Supply Installa-tion Manual – 10H52194IM10 rev. 2, Emerson Network Power, 2013
[7] Official website of the 80 PLUS program: www.plugloadsolutions.com
[8] HP Common Slot power supply technology, Hewlett-Packard Development Company, 2014
[9] Quantitative efficiency analysis of power distribution configurations for data centers, The Green Grid, 2008
[10] Is the DC powered data centre really more energy effi-cient? A European perspective, Ian F Bitterlin, 2008
[11] VDE 0100 und die Praxis; Kiefer, Schmolke, 2014
[12] DC-Installation. Different Hazards Regarding Thermal Effects and Electrical Shock, A. Welsch, 2011 at the LVDC Workshop of IEC/DKE
[13] Report on State of the Art Grid Technology (e. g. arc detection), DCC+G consortium, 2013
[14] Brandschutzschalter 5SM6 – Technikfibel, Siemens AG, 2012
Further information: Siemens AG
Ingo Englert
www.siemens.com/tip-cs
i
13
Siemens AG Energy Management Medium Voltage & Systems Mozartstr. 31 c 91052 Erlangen Germany
E-mail: [email protected]
Subject to change without prior notice • 06/15 © 2015 Siemens AG • All rights reserved.
www.siemens.com/tip-cs
The information in this brochure only includes general descriptions and/or performance characteristics, which do not always apply in the form described in a specific applica-tion, or which may change as products are developed. The required performance characteristics are only binding if they are expressly agreed at the point of conclusion of the contract.
All product names may be trademarks or product names of Siemens AG or supplier companies; use by third parties for their own purposes could constitute a violation of the own-er‘s rights.
14