ddp school demographics conference - gisetc
TRANSCRIPT

With Your Name Here
Using GIS in the Classroom

GIS Transforms Students into 21st Century Learners while Stimulating Teachers to Become Highly Qualified
Roger & Anita Palmer
GISetc
www.gisetc.com

Schools spend a good deal of money on technology.
• Projects attempted should justify this expense
• Not just better looking work but work that could only be possible without these tools
• Stakeholders should be proud of work you do

Students spend a lot of time online
• Kaiser Family Foundation recently reported that an average student spends 7 ½ hours online based on surveys of 2000 students from across the country
• Because of multitasking they actually stream over 10 hours of media daily
• Media browsing has a slight negative correlation to school performance and direct relation to risky behaviors

Some ask what impact technology use produces in us

“Raising the Bar” highly valued skills in business
• Analyze and solve complex problems 79%• Connect actions to ethical decisions 75%• Collaborate with others in diverse group settings 71%• Innovate and be creative 70%• Implement developments in science and technology 70%• Organize and evaluate info from multiple sources 70%
Hart Research Associates study of 300 business owners hiring over 25 employees

What should technology assisted learning look like?
• Challenging
• Fun and inspiring
• Give progressive feedback that they are on track with finding patterns
• Invite discussion / collaboration
• Require data to test hypothesis
• Address problems students feel are real or important

How is GIS well suited for the challenges facing education?
• GIS is a critical thinking platform
• Critical thinking is a lifelong professional skill
• Makes quick sense of tedious amounts of data
• Listed as one of top 3 job growth areas
• Facilitates networks to people in the know

GIS effectively visualizes, analyzes, and models academic content
• Science – probeware, imagery, gps
• Math – tables, graphs, coordinates
• Language Arts – sense of place for literature/writing/lit critique
• Social Studies – demographics, politics, economics, culture, historical imagery
• Physical Education – hiking, biking, geocaching, photography, lifetime sports
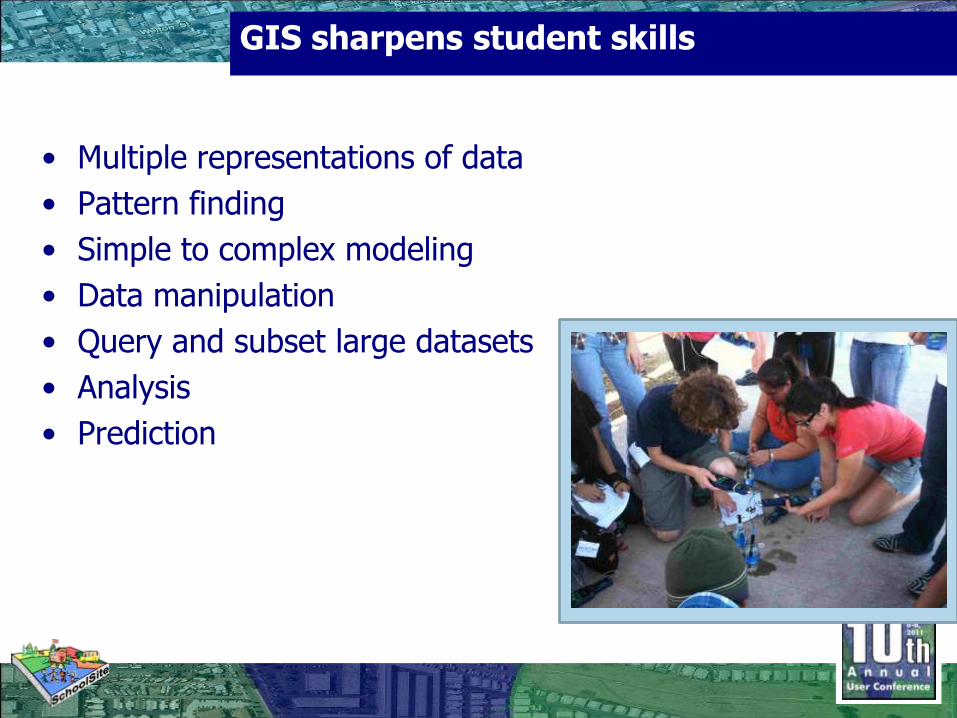
GIS sharpens student skills
• Multiple representations of data
• Pattern finding
• Simple to complex modeling
• Data manipulation
• Query and subset large datasets
• Analysis
• Prediction

GIS assesses student understanding
• Source of blackline master maps
• Real life problem solving
• Data based argumentation
• Solve Scenarios
• Create Data Mashups
How Do You Assess Your Students…
Are they creating data based arguments?
Are they asking their own questions?
Do they recommend or set up their own
experiments?
…

GIS helps students understand inquiry
• Hypothesize
• Experiment design
• Data gathering
• Analysis
• Check hypothesis
• Conclusion
• Graphic layout reports
{Insert Student Poster from Earth
Science Class.}

GIS appeals to multiple learning styles
• Myers Briggs E/I N/P T/F P/J
• Visual, Auditory,Tactile
• Gardner’s: Visual, Aural, Verbal, Kinesthetic, Mathematical, Social, Solitary, Natural
• Kolb: concrete-abstract, random-sequential
reflect observe-active experiment

GIS in PD helps make teachers highly effective
• Wholistic
• Interdisciplinary
• Engaging for teachers
• Creates new contexts for teachers specialty
• Way to see content differently
• Teach with primary source data
GIS has changed the way
I will teach. It has made
me excited about my sub-
ject in a much deeper way!
Tisha Giddes
5th yr teacher Killeen, TX
I am having an absolute
blast teaching with this
software.
Mike Monson
20 yrs experience
Center, ND

Academic Content Investigated
•

Grabbing Current Data


• MRData Soil Chemistry to see evidence of natural history forces of continental formation
• Understand growing regions
• Illustrate irrigation issues in the arid west
Other Science Stories


Pairing these map sources to teach natural history and evolution

• What makes south and central America such strong centers of speciation??

The elevation uniformity makes it more sensitive to climate changes in recent glacial
times forming pocket biomes isolated from each other. Isolated vascular plants have
opportunities to evolve separately when wetter times rejoin the rainforest fragments.

http://www.scotese.com/earth.htm
The central American isthmus arose slowly as island chains forming
a competitive advantage for flowering plants able to migrate before
other plants or predators.

• Compare these to locally measured variables with probeware such as PASCO, Vernier, or Fourier
Weatherunderground.com
Weather Mapping

Climate
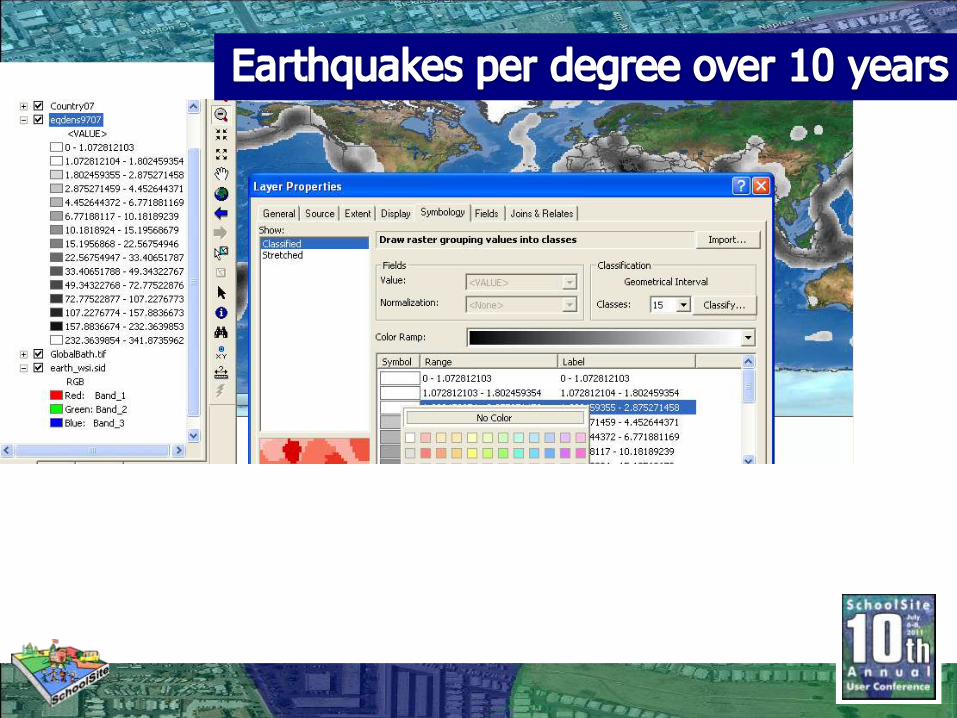
• Rainfall data from NASA Earth Observation

Grid Data can be added, Subtracted, Divided…

Questions of drought or global warming can be addressed with certainty

• Weatherunderground, weather.com
• Dust measurements from NEO
• Toxic Release maps (national atlas)
Air Quality Measures

pH of Rain up Dallas’ Central Highway

What Other Questions Come To Mind?

• Weatherunderground
• National Atlas
• Google flu tracker
Epidemiology

Where is the origin
of West Nile and
what are possible
vectors to transmit it?

• PIGWAD enables students to investigate NASA’s goal of reaching the Moon Mars and beyond.
Off World Online GIS

Moon Missions: Where will we find water
The Moons painted relief

Mars Painted Relief
Where should we land so that we can look for them?
Mars: What resources are most important?

ESRI T3G Institute 44
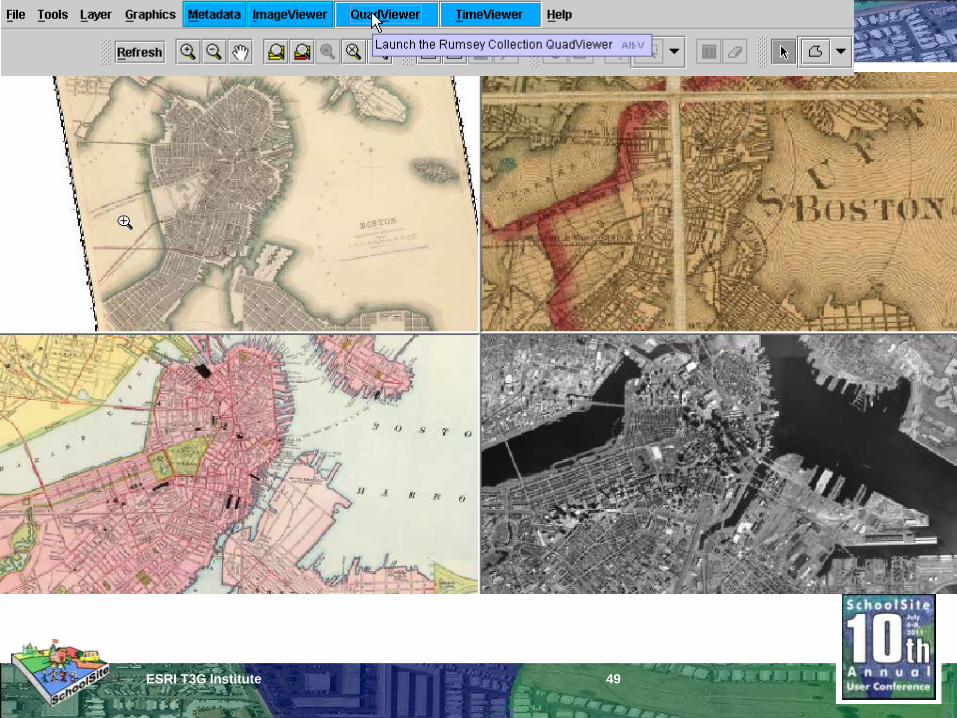
History is also well suited to maps

ESRI T3G Institute 45

ESRI T3G Institute 46

ESRI T3G Institute 47

ESRI T3G Institute 48
1835,1846,1852,
1874, 1897, and
current
ESRI T3G Institute 49

ESRI T3G Institute 50
http://fisher.lib.virginia.edu/collections/stats/histcensus/

ESRI T3G Institute 51

ESRI T3G Institute 52

ESRI T3G Institute 53
Money invested in manufacturing 1840, 1850, 1860, 1870, 1880, 1890, 1900
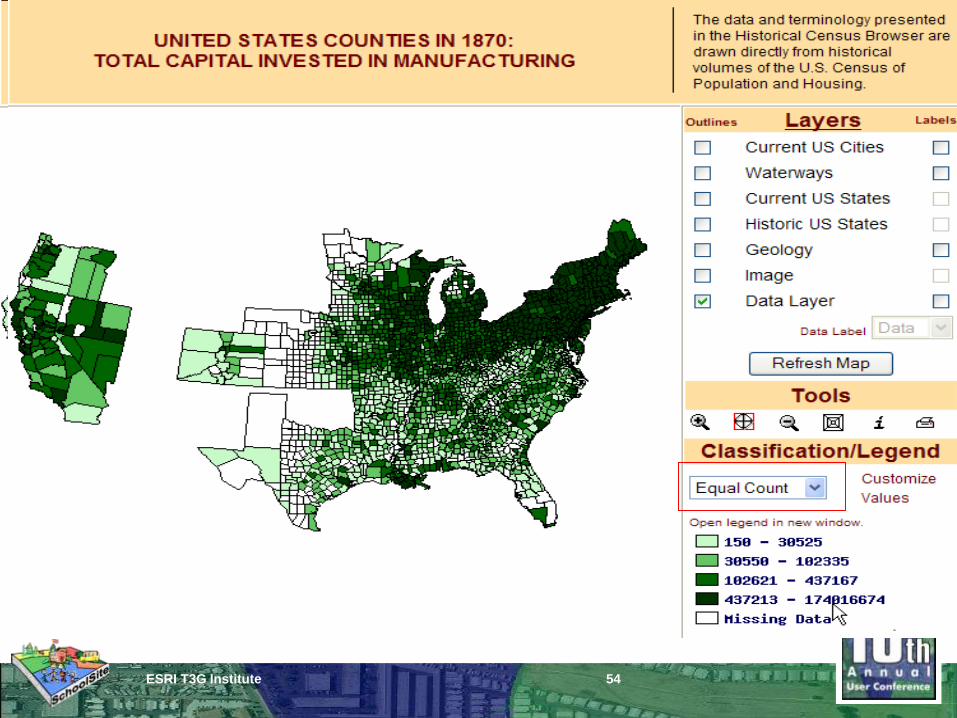
ESRI T3G Institute 54
Consider online webmapping sites for
what they offer:
•quick access to data
•growing database of varied topics
•visualization of large data sets easing
interpretation
•chance for students to build evidence based
understanding of the world.

Typical GIS Integration Pathways:
1.) Use curriculum:
Our World Series,
GIS Tutorial,
Eyes in the Sky II
www.esri.com/arclessons,
STEM lessons at James Madison University,
Earth exploration tool book

2.) Encourage Online Map Use to Start Discussions:
National Atlas, World Mapper, Nation Master,
State Mapper, Gap Minder, American Factfinder

3.) Using GPS to add points to a streamed background map from ArcGIS online.

Finding your own data
4.) Join tables of data to existing geographies

Adding your own data
4b.) Digitizing your own data
• Trails, census data, businesses
• Geocoding addresses
4c.) Calculating new grids from Elevation or point concentrations
• Slope, aspect
• Reclassifying grids for simpler additions
• Doing grid calculations
• Creating Models

What Students Can Do with Even Little Time


While appropriate tools
and clothes get you out
into the field,
It’s a challenge to bring
the data and experiences
back to the classroom

Nothing replaces observations & a note book!
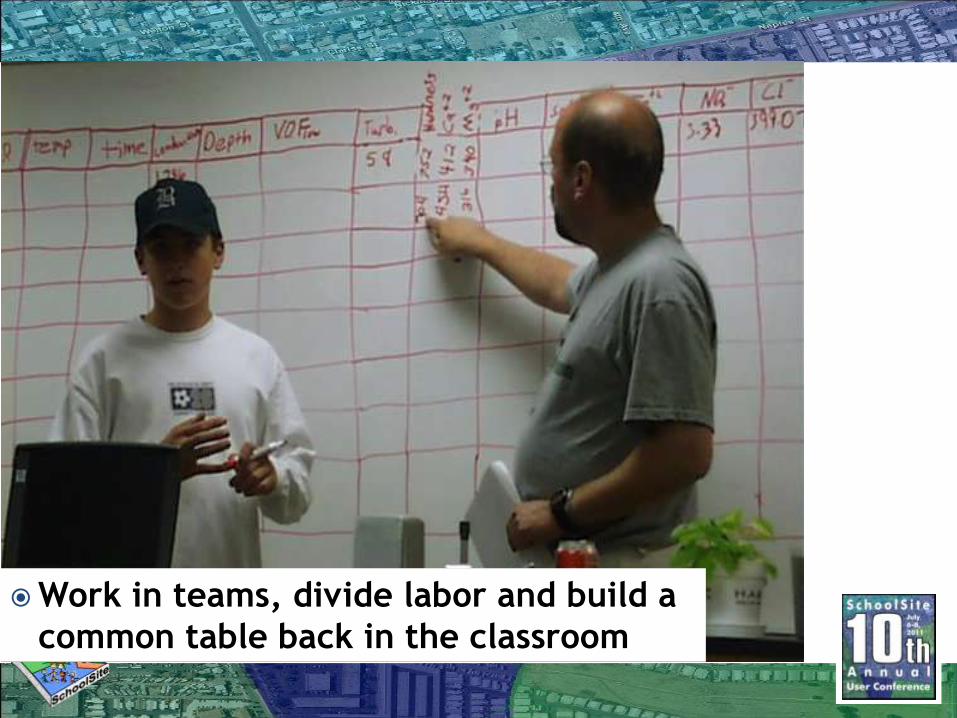
Work in teams, divide labor and build a
common table back in the classroom

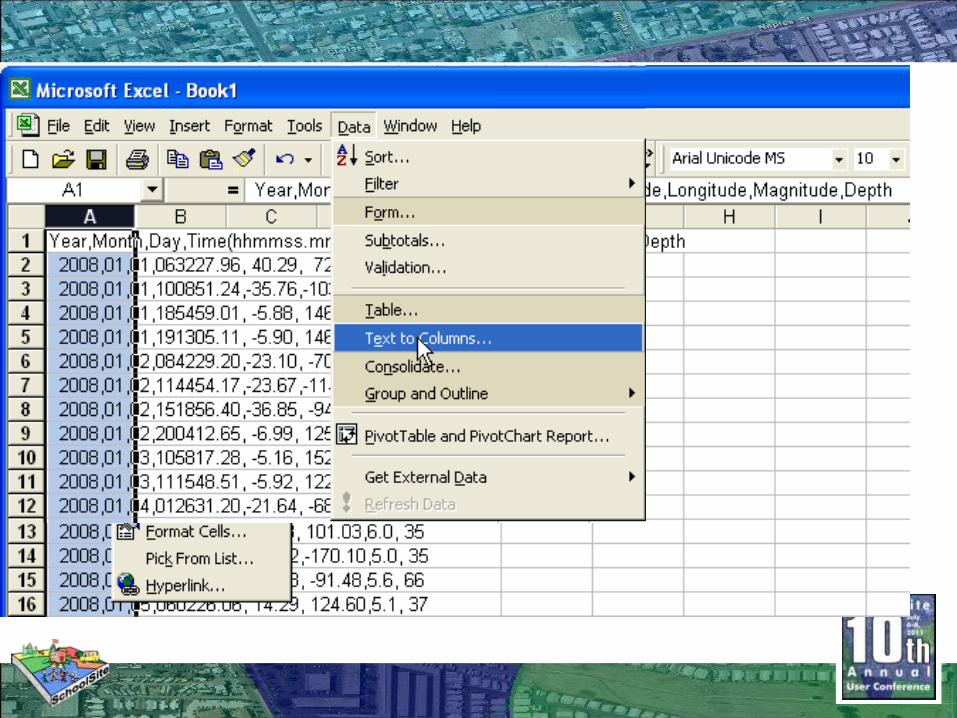
Compare data for consistency, then quickly
enter it into spread sheets and share it.


Assemble a basemap to display your data

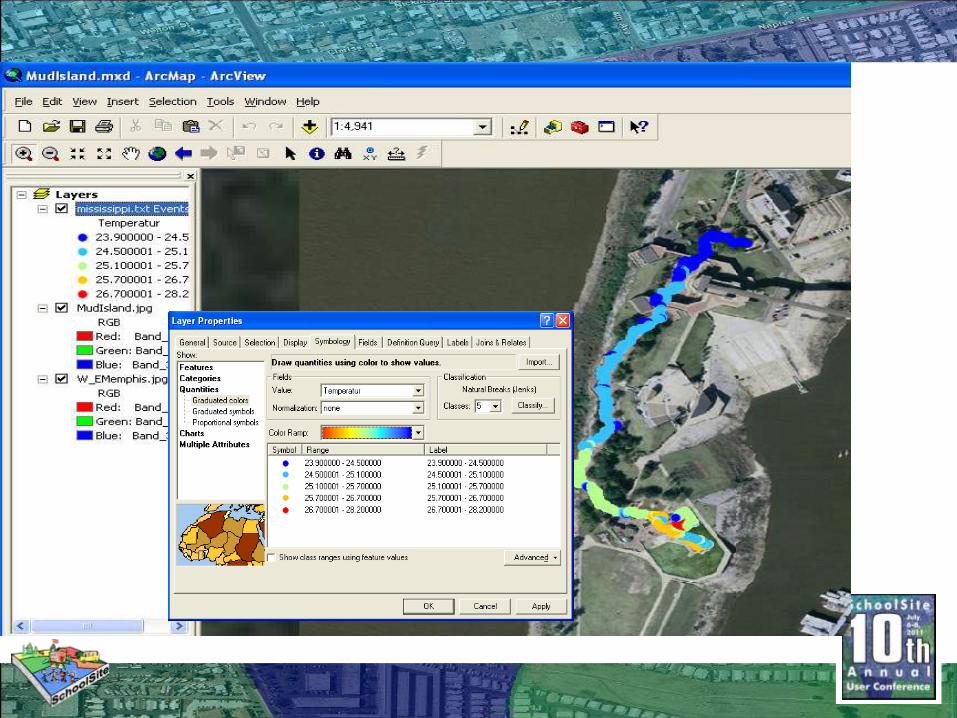
Adding data students gathered

Choosing an appropriate representation
While many variables were collected. What
questions does conductivity raise?

The Blue-green areas are aquifers that feed
these streams.
How do they affect what can live in the river?

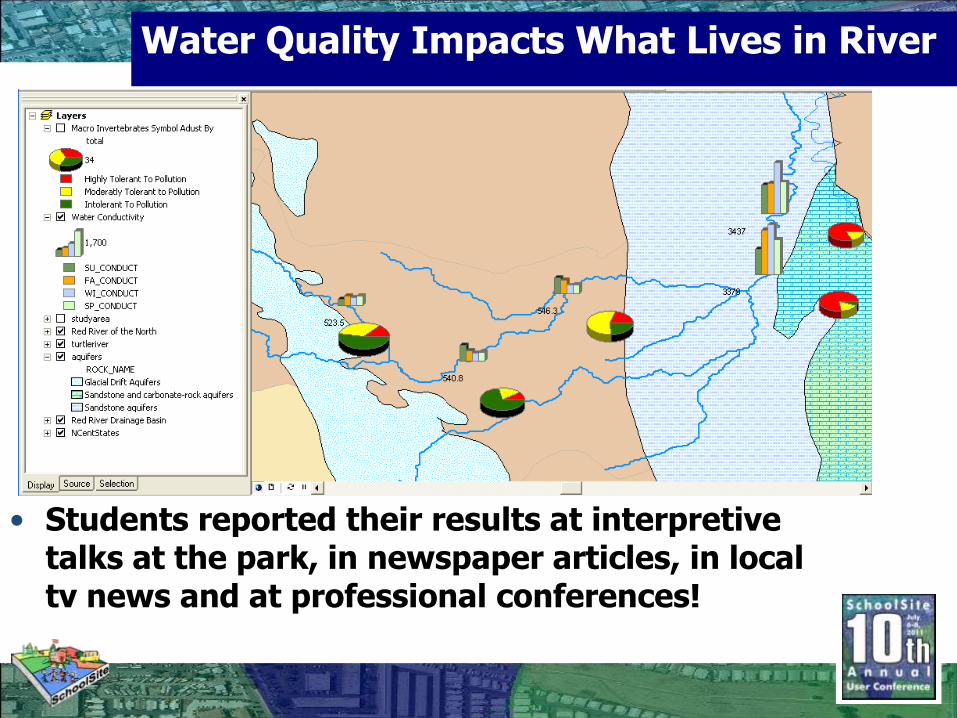
Water Quality Impacts What Lives in River
• Students reported their results at interpretive talks at the park, in newspaper articles, in local tv news and at professional conferences!

Even hand draw maps can be
registered if marked with GPS

Finished Maps Help Draw Fishing Tourism
• Students followed up by surveying the river bottom profile to understand fish habitat preferences.

And Raise More Questions
• Students worked to find out species preferences for ponds, riffles and sheltering debris.

Students presented their work as part of
the scientific community.

Probeware Automates Student Projects

Probeware can
tie GPS and
environmental
data together
ready to be
mapped!

Field Research resources may be available from
many sources, interpretive signs are just one
example of good background material

Temperature vs Dissolved Oxygen
Comparing Variables to Quickly Show Relationships

Who uses surface waters?
Surface water withdrawal correlates with US
cities implying industrial or personal
consumption in the east. The west reflects
increased surface water use for agriculture.

Even ground waters tell important stories
Agricultural use of ground water has lowered
aquifers in western plain states by up to 200 m!


Where do these water pollutants end up?

Where do these water pollutants end up?

Where do these water pollutants end up?

Where do these water pollutants end up?

Where do these water pollutants end up?

Encourage GIS use to leverage thinking back in your classrooms!
• Put current events in contexts
• Incorporate multimedia
• Collaborate
• Compare layers for insight into patterns
• Use data to support theories
• Find patterns visually… tell powerfullstories to engage students to think!

Your Part in Creating Capacity
• How you can influence course offerings at your district
• Stand alone classes in CTE
• Inserting GIS exercises into standard classes
• Science, Social Studies, Mathematics, English language, ROTC, Physical Education
• Where to find help or expertise to do projects
• Student interns from your school district
• Community College program interns
• Local business partnerships

Main Ideas
• GIS is Critical thinking
• GIS is analysis not just visualization
• GIS accesses data and impacts learning across the curriculum
• GIS engages students in local issues
• GIS is an important tool to inform good administrative decision making
• GIS is a 21st century skill with job potential
• GIS is a robust tool visualizing our growing world of information without becoming an overload
• GIS enables us to leverages work across the school district and beyond.

Thanks for Your Interest!GIS is a capstone technology able to bring student academics into real world settings
• GISetc consists of 25 years of teaching experience
• Other services from GISetc• Software and Curriculum sales
• Professional Development
• Geospatial Technology in Classroom Support
• For information:• Visit www.gisetc.com
• Contact Anita Palmer –[email protected]
Roger Palmer –[email protected]