de-noising and feature extraction of ecg and eeg signal
TRANSCRIPT
ISSN 1022-8594 2018 Jahangirnagar University Journal of Science
JUJS Vol. 41, No.1, pp.43-56
* E-mail of correspondence: [email protected]
De-noising and Feature Extraction of ECG and EEG
Signal Using Adaptive Algorithm and Wavelet Transform
Md. Rafsan Jani and Md. Imdadul Islam*
Department of Computer Science and Engineering, Jahangirnagar University
Abstract
Frequency of Biomedical signals are low, hence contaminated by surrounding
environmental signal and interfered by other biomedical signal of same person,
conducted through his body. The main objective of this paper is to eliminate
both the noise and interference part of the biomedical signal using adaptive
algorithm. Here, we consider two signals: ECG (Electrocardiography) and EEG
(Electroencephalography) where the most adverse situation of first one take
place when mother’s ECG is interfered by the fetus ECG and the second one is
heavily interfered by ocular movements. Here we have considered only LMS
(Least Mean Square) algorithm to recover the original ECG and EEG signals
instead of other complex adaptive algorithm to avoid unnecessary time
complexity on such low frequency signal. The scalogram of both ECG and
EEG signals are determined applying, continuous wavelet transform (CWT) to
extract features of both signals. The phase error between original and recovered
signal is also determined by CWT and very small phase error is found at low
scale level of the signal. We applied eight different types of wavelet functions
and found the most distinct results of ECG for ‘Mexican Hat’ function but for
the case of EEG the Meyer, Symlet8, Daubechies8 wavelets provides the most
distinct scalogram, can be applied in diagnostics.
Keywords: DWT, LMS algorithm, Scalogram, EOG and Coherence signal.
Introduction
Signal based medical diagnostics are done in several ways like:
electromechanical, electrochemical, electrophysiological or
electromagnetic actions of the body. All of above provides the signal called
biomedical signal provide some features pertinent to condition of human
body discussed in [1-3]. All the biomedical signals are of low frequency
signal have the chance to be contaminated by environmental phenomena
(noise) or manmade signal (interferences). For example, the
electrocardiogram (ECG) recorded from the chest may be contaminated
with artifacts and the 60Hz power line signal, the electroencephalogram

44 Jani and Islam
(EEG) recorded from the scalp of a volunteer may be contaminated by the
electrophysiological activity of the heart or movement of eyes.
One of the simplest adaptive algorithms in de-noising of signal is Least
Mean Square (LMS) algorithm. The process time and performance of the
algorithm are governed by the step size in updating weighting factor. In [4],
variable step size algorithms are used to eliminate artifacts in ECG. In [5]
the noise of EEG is removed, using Recursive Least Square (RLS)
algorithm. Four different types of noise are considered and the performance
of the algorithm is measured in terms of SNR before and after filtering.
The performance of Kalman filter is better than RLS, LMS or FDAF at the
expense of process time. De-nosing of ECG signal is done by Kalman filter
in [6] and similar job is done by extended Kalman filter in [7]. The
parameters used to measure the performance of the filter are, mean square
error (MSE) and peak signal to noise ratio (PSNR). In [8], the real time
EEG signal is extracted by Digital Signal Processor (DSP) board of Texas
TMS320C6711. Finally, the low frequency power line signal (50 Hz) is
removed by Kaiser window based FIR notch filter. The verification of
removal of 50Hz power line signal is done by applying FFT on EEG signal.
One of the prominent methodologies of de-noising of image or time
varying signal is DWT; where filter bank is used with threshold value at
the output of LP and HP analysis filter. In [9] Un-decimated Wavelet
Transform (UWT) is used for de-noising ECG signal; where Coiflet and
Daubechies filter is chosen as the component of filter bank. In [10] White
Gaussian noise of ECG is removed significantly applying Discrete Wavelet
Transform with thresholding (soft and hard) techniques. The authors use
Daubechies wavelet function with three level decomposition of filter bank.
Same parameters of [7], are used to measure performance of recovered
signal.
A comparison of DWT and adaptive neuro-fuzzy inference system (ANFIS)
is made in [9] in de-noising ECG. The comparison is made in context of:
mean error, maximum error, variance of noise and process time. The
ANFIS is found better for the case of mean error but DWT is better in
consideration of process time.
De-noising and Feature Extraction of ECG and EEG Signal Using 45
The entire paper is organized as: section 2 provides basic theory of
adaptive algorithm and continuous wavelet transform, section 3 deals with
experimental setup of extraction of ECG and EEG signals, section 4
provides the results based on analysis of section 3 and section 5 concludes
entire analysis.
Basic Theory
In this paper we use LMS algorithm and continuous wavelet transform to
recover the biomedical signals from a noisy environment and extraction of
their features. The simplest adaptive algorithm to update the coefficients a
digital filter is LMS algorithm. The steps of LMS algorithm are:
Initially, set the weight , i = 0,1, …, N-1, where k is sampling
instant.
Compute the output of filter, ik
N
i
k xiwn
1
0
)(ˆ
The error weights, kkk nye ˆ
Update the next filter weights
(1)
;where μ is the step size of the adaptive filter. Details of the algorithm and
its applications are found in [12-13].
We have also used the concept of continuous wavelet transform (CWT) to
achieve the features of biomedical signal. Wavelet is an oscillatory
function of finite duration is used as the basis function in CWT. The
continuous wavelet transform (CWT) is used to analyze the frequency
content of a signal with its changes over time. Let f(t) be any square
integral function. The CWT or continuous-time wavelet transform of f(t)
with respect to a wavelet )(t is defined as,
dta
bt
atfbaW
*1)(),( (2)
Where a and b are real and * denotes conjugation.
Equation (2) can be written in a more compact form by defining,

46 Jani and Islam
a
bt
atba
1)(, (3)
Combining (2) and (3),
dtttfbaW ba )()(),( ,
(4)
Inverse CWT operation can be expressed like,
a bba dadbtbaW
aCtf )(),(
11)( ,2
(5)
;where
dC
2)(
, )()( t and 0 < C <
The details analysis of wavelet transform and applications are available in
[14-15].
System Model
De-noising of maternal ECG from noisy signal contaminated by
correlated fetal ECG
In a typical biomedical application, signal processing may include four
stages: data acquisition, signal conditioning, feature extraction, and
decision making. For pregnant woman, the mother’s ECG is interfered by
fetal ECG. The fetal ECG is captured from mother’s abdomen by an array
of electrodes. The mother’s own ECG is extracted in a conventional
technique. A component of mother’s ECG signal is highly correlated with
the fetal ECG since the body of mother works as the channel between these
two signals. Although both the signal are contaminated by background
noise but main challenge is to segregate two ECGs. The arrangement of
adaptive filter in retrieving pure Maternal ECG is shown in Figure 1 as
shown in [16-17].
The steps of algorithm of de-noising maternal ECG from fetal ECG signal
using adaptive algorithm and feature extraction using continuous wavelet
transform is given below.
Read chest leads of ECG as the noisy signal (s + n) and the abdominal
leads as the source of noise ń.

De-noising and Feature Extraction of ECG and EEG Signal Using 47
Preprocess both the signals by band pass filter to avoid white noise
outside the bandwidth.
Considering (s + n) and ń as the input signal, determine error signal, e
= (s + n) –ń as the maternal ECG.
Apply moving average to smooth maternal ECG signal.
Apply continuous wavelet transform to extract features from the
recovered signal.
Figure 1: Adaptive extraction of Maternal ECG [16-17]: (a) cardiac electric field
vectors of mother and fetus; (b) placement of leads; (c) adaptive filter; (d)
idealized fetal ECG(abdominal leads); (e) idealized contaminated mother’s ECG
(chest leads); (f) output of noise canceller throwing reduced mother’s ECG
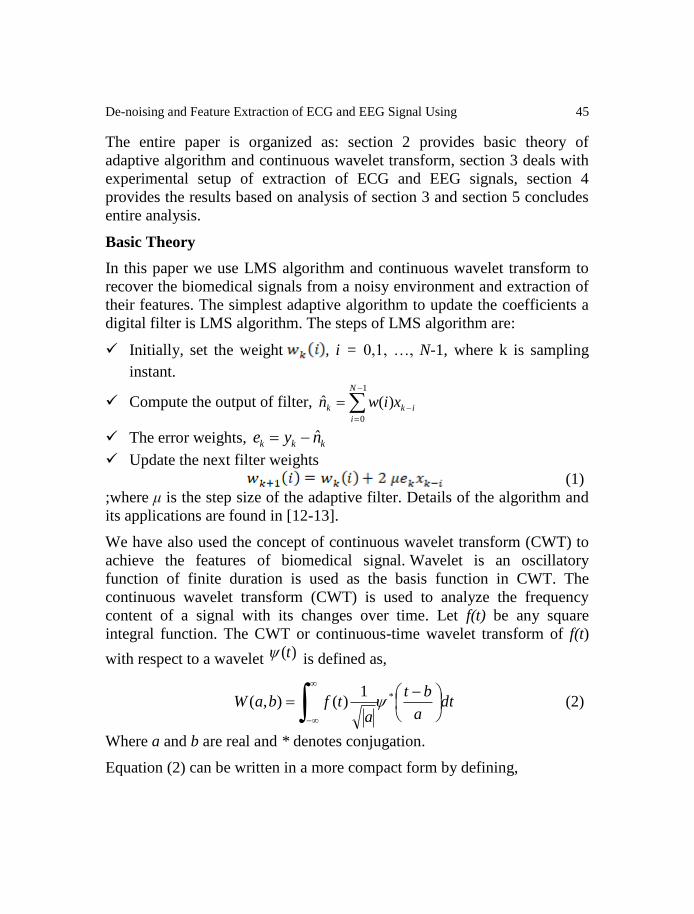
De-noising of EEG from noisy signal contaminated by ocular artifact
The EEG is the flow of electrical signal on the human scalp generated by
electrical activity of brain. The movement of human eyes produce electrical
potentials around the eyes called the electrooculogram (EOG) which
spreads across the scalp hence contaminates the EEG. The signal taken
from the scalp is combination of EEG and EOG. The signal taken around
eyes is mainly EOG which is correlated with one portion of scalp signal.
Therefore adaptive algorithm can be applied to remove EOG from the
signal of scalp. The complete arrangement of adaptive filter in elimination
of EOG is shown in Figure 2.
48 Jani and Islam
Figure 2: Adaptive extraction of EEG from ocular artifact [16]. (a) leads
placement in human scalp (b) adaptive filter for throwing away ocular artifacts.
The steps of algorithm of de-noising EEG signal using adaptive algorithm
and feature extraction using continuous wavelet transform is given below.
Read back head leads of EEG as noisy signal (s + n) and forehead
leads as the source of noise ń.
Preprocess both signals by band pass filter to avoid white noise out
the bandwidth.
Apply adaptive algorithm to recover the original EEG.
Compare measured and desired EEG signal.
Apply continuous wavelet transform to extract features of the
recovered signal
The next section will deal with the results based on analysis of section 3.
Results
First, we apply LMS algorithm to segregate maternal ECG from its
contaminated version. The results as shown in Figure 3; where the
recovered signal resembles to the original signal. Again, retrieve of original
EEG signal from its contaminated version is shown in Figure 4 using the
same adaptive algorithm.

De-noising and Feature Extraction of ECG and EEG Signal Using 49
Figure 3: De-noising of maternal ECG from fetal ECG using adaptive algorithm.
Figure 4: De-noising of EEG signal from ocular artifact using adaptive algorithm.
In [19] de-noising of EEG is done by filter bank of DWT and that of ECG
is found in [20]. Here our next job is to extract features of ECG and EEG
signal using continuous wavelet transform. Any signal is constructed by
superposition of scaling and translated version of basis function. The
coefficients of CWT or DWT are the cross correlation coefficients between
the wavelet basis function and the signal; varying scaling and shift
parameter of the wavelet basis. The original signal is reconstructed as the
weighted sum of the basis function for all-possible scaling and
corresponding shifts till the length of the signal; where the weights are the
wavelet coefficients.
50 Jani and Islam
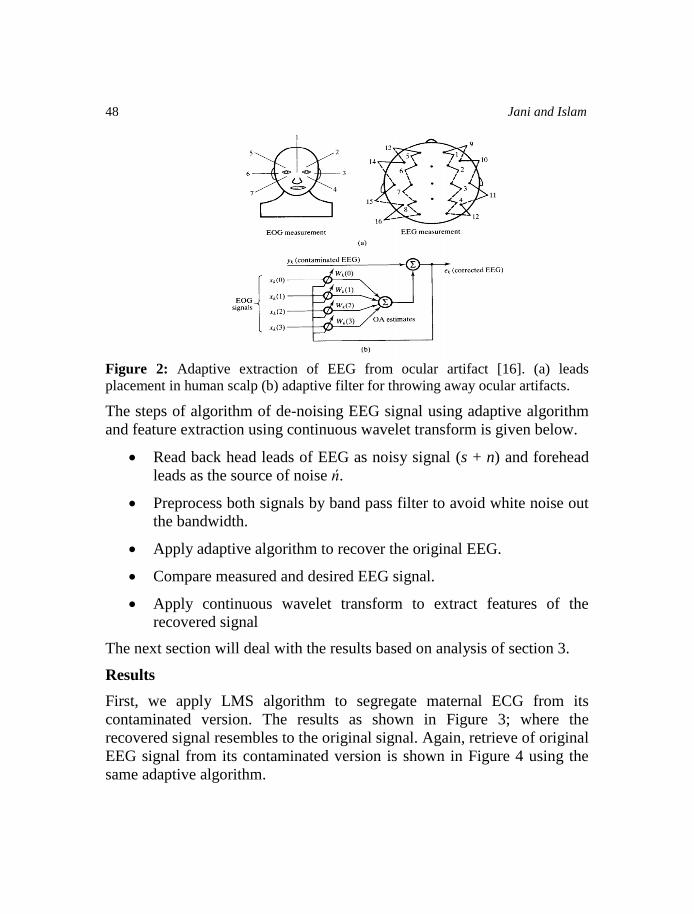
We have to locate the position and amplitude of the maxima of a signal
from the coefficients of CWT of the signal. The wavelet transform is very
essential in detecting abrupt changes in a signal, which bears the feature of
a signal. In Fourier transform the abrupt changes in a signal produces huge
harmonics (the reconstruction of such signal needs huge number of
harmonics can be explained from Gibb’s phenomenon) but in wavelet
transform relatively large wavelet coefficients (in absolute value) are found
around the discontinuity at all scales. If the oscillation of the signal is
highly correlated with the oscillation of wavelet then the wavelet
coefficients are found larger. The abrupt change in signal are visualized
from a-b plot where the co-efficient are found distinct at all scale compared
to smoother part of the signal but maxima and minima are visualized only
at higher scale. Actually, the main feature of ECG and EEG signal are the
rapid varying portion of the signal. Among several wavelets few are
suitable for extraction of features of ECG or EEG. The following figures
show the location maximum amplitude of co-efficient of CWT for ECG
and EEG signal. The scalogram of ECG is the most distinct for the case of
‘Mexican Hat’ wavelet (since the oscillation of Mexican Hat wavelet has
similarity with the varying part of the ECG signal at some scale). On the
other hand, for the case of EEG the Meyer, Symlet8, Daubechies8 wavelets
provides the most distinct scalogram. Above phenomena is visualized from
Figure 5 and Figure 6.
100 200 300 400 500 600 700 800 900
-500
50100
Features of ECG signal
Scalogram
Percentage of energy for each wavelet coefficient
Time (or Space) b
Sca
les
a
100 200 300 400 500 600 700 800 900 1 5 913172125293337414549535761
0.01
0.02
0.03
0.04
0.05
0.06
0.07
0.08
0.09
(a) Symlet4
100 200 300 400 500 600 700 800 900
-500
50100
Features of ECG signal
Scalogram
Percentage of energy for each wavelet coefficient
Time (or Space) b
Sca
les
a
100 200 300 400 500 600 700 800 900 1 5 913172125293337414549535761
0.01
0.02
0.03
0.04
0.05
0.06
0.07
0.08
0.09
(b) Symlet8

De-noising and Feature Extraction of ECG and EEG Signal Using 51
100 200 300 400 500 600 700 800 900
-500
50100
Analyzed Signal
Features of ECG signal
Time (or Space) b
Sca
les
a
100 200 300 400 500 600 700 800 900 1 5 913172125293337414549535761
0.01
0.02
0.03
0.04
0.05
0.06
0.07
0.08
0.09
(c) Daubechies1
100 200 300 400 500 600 700 800 900
-500
50100
Analyzed Signal
Features of ECG signal
Time (or Space) b
Sca
les
a
100 200 300 400 500 600 700 800 900 1 5 913172125293337414549535761
0.02
0.04
0.06
0.08
0.1
(d) Daubechies4
100 200 300 400 500 600 700 800 900
-500
50100
Features of ECG signal
Scalogram
Percentage of energy for each wavelet coefficient
Time (or Space) b
Sca
les
a
100 200 300 400 500 600 700 800 900 1 5 913172125293337414549535761
0.02
0.03
0.04
0.05
0.06
0.07
0.08
0.09
0.1
(e) Daubechies8
100 200 300 400 500 600 700 800 900
-500
50100
Features of ECG signal
Scalogram
Percentage of energy for each wavelet coefficient
Time (or Space) b
Sca
les
a
100 200 300 400 500 600 700 800 900 1 5 913172125293337414549535761
0.01
0.02
0.03
0.04
0.05
0.06
0.07
0.08
0.09
(f) Haar
100 200 300 400 500 600 700 800 900
-500
50100
Features of ECG signal
Scalogram
Percentage of energy for each wavelet coefficient
Time (or Space) b
Scale
s a
100 200 300 400 500 600 700 800 900 1 5 913172125293337414549535761
0.005
0.01
0.015
0.02
0.025
0.03
(g) Mexican hat
100 200 300 400 500 600 700 800 900
-500
50100
Features of ECG signal
Scalogram
Percentage of energy for each wavelet coefficient
Time (or Space) b
Sca
les
a
100 200 300 400 500 600 700 800 900 1 5 913172125293337414549535761
0.01
0.02
0.03
0.04
0.05
0.06
0.07
0.08
0.09
(h) Meyer
Figure 5: Scalogram of ECG signal
50 100 150 200 250 300-50
050
100150
Analyzed Signal
Features of EEG signal
Time (or Space) b
Scale
s a
50 100 150 200 250 300 1 5 913172125293337414549535761
0.01
0.02
0.03
0.04
0.05
0.06
0.07
0.08
(a) Symlet4
50 100 150 200 250 300-50
050
100150
Features of EEG signal
Scalogram
Percentage of energy for each wavelet coefficient
Time (or Space) b
Scale
s a
50 100 150 200 250 300 1 5 913172125293337414549535761
0.01
0.02
0.03
0.04
0.05
0.06
0.07
(b) Symlet8

52 Jani and Islam
50 100 150 200 250 300-50
050
100150
Features of EEG signal
Scalogram
Percentage of energy for each wavelet coefficient
Time (or Space) b
Scale
s a
50 100 150 200 250 300 1 5 913172125293337414549535761
0.01
0.02
0.03
0.04
0.05
0.06
0.07
0.08
0.09
(c) Daubechies1
50 100 150 200 250 300-50
050
100150
Analyzed Signal
Features of EEG signal
Time (or Space) b
Scale
s a
50 100 150 200 250 300 1 5 913172125293337414549535761
0.01
0.02
0.03
0.04
0.05
0.06
0.07
0.08
(d) Daubechies4
50 100 150 200 250 300-50
050
100150
Analyzed Signal
Features of EEG signal
Time (or Space) b
Scale
s a
50 100 150 200 250 300 1 5 913172125293337414549535761
0.01
0.02
0.03
0.04
0.05
0.06
0.07
(e) Daubechies8
50 100 150 200 250 300-50
050
100150
Analyzed Signal
Features of EEG signal
Time (or Space) b
Scale
s a
50 100 150 200 250 300 1 5 913172125293337414549535761
0.01
0.02
0.03
0.04
0.05
0.06
0.07
0.08
0.09
(f) Haar
50 100 150 200 250 300-50
050
100150
Analyzed Signal
Features of EEG signal
Time (or Space) b
Scale
s a
50 100 150 200 250 300 1 5 913172125293337414549535761
0.02
0.04
0.06
0.08
0.1
(g) Mexican hat
50 100 150 200 250 300-50
050
100150
Analyzed Signal
Features of EEG signal
Time (or Space) b
Scale
s a
50 100 150 200 250 300 1 5 913172125293337414549535761
0.01
0.02
0.03
0.04
0.05
0.06
0.07
(h) Meyer
Figure 6: Scalogram of EEG signal
Figure 5 and 6 will be applicable to realize the condition of patient. Finally,
the coherence of EEG signal is observed, using the CWT wavelet
transform, as shown in Figure 7. Here x-axis is time (995 samples i.e. the
length of t) and y-axis is scale (1 to 512), the arrow indicated the phase
difference between original and recovered signal at different scale and time.
At lower scale levels, little phase difference is found; but at upper scale,
there is no phase difference visualized from Figure 7.

De-noising and Feature Extraction of ECG and EEG Signal Using 53
(a) Spectrogram of individual (b) Phase error
Figure 7: Coherence of original and recovered signal
Conclusions
One of the major applications of adaptive filter is to recover biomedical
signal from its noisy or interfered version. The biomedical signals are
highly sensitive to the noise, which creates huge difficulties for the
responsible personnel to diagnose the condition of the patient perfectly.
Thus, processing and enhancement of real time biomedical data is
becoming more important to ensure error free diagnosis. In this paper de-
noising of ECG and EEG signals using adaptive algorithm and the feature
extraction using different wavelet transform are discussed. We can apply
Kalman filter (which provides the same performance on the signals of any
frequency) to recover ECG and EEG at the expense of processing time. We
can use also use adaptive DWT to recover the signals. In future we will use
Neural network for recovery and feature extraction of ECG and EEG where
we need to train the system about the profile of both signals.
References
[1] Kayvan Najarian, Robert Splinter, Biomedical Signal and Image Processing,
Second Edition, May 4, 2012 by CRC Press
[2] Thumbur Gowri, P. Rajesh Kumar, D. V. Rama Koti Reddy , An Efficient
Variable Step Size Least Mean Square Adaptive Algorithm Used to Enhance
the Quality of Electrocardiogram Signal, Advances in Signal Processing
54 Jani and Islam
and Intelligent Recognition Systems, Springer, Vol. 264, pp 463-475, Jan.
2014
[3] Bo-Ram Lee; Dong-Ok Won; Kwang-Suk Seo; Hyun Jeong Kim; Seong-
Whan Lee, Classification of wakefulness and anesthetic sedation using
combination feature of EEG and ECG, pp. 88 - 902017 5th International
Winter Conference on Brain-Computer Interface (BCI), Jan 9-11, 2017,
Korea
[4] 3.Felipe Gustavo Silva Teodoro; Sarajane M. Peres; Clodoaldo A. M. Lima,
Feature selection for biometric recognition based on electrocardiogram
signals, pp. 2911 – 2920,2017 International Joint Conference on Neural
Networks (IJCNN), May 14-19, 2017, USA
[5] Chinmay Chondrakar, M.K. Kowar, Denoising ECG signal using adaptive
filter algorithm, IJSCE, Vol. 2, Issue-1, pp120-123, , Mar.-2012
[6] Moradi MH, et al, ECG signal enhancement using adaptive Kalman filter
and signal averaging, International Journal of Cardiology,, Elsevier. Vol.
173, Issue 3, pp 553-555, 2014
[7] Nagendra Sen and Chinmay Chandrakar, Development of a Novel ECG
signal Denoising System Using Extended Kalman Filter, IJAREEIE, Vol. 3,
Issue 2, pp.7200-7208, Feb.2014
[8] Ritu Bindal1, Sanjeev Kumar2, Amod Kumar, Denoising of
Electroencephalogram Signals Using Digital Signal Processor, Advanced
Research in Electrical and Electronic Engineering, Vol. 1, No. 1, pp. 38-41,
2014
[9] Baliram S. Gayal and F.I. Shaikh, Denoising of ECG signal using
undecimated wavelet transform, IJAREEIE, Vol. 3, Issue 1, pp.6896-6901,
Jan.2014
[10] Er. Manpreet Kaur and Er. Gagandeep Kaur, Adaptive Wavelet
Thresholding for Noise reduction in Electrocardiogram (ECG) Signals,
IJCSNS International Journal of Computer Science and Network Security,
Vol. 15 No.4, pp.100-105, April 2015
[11] Md. Imdadul Islam, Nasima Begum, Mahbubul Alam and M. R. Amin,
Recovery of Noisy ECG Signal by ANFIS and DWT, Journal Of Electronics
And Computer Science Research, Vol. 1 No. 3, pp.12-19, December 2012
(ISSN: 2306-5605)
[12] Jyoti Dhiman , Shadab Ahmad , Kuldeep Gulia, Comparison between
Adaptive filter Algorithms (LMS, NLMS and RLS), International Journal of
De-noising and Feature Extraction of ECG and EEG Signal Using 55
Science, Engineering and Technology Research (IJSETR) Vol. 2, Issue 5,
pp.1100-1103, May 2013
[13] Pramod Kumar Meher, and Sang Yoon Park, Area-Delay-Power Efficient
Fixed-Point LMS Adaptive Filter With Low Adaptation-Delay, IEEE
Transactions on Very Large Scale Integration (VLSI) SYSTEMS, Vol. 22,
No. 2, pp.362-371, Feb.- 2014
[14] Joseph O. Chapa and Raghuveer M. Rao, Algorithms for Designing
Wavelets to Match a Specified Signal, IEEE Transactions on Signal
Processing, Vol. 48, No. 12, pp. 3395- 3406, December 2000
[15] Haran Burri, Philippe Chevalier a, Mohammad Arzi, Paul Rubel, Gilbert
Kirkorian, Paul Touboul, Wavelet transform for analysis of heart rate
variability preceding ventricular arrhythmias in patients with ischemic heart
disease, International Journal of Cardiology 109 (2006) , pp. 101 – 107
[16] Emmanuel C. Ifrahor and Barrie W. Jervis, Digital Signal Processing A
practical Approach, 2nd
Edition, Pearson Education, Singapore, 2002
[17] Bernard Widrow and Samuel D. Stearns, Adaptive Signal processing,
Pearson Education, Singapore, 2005
[18] Mohammad Ziaullah, Zuber Ahmed Punekar, Ujwala S , M. Megha
Bhagyashri M, Denoising of EEG Signals For Analysis of Brain Disorders:
A Review, International Research Journal of Engineering and Technology
(IRJET), Vol. 04, Issue: 07, pp. 263-267, July -2017
[19] Somesh Morya, Sudhir Agrawal, Shivangini Morya, Denoising of ECG
Signal using Soft Thresholding and Empirical Mode Decomposition,
International Journal on Recent and Innovation Trends in Computing and
Communication,Vol. 5, Issue: 4, pp.131-3, April 2017
[20] Nurindah Tiffani Rachman, Handayani Tjandrasa, Chastine Fatichah,
Alcoholism classification based on EEG data using Independent
Component Analysis (ICA), Wavelet de-noising and Probabilistic Neural
Network (PNN), 2016 International Seminar on Intelligent Technology and
Its Applications (ISITIA), pp. 17 – 20

56 Jani and Islam