dealership industry quarterly update q4 2019 finance/mid-… · q4 2016 q4 2017 q4 2018 q4 2019...
TRANSCRIPT
QUARTERLY UPDATE Q4 2019
DEALERSHIP INDUSTRY
Page 2
$928 M
$2,155 M
$1,100 M$891 M
$1,316 M$1,042 M
$1,996 M
-
10
20
30
40
50
60
70
80
-
500 M
1,000 M
1,500 M
2,000 M
2013 2014 2015 2016 2017 2018 2019
Tran
sact
ion
Volu
me (
Num
ber
of D
eals
)
Tran
sact
ion
Valu
e (C
AD M
illio
ns)
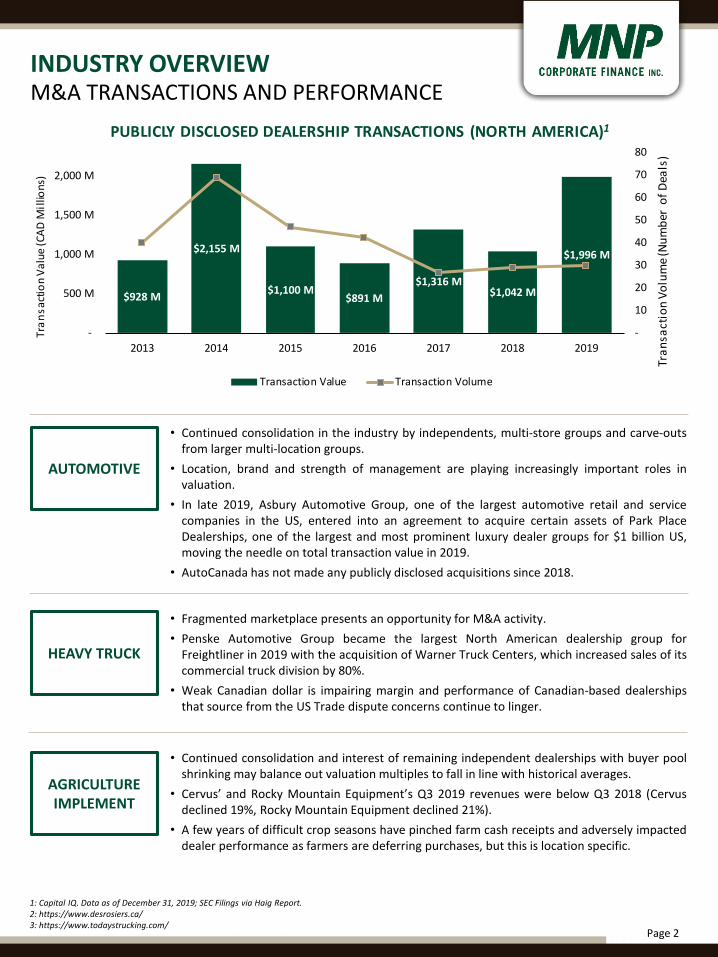
PUBLICLY DISCLOSED DEALERSHIP TRANSACTIONS (NORTH AMERICA)1
Transaction Value Transaction Volume
INDUSTRY OVERVIEW
1: Capital IQ. Data as of December 31, 2019; SEC Filings via Haig Report.2: https://www.desrosiers.ca/3: https://www.todaystrucking.com/
• Continued consolidation in the industry by independents, multi-store groups and carve-outsfrom larger multi-location groups.
• Location, brand and strength of management are playing increasingly important roles invaluation.
• In late 2019, Asbury Automotive Group, one of the largest automotive retail and servicecompanies in the US, entered into an agreement to acquire certain assets of Park PlaceDealerships, one of the largest and most prominent luxury dealer groups for $1 billion US,moving the needle on total transaction value in 2019.
• AutoCanada has not made any publicly disclosed acquisitions since 2018.
• Fragmented marketplace presents an opportunity for M&A activity.• Penske Automotive Group became the largest North American dealership group for
Freightliner in 2019 with the acquisition of Warner Truck Centers, which increased sales of itscommercial truck division by 80%.
• Weak Canadian dollar is impairing margin and performance of Canadian-based dealershipsthat source from the US Trade dispute concerns continue to linger.
• Continued consolidation and interest of remaining independent dealerships with buyer poolshrinking may balance out valuation multiples to fall in line with historical averages.
• Cervus’ and Rocky Mountain Equipment’s Q3 2019 revenues were below Q3 2018 (Cervusdeclined 19%, Rocky Mountain Equipment declined 21%).
• A few years of difficult crop seasons have pinched farm cash receipts and adversely impacteddealer performance as farmers are deferring purchases, but this is location specific.
AUTOMOTIVE
HEAVY TRUCK
AGRICULTURE IMPLEMENT
M&A TRANSACTIONS AND PERFORMANCE
Page 3
-
10%
20%
30%
40%
50%
60%
70%
Q1 Q2 Q3 Q4 Q1 Q2 Q3 Q4 Q1 Q2 Q3 Q4 Q1 Q2 Q3 Q4-
100k
200k
300k
400k
500k
600k
700k
800k
Pass
enge
r Veh
icle
Sal
es (U
nits
)
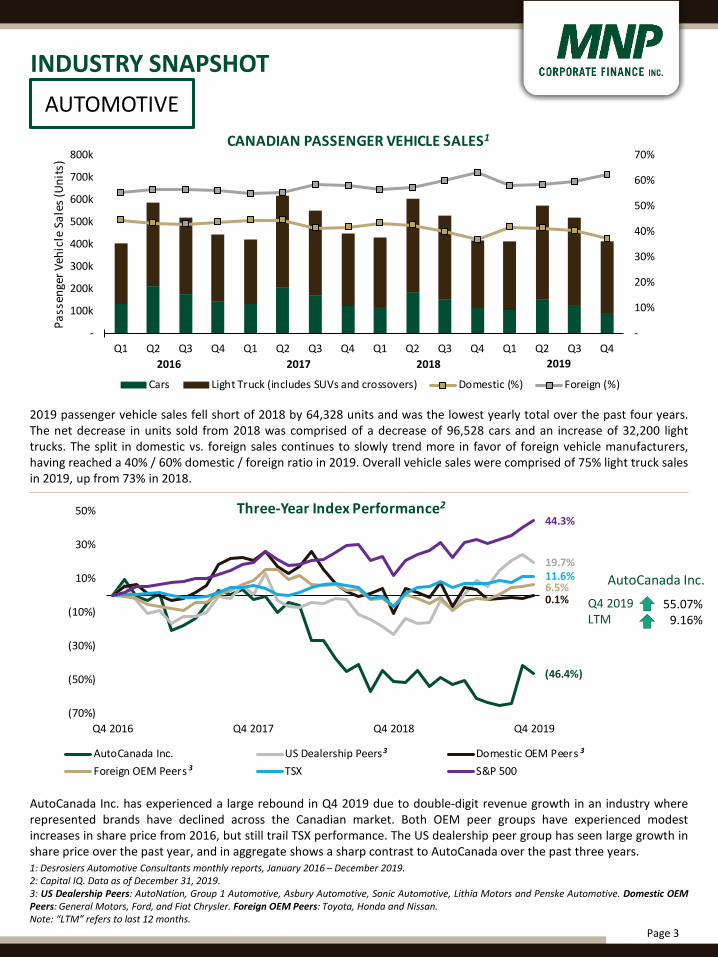
CANADIAN PASSENGER VEHICLE SALES1
Cars Light Truck (includes SUVs and crossovers) Domestic (%) Foreign (%)
(46.4%)
19.7%
0.1%6.5%11.6%
44.3%
(70%)
(50%)
(30%)
(10%)
10%
30%
50%
Q4 2016 Q4 2017 Q4 2018 Q4 2019
Three-Year Index Performance2
AutoCanada Inc. US Dealership Peers Domestic OEM PeersForeign OEM Peers TSX S&P 500
2019 passenger vehicle sales fell short of 2018 by 64,328 units and was the lowest yearly total over the past four years.The net decrease in units sold from 2018 was comprised of a decrease of 96,528 cars and an increase of 32,200 lighttrucks. The split in domestic vs. foreign sales continues to slowly trend more in favor of foreign vehicle manufacturers,having reached a 40% / 60% domestic / foreign ratio in 2019. Overall vehicle sales were comprised of 75% light truck salesin 2019, up from 73% in 2018.
INDUSTRY SNAPSHOT
1: Desrosiers Automotive Consultants monthly reports, January 2016 – December 2019.2: Capital IQ. Data as of December 31, 2019.3: US Dealership Peers: AutoNation, Group 1 Automotive, Asbury Automotive, Sonic Automotive, Lithia Motors and Penske Automotive. Domestic OEMPeers: General Motors, Ford, and Fiat Chrysler. Foreign OEM Peers: Toyota, Honda and Nissan.Note: “LTM” refers to last 12 months.
201820172016
AUTOMOTIVE
Q4 2019LTM
55.07%9.16%
AutoCanada Inc. has experienced a large rebound in Q4 2019 due to double-digit revenue growth in an industry whererepresented brands have declined across the Canadian market. Both OEM peer groups have experienced modestincreases in share price from 2016, but still trail TSX performance. The US dealership peer group has seen large growth inshare price over the past year, and in aggregate shows a sharp contrast to AutoCanada over the past three years.
AutoCanada Inc.
3 3
3
2019
Page 4
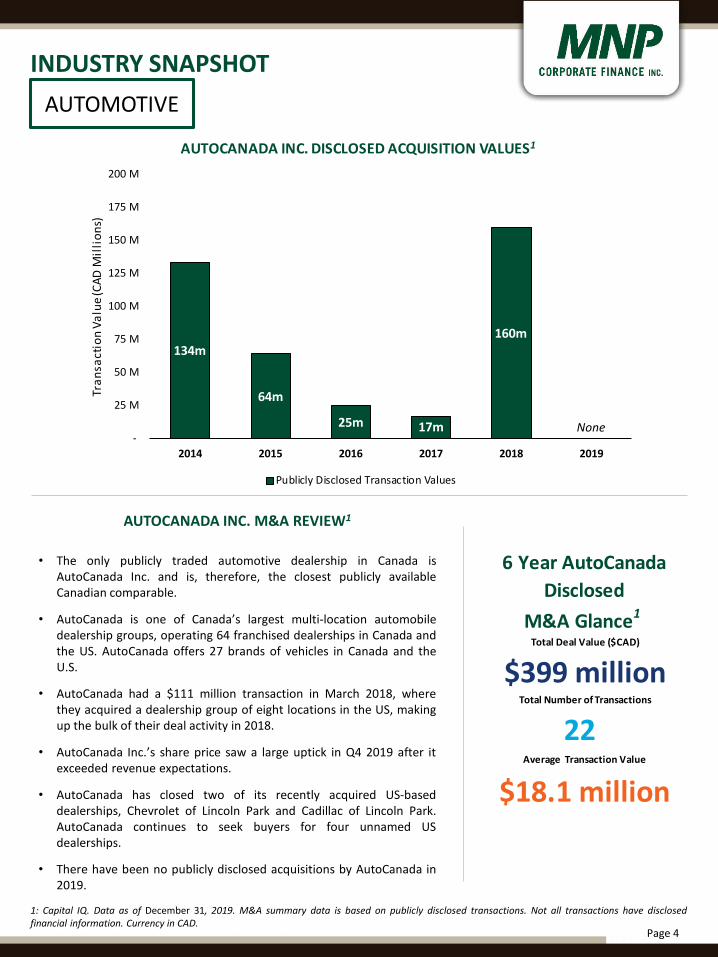
6 Year AutoCanada Disclosed
M&A Glance1
Total Deal Value ($CAD)
$399 millionTotal Number of Transactions
22Average Transaction Value
$18.1 million
134m
64m
25m 17m
160m
--
25 M
50 M
75 M
100 M
125 M
150 M
175 M
200 M
2014 2015 2016 2017 2018 2019
Tran
sact
ion
Valu
e (CA
D M
illio
ns)
AUTOCANADA INC. DISCLOSED ACQUISITION VALUES1
Publicly Disclosed Transaction Values
AUTOCANADA INC. M&A REVIEW1
• The only publicly traded automotive dealership in Canada isAutoCanada Inc. and is, therefore, the closest publicly availableCanadian comparable.
• AutoCanada is one of Canada’s largest multi-location automobiledealership groups, operating 64 franchised dealerships in Canada andthe US. AutoCanada offers 27 brands of vehicles in Canada and theU.S.
• AutoCanada had a $111 million transaction in March 2018, wherethey acquired a dealership group of eight locations in the US, makingup the bulk of their deal activity in 2018.
• AutoCanada Inc.’s share price saw a large uptick in Q4 2019 after itexceeded revenue expectations.
• AutoCanada has closed two of its recently acquired US-baseddealerships, Chevrolet of Lincoln Park and Cadillac of Lincoln Park.AutoCanada continues to seek buyers for four unnamed USdealerships.
• There have been no publicly disclosed acquisitions by AutoCanada in2019.
1: Capital IQ. Data as of December 31, 2019. M&A summary data is based on publicly disclosed transactions. Not all transactions have disclosedfinancial information. Currency in CAD.
AUTOMOTIVE
INDUSTRY SNAPSHOT
None
Page 5
(3.1%)
(48.0%)
48.0%
(4.0%)
44.3%
11.6%
(50%)
(30%)
(10%)
10%
30%
50%
70%
Q4 2016 Q4 2017 Q4 2018 Q4 2019
Three-Year Index Performance1
Penske Automotive Group, Inc. Cervus Equipment Corporation Rush Enterprises, Inc.
OEM Peers TSX S&P 500
(6%)
(4%)
(2%)
-
2%
4%
6%
Q4 Q1 Q2 Q3 Q4 Q1 Q2 Q3 Q4 Q1 Q2 Q3-
150 M
300 M
450 M
600 M
750 M
900 M
Net
Prof
it (L
oss)
Bef
ore
Tax
(% o
f Re
venu
e)
Heav
y Tr
uck
Sale
s (CA
D M
illio
ns)
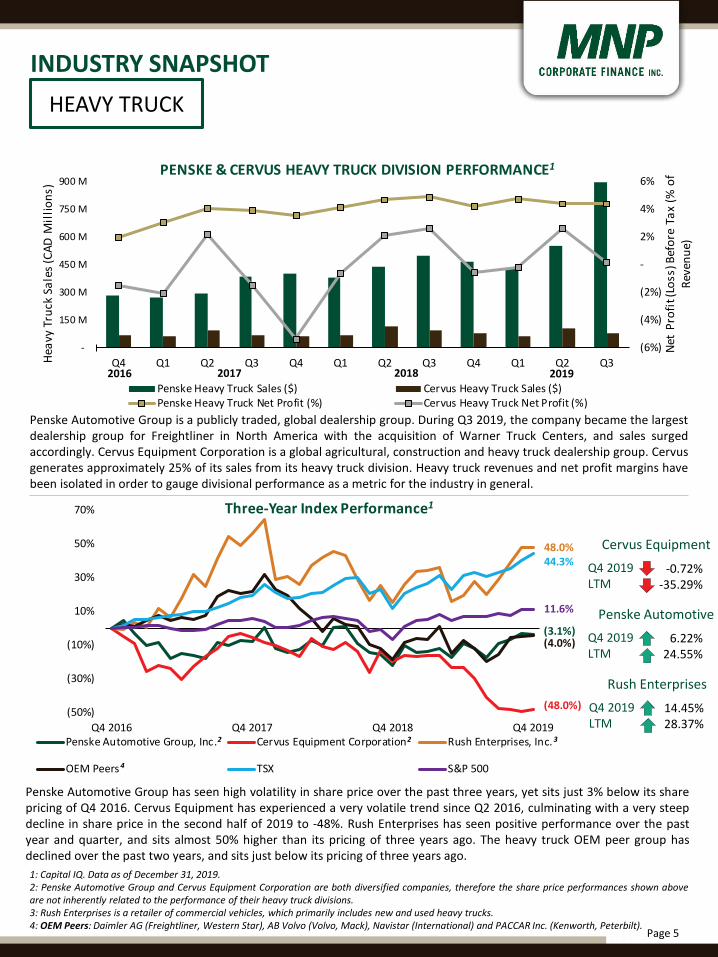
PENSKE & CERVUS HEAVY TRUCK DIVISION PERFORMANCE1
Penske Heavy Truck Sales ($) Cervus Heavy Truck Sales ($)Penske Heavy Truck Net Profit (%) Cervus Heavy Truck Net Profit (%)
Q4 2019LTM
-0.72%-35.29%
2
Penske Automotive Group is a publicly traded, global dealership group. During Q3 2019, the company became the largestdealership group for Freightliner in North America with the acquisition of Warner Truck Centers, and sales surgedaccordingly. Cervus Equipment Corporation is a global agricultural, construction and heavy truck dealership group. Cervusgenerates approximately 25% of its sales from its heavy truck division. Heavy truck revenues and net profit margins havebeen isolated in order to gauge divisional performance as a metric for the industry in general.
1: Capital IQ. Data as of December 31, 2019.2: Penske Automotive Group and Cervus Equipment Corporation are both diversified companies, therefore the share price performances shown aboveare not inherently related to the performance of their heavy truck divisions.3: Rush Enterprises is a retailer of commercial vehicles, which primarily includes new and used heavy trucks.4: OEM Peers: Daimler AG (Freightliner, Western Star), AB Volvo (Volvo, Mack), Navistar (International) and PACCAR Inc. (Kenworth, Peterbilt).
Penske Automotive Group has seen high volatility in share price over the past three years, yet sits just 3% below its sharepricing of Q4 2016. Cervus Equipment has experienced a very volatile trend since Q2 2016, culminating with a very steepdecline in share price in the second half of 2019 to -48%. Rush Enterprises has seen positive performance over the pastyear and quarter, and sits almost 50% higher than its pricing of three years ago. The heavy truck OEM peer group hasdeclined over the past two years, and sits just below its pricing of three years ago.
HEAVY TRUCK
INDUSTRY SNAPSHOT
20172016
4
Cervus Equipment
Q4 2019LTM
6.22%24.55%
Penske Automotive
2
2018 2019
3
Q4 2019LTM
14.45%28.37%
Rush Enterprises
Page 6
-
2 B
4 B
6 B
8 B
10 B
12 B
100 M
150 M
200 M
250 M
300 M
350 M
400 M
450 M
Q4 Q1 Q2 Q3 Q4 Q1 Q2 Q3 Q4 Q1 Q2 Q3 Q4 Q1 Q2 Q3 Q4 Q1 Q2 Q3
Farm
Cas
h Re
ceip
ts
(CAD
Bill
ions
)
Reve
nue
(CAD
Mill
ions
)
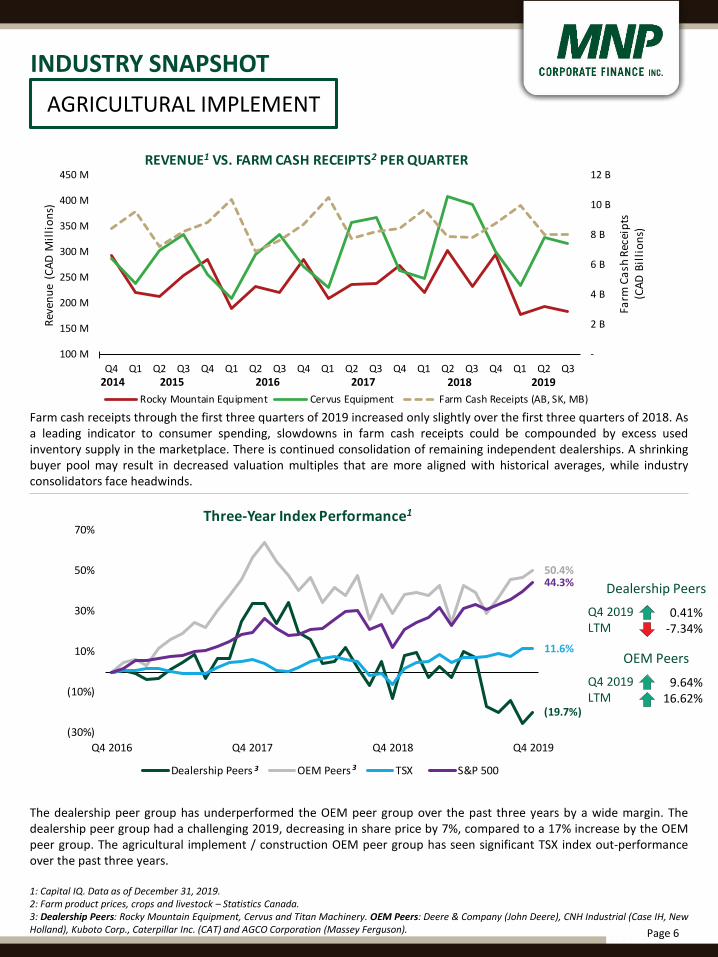
REVENUE1 VS. FARM CASH RECEIPTS2 PER QUARTER
Rocky Mountain Equipment Cervus Equipment Farm Cash Receipts (AB, SK, MB)
(19.7%)
50.4%
11.6%
44.3%
(30%)
(10%)
10%
30%
50%
70%
Q4 2016 Q4 2017 Q4 2018 Q4 2019
Three-Year Index Performance1
Dealership Peers OEM Peers TSX S&P 500
Farm cash receipts through the first three quarters of 2019 increased only slightly over the first three quarters of 2018. Asa leading indicator to consumer spending, slowdowns in farm cash receipts could be compounded by excess usedinventory supply in the marketplace. There is continued consolidation of remaining independent dealerships. A shrinkingbuyer pool may result in decreased valuation multiples that are more aligned with historical averages, while industryconsolidators face headwinds.
The dealership peer group has underperformed the OEM peer group over the past three years by a wide margin. Thedealership peer group had a challenging 2019, decreasing in share price by 7%, compared to a 17% increase by the OEMpeer group. The agricultural implement / construction OEM peer group has seen significant TSX index out-performanceover the past three years.
1: Capital IQ. Data as of December 31, 2019.2: Farm product prices, crops and livestock – Statistics Canada.3: Dealership Peers: Rocky Mountain Equipment, Cervus and Titan Machinery. OEM Peers: Deere & Company (John Deere), CNH Industrial (Case IH, NewHolland), Kuboto Corp., Caterpillar Inc. (CAT) and AGCO Corporation (Massey Ferguson).
2017201620152014
AGRICULTURAL IMPLEMENT
INDUSTRY SNAPSHOT
Q4 2019LTM
0.41%-7.34%
Dealership Peers
Q4 2019LTM
9.64%16.62%
OEM Peers
3 3
2018 2019
Page 7
MACROECONOMIC INDICATORS
-
1.00%
2.00%
3.00%
4.00%
5.00%
%
PRIME INTEREST RATE2
95
98
101
104
107
110
113
116
119
Inde
x
CONSUMER CONFIDENCE INDEX1
1.80
1.85
1.90
1.95
2.00
2.05
2.10
2.15
CAD
Mill
ions
NEW VEHICLE SALES1
30,000
30,500
31,000
31,500
32,000
32,500
33,000
CAD
PER CAPITA DISPOSABLE INCOME1
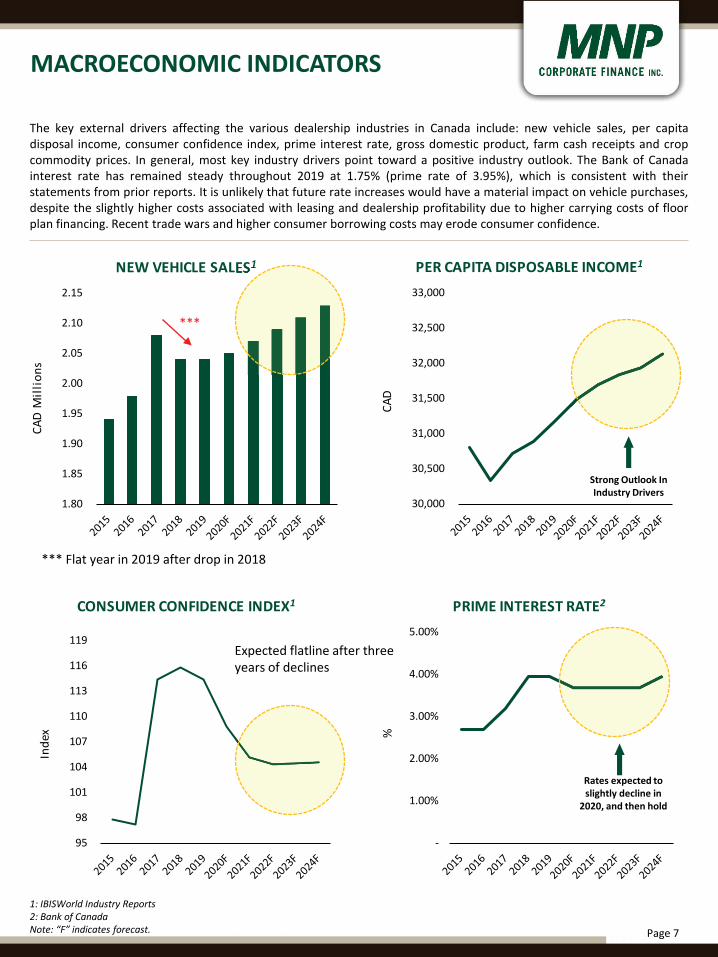
The key external drivers affecting the various dealership industries in Canada include: new vehicle sales, per capitadisposal income, consumer confidence index, prime interest rate, gross domestic product, farm cash receipts and cropcommodity prices. In general, most key industry drivers point toward a positive industry outlook. The Bank of Canadainterest rate has remained steady throughout 2019 at 1.75% (prime rate of 3.95%), which is consistent with theirstatements from prior reports. It is unlikely that future rate increases would have a material impact on vehicle purchases,despite the slightly higher costs associated with leasing and dealership profitability due to higher carrying costs of floorplan financing. Recent trade wars and higher consumer borrowing costs may erode consumer confidence.
1: IBISWorld Industry Reports2: Bank of CanadaNote: “F” indicates forecast.
Rates expected to slightly decline in
2020, and then hold
Strong Outlook In Industry Drivers
*** Flat year in 2019 after drop in 2018
***
Expected flatline after three years of declines
Page 8
MACROECONOMIC INDICATORS
106
108
110
112
114
116
118
100
150
200
250
300
350
400
450
500
550
600
Oct-17 Apr-18 Oct-18 Apr-19 Oct-19
Farm
Inpu
t Pric
e In
dex
CAD/
MT
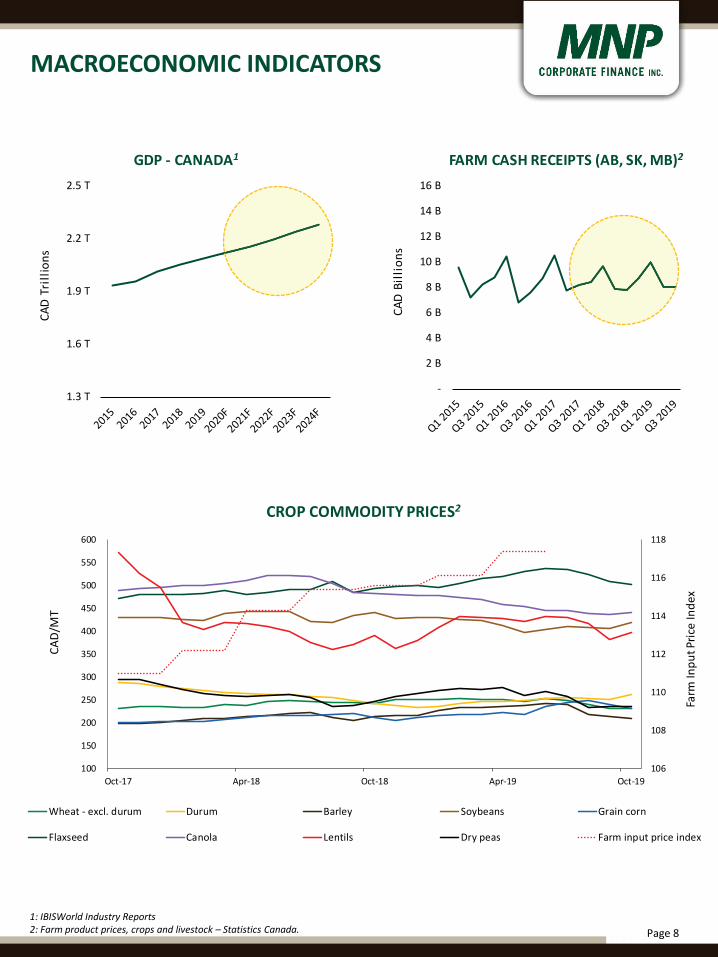
CROP COMMODITY PRICES2
Wheat - excl. durum Durum Barley Soybeans Grain corn
Flaxseed Canola Lentils Dry peas Farm input price index
1.3 T
1.6 T
1.9 T
2.2 T
2.5 T
CAD
Trill
ions
GDP - CANADA1
-
2 B
4 B
6 B
8 B
10 B
12 B
14 B
16 B
CAD
Billi
ons
FARM CASH RECEIPTS (AB, SK, MB)2
1: IBISWorld Industry Reports2: Farm product prices, crops and livestock – Statistics Canada.
Page 9
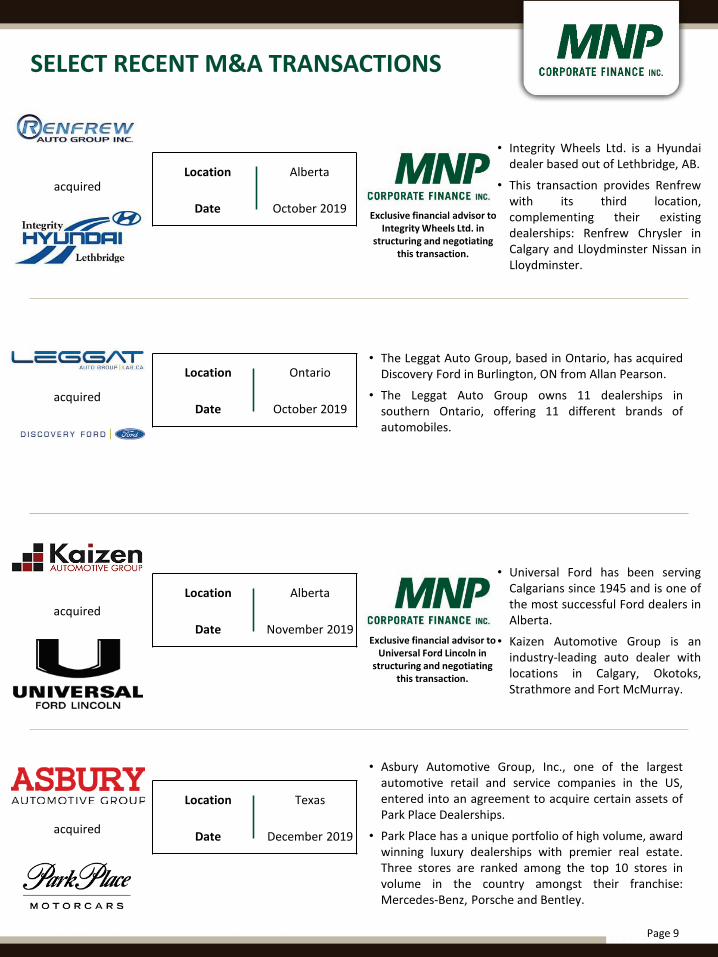
SELECT RECENT M&A TRANSACTIONS
Location Texas
Date December 2019
• Asbury Automotive Group, Inc., one of the largestautomotive retail and service companies in the US,entered into an agreement to acquire certain assets ofPark Place Dealerships.
• Park Place has a unique portfolio of high volume, awardwinning luxury dealerships with premier real estate.Three stores are ranked among the top 10 stores involume in the country amongst their franchise:Mercedes-Benz, Porsche and Bentley.
acquired
Location Ontario
Date October 2019
• The Leggat Auto Group, based in Ontario, has acquiredDiscovery Ford in Burlington, ON from Allan Pearson.
• The Leggat Auto Group owns 11 dealerships insouthern Ontario, offering 11 different brands ofautomobiles.
acquired
Location Alberta
Date November 2019
• Integrity Wheels Ltd. is a Hyundaidealer based out of Lethbridge, AB.
• This transaction provides Renfrewwith its third location,complementing their existingdealerships: Renfrew Chrysler inCalgary and Lloydminster Nissan inLloydminster.
acquiredLocation Alberta
Date October 2019
• Universal Ford has been servingCalgarians since 1945 and is one ofthe most successful Ford dealers inAlberta.
• Kaizen Automotive Group is anindustry-leading auto dealer withlocations in Calgary, Okotoks,Strathmore and Fort McMurray.
acquired
Exclusive financial advisor to Integrity Wheels Ltd. in
structuring and negotiating this transaction.
Exclusive financial advisor to Universal Ford Lincoln in
structuring and negotiating this transaction.
Page 10
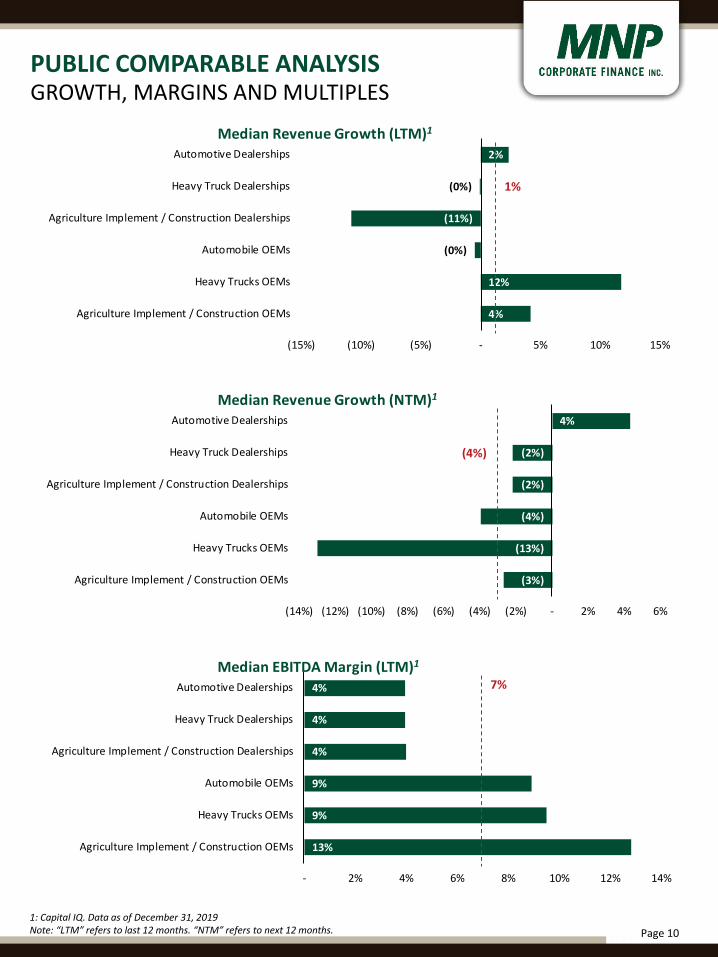
PUBLIC COMPARABLE ANALYSISGROWTH, MARGINS AND MULTIPLES
13%
9%
9%
4%
4%
4%
- 2% 4% 6% 8% 10% 12% 14%
Agriculture Implement / Construction OEMs
Heavy Trucks OEMs
Automobile OEMs
Agriculture Implement / Construction Dealerships
Heavy Truck Dealerships
Automotive Dealerships
Median EBITDA Margin (LTM)1
(3%)
(13%)
(4%)
(2%)
(2%)
4%
(14%) (12%) (10%) (8%) (6%) (4%) (2%) - 2% 4% 6%
Agriculture Implement / Construction OEMs
Heavy Trucks OEMs
Automobile OEMs
Agriculture Implement / Construction Dealerships
Heavy Truck Dealerships
Automotive Dealerships
Median Revenue Growth (NTM)1
4%
12%
(0%)
(11%)
(0%)
2%
(15%) (10%) (5%) - 5% 10% 15%
Agriculture Implement / Construction OEMs
Heavy Trucks OEMs
Automobile OEMs
Agriculture Implement / Construction Dealerships
Heavy Truck Dealerships
Automotive Dealerships
Median Revenue Growth (LTM)1
1%
(4%)
7%
1: Capital IQ. Data as of December 31, 2019Note: “LTM” refers to last 12 months. “NTM” refers to next 12 months.
Page 11
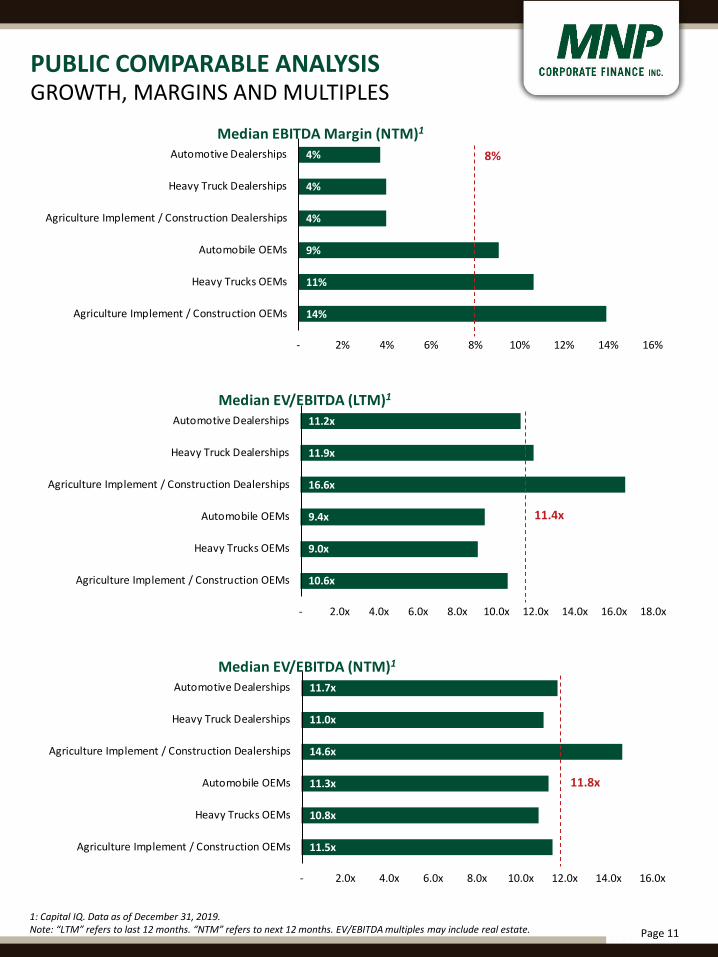
PUBLIC COMPARABLE ANALYSISGROWTH, MARGINS AND MULTIPLES
10.6x
9.0x
9.4x
16.6x
11.9x
11.2x
- 2.0x 4.0x 6.0x 8.0x 10.0x 12.0x 14.0x 16.0x 18.0x
Agriculture Implement / Construction OEMs
Heavy Trucks OEMs
Automobile OEMs
Agriculture Implement / Construction Dealerships
Heavy Truck Dealerships
Automotive Dealerships
Median EV/EBITDA (LTM)1
11.5x
10.8x
11.3x
14.6x
11.0x
11.7x
- 2.0x 4.0x 6.0x 8.0x 10.0x 12.0x 14.0x 16.0x
Agriculture Implement / Construction OEMs
Heavy Trucks OEMs
Automobile OEMs
Agriculture Implement / Construction Dealerships
Heavy Truck Dealerships
Automotive Dealerships
Median EV/EBITDA (NTM)1
14%
11%
9%
4%
4%
4%
- 2% 4% 6% 8% 10% 12% 14% 16%
Agriculture Implement / Construction OEMs
Heavy Trucks OEMs
Automobile OEMs
Agriculture Implement / Construction Dealerships
Heavy Truck Dealerships
Automotive Dealerships
Median EBITDA Margin (NTM)1
8%
11.4x
11.8x
1: Capital IQ. Data as of December 31, 2019.Note: “LTM” refers to last 12 months. “NTM” refers to next 12 months. EV/EBITDA multiples may include real estate.
Page 12
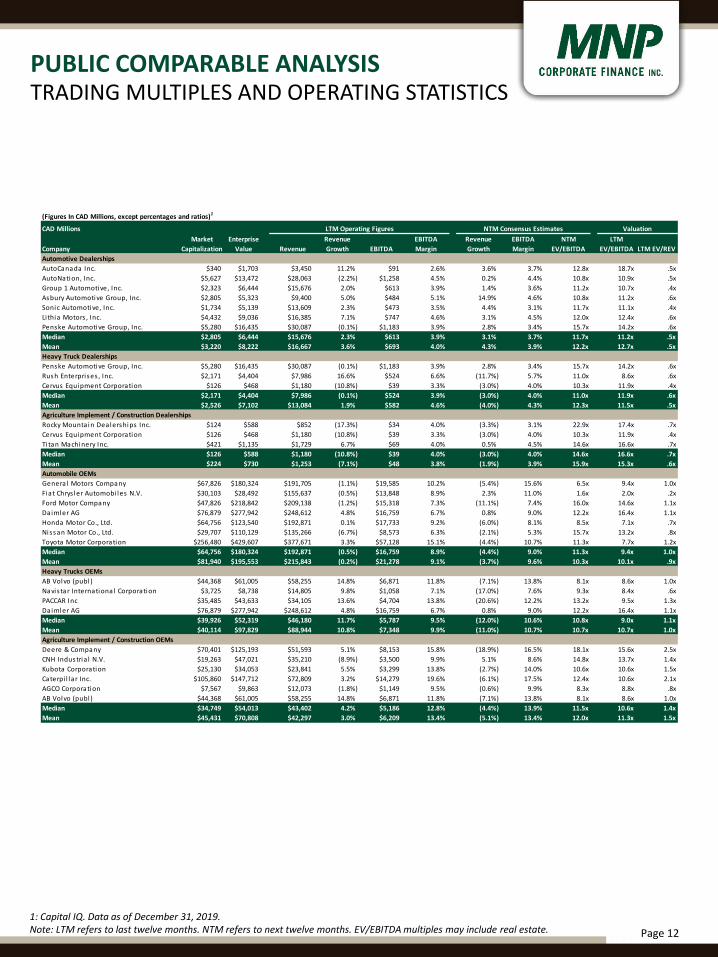
PUBLIC COMPARABLE ANALYSISTRADING MULTIPLES AND OPERATING STATISTICS
CAD Millions
CompanyMarket
CapitalizationEnterprise
Value RevenueRevenue Growth EBITDA
EBITDA Margin
Revenue Growth
EBITDA Margin
NTM EV/EBITDA
LTM EV/EBITDA LTM EV/REV
Automotive DealershipsAutoCanada Inc. $340 $1,703 $3,450 11.2% $91 2.6% 3.6% 3.7% 12.8x 18.7x .5xAutoNation, Inc. $5,627 $13,472 $28,063 (2.2%) $1,258 4.5% 0.2% 4.4% 10.8x 10.9x .5xGroup 1 Automotive, Inc. $2,323 $6,444 $15,676 2.0% $613 3.9% 1.4% 3.6% 11.2x 10.7x .4xAsbury Automotive Group, Inc. $2,805 $5,323 $9,400 5.0% $484 5.1% 14.9% 4.6% 10.8x 11.2x .6xSonic Automotive, Inc. $1,734 $5,139 $13,609 2.3% $473 3.5% 4.4% 3.1% 11.7x 11.1x .4xLi thia Motors , Inc. $4,432 $9,036 $16,385 7.1% $747 4.6% 3.1% 4.5% 12.0x 12.4x .6xPenske Automotive Group, Inc. $5,280 $16,435 $30,087 (0.1%) $1,183 3.9% 2.8% 3.4% 15.7x 14.2x .6xMedian $2,805 $6,444 $15,676 2.3% $613 3.9% 3.1% 3.7% 11.7x 11.2x .5xMean $3,220 $8,222 $16,667 3.6% $693 4.0% 4.3% 3.9% 12.2x 12.7x .5xHeavy Truck DealershipsPenske Automotive Group, Inc. $5,280 $16,435 $30,087 (0.1%) $1,183 3.9% 2.8% 3.4% 15.7x 14.2x .6xRush Enterprises , Inc. $2,171 $4,404 $7,986 16.6% $524 6.6% (11.7%) 5.7% 11.0x 8.6x .6xCervus Equipment Corporation $126 $468 $1,180 (10.8%) $39 3.3% (3.0%) 4.0% 10.3x 11.9x .4xMedian $2,171 $4,404 $7,986 (0.1%) $524 3.9% (3.0%) 4.0% 11.0x 11.9x .6xMean $2,526 $7,102 $13,084 1.9% $582 4.6% (4.0%) 4.3% 12.3x 11.5x .5xAgriculture Implement / Construction DealershipsRocky Mounta in Dealerships Inc. $124 $588 $852 (17.3%) $34 4.0% (3.3%) 3.1% 22.9x 17.4x .7xCervus Equipment Corporation $126 $468 $1,180 (10.8%) $39 3.3% (3.0%) 4.0% 10.3x 11.9x .4xTi tan Machinery Inc. $421 $1,135 $1,729 6.7% $69 4.0% 0.5% 4.5% 14.6x 16.6x .7xMedian $126 $588 $1,180 (10.8%) $39 4.0% (3.0%) 4.0% 14.6x 16.6x .7xMean $224 $730 $1,253 (7.1%) $48 3.8% (1.9%) 3.9% 15.9x 15.3x .6xAutomobile OEMsGenera l Motors Company $67,826 $180,324 $191,705 (1.1%) $19,585 10.2% (5.4%) 15.6% 6.5x 9.4x 1.0xFiat Chrys ler Automobi les N.V. $30,103 $28,492 $155,637 (0.5%) $13,848 8.9% 2.3% 11.0% 1.6x 2.0x .2xFord Motor Company $47,826 $218,842 $209,138 (1.2%) $15,318 7.3% (11.1%) 7.4% 16.0x 14.6x 1.1xDaimler AG $76,879 $277,942 $248,612 4.8% $16,759 6.7% 0.8% 9.0% 12.2x 16.4x 1.1xHonda Motor Co., Ltd. $64,756 $123,540 $192,871 0.1% $17,733 9.2% (6.0%) 8.1% 8.5x 7.1x .7xNissan Motor Co., Ltd. $29,707 $110,129 $135,266 (6.7%) $8,573 6.3% (2.1%) 5.3% 15.7x 13.2x .8xToyota Motor Corporation $256,480 $429,607 $377,671 3.3% $57,128 15.1% (4.4%) 10.7% 11.3x 7.7x 1.2xMedian $64,756 $180,324 $192,871 (0.5%) $16,759 8.9% (4.4%) 9.0% 11.3x 9.4x 1.0xMean $81,940 $195,553 $215,843 (0.2%) $21,278 9.1% (3.7%) 9.6% 10.3x 10.1x .9xHeavy Trucks OEMsAB Volvo (publ ) $44,368 $61,005 $58,255 14.8% $6,871 11.8% (7.1%) 13.8% 8.1x 8.6x 1.0xNavis tar International Corporation $3,725 $8,738 $14,805 9.8% $1,058 7.1% (17.0%) 7.6% 9.3x 8.4x .6xPACCAR Inc $35,485 $43,633 $34,105 13.6% $4,704 13.8% (20.6%) 12.2% 13.2x 9.5x 1.3xDaimler AG $76,879 $277,942 $248,612 4.8% $16,759 6.7% 0.8% 9.0% 12.2x 16.4x 1.1xMedian $39,926 $52,319 $46,180 11.7% $5,787 9.5% (12.0%) 10.6% 10.8x 9.0x 1.1xMean $40,114 $97,829 $88,944 10.8% $7,348 9.9% (11.0%) 10.7% 10.7x 10.7x 1.0xAgriculture Implement / Construction OEMsDeere & Company $70,401 $125,193 $51,593 5.1% $8,153 15.8% (18.9%) 16.5% 18.1x 15.6x 2.5xCNH Industria l N.V. $19,263 $47,021 $35,210 (8.9%) $3,500 9.9% 5.1% 8.6% 14.8x 13.7x 1.4xKubota Corporation $25,130 $34,053 $23,841 5.5% $3,299 13.8% (2.7%) 14.0% 10.6x 10.6x 1.5xCaterpi l lar Inc. $105,860 $147,712 $72,809 3.2% $14,279 19.6% (6.1%) 17.5% 12.4x 10.6x 2.1xAGCO Corporation $7,567 $9,863 $12,073 (1.8%) $1,149 9.5% (0.6%) 9.9% 8.3x 8.8x .8xAB Volvo (publ ) $44,368 $61,005 $58,255 14.8% $6,871 11.8% (7.1%) 13.8% 8.1x 8.6x 1.0xMedian $34,749 $54,013 $43,402 4.2% $5,186 12.8% (4.4%) 13.9% 11.5x 10.6x 1.4xMean $45,431 $70,808 $42,297 3.0% $6,209 13.4% (5.1%) 13.4% 12.0x 11.3x 1.5x
(Figures In CAD Millions, except percentages and ratios)1
LTM Operating Figures NTM Consensus Estimates Valuation
1: Capital IQ. Data as of December 31, 2019.Note: LTM refers to last twelve months. NTM refers to next twelve months. EV/EBITDA multiples may include real estate.
Page 13
LEADERSHIP TEAM
DUE DILIGENCE LEADERSHIP
TRANSACTION LEADERSHIP
Aleem BandaliManaging Director
Dale AntonsenManaging Director
John CaggianielloManaging Director
[email protected] 416.513.4177
Brett FranklinPresident
Mike ReynoldsManaging Director
Johnny EarlManaging Director
[email protected] 604.637.1514
Dan PorterManaging Director
Stephen ShawManaging Director
Kevin TremblayManaging Director
Mark RegehrManaging Director
Craig MaloneyManaging Director
Patrick KhouzamManaging Director
Jason BurgessManaging Director
Erik St-HilaireManaging Director
Page 14
RECENTLY CLOSED DEALS
NATIONAL