dear author, please, note that changes made to the html
TRANSCRIPT

Dear Author, Please, note that changes made to the HTML content will be added to the article before publication, but are not reflected in this PDF. Note also that this file should not be used for submitting corrections.

UNCO
RRECTED P
RO
OF
1Q2 Is long range transport of pollen in the NW Mediterranean basin2 influenced by Northern Hemisphere teleconnection patterns?
3Q3 Rebeca Izquierdo a,⁎, Marta Alarcon a, Cristina Periago a, Jordina Belmonte b,c
4 a Departament de Física i Enginyeria Nuclear, Universitat Politècnica de Catalunya, C/Urgell 187, 08036 Barcelona, Spain5 b Institut de Ciencia i Tecnología Ambientals (ICTA), Universitat Autònoma de Barcelona (UAB). Edifici C, 08193 Bellaterra, Spain6 c Departament de Biologia Animal, Biologia Vegetal i Ecologia, Universitat Autònoma de Barcelona (UAB). Edifici C, 08193 Bellaterra, Spain
7
9 H I G H L I G H T S
10
11 • Teleconnection patterns influence at-12 mospheric circulation in Mediterranean13 basin.14 • Effects of climatic variability on airborne15 pollen transport were examined.16 • Pollen transport from Europe was related17 with negative NAOi, AOi and WeMOi.18 • Pollen transport from S and W Europe19 was linkedwith positive AOi andWeMOi.20
2 1 G R A P H I C A L A B S T R A C T
22
23
2425
27272829
3031
3 2
a b s t r a c t3 3 a r t i c l e i n f o
34 Article history:35 Received 8 April 201536 Received in revised form 3 June 201537 Accepted 13 June 201538 Available online xxxx3940 Editor: D. Barcelo
41
42 Climatic oscillations triggered by the atmospheric modes of the Northern Hemisphere teleconnection43 patterns have an important influence on the atmospheric circulation at synoptic scale in Western Mediter-
44ranean Basin. Simultaneously, this climate variability could affect a variety of ecological processes. This45work provides a first assessment of the effect of North Atlantic Oscillation (NAO), Arctic Oscillation (AO)46and Western Mediterranean Oscillation (WeMO) on the atmospheric long-range pollen transport episodes47in the North-Eastern Iberian Peninsula for the period 1994–2011. Alnus, Ambrosia, Betula, Corylus and Fagus48have been selected as allergenic pollen taxa with potential long-range transport associated to the Northern49Hemisphere teleconnection patterns in the Western Mediterranean Basin. The results showed an increase50of long range pollen transport episodes of: (1) Alnus, Corylus and Fagus from Western and Central Europe51during the negative phase of annual NAO and AO; (2) Ambrosia, Betula and Fagus from Europe during the52negative phase of winter WeMO; (3) Corylus and Fagus from Mediterranean area during the positive53phase of the annual AO; and (4) Ambrosia from France and Northern Europe during the positive phase of54winter WeMO. Conversely, the positive phase of annual NAO and AO are linked with the regional transport55of Alnus, Betula and Corylus from Western Iberian Peninsula. The positive phase of annual WeMO was also56positively correlated with regional transport of Corylus from this area.57© 2015 Published by Elsevier B.V.
5859
60
61
621. Introduction
63The atmospheric dynamics in the Western Mediterranean Basin is64conditioned by complex interactions of climatic and topographic factors65(Millán et al., 1997; Rodríguez et al., 2003; Ulbrich et al., 2012). Indeed,
Science of the Total Environment xxx (2015) xxx–xxx
STOTEN-17924; No of Pages 9
⁎ Corresponding author.E-mail address: [email protected] (R. Izquierdo).
http://dx.doi.org/10.1016/j.scitotenv.2015.06.0470048-9697/© 2015 Published by Elsevier B.V.
Contents lists available at ScienceDirect
Science of the Total Environment
j ourna l homepage: www.e lsev ie r .com/ locate /sc i totenv
Please cite this article as: Izquierdo, R., et al., Is long range transport of pollen in the NWMediterranean basin influenced byNorthern Hemisphereteleconnection patterns?, Sci Total Environ (2015), http://dx.doi.org/10.1016/j.scitotenv.2015.06.047

UNCO
RRECTED P
RO
OF
66 theMediterranean region is among the “Hot Spots” likely to experience67 major climatic changes in the twenty-first century as a result of68 the global increase in greenhouse gas concentrations (Giorgi, 2006;69 IPCC, 2007). Changes in naturally-occurring patterns or “modes” of70 atmospheric and oceanic variability such as the North Atlantic Oscilla-71 tion (NAO), the Arctic Oscillation (AO), and theWesternMediterranean72 Oscillation (WeMO) have an important influence on the temporal73 variability of atmospheric circulation at synoptic scale and rainfall in74 Western Mediterranean Basin (Goodess and Jones, 2002; Dünkeloh75 and Jacobeit, 2003; Martín-Vide and Lopez-Bustins, 2006). Concretely,76 the Iberian Peninsula, and particularly its Mediterranean fringe, is an77 area of confluence of several atmospheric patterns acting synchronically78 with different intensity and effects on precipitation (Gonzalez-Hidalgo79 et al., 2009; Izquierdo et al., 2014).80 At the same time, there is a growing appreciation that changes in the81 frequency and amplitude of modes of climate variability profoundly82 influence a variety of ecological processes determining both species83 density and distribution in a wide range of terrestrial ecosystems84 (Ottersen et al., 2001; Stenseth et al., 2002; Mysterud et al., 2003;85 Straile and Stenseth, 2007). Many studies point out the role of phenolo-86 gy as one of the most important bio-indicators to study the direct87 impact of global change on different species, both at temporal and88 spatial levels (Menzel et al., 2006; Jochner and Menzel, 2015). In this89 context, the pollen content in the air offers a quantitative variable to90 measure the flora phenology and abundance of anemophilous plants.91 A lengthening of the active growing season in Europe has been relat-92 ed to increases inwinter and spring temperatures, whichmay in turn be93 associated with strongly positive indices of NAO (Marshall et al., 2001;94 Ottersen et al., 2001). The NAO influence on the timing and severity of95 pollen season has also been detected on different pollen taxa in North-96 ern and Central Europe (D'Odorico et al., 2002), including allergenic97 pollen as Betula and Poaceae (D'Odorico et al., 2002; Stach et al.,98 2008a,b). However, a NW–SE gradient of spatial differences in the99 amount of influence exerted by NAO on the timing and magnitude of100 Poaceae pollen season has been identified in Europe (Smith et al.,101 2009). Then, the weakest relationship between start dates of Poaceae102 pollen season and winter averages of the NAO were seen at southern103 Iberian Peninsula (Smith et al., 2009). Despite the feeblest influence of104 NAO in the Mediterranean area, the start and the end of pollen season,105 as well as the peak day of Cupressaceae pollen concentration, were106 related with phases of NAO in central Italy (Dalla Marta et al., 2011).107 In addition, a recent study carried on NE Iberian Peninsula showed108 that years of positive phases of NAO, AO and WeMO indices involved a109 decrease of annual pollen index, and, at the same time, an advance110 and enlargement of pollination season for most of 22 pollen taxa111 considered of high interest due to the abundance, landscape importance112 and/or allergenic significance in the Western Mediterranean Basin113 (Izquierdo et al., nd).114 Taking into account that airborne pollen concentrations depend115 both on local flora and atmospheric transport from distant regions, the116 study of airborne pollen transport may help to comprehend pollen117 count variations andmore accurately predict its atmospheric concentra-118 tions (Damialis et al., 2005; Prank et al., 2013). The computation of119 backward trajectories through the Hybrid Single Particle Lagrangian120 Integrated Trajectory (HYSPLIT) model (Draxler et al., 2009) is broadly121 used to explain atmospheric transport of pollen (Smith et al., 2008;122 Skjøth et al., 2009; Izquierdo et al., 2011; Zemmer et al., 2012).123 Cluster analysis has been widely used to categorize back trajectories124 (Dorling and Davies, 1995; Jorba et al., 2004; Markou and125 Kassomenos, 2010) and to identify synoptic weather regimes and126 long-range transport patterns that affect air quality (Cape et al., 2000;127 Salvador et al., 2007; Valenzuela et al., 2012). Recently, this procedure128 has been also used for interpreting airborne pollen levels (Makra et al.,129 2010; Hernández-Ceballos et al., 2011, 2014).130 According to the spatial variations observed, further research is nec-131 essary to well-understand the influence of NAO and other atmospheric
132teleconnection patterns on production, release, dispersal and transport133of pollen at regional scale, specially the effects on allergenic pollen.134The hypothesis of this study is that long range transport (LRT thereafter)135of pollen can be partly explained as an effect of the Northern136Hemisphere teleconnection patterns. Therefore, the aim here is to137study the influence of the main circulation patterns as represented by138North Atlantic Oscillation (NAO), Artic Oscillation (AO) and Western139Mediterranean Oscillation (WeMO) on 5 pollen taxa with potential140LRT collected at 6 localities in Catalonia (NE Iberian Peninsula) during141the 18-years period 1994–2011, in order to determine a possible142increase of LRT episodes of pollen associated to climate variability143which could affect allergenic diseases and the public health.
1442. Data & methodology
1452.1. Pollen records
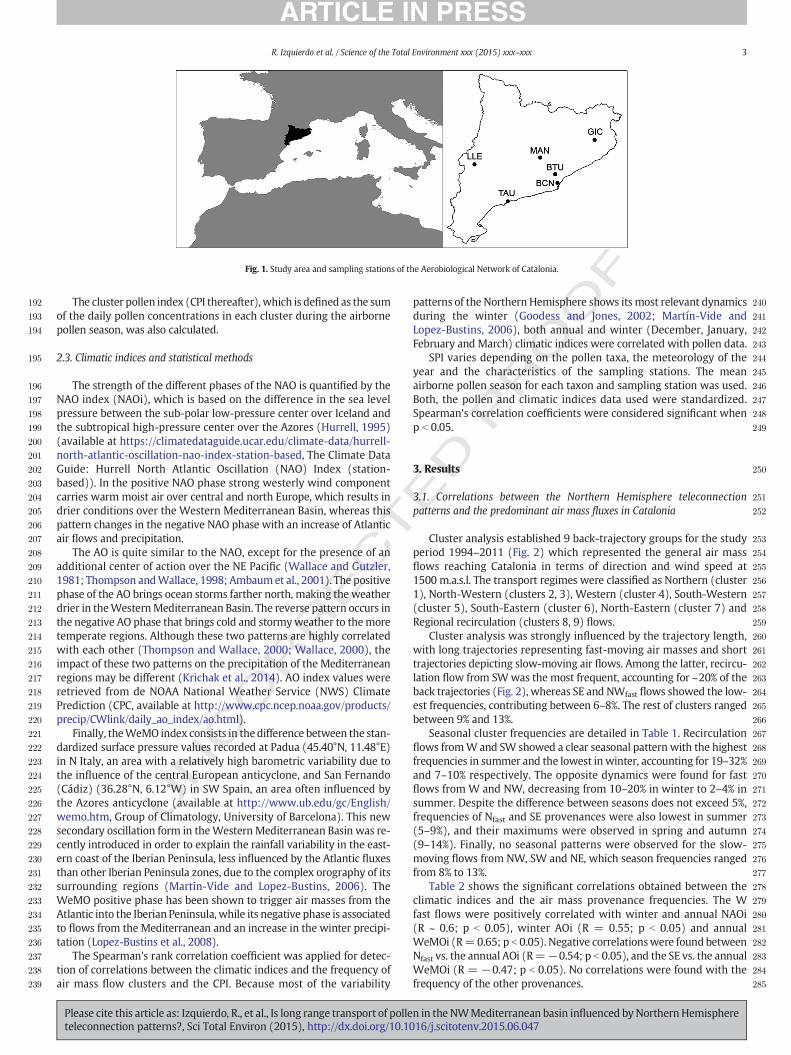
146Airborne pollen data were recorded by the Aerobiological Network147of Catalonia at six stations located in: Barcelona (BCN), Bellaterra148(BTU), for the 18-year period 1994–2011, and Girona (GIC), Lleida149(LLE), Manresa (MAN), and Tarragona (TAU) for the 16-year period1501996–2011 (Fig. 1). Samples were obtained daily from Hirst samplers151(Hirst, 1952), the standardized method in European aerobiological152networks, and analyzed following the standardized Spanish method153(Galán Soldevilla et al., 2007). The daily pollen concentrations for 5154pollen taxa considered of potential LRT in the Western Mediterranean155Basin (Belmonte et al., 2000, 2008a,b; Fernández-Llamazares et al.,1562012) have been used: Alnus, Ambrosia, Betula, Corylus and Fagus.157These pollen taxa are regarded of high interest due to their allergenic158significance, excepting Fagus (Skjøth et al., 2012).159The airborne pollen season has been calculated as the period160between the date when the sum of daily mean pollen concentrations161reaches 2.5% of the total annual sum and the datewhen the sum reaches16297.5%; i.e., the time with 95% of the whole pollen amount (Andersen,1631991; Torben, 1991). The seasonal pollen index (SPI) was the sum of164the daily pollen concentrations recorded during this period.
1652.2. Trajectory computation and cluster analysis
166A daily analysis was undertaken based on 96-h isosigma back-167trajectories at 12:00 h UTC and 1500 m.a.s.l. at Manresa station, consid-168ered by its situation as representative of the synoptic scale circulation169features of the Catalan area, by using the HYSPLIT (Hybrid Single-170Particle Lagrangian Integrated Trajectory) 4.0 dispersion model from171the Air Resources Laboratory (ARL, available at http://www.arl.noaa.172gov/ready/hysplit4.html, Draxler and Rolph, 2003). This height can be173taken as representative of themean atmospheric transport at a synoptic174scale within the upper boundary layer (Izquierdo et al., 2014). The175meteorological input was obtained from the NCEP (National Center for176Environmental Prediction) using the ARL reanalysis database for the1771994–1996 period, the FNL archive for the 1997–2005 period, and the178GDAS (Global Data Assimilation System) database for the 2006–2011179period.180Cluster analysis statistically aggregates observations into groups so181that each of them is as homogeneous as possible with respect to the182clustering variables (Sharma, 1996). To compose each cluster, HYSPLIT183has a grouping module based on variations in the total spatial variance184between different clusters which is compared to the spatial variance185within each cluster component. The final number of clusters is deter-186mined by a change in total spatial variance as clusters are iteratively187paired (Draxler et al., 2009). This statistical methodology was applied188to daily back-trajectories for the period from 1994 to 2011 with the189aim to analyze the main atmospheric circulation patterns. The 24 h-190time interval was used (thus 4 coordinates each back trajectory of 96-191h) to conduct the cluster analysis in a single run.
2 R. Izquierdo et al. / Science of the Total Environment xxx (2015) xxx–xxx
Please cite this article as: Izquierdo, R., et al., Is long range transport of pollen in the NWMediterranean basin influenced byNorthern Hemisphereteleconnection patterns?, Sci Total Environ (2015), http://dx.doi.org/10.1016/j.scitotenv.2015.06.047
UNCO
RRECTED P
RO
OF
192 The cluster pollen index (CPI thereafter), which is defined as the sum193 of the daily pollen concentrations in each cluster during the airborne194 pollen season, was also calculated.
195 2.3. Climatic indices and statistical methods
196 The strength of the different phases of the NAO is quantified by the197 NAO index (NAOi), which is based on the difference in the sea level198 pressure between the sub-polar low-pressure center over Iceland and199 the subtropical high-pressure center over the Azores (Hurrell, 1995)200 (available at https://climatedataguide.ucar.edu/climate-data/hurrell-201 north-atlantic-oscillation-nao-index-station-based, The Climate Data202 Guide: Hurrell North Atlantic Oscillation (NAO) Index (station-203 based)). In the positive NAO phase strong westerly wind component204 carries warm moist air over central and north Europe, which results in205 drier conditions over the Western Mediterranean Basin, whereas this206 pattern changes in the negative NAO phase with an increase of Atlantic207 air flows and precipitation.208 The AO is quite similar to the NAO, except for the presence of an209 additional center of action over the NE Pacific (Wallace and Gutzler,210 1981; Thompson andWallace, 1998; Ambaumet al., 2001). The positive211 phase of the AO brings ocean storms farther north, making the weather212 drier in theWesternMediterranean Basin. The reverse pattern occurs in213 the negative AO phase that brings cold and stormyweather to themore214 temperate regions. Although these two patterns are highly correlated215 with each other (Thompson and Wallace, 2000; Wallace, 2000), the216 impact of these two patterns on the precipitation of the Mediterranean217 regions may be different (Krichak et al., 2014). AO index values were218 retrieved from de NOAA National Weather Service (NWS) Climate219 Prediction (CPC, available at http://www.cpc.ncep.noaa.gov/products/220 precip/CWlink/daily_ao_index/ao.html).221 Finally, theWeMO index consists in the difference between the stan-222 dardized surface pressure values recorded at Padua (45.40°N, 11.48°E)223 in N Italy, an area with a relatively high barometric variability due to224 the influence of the central European anticyclone, and San Fernando225 (Cádiz) (36.28°N, 6.12°W) in SW Spain, an area often influenced by226 the Azores anticyclone (available at http://www.ub.edu/gc/English/227 wemo.htm, Group of Climatology, University of Barcelona). This new228 secondary oscillation form in theWestern Mediterranean Basin was re-229 cently introduced in order to explain the rainfall variability in the east-230 ern coast of the Iberian Peninsula, less influenced by the Atlantic fluxes231 than other Iberian Peninsula zones, due to the complex orography of its232 surrounding regions (Martín-Vide and Lopez-Bustins, 2006). The233 WeMO positive phase has been shown to trigger air masses from the234 Atlantic into the Iberian Peninsula, while its negative phase is associated235 to flows from the Mediterranean and an increase in the winter precipi-236 tation (Lopez-Bustins et al., 2008).237 The Spearman's rank correlation coefficient was applied for detec-238 tion of correlations between the climatic indices and the frequency of239 air mass flow clusters and the CPI. Because most of the variability
240patterns of the Northern Hemisphere shows its most relevant dynamics241during the winter (Goodess and Jones, 2002; Martín-Vide and242Lopez-Bustins, 2006), both annual and winter (December, January,243February and March) climatic indices were correlated with pollen data.244SPI varies depending on the pollen taxa, the meteorology of the245year and the characteristics of the sampling stations. The mean246airborne pollen season for each taxon and sampling station was used.247Both, the pollen and climatic indices data used were standardized.248Spearman's correlation coefficients were considered significant when249p b 0.05.
2503. Results
2513.1. Correlations between the Northern Hemisphere teleconnection252patterns and the predominant air mass fluxes in Catalonia
253Cluster analysis established 9 back-trajectory groups for the study254period 1994–2011 (Fig. 2) which represented the general air mass255flows reaching Catalonia in terms of direction and wind speed at2561500 m.a.s.l. The transport regimes were classified as Northern (cluster2571), North-Western (clusters 2, 3), Western (cluster 4), South-Western258(cluster 5), South-Eastern (cluster 6), North-Eastern (cluster 7) and259Regional recirculation (clusters 8, 9) flows.260Cluster analysis was strongly influenced by the trajectory length,261with long trajectories representing fast-moving air masses and short262trajectories depicting slow-moving air flows. Among the latter, recircu-263lation flow from SWwas the most frequent, accounting for ~20% of the264back trajectories (Fig. 2), whereas SE and NWfast flows showed the low-265est frequencies, contributing between 6–8%. The rest of clusters ranged266between 9% and 13%.267Seasonal cluster frequencies are detailed in Table 1. Recirculation268flows fromW and SW showed a clear seasonal pattern with the highest269frequencies in summer and the lowest in winter, accounting for 19–32%270and 7–10% respectively. The opposite dynamics were found for fast271flows from W and NW, decreasing from 10–20% in winter to 2–4% in272summer. Despite the difference between seasons does not exceed 5%,273frequencies of Nfast and SE provenances were also lowest in summer274(5–9%), and their maximums were observed in spring and autumn275(9–14%). Finally, no seasonal patterns were observed for the slow-276moving flows from NW, SW and NE, which season frequencies ranged277from 8% to 13%.278Table 2 shows the significant correlations obtained between the279climatic indices and the air mass provenance frequencies. The W280fast flows were positively correlated with winter and annual NAOi281(R ~ 0.6; p b 0.05), winter AOi (R = 0.55; p b 0.05) and annual282WeMOi (R=0.65; p b 0.05). Negative correlationswere found between283Nfast vs. the annual AOi (R=−0.54; p b 0.05), and the SE vs. the annual284WeMOi (R = −0.47; p b 0.05). No correlations were found with the285frequency of the other provenances.
Fig. 1. Study area and sampling stations of the Aerobiological Network of Catalonia.
3R. Izquierdo et al. / Science of the Total Environment xxx (2015) xxx–xxx
Please cite this article as: Izquierdo, R., et al., Is long range transport of pollen in the NWMediterranean basin influenced byNorthern Hemisphereteleconnection patterns?, Sci Total Environ (2015), http://dx.doi.org/10.1016/j.scitotenv.2015.06.047

UNCO
RRECTED P
RO
OF
286 3.2. Relationship between climatic indices and pollen transport in Catalonia
287 The frequency of air mass provenances and the CPI mean of the 6288 sampling stations specifically for the airborne pollen season of each289 taxon are presented in Table 3. Regional recirculation flows showed290 the highest frequencies for the pollen season of Ambrosia (47%), Betula291 (37%) and Fagus (38%), however only accounted for 16–29% of their292 total CPI. Conversely, the less frequent NE flow (7–10%) showed the293 highest CPI of Ambrosia (35%), Betula (29%) and Fagus (36%). The low294 frequencies of Nfast during the pollen season of Betula (12%) and Fagus295 (9%) also recorded high CPI values for these taxa, 22% and 16% respec-296 tively. The highest CPI of Alnus and Corylus (21–23%) were registered297 by theWfast flows, which frequencies were ~15% in their pollen season.298 Finally, highlight the low CPI of Ambrosia for the Atlantic sector flows299 (from C1. Nfast to C5. SWslow), since with a frequency of 43% only300 contained the 19% of its total CPI.301 The influence of the Northern Hemisphere teleconnection patterns302 on the dominant atmospheric fluxes may involve LRT of pollen. At the303 same time, these climate patterns are also associated to variations of304 weather parameters that may modify pollen dynamics at local level,305 such as temperature, insolation and precipitation. Hence, the correct306 interpretation of statistical results is essential, since significant relation-307 ships between climatic indices and CPI do not necessarily entail LRT of308 pollen. The higher the frequency of the air fluxes of a given309 provenance, the higher possibility of foreign pollen arrivals from this
310specific provenance. Consequently, higher CPI having the same prove-311nance than the dominant provenance triggered by the modes of the312Northern Hemisphere teleconnection patterns has been expected.313According to this LRT premise, Spearman's correlations between the314climatic indices and CPI of Alnus, Ambrosia, Betula, Corylus and Fagus at315the six sampling stations for the period 1994–2011 were performed316(Table 4). To better understand these results, single back-trajectories317for the days with pollen presence in the clusters with significant corre-318lations have been also considered.319According with LRT premise, from the 78 significant correlations320obtained between the three climatic indices and CPI of Alnus, Ambrosia,321Betula,Corylus and Fagus (Table 4), only 5 of these (superscript 1) agreed322with the significant relationships detected between theNorthernHemi-323sphere teleconnection patterns and the air mass provenances (Table 2):324(1) the positive correlation between the winter NAOi vs. Wfast CPI of325Ambrosia at Lleida; (2) the negative correlations between the annual326AOi vs. Nfast CPI of Alnus at Tarragona and (3) Fagus at Girona; and327(4) the positive correlations between the annual WeMOi vs. Wfast CPI328of Ambrosia at Lleida and (5) Corylus at Tarragona. The Wfast CPI of329Ambrosia at Lleida was 2.8 pollen grains recorded in 3 days, which330accounted for 0.2% of the whole pollen season trajectories (not331shown). Consequently, these were considered as isolated LRT episodes332(Table 4, superscript 4), independent of the phases of NAO and WeMO333and have been excluded for further discussion. On the other hand, the334cases in which the sign of the correlation in Table 2 do not coincide335with that one in Table 4, indicating disagreement with the LRT premise336(Table 4, superscript 3) have also been excluded. This is the case of the
Fig. 2. Cluster centroids and number of back-trajectories (in percentage) associated to each cluster for 1994–2011 period. Back-trajectories (96 h) from theManresa station, calculated at1500 m.a.s.l.
t1:1Q1 Table 1t1:2 Seasonality of atmospheric transport regimes for period 1994–2011. Frequency of back-t1:3 trajectories associated to each cluster (%). Winter: December–February, spring: March–t1:4 May, summer: June–August and autumn: September–November.
t1:5 Season Annual Winter(DJF)
Spring(MAM)
Summer(JJA)
Autumn(SON)
t1:6 n n % n % n % n %
t1:7 C1. Nfast 786 188 12% 224 14% 155 9% 219 13%t1:8 C2. NWfast 390 155 10% 95 6% 29 2% 111 7%t1:9 C3. NWslow 742 191 12% 186 11% 180 11% 185 11%t1:10 C4. Wfast 721 325 20% 174 11% 74 4% 148 9%t1:11 C5. SWslow 606 163 10% 155 9% 124 8% 164 10%t1:12 C6. SE 489 119 7% 141 9% 90 5% 139 9%t1:13 C7. NE 716 193 12% 219 13% 148 9% 156 10%t1:14 C8. WRecirc. 820 114 7% 190 12% 315 19% 201 12%t1:15 C9. SWRecirc. 1278 169 10% 265 16% 533 32% 311 19%t1:16 Total 6548 1617 100% 1649 100% 1648 100% 1634 100%
t2:1Table 2t2:2Spearman's rank correlation coefficients (rs) between climatic indices and air mass prov-t2:3enance frequencies.
t2:4Provenance frequenciest2:5(%)
NAOi AOi WeMOi
t2:6Winter Annual Winter Annual Winter Annual
t2:7C1. Nfast 0.06 −0.35 −0.14 −0.54⁎ 0.25 0.11t2:8C2. NWfast 0.29 −0.06 0.33 −0.23 0.06 0.37t2:9C3. NWslow 0.03 −0.10 −0.24 0.11 0.10 0.24t2:10C4. Wfast 0.59⁎ 0.58⁎ 0.55⁎ 0.37 0.26 0.65⁎
t2:11C5. SWslow 0.39 0.17 0.41 0.32 0.37 0.44t2:12C6. SE −0.02 0.20 0.25 0.41 −0.25 −0.47⁎
t2:13C7. NE −0.34 −0.39 −0.09 −0.43 −0.40 −0.35t2:14C8. WRecirc. −0.02 −0.25 −0.21 −0.06 0.06 −0.28t2:15C9. SWRecirc. −0.23 0.24 −0.07 0.15 −0.12 −0.13
t2:16⁎ p b 0.05.
4 R. Izquierdo et al. / Science of the Total Environment xxx (2015) xxx–xxx
Please cite this article as: Izquierdo, R., et al., Is long range transport of pollen in the NWMediterranean basin influenced byNorthern Hemisphereteleconnection patterns?, Sci Total Environ (2015), http://dx.doi.org/10.1016/j.scitotenv.2015.06.047

UNCO
RRECTED P
RO
OF
337 negative correlations between thewinter NAOi vs.Wfast CPI of Ambrosia338 at Bellaterra and Fagus at Lleida; as well as the annual WeMOi vs. Wfast
339 CPI of Betula at Bellaterra, despite that whose provenances showed340 significant correlations with climatic indices (Table 2). This means341 that Wfast frequency decreased during negative phases of Northern342 Hemisphere teleconnection patterns, but at the same time higher CPI343 was detected from this provenance, which could indicate that an344 increase of pollen production in the source areas has been occurred.345 However cases in disagreement with LRT premise also could be related346 with an increase of local pollen concentrations or precipitationwashout347 effect, consequently only cases according with LRT premise have been348 taken into account in this study.349 Fig. 3 depicts the dynamics of climatic indices and CPI significantly350 correlated that were according with LRT premise (Table 4, superscript351 1). Annual AOi and the percentage, in the Nfast cluster, of Alnus pollen352 at Tarragona and Fagus at Girona with respect to the SPI of each taxon,353 showing opposite dynamics for 1996–2011 period (Fig. 3a). In contrast,354 annual WeMOi and percentage of Corylus pollen in the cluster Wfast at355 Tarragona with respect to the Corylus SPI followed similar dynamics356 (Fig. 3b). It should be note that there is a high annual variability, with357 years in which LRT accounted for 36% (Alnus at Tarragona) and 45%358 (Fagus at Girona) from Nfast, and 50% (Corylus at Tarragona) from359 Wfast. These percentages ranged between 11–20% for thewhole period.360 The rest of significant correlations (Table 4) between climatic indices361 and CPI of Alnus, Ambrosia, Betula, Corylus and Faguswere also examined362 in detail and commented below. The taxa in which the sign of the363 correlation in Table 4 (superscript 2) was in accordance with the sign364 of the correlation in Table 2, despite that these were non-significant365 (rs N 0.10, p N 0.05; Table 2), were considered in agreement with the366 LRT premise. On the other hand, the provenances with non-significant367 correlations and rs b 0.10 (Table 2) were discarded (Table 4, superscript368 5), aswell as those inwhich the sign of the correlation showeddisagree-369 ment with LRT premise and the isolated episodes (Table 4, superscripts370 3 and 4).371 Taking into account these considerations, Table 4, (superscript372 2) shows that winter NAOi was negative correlated with SWRecirc. CPI373 of Alnus at Lleida, and positively with SWslow CPI of Corylus at Barcelona.374 Annual NAOi was positively correlated with SWslow CPI of Alnus at375 Bellaterra, Betula and Corylus at Girona, and SWRecirc. CPI of Fagus at376 Barcelona; and negatively with NE CPI of Corylus at Barcelona and
377Fagus at Bellaterra, and Nfast CPI of Fagus at Manresa and Tarragona.378No correlation were observed for winter AOi. Conversely annual AOi379was negatively correlated with NWfast CPI of Alnus at Barcelona and380Corylus at Tarragona; and positively with NWslow CPI of Alnus at Barce-381lona, and SE CPI of Corylus at Girona and Fagus at Manresa. Winter382WeMOi showed positive correlations with Nfast CPI of Ambrosia at383Bellaterra and Manresa; and negative with NE CPI of Ambrosia at384Bellaterra, Betula at Manresa and Fagus at Girona. Finally, annual385WeMOi was inversely correlated with WRecirc. CPI of Alnus at Barcelona,386Bellaterra and Girona, Betula at Bellaterra and Corylus at Girona.
3874. Discussion
388The atmospheric circulation regimes in the Mediterranean basin389show a seasonal cycle, linked to thewet temperate circulation in winter390and to the strictly subtropical in summer (Martín-Vide and Lopez-391Bustins, 2006). The atmospheric regimes and seasonal patterns at the392Iberian Peninsula showed higher frequencies of fast-moving flows393from NW and W in winter and slow-moving recirculation flows from394W and SW in summer (Fig. 2, Table 1), in concordance with previous395studies (Millán et al., 1997; Jorba et al., 2004; Salvador et al., 2008;396Izquierdo et al., 2012),.397The relationship between the Northern Hemisphere teleconnection398patterns and themain atmospheric circulation pathwayswas evaluated,399with a focus on the NE Iberian Peninsula. The positive correlations400betweenWfast provenance and the three climatic indices (Table 2) con-401firmed the increase of westerly winds expected during the positive402phase of NAO, AO and WeMO (Hurrell, 1995; Thompson and Wallace,4031998; Martín-Vide and Lopez-Bustins, 2006). An increase of Nfast flows404were linked to the negative phase of AO (Table 2). Besides, the negative405WeMOi correlationwith SE flow frequency (Table 2) coincidedwith the406increase of humid Mediterranean air-masses related with negative407WeMO phase (Martín-Vide and Lopez-Bustins, 2006).408Most of the variability of the Northern Hemisphere teleconnection409patterns show its most intensified dynamics during the winter410(Visbeck et al., 2001; Goodess and Jones, 2002; Martín-Vide and411Lopez-Bustins, 2006). Nevertheless, excepting the negative correlation412between winter AOi and Wfast flows, the atmospheric pathways413described by phases of Northern Hemisphere teleconnection patterns414are well represented by the correlation analysis of the climatic indices
t3:1 Table 3t3:2 Air mass provenance frequencies and themean of the sum of the daily pollen concentrations in each cluster (CPI) of the Aerobiological Network of Catalonia stations for the pollen seasont3:3 of Alnus, Ambrosia, Betula, Corylus and Fagus during period 1994–2011.
t3:4 Air provenance frequencies Alnus (25Jan–24Apr) Ambrosia(24Jul–5Oct)
Betula(23Mar–6Jul)
Corylus(16Jan–24May)
Fagus (19Apr–11Jun)
t3:5 Clusters n % n % n % n % n %
t3:6 C1. Nfast 243 15% 138 10% 230 12% 307 13% 87 9%t3:7 C2. NWfast 138 9% 37 3% 80 4% 172 7% 36 4%t3:8 C3. NWslow 192 12% 152 11% 194 10% 272 12% 91 9%t3:9 C4. Wfast 248 15% 55 4% 136 7% 317 14% 74 8%t3:10 C5. SWslow 152 9% 103 8% 178 9% 220 10% 98 10%t3:11 C6. SE 115 7% 89 7% 161 8% 178 8% 92 10%t3:12 C7. NE 217 13% 134 10% 225 12% 301 13% 120 12%t3:13 C8. WRecirc. 116 7% 239 18% 279 15% 225 10% 168 17%t3:14 C9. SWRecirc. 187 12% 380 29% 415 22% 316 14% 199 21%t3:15 Total 1608 100% 1327 100% 1898 100% 2308 100% 965 100%t3:16 CPI (pollen grains)t3:17 C1. Nfast 551 13% 7 7% 586 22% 751 13% 60 16%t3:18 C2. NWfast 517 12% 2 2% 131 5% 569 10% 8 2%t3:19 C3. NWslow 569 13% 4 4% 295 11% 654 11% 38 10%t3:20 C4. Wfast 918 21% 2 2% 157 6% 1364 23% 26 7%t3:21 C5. SWslow 410 9% 4 4% 116 4% 566 10% 23 6%t3:22 C6. SE 179 4% 18 18% 189 7% 718 12% 16 4%t3:23 C7. NE 573 13% 36 35% 776 29% 612 11% 135 36%t3:24 C8. WRecirc. 331 8% 11 11% 181 7% 264 5% 34 9%t3:25 C9. SWRecirc. 339 8% 18 18% 252 9% 316 5% 34 9%t3:26 Total 4388 100% 102 100% 2683 100% 5814 100% 374 100%
5R. Izquierdo et al. / Science of the Total Environment xxx (2015) xxx–xxx
Please cite this article as: Izquierdo, R., et al., Is long range transport of pollen in the NWMediterranean basin influenced byNorthern Hemisphereteleconnection patterns?, Sci Total Environ (2015), http://dx.doi.org/10.1016/j.scitotenv.2015.06.047

UNCO
RRECTED P
RO
OF
415 data at an annual timeframe, especially in the case of WeMOi (Table 2).416 Positive correlations between Atlantic flows vs. winter and annual417 WeMOi were also observed in Catalonia in a previous study for the pe-418 riod 1984–2012 (Izquierdo et al., 2012). Conversely, no correlation was419 found in this same study between annual NAOi and annual provenance420 frequencies and an unexpected positive correlation between annual421 WeMOi and Mediterranean provenance (Izquierdo et al., 2012). Taking422 into account that pollen season usually occurred out of winter period,423 winter and annual climatic indices were correlated with CPI in order424 to determine the influence level of climatic indices on the main atmo-425 spheric transport routes during the pollen season of each pollen taxa.426 This agrees with previous studies which suggest that the NAO is more427 likely to affect ecological mechanisms in winter, although the link be-428 tween winter indices of the NAO and climatic conditions may persist429 through to summer (Ottersen et al., 2001; Atkinson et al., 2005; Bladé430 et al., 2012).
431Various local and regional environmental drivers affect the timing of432flowering and the release processes of pollen ( Q4Jato et al., 2002), while433synoptic-scale atmospheric condition affect the phenological stages434over a region and also determine the transport of the emitted pollen435grains from adjacent and remote regions (Veriankaite et al., 2010).436The increase of precipitation during negative phase of the three climatic437indices at eastern façade of Iberian Peninsula (Martín-Vide and438Lopez-Bustins, 2006; Lopez-Bustins et al., 2008; Gonzalez-Hidalgo439et al., 2009) could explain the negative relationship between thewinter440NAOi vs. SWRecirc. CPI of Alnus and the annualWeMOi vs. theWRecirc. CPI441of Alnus, Betula and Corylus (Table 4). However, a positive correlation442between annual NAO and SWRecirc. CPI of Fagus was obtained443(Table 4); this lack of consistency could be due to the cleaning effect444of the precipitation (Frei, 1998; Jato et al., 2002; Peternel et al., 2004)445during years with negative index that can mask the contributions of446LRT. Frequency of the regional recirculation flows ranged between 19–
t4:1 Table 4t4:2 Significant Spearman correlations (p N 0.05) between climatic indices and the sumof thedaily pollen concentrations in each cluster (CPI) ofAlnus,Ambrosia, Betula, Corylus and Fagus at thet4:3 Aerobiological Network of Catalonia stations: Barcelona (BCN), Bellaterra (BTU), Girona (GIC), Lleida (LLE), Manresa (MAN) and Tarragona (TAU) during 1994–2011 period. Positive andt4:4 negative correlations were showed between parenthesis and correlations according with LRT premise were in bold letters.
t4:5 Pollen taxa CPI NAOi AOi WeMOi
t4:6 Winter Annual Winter Annual Winter Annual
t4:7 Alnus C1. Nfast TAU (−)a LLE (−)b,c
t4:8 C2. NWfast BCN (−)b BCN, BTU, GIC, MAN (−)d
t4:9 C3. NWslow BCN (+)d BCN (+)b
t4:10 C4. Wfast
t4:11 C5. SWslow BTU (+)b
t4:12 C6. SEt4:13 C7. NEt4:14 C8. WRecirc. BCN, BTU, LLE (−)d BCN, BTU, GIR (−)b
t4:15 C9. SWRecirc. LLE (−)b LLE (−)b,c BTU, LLE (−)d
t4:16 Ambrosia C1. Nfast BTU, MAN (+)b
t4:17 C2. NWfast BTU (−)b,c MAN (+)d,e
t4:18 C3. NWslow BCN (−)b,c
t4:19 C4. Wfast LLE (+)1,4,BTU (−)1,3,4 LLE (+)1,4
t4:20 C5. SWslow GIC (−)b,c GIC (−)b,c
t4:21 C6. SE LLE (−)b,c,e GIC, MAN (+)b,c,e
t4:22 C7. NE BTU (−)b
t4:23 C8. WRecirc.
t4:24 C9. SWRecirc.
t4:25 Betula C1. Nfast
t4:26 C2. NWfast MAN (+)d
t4:27 C3. NWslow
t4:28 C4. Wfast BTU (−)1,3
t4:29 C5. SWslow GIC (+)b
t4:30 C6. SE BCN (−)b,c GIC (+)b,c
t4:31 C7. NE MAN (−)b
t4:32 C8. WRecirc. BTU (−)b
t4:33 C9. SWRecirc.
t4:34 Corylus C1. Nfast BCN,GIC (−)d BCN (−)b,c
t4:35 C2. NWfast BTU (−)b,c TAU (−)b BTU, MAN (−)d
t4:36 C3. NWslow
t4:37 C4. Wfast TAU (+)a
t4:38 C5. SWslow BCN (+)b GIC (+)b
t4:39 C6. SE GIC (+)b
t4:40 C7. NE BCN (−)b BTU (+)b,c
t4:41 C8. WRecirc. LLE (+)d MAN (+)b,c GIC (−)d GIC (−)b
t4:42 C9. SWRecirc.
t4:43 Fagus C1. Nfast MAN, TAU (−)b GIC (−)a
t4:44 C2. NWfast BCN (+)b,c TAU (+)d
t4:45 C3. NWslow TAU (−)b,c
t4:46 C4. Wfast LLE (−)1,3,4
t4:47 C5. SWslow LLE (+)b,e LLE (+)b,e LLE (+)b,e LLE (+)b,e
t4:48 C6. SE LLE (−)b,c,e MAN (+)b
t4:49 C7. NE BTU (−)b GIC (−)b MAN (+)b,c
t4:50 C8. WRecirc. TAR (+)d,e TAU (+)b,c,e TAU (+)b,c
t4:51 C9. SWRecirc. BCN (+)b
t4:52 a Correlations whose provenances showed significant relationships (p b 0.05) in Table 2.t4:53 b Correlations whose provenances showed non-significant relationships (p N 0.05) and rs N 0.10 in Table 2.t4:54 c Correlations in disagreement with LRT premise.t4:55 d Correlations whose provenances showed non-significant relationships (p N 0.05) and rs b 0.10 in Table 2.t4:56 e Isolate LRT pollen episodes.
6 R. Izquierdo et al. / Science of the Total Environment xxx (2015) xxx–xxx
Please cite this article as: Izquierdo, R., et al., Is long range transport of pollen in the NWMediterranean basin influenced byNorthern Hemisphereteleconnection patterns?, Sci Total Environ (2015), http://dx.doi.org/10.1016/j.scitotenv.2015.06.047

UNCO
RRECTED P
RO
OF
447 38% of the pollen season of Alnus, Betula, Corylus and Fagus and448 accounted for 10–18% of their CPI (Table 3).449 The LRT of Fagus fromWestern and Central Europe throughNfast and450 NE fluxes during the negative phase of annual NAO (Table 4)was highly451 significant because these provenances registered the 52% of its total CPI452 with a frequency of 21% during the Fagus (Table 3). Besides, a negative453 correlation between annual NAOi and NE CPI of Corylus was observed454 (Table 4), accounting for 11% of its total CPI (Table 3). These results455 are aligned with LRT of Fagus from Central Europe and Corylus from456 Northern Italy and South-Eastern France registered previously at457 Catalonia (Belmonte et al., 2008a,b). Conversely, the positive phase of458 annual NAO was associated with an intensification of Alnus, Betula459 and Corylus pollen transport from Western Iberian Peninsula by460 means of slow fluxes from SW (Table 4), despite its CPI values were461 low (4–10%) and its provenance frequencies ~10% (Table 3). Winter462 NAOi was also positively correlatedwith SWslow CPI of Corylus (Table 4).
463Negative correlations between annual AOi vs. Nfast CPI of Alnus and464Fagus (Fig. 3a) and NWfast of Alnus and Corylus (Table 4) indicated that465LRT of Alnus, Corylus and Fagus from Western Europe may increase the466years with negative index values. These provenances accounted for46724% of Alnus pollen season and 25% of its CPI, while low frequencies of468fast-moving flows from N and NW during the Corylus and Fagus pollen469season (7–9%) represented 10–16% of its total CPI (Table 3). On the470other hand, LRT of Alnus from Western Iberian Peninsula (NWslow),471and Corylus and Fagus from Mediterranean (SE) area was associated472with the positive phase of annual AO (Table 4), in spite of the low473Fagus pollen content in the SE CPI (4%) (Table 3). These results are474according with previous episodes of LRT of Corylus fromMediterranean475area registered in this area (Belmonte et al., 2008b).476An increase of the Ambrosia levels produced by fast moving air-477masses from the N coming from France and Northern Europe is expect-478ed during yearswith positive phase ofwinterWeMO, aswell as fromNE
Fig. 3. Dynamics of a) annual AOi vs. percentage of Alnus pollen in the cluster Nfast (CPI) at Tarragona (TAU) and Fagus at Girona (GIC) with respect to the Seasonal Pollen Index (SPI) ofeach taxon; and b) annual WeMOi vs. percentage of Corylus pollen in the cluster Wfast at Tarragona with respect to the Corylus Seasonal Pollen Index for the 1996–2011 period.
7R. Izquierdo et al. / Science of the Total Environment xxx (2015) xxx–xxx
Please cite this article as: Izquierdo, R., et al., Is long range transport of pollen in the NWMediterranean basin influenced byNorthern Hemisphereteleconnection patterns?, Sci Total Environ (2015), http://dx.doi.org/10.1016/j.scitotenv.2015.06.047

UNCO
RRECTED P
RO
OF
479 masses coming from Central and Eastern Europe is expected during the480 negative phase (Table 4). It should be noted that NE fluxes recorded the481 35% of its total CPI with a frequency of 10% during the Ambrosia, while482 Nfast frequency accounted for 10% and represented only 7% of its total483 CPI (Table 3). These results are according with LRT of pollen from484 eastern France, Northern Italy, Hungary and Serbia regions, where485 Ambrosia is widely widespread, detected previously at Catalonia486 (Belmonte et al., 2000; Fernández-Llamazares et al., 2012). Negative487 correlations with winter WeMOi for Betula and Fagus linked to488 European fluxes from the NE (Table 4) could be due to an increase of489 the easterlywinds linked to thenegative phase of this index. High Betula490 and Fagus pollen content (29–36% of their CPI) was detected in the491 European provenance, which showed a frequency of 12% of both pollen492 season (Table 3). As commented before, LRT of Fagus from Europe493 was also detected in previous studies carried on Catalonia (Belmonte494 et al., 2008a,b). Finally, regional transport of Corylus from Western495 Iberian Peninsula was linked with the positive phase of annual WeMO496 (Fig. 3b).
497 5. Conclusions
498 The Mediterranean region is considered as one of the most499 vulnerable regions to climate change. The link between the synoptic500 meteorology and the Northern Hemisphere teleconnection patterns in501 the Western Mediterranean Basin showed in this study may be of502 primary importance. Specially, taking into account the upward trend503 of NAO and AO detected since the early 1970s. A number of authors504 have studied the influence exerted by the Northern Hemisphere505 teleconnection patterns on the plant phenology based on pollen counts506 at Europe. However this is the first study that has been devoted to ana-507 lyzing their effect on atmospheric pollen transport. Alnus, Ambrosia,508 Betula, Corylus and Fagus were selected as allergenic pollen taxa with509 possible LRT associated to Northern Hemisphere teleconnection pat-510 terns in the Western Mediterranean Basin. Our results point out that511 an increase of LRT of Alnus, Corylus and Fagus pollen from Western512 and Central Europe may occur during the negative phase of annual513 NAO and AO, as well as regional transport of Alnus, Betula and Corylus514 from Western Iberian Peninsula during the positive phase. LRT of515 Corylus and Fagus from Mediterranean area was also associated with516 the positive phase of annual AO. In addition, LRT episodes of Ambrosia517 pollen from France and Northern Europe may take place when the518 phase of winter WeMO is positive, and from Central and Eastern519 Europe is expected during the negative phase. An increase of the Betula520 and Fagus levels linked to European fluxes may be ensued during years521 with negative phase of winter WeMO, as well as regional transport of522 Corylus from Western Iberian Peninsula during the positive phase of523 annual WeMO. Considering that Alnus, Ambrosia, Betula and Corylus524 pollen are among the most allergenic pollen taxa of Europe, sporadic525 episodes of allergy may be associated with these situations.526 Finally, the atmospheric pollen transport depends on the phenology527 in source pollen areas and the variability of circulation patterns, which528 varies spatially and temporally. Therefore, further research is needed529 at regional scale in order to well-understand the influence of the North-530 ern Hemisphere teleconnection patterns on pollen transport at different531 spatial levels and evaluate their potential impact on the public health.
532 6.Q5 Uncited reference
533 Hurrell and National Center for Atmospheric Research Staff, 2014
534Q6 Acknowledgments
535 We acknowledge the financial support from European Commission536 for “ENV4-CT98-0755”; the Spanish Government for “AMB97-0457-537 CO7-021”, “REN2001-10659-CO3-01”, “CGL2004-21166-E”, “CGL2005-538 07543/CLI”, “CGL2009-11205”, “CGL2012-39523-C02-01/CLI”, CGL2012-
53939523-C02-02 and CONSOLIDER GRACCIE; the Catalan Government540AGAUR for “2002SGR00059”, “2005SGR00519”, “2009SGR1102” and5412014SGR1274;Diputació de Tarragona, ServeiMeteorològic de Catalunya,542Sociedad Española de Alergología e Inmunología Clínica (SEAIC), División543deAlergia de Laboratorios LETI S.L. Barcelona, Societat Catalanad'Al·lèrgia544i Immunologia Clínica (SCAIC), Stallergenes Ibérica, S.A., J Uriach y545Compañia, S.A., LAFOSCA STUDIO SL, Fundació Catalunya-La Pedrera.546Javier Martín-Vide and Joan Albert López-Bustins, Group of Climatology547(University of Barcelona), are thanked for WeMOi data, and Mirna548Lopez for the assistance with back-trajectories analysis.
549References
550Ambaum, M.H.P., Hoskins, B.J., Stephenson, D.B., 2001. Arctic oscillation or North Atlantic551Oscillation? J. Clim. 14, 3495–3507.552Andersen, T.B., 1991. A model to predict the beginning of the pollen season. Grana 30,553269–275.554Atkinson, M.D., Kettlewell, P.S., Hollins, P.D., Stephenson, D.B., Hardwick, N.V., 2005.555Summer climate mediates UK wheat quality response to winter North Atlantic Oscil-556lation. Agric. For. Meteorol. 130, 27–37.557Belmonte, J., Vendrell, M., Roure, J.M., Vidal, J., Botey, J., Cadahía, A., 2000. Levels of558Ambrosia pollen in the atmospheric spectra of Catalan aerobiological stations.559Aerobiologia 16, 93–99.560Belmonte, J., Alarcón, M., Avila, A., Scialabba, E., Pino, D., 2008a. Long-range transport561of beech (Fagus sylvatica L.) pollen to Catalonia (north-eastern Spain). Int.562J. Biometeorol. 52, 675–687.563Belmonte, J., Alarcón, M., Avila, A., Izquierdo, R., Cuevas, E., 2008b. Foreign allergenic564pollen. Some cases observed in Catalonia (NE Spain) and Tenerife (Canary Islands).565Allergy 63 (Suppl. 88), 104–105.566Bladé, I., Liebmann, B., Fortuny, D., Jan van Oldenborgh, G., 2012. Observed and simulated567impacts of the summer NAO in Europe: implications for projected drying in the568Mediterranean region. Clim. Dyn. 39, 709–727.569Cape, J.N., Methven, J., Hudson, L.E., 2000. The use of trajectory cluster analysis to interpret570trace gas measurements at Mace Head, Ireland. Atmos. Environ. 34, 3651–3663.571D'Odorico, P., Yoo, J., Jaeger, S., 2002. Changing seasons: an effect of the North Atlantic572Oscillation. J. Clim. 15, 435–445.573Dalla Marta, A., Grifoni, D., Torrigiani Malaspina, T., Cecchi, L., Barbano, F., Mancini, M.,574Orlandini, S., 2011. The effects of large-scale atmospheric fields on the cypress pollen575season in Tuscany (Central Italy). Aerobiologia 27, 213–220.576Damialis, A., Gioulekas, D., Lazopoulou, C., Balafoutis, C., Vokou, D., 2005. Transport of577airborne pollen into the city of Thessaloniki: the effects of wind direction, speed578and persistence. Int. J. Biometeorol. 49 (3), 139–145.579Dorling, S.R., Davies, T.D., 1995. Extending cluster analysis — synoptic meteorology links580to characterise chemical climates at six north-west European monitoring stations.581Atmos. Environ. 29 (2), 145–167.582Draxler, R.R., Rolph, G.D., 2003. HYSPLIT (HYbrid Single-Particle Lagrangian Integrated583Trajectory) Model access via NOAA ARL READY website (http://www.arl.noaa.gov/584ready/hysplit4.html). NOAA Air Resources Laboratory, Silver Spring, MD.585Draxler, R.R., Stunder, B., Rolph, G., Taylor, A., 2009. HYSPLIT_4 User's Guide. NOAA Air586Resources Laboratory (http://www.arl.noaa.gov/documents/reports/hysplit_user_587guide.pdf).588Dünkeloh, A., Jacobeit, J., 2003. Circulation dynamics of Mediterranean precipitation589variability 1948–98. Int. J. Climatol. 23, 1843–1866.590Fernández-Llamazares, A., Belmonte, J., Alarcón, M., López-Pacheco, M., 2012. Ambrosia L.591in Catalonia (NE Spain): expansion and aerobiology of a new bioinvader. Aerobiologia59228, 435–451.593Frei, T., 1998. The effects of climate change in Switzerland 1969–1996 on airborne pollen594quantities from hazel, birch and grass. Grana 37, 172–179.595Galán Soldevilla, C., Cariñanos González, P., Alcázar Teno, P., Domínguez Vilches, E., 2007.596Manual de Calidad y Gestión de la Red Española de Aerobiología. Servicio de597Publicaciones, Universidad de Córdoba.598Giorgi, F., 2006. Climate change hot-spots. Geophys. Res. Lett. 33, L08707.599Gonzalez-Hidalgo, J.C., Lopez-Bustins, J.A., Štepánek, P., Martin-Vide, J., de Luis, M., 2009.600Monthly precipitation trends on the Mediterranean fringe of the Iberian Peninsula601during the second-half of the twentieth century (1951–2000). Int. J. Climatol. 29,6021415–1429.603Goodess, C.M., Jones, P.D., 2002. Links between circulation andchanges in the characteristics604of Iberian rainfall. Int. J. Climatol. 22, 1593–1615.605Hernández-Ceballos, M.A., García-Mozo, H., Adame, J.A., Domínguez-Vilches, E., De la606Morena, B.A., Bolívar, J.P., Galán, C., 2011. Synoptic andmeteorological characterization607of olive pollen transport in Cordobaprovince (South-western Spain). Int. J. Biometeorol.60855, 17–34.609Hernández-Ceballos, M.A., Skjøth, C.A., García-Mozo, H., Galán, C., 2014. Improvement in610the accuracy of back trajectories using WRF to identify pollen sources in southern611Iberian Peninsula. Int. J. Biometeorol. 58, 2031–2043.612Hirst, J.M., 1952. An automatic volumetric spore trap. Ann. Appl. Biol. 39, 257–265.613Hurrell, J.W., 1995. Decadal trend in the North-Atlantic Oscillation — regional614temperatures and precipitation. Science 269, 676–679.615Q7Hurrell, James & National Center for Atmospheric Research Staff (Eds). Last modified 05616Sep 2014. “The Climate Data Guide: Hurrell North Atlantic Oscillation (NAO) Index617(station-based).” Retrieved from https://climatedataguide.ucar.edu/climate-data/618hurrell-north-atlantic-oscillation-nao-index-station-based.
8 R. Izquierdo et al. / Science of the Total Environment xxx (2015) xxx–xxx
Please cite this article as: Izquierdo, R., et al., Is long range transport of pollen in the NWMediterranean basin influenced byNorthern Hemisphereteleconnection patterns?, Sci Total Environ (2015), http://dx.doi.org/10.1016/j.scitotenv.2015.06.047

UNCO
RRECTED P
RO
OF
619 IPCC, 2007. Climate change 2007. The physical science basis. In: Solomon, S., Qin, D.,620 Manning, M., Chen, Z., Marquis, M., Averyt, K.B., Tignor, M., Miller, H.L. (Eds.), Contri-621 bution ofWorking Group I to the Fourth Assessment Report of the Intergovernmental622 Panel on Climate Change. Cambridge University Press, Cambridge, United Kingdom623 and New York, NY, USA (996 pp.).624 Izquierdo, R., Belmonte, J., Àvila, A., Alarcón, M., Cuevas, E., Alonso-Pérez, S., 2011. Source625 areas and long-range transport of pollen from continental land to Tenerife (Canary626 Islands). Int. J. Biometeorol. 55, 67–85.627 Izquierdo, R., Avila, A., Alarcón, M., 2012. Trajectory statistical analysis of atmospheric628 transport patterns and trends in precipitation chemistry of a rural site in NE Spain629 in 1984–2009. Atmos. Environ. 61, 400–408.630 Izquierdo, R., Aguillaume, L., Alarcón, M., Avila, A., 2014. Effects of teleconnection patterns631 on the atmospheric routes, precipitation amount and chemistry in the north-eastern632 Iberian Peninsula. Atmos. Environ. 89, 482–490.633Q8 Izquierdo, R., Alarcón, M., Majeed, H.T., Periago, C., Belmonte J. Unpublished results.634 Influence of the climate variability on the airborne pollen levels recorded in Catalonia635 (NW Mediterranean). Submitted to Sci. Total Environ.636 Jato, V., Méndez, J., Rodríguez-Rajo, J., Seijo, C., 2002. The relationship between the637 flowering phenophase and airborne pollen of Betula in Galicia (N.W. Spain).638 Aerobiologia 18, 55–64.639 Jochner, S., Menzel, A., 2015. Does flower phenology mirror the slowdown of global640 warming? Ecol. Evol. http://dx.doi.org/10.1002/ece3.1503.641 Jorba, O., Pérez, C., Rocadensbosch, F., Baldasano, J.M., 2004. Cluster analysis of 4-day back642 trajectories arriving in the Barcelona area, Spain, from 1997 to 2002. J. Appl. Meteorol.643 43, 887–901.644 Krichak, S.O., Breitgand, J.S., Gualdi, S., Feldstein, S.B., 2014. Teleconnection-extreme645 precipitation relationships over the Mediterranean region. Theor. Appl. Climatol.646 117, 679–692.647 Lopez-Bustins, J.A., Martín-Vide, J., Sanchez-Lorenzo, A., 2008. IberiaWinter rainfall trends648 based upon changes in teleconnection and circulation patterns. Glob. Planet. Chang.649 63, 171–176.650 Makra, L., Santa, T., Matyasovszky, I., Damialis, A., Karatzas, K., Bergmann, K.C., Vokou, D.,651 2010. Airborne pollen in three European cities: detection of atmospheric circulation652 pathways by applying three-dimensional clustering of backward trajectories.653 J. Geophys. Res. Atmos. 115, D24220.654 Markou, M.T., Kassomenos, P., 2010. Cluster analysis of five years of back trajectories655 arriving in Athens, Greece. Atmos. Res. 98, 438–457.656 Marshall, J., Kushnir, Y., Battisti, D., Chang, P., Czaja, A., Dickson, R., et al., 2001. North657 Atlantic climate variability: phenomena, impacts and mechanisms. Int. J. Climatol.658 21 (15), 1863–1898.659 Martín-Vide, J., Lopez-Bustins, J.A., 2006. The Western Mediterranean Oscillation and660 rainfall in the Iberian Peninsula. Int. J. Climatol. 26 (11), 1455–1475 (Website:661 http://www.ub.edu/gc/English/wemo.htm).662 Menzel, A., Sparks, T.H., Estrella, N., Koch, E., Aasa, A., Ahas, R., et al., 2006. European663 phenological response to climate change matches the warming pattern. Glob.664 Chang. Biol. 12 (10), 1969–1976.665 Millán, M., Salvador, R., Mantilla, E., Kallos, G., 1997. Photo-oxidant dynamics in the666 Mediterranean basin in summer: results from European research projects.667 J. Geophys. Res. 102, 8811–8823.668 Mysterud, A., Stenseth, N.C., Yoccoz, N.G., Ottersen, G., Langvatn, R., 2003. The response of669 terrestrial ecosystems to climate variability associated with the North Atlantic670 Oscillation. In: Hurrell, J.W., Kushnir, Y., Ottersen, G., Visbeck, M. (Eds.), The North671 Atlantic Oscillation. American Geophysical Union, Washington, DC, pp. 235–262.672 Ottersen, G., Planque, B., Belgrano, A., Post, E., Reid, P.C., Stenseth, N.C., 2001. Ecological673 effects of the North Atlantic Oscillation. Oecologia 128, 1–14.674 Peternel, R., Srnec, L., Culig, J., Zaninovic, K., Mitic, B., Vukusic, I., 2004. Atmospheric pollen675 season in Zagreb (Croatia) and its relationship with temperature and precipitation.676 Int. J. Biometeorol. 48, 186–191.677 Prank, M., Chapman, D.S., Bullock, J.M., Belmonte, J., Berger, U., Dahl, A., et al., 2013. An678 operational model for forecasting ragweed pollen release and dispersion in Europe.679 Agric. For. Meteorol. 182–183, 43–53.
680Rodríguez, S., Querol, X., Alastuey, A., Mantilla, E., 2003. Events affecting levels and681seasonal evolution of airborne particulate matter concentrations in the Western682Mediterranean. Environ. Sci. Technol. 37, 216–222.683Salvador, P., Artíñaño, B., Querol, X., Alastuey, A., Costoya, M., 2007. Characterisation of684local and external contributions of atmospheric particulate matter at a background685coastal site. Atmos. Environ. 41, 838–845.686Salvador, P., Artíñano, B., Querol, X., Alastuey, A., 2008. A combined analysis of backward687trajectories and aerosol chemistry to characterise long-range transport episodes of688particulate matter: the Madrid air basin, a case of study. Sci. Total Environ. 390,689495–506.690Sharma, S., 1996. Applied Multivariate Techniques. John Wiley & Sons, Inc., New York,691p. 493.692Skjøth, C.A., Smith, M., Brandt, J., Emberlin, J., 2009. Are the birch trees in southern693England a source of Betula pollen for North London? Int. J. Biometeorol. 53 (1), 75–86.694Skjøth, C.A., Šikoparija, B., Jäger, S., EAN-Network, 2012. Pollen sources. In: Sofiev, M.,695Bergman, K.-C. (Eds.), A Review of Production, Release, Distribution and Health696Impact of Allergenic Pollen. Springer, pp. 9–27 (Chapter 2).697Smith, M., Skjøth, C.A., Myszkowska, D., Uruska, A., Puc, M., Stach, A., et al., 2008. Long-698range transport of Ambrosia pollen to Poland. Agric. For. Meteorol. 14, 1402–1411.699Smith, M., Emberlin, J., Stach, A., Rantio-Lehtimäki, A., Caulton, E., Thibaudon, M., et al.,7002009. Influence of the North Atlantic Oscillation on grass pollen counts in Europe.701Aerobiologia 25, 321–332.702Stach, A., Smith, M., Prieto Baena, J.C., Emberlin, J., 2008a. Long-term and short-term703forecast models for Poaceae (grass) pollen in Poznań, Poland, constructed using704regression analysis. Environ. Exp. Bot. 62, 323–332.705Stach, A., Emberlin, J., Smith, M., Adams-Groom, B., Myszkowska, D., 2008b. Int.706J. Biometeorol. 52, 311–321.707Stenseth, N.C., Mysterud, A., Ottersen, G., Hurrel, J.W., Chan, K.S., Lima,M., 2002. Ecological708effects of climate fluctuations. Science 297, 1292–1296.709Straile, D., Stenseth, N.C., 2007. The North Atlantic Oscillation and ecology: links between710historical time-series, and lessons regarding future climate warming. Clim. Res. 34,711259–262.712Thompson, D.W.J., Wallace, J.M., 1998. The Arctic Oscillation signature in the wintertime713geopotential height and temperature fields. Geophys. Res. Lett. 25, 297–1300.714Thompson, D.W.J., Wallace, J.M., 2000. Annular modes in the extratropical circulation.715Part I: month-to-month variability. J. Clim. 13, 1000–1016.716Torben, B.A., 1991. A model to predict the beginning of the pollen season. Grana 30,717269–275.718Ulbrich, U., Lionello, P., Berlušić, D., Jacobeit, J., Knippertz, P., Kuglitsch, F.G., et al., 2012.719Climate of the Mediterranean: synoptic patterns, temperature, precipitation, winds,720and their extremes. In: Lionello, P. (Ed.), The Climate of the Mediterranean Region,721From the Past to the Future. Elsevier, Dordrecht, pp. 301–346.722Valenzuela, A., Olmo, F.J., Lyamani, H., Antón, M., Quirantes, A., Alados-Arboledas, L., 2012.723Classification of aerosol radiative properties during African desert dust intrusions724over southeastern Spain by sector origins and cluster analysis. J. Geophys. Res. 117,725D06214.726Veriankaite, L., Siljamo, P., Sofiev, M., Sauliene, I., Kukkonen, J., 2010. Modelling analysis of727source regions of long-range transported birch pollen that influences allergenic728seasons in Lithuania. Aerobiologia 26, 47–62.729Visbeck, M.H., Hurrell, J.W., Polvani, L., Cullen, H.M., 2001. The North Atlantic Oscillation:730past, present and future. Proc. Natl. Acad. Sci. U. S. A. 98, 12876–12877.731Wallace, J.M., 2000. North Atlantic oscillatiodannular mode: two paradigms — one732phenomenon. Q. J. R. Meteorol. Soc. 126, 791–805.733Wallace, J.M., Gutzler, D.S., 1981. Teleconnections in the geopotential height field during734the Northern Hemisphere winter. Mon. Weather Rev. 109, 784–812.735Zemmer, F., Karaca, F., Ozkaragoz, F., 2012. Ragweed pollen observed in Turkey: detection736of sources using back trajectory models. Sci. Total Environ. 430, 101–108.
9R. Izquierdo et al. / Science of the Total Environment xxx (2015) xxx–xxx
Please cite this article as: Izquierdo, R., et al., Is long range transport of pollen in the NWMediterranean basin influenced byNorthern Hemisphereteleconnection patterns?, Sci Total Environ (2015), http://dx.doi.org/10.1016/j.scitotenv.2015.06.047