debt defaults: a growth market · debt defaults: a growth market martin fridson, cfa chief...
TRANSCRIPT

Debt Defaults: A Growth Market
Martin Fridson, CFA Chief Investment Officer Lehmann Livian Fridson Advisors LLC
Presented to Grant’s Fall 2016 Conference
October 4, 2016

How Much Speculative Grade Debt Will Default in This Cycle?
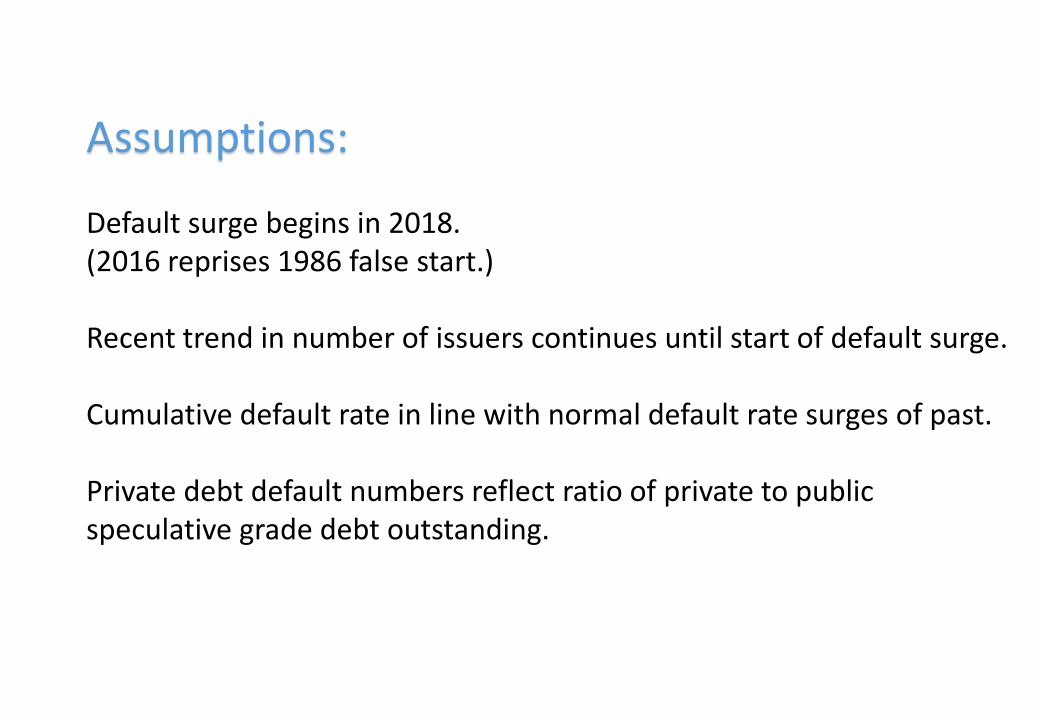
Assumptions: Default surge begins in 2018. (2016 reprises 1986 false start.) Recent trend in number of issuers continues until start of default surge. Cumulative default rate in line with normal default rate surges of past. Private debt default numbers reflect ratio of private to public speculative grade debt outstanding.

Projected Market Size Number of issues in BofA Merrill Lynch Global High Yield Index August 31, 2016 = 1,630 Recent growth rate (3 months) = -7 issues/month Projected number of issues Jan 1, 2018 = 1,518 Face Amount/Issuer = $1.324 B Total Debt/Bonds Multiplier • Moody’s issuers/BAML Global High Yield Index issuers = 1.8X (Jan 1, 2015) • Altman-Kuehne 2015 face amount (Loans + Bonds)/Loans = 2.0X • Median = 1.9X Projected January 1, 2018 market size = 1,518 X $1.324 B X 1.9 = $3.819T Issuers Face Amount Multiplier per Issuer Sources: BofA Merrill Lynch Global Research, used with permission; Altman-Kuehne/NYU; Moody’s Investors Service

Default Rates in Previous Default Surges
Surge Years Above-Average Default Rate
Years Beginning Issuer Count
Defaults
Number Percent
1 1989-1992 4 866 241 27.8
2 1999-2003 5 1,860 644 34.6
3 2008-2009 2 2,106 358 17.0
Our projection assumes a normal-length (4 to 5 years) default surge. The projected default rate is the median of the percentages for Surges 1 and 2, or 31.2%.
Sources: Moody’s Investors Service, FridsonVision calculations

Projected Default Amount in Default Surge Beginning in 2018
$3.8 Trillion X 31.2% = $1.2 Trillion Market Size Default Rate Default Amount
The large total reflects long-run growth of the speculative grade universe, rather than an expectation of exceptionally severe economic distress in this cycle.
Sources: BofA Merrill Lynch Global Research, used with permission; Altman-Kuehne/NYU; Moody’s Investors Service; FridsonVision calculations.

Current Fallacies

Fallacy #1
“High yield bonds have decoupled from oil prices due to improvement in credit quality of Energy Universe”

0%
66%
0%
10%
20%
30%
40%
50%
60%
70%
December 1996 - June 2014 July 2014 - June 2016
Perc
ent
Oil Prices and High Yield Valuations
Percentage of monthly variance in BofA Merrill Lynch US High Yield Index’s option-adjusted spread versus Treasuries explained by NYMEX 1st Crude Future, West Texas Intermediate. Source: BofA Merrill Lynch Global Research, used with permission. Crude oil prices historically had no impact on high yield risk premiums. When oil prices plunged in 2014, the connection became very strong.

500
550
600
650
700
750
80030
35
40
45
50
55
DEC 2015 JAN 2016 FEB MAR APR MAY JUN JUL
High Yield Spread versus Treasuries (Basis Points)*
Crud
e O
ild P
rice
per B
arre
l ($)
Oil and High Yield Decoupled in July
Crude Price (left scale) High Yield Spread (right scale) * Option-Adjusted
Based on NYMEX 1st Crude Future, West Texas Intermediate and BofA Merrill Lynch US High Yield Index Sources: BofA Merrill Lynch Global Research, used with permission; Bloomberg

5.5%
94.5%
14%
86%
Fallen Angels Original issue high yields
25.3%
74.7%
Distribution of High Yield Energy Universe By Bond Type
Based on BofA Merrill Lynch US High Yield Energy Index Source: BofA Merrill Lynch Global Research, used with permission.
It is true that downgrades from the investment grade category increased as a percentage of high yield energy issues after oil prices began their plunge.

Ratings Mix of High Yield Energy Universe
Contrary to claims of some market participants, the July decoupling of the crude price and the high yield spread cannot be explained by improvement in the quality of energy bonds.
Ratings distribution of issuers in BofA Merrill Lynch US High Yield Energy Index Source: BofA Merrill Lynch Global Research, used with permission.

Based on NYMEX 1st Crude Future, West Texas Intermediate and BofA Merrill Lynch US High Yield Index Sources: BofA Merrill Lynch Global Research, used with permission; Bloomberg
* Option-adjusted
500
550
600
650
700
750
80030
34
38
42
46
50
54
High
Yie
ld S
prea
d ve
rses
Tre
asur
ies*
Crud
e O
il Pr
ice
per
Bar
rel (
$)
Oil and High Yield Recoupled in August
Crude Price(left scale) High Yield Spread(right scale)
Dec 15 Jan 16 Feb Mar Apr May Jun Jul Aug

Fallacy #2
“The main reason that distressed debt hedge funds have underperformed the distressed index is that they avoided making one big bet on oil prices.”

6.2
31.08
0
10
20
30
40
Hedge Fund Research index of distressed debtfunds
BofA Merrill Lynch US. Distressed High YieldIndex
Tota
l Ret
urn
(%)
Distressed Hedge Fund Performance 2016, Through July 31
Source: BofA Merrill Lynch Global Research, used with permission; Financial Times

-14.29
-8.95
25.53 23.06
9.35 7.48
0.29
-3.45
1.42
8.29 7.9
2.27 2.44 5.55
-30
-20
-10
0
10
20
30
Jan Feb Mar Apr May Jun Jul
Breakdown of distressed debt returns Monthly 2016
Energy Non-Energy
Based on BofA Merrill Lynch US Distressed High Yield Index Source: BofA Merrill Lynch Global Research, used with permission
Seven-month total 42.09% 26.52%
Based on BofA Merrill Lynch US Distressed High Yield Index Source: BofA Merrill Lynch Global Research, used with permission
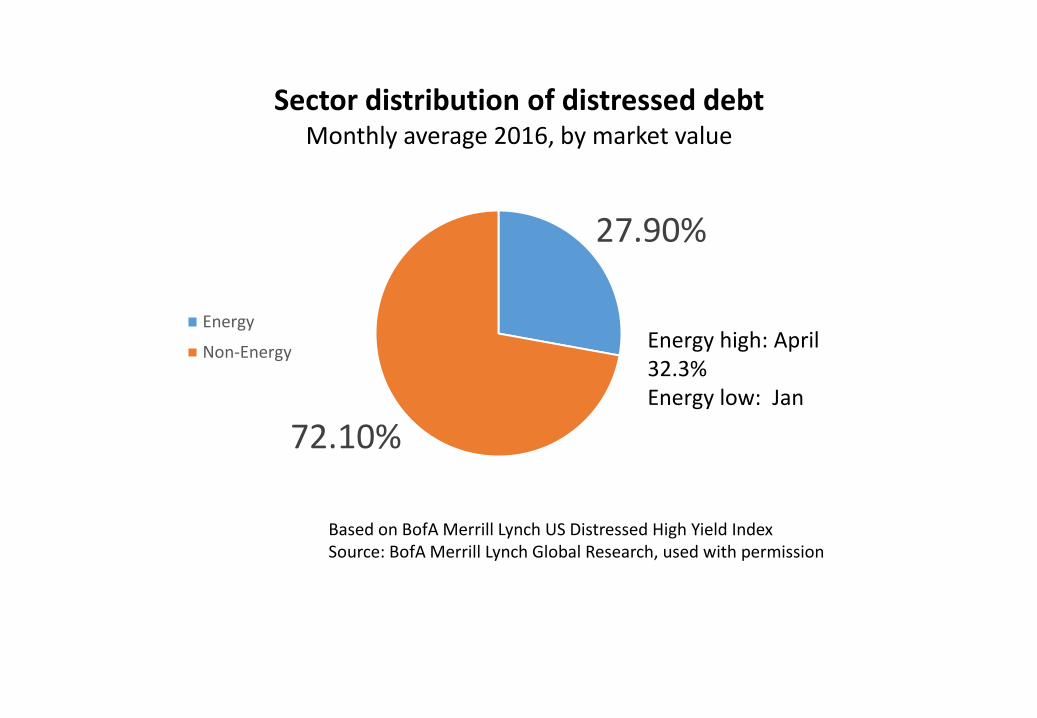
27.90%
72.10%
Sector distribution of distressed debt Monthly average 2016, by market value
Energy
Non-Energy Energy high: April 32.3% Energy low: Jan

Fallacy #3
“Recoveries on defaulted bonds are in a long-term decline.”
0
10
20
30
40
50
60
70
80
0 2 4 6 8 10 12 14
Reco
very
rate
(%)
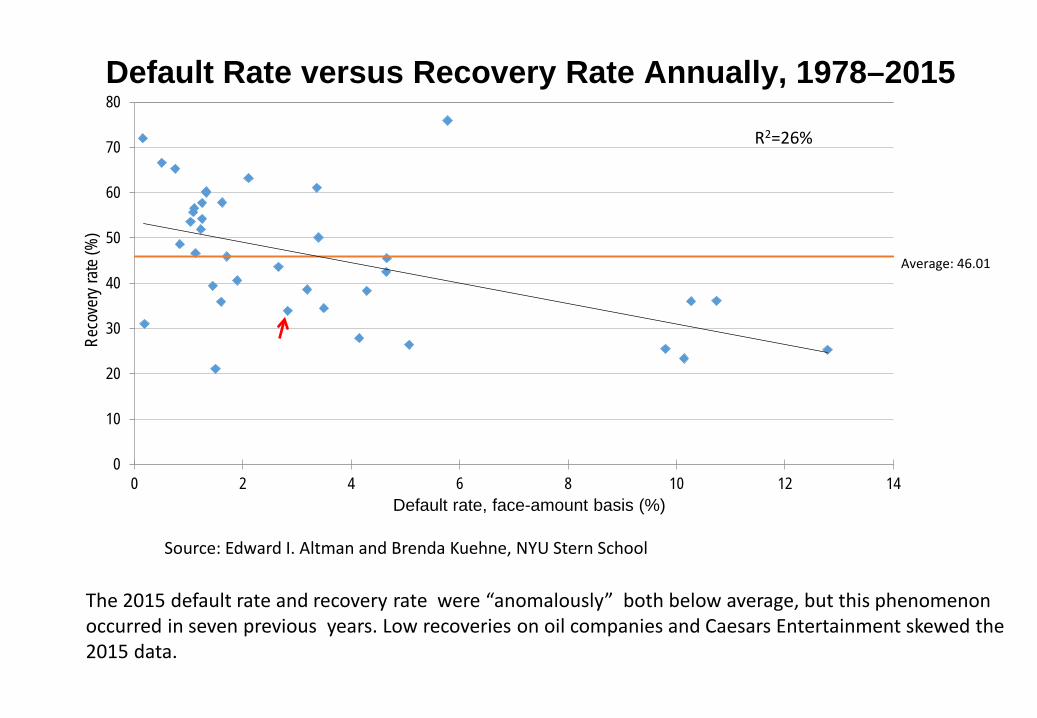
Default Rate versus Recovery Rate Annually, 1978–2015
Default rate, face-amount basis (%)
Source: Edward I. Altman and Brenda Kuehne, NYU Stern School
Average: 46.01
R2=26%
The 2015 default rate and recovery rate were “anomalously” both below average, but this phenomenon occurred in seven previous years. Low recoveries on oil companies and Caesars Entertainment skewed the 2015 data.

Marty Fridson Lehmann Livian Fridson Advisors LLC
www.llfadvisors.com 917-403-9194