debt dynamics and default in the mortgage · pdf filedebt dynamics and default in the mortgage...
TRANSCRIPT

DEBT DYNAMICS AND DEFAULT IN THE MORTGAGE CRISIS
Antoinette Schoar (MIT Sloan and NBER)
MFM Summer Camp 2016Wequassett Resort, Cape Cod

Stock of Household Debt Rose Sharply pre-2008
• Channels• Changing standards of mortgage origination: higher DTI at origination• Slower repayments: delayed repayment and cash-out refis• Increased churning (buying and selling) of houses: quicker reset of
DTI/LTV

Which Factors Contribute to this Rise?• Supply side distortions:
• Financial innovations and perverted incentives in credit supply led to distortions in the allocation of credit, especially to poorer households
• Focus on (unsustainable) debt-to-income levels at origination, in particular to low income borrowers
• Demand side distortion I: (House prices)• Increased house prices allowed households to take out larger
mortgages or equity via cash out-refinancing
• Demand side distortion II: (House price expectations)• Expectations of increasing house prices lead to speculation and
house purchases for investment (not consumption) purposes

Adelino, Schoar, Severino (2016)• Credit expanded across the income distribution, not just the poor
• Middle/high income households had a much larger contribution to overall mortgage debt before the crisis than the poor
• Mortgage debt-to-income levels (DTI) in-line with prior years, no decoupling at origination
• Sharp increase in delinquencies for middle class and prime borrowers after 2007
• Middle class and higher FICO score borrowers make up much larger share of defaults, especially in areas with high house price growth
• Results point to the importance of house prices for home buying and lending decisions• Increase in debt due to faster turnover and cash- out refinancing in the
mortgage market (larger % of households had recent transactions)• Credit demand and house price expectation important drivers of credit• Potential build-up of systemic risk prior to the crisis
Data• Home Mortgage Disclosure Act data
• Balance of individual mortgages originated in the US (2002-2006)• Mortgage type (purchase vs refinance)• Borrower income from mortgage application
• IRS income at the zip code level.
• House prices and house turn-over from Zillow.
• Mortgage size and performance from LPS: 5% random sample, Freddie Mac, Black Box Logic
• Household Debt (stock): Federal Reserve Board Survey of Consumer Finances
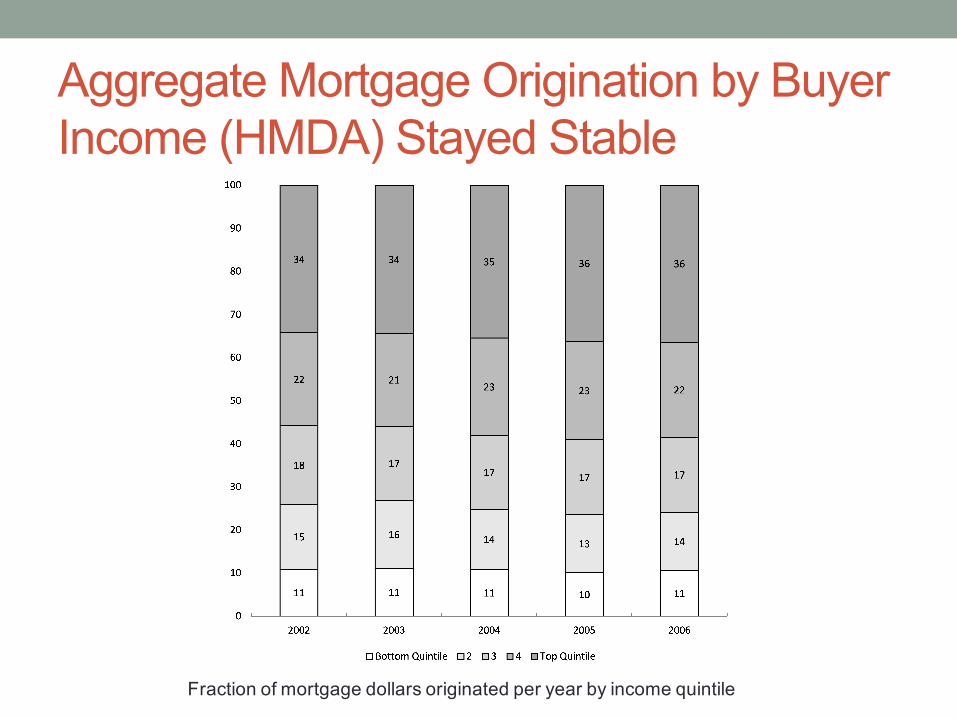
Aggregate Mortgage Origination by Buyer Income (HMDA) Stayed Stable
Fraction of mortgage dollars originated per year by income quintile

Aggregate Mortgage Origination by IRS Household Income. Stayed Stable
Fraction of mortgage dollars originated per year by income quintile

Origination by FICO scores
17 18 17 18
28 30 30 29
55 53 53 53
0
10
20
30
40
50
60
70
80
90
100
2003 2004 2005 2006
FICO<660 660≤FICO<720 FICO≥720
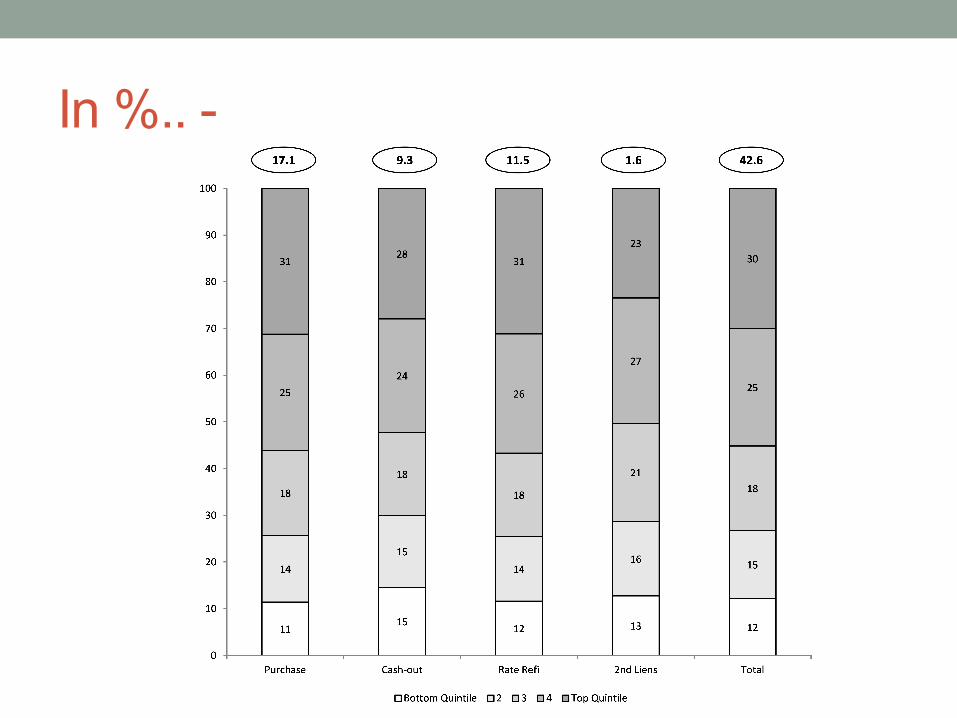
In %.. -
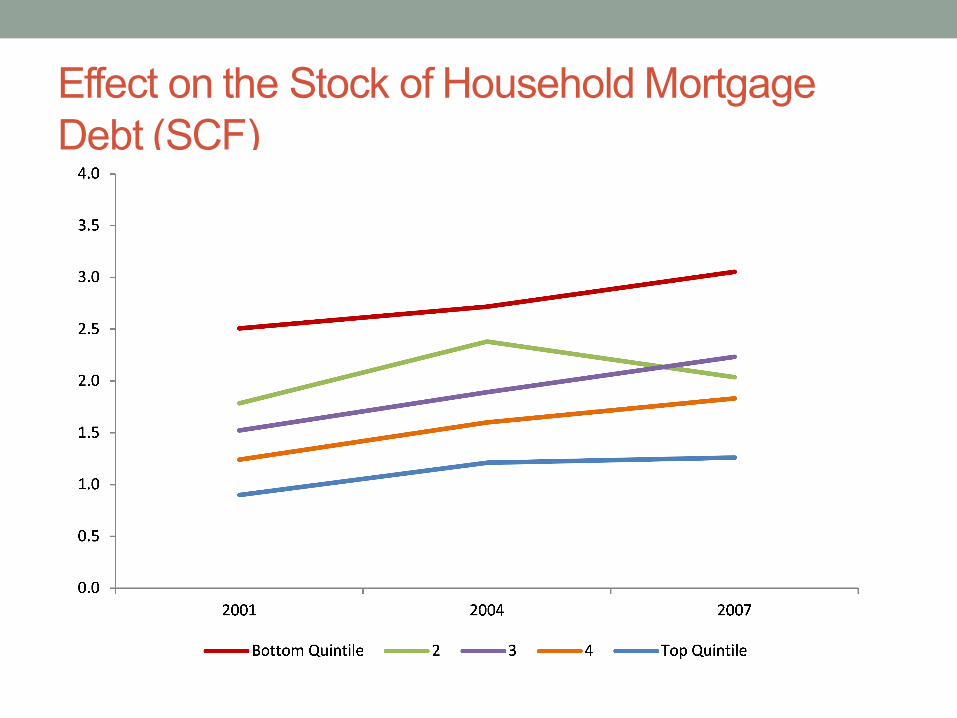
Effect on the Stock of Household Mortgage Debt (SCF)

How Did Household Leverage Build Up? Increased Speed of Home Sales
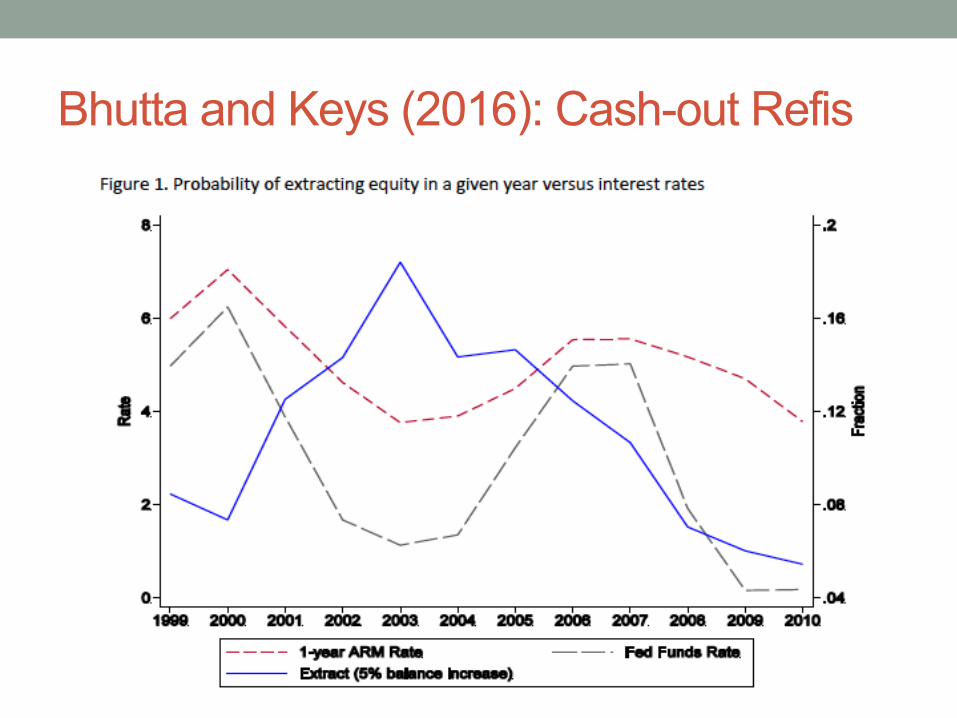
Bhutta and Keys (2016): Cash-out Refis

Cash-out refis rose most in zip codes with high house price appreciation

Share of Delinquent Mortgage Debt 3 Years Out by Buyer Income (LPS) – Value Weighted
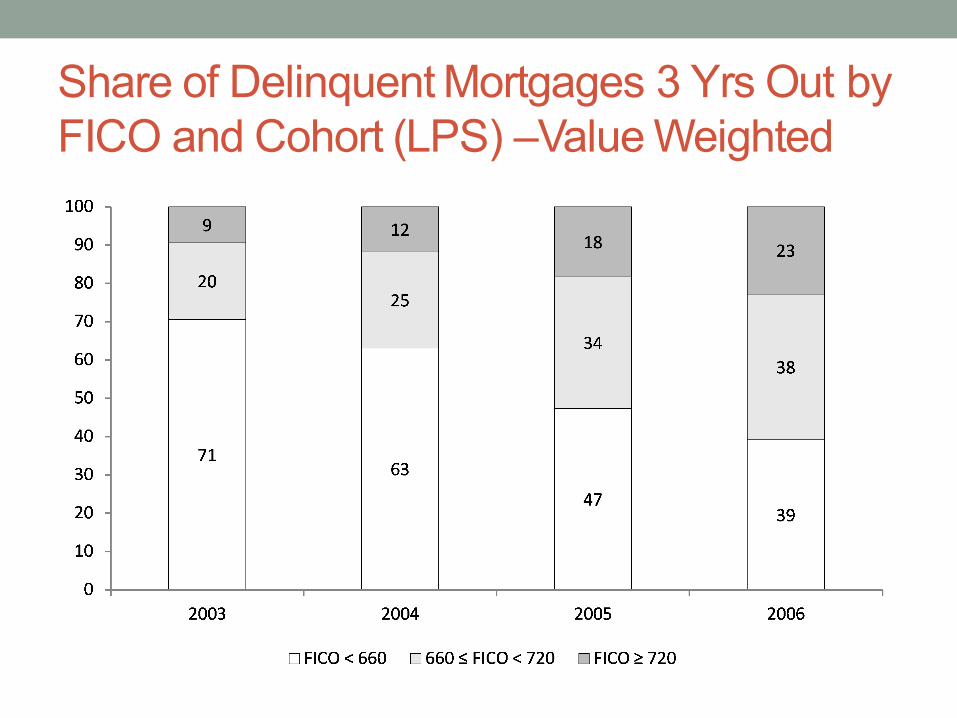
Share of Delinquent Mortgages 3 Yrs Out by FICO and Cohort (LPS) –Value Weighted

Share of Delinquency 3 Years Out by HP Growth and FICO – Value Weighted
2003 Cohort 2006 Cohort
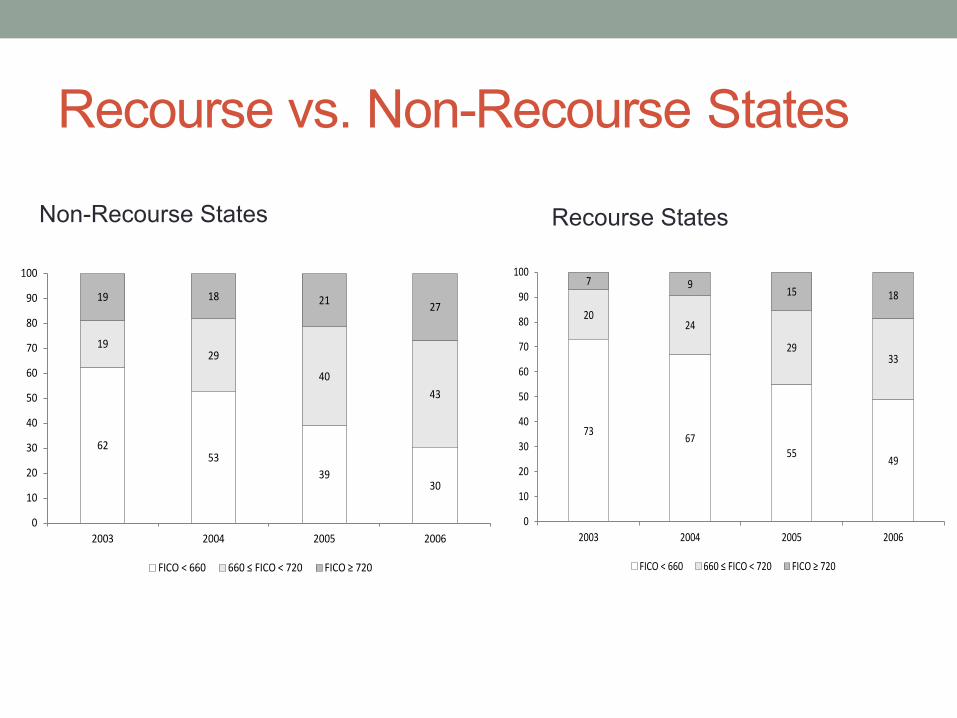
Recourse vs. Non-Recourse States
6253
3930
1929
4043
19 18 21 27
0
10
20
30
40
50
60
70
80
90
100
2003 2004 2005 2006
FICO<660 660≤FICO<720 FICO≥720
73 6755 49
2024
2933
7 9 15 18
0
10
20
30
40
50
60
70
80
90
100
2003 2004 2005 2006
FICO<660 660≤FICO<720 FICO≥720
Non-Recourse States Recourse States

Results Robust Across Different Data Sets• Main dataset: LPS 5 % random sample of US mortgages
• Same patterns with alternative datasets:• Freddie Mac, loan performance 50,000 loans per year
single family homes• Blackbox Logic, 90% of privately securitized loans• Survey of Consumer Finance, household debt and
income data from• Federal Reserve Board Survey• Paul Willen and Chris Foote have rerun our results using
Equifax data
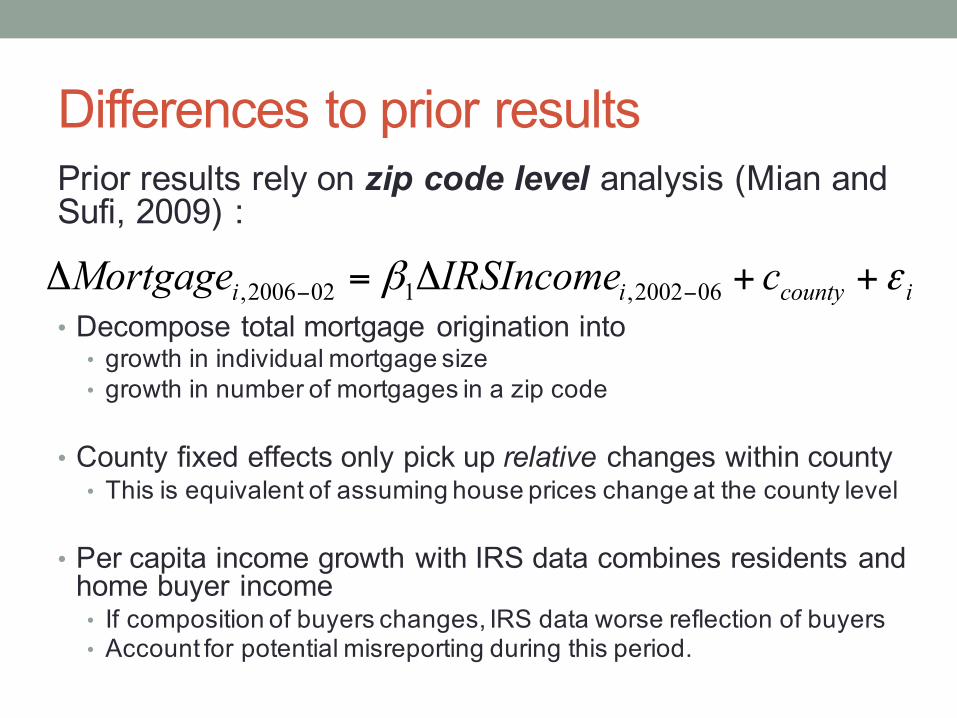
Differences to prior resultsPrior results rely on zip code level analysis (Mian and Sufi, 2009) :
• Decompose total mortgage origination into • growth in individual mortgage size • growth in number of mortgages in a zip code
• County fixed effects only pick up relative changes within county• This is equivalent of assuming house prices change at the county level
• Per capita income growth with IRS data combines residents and home buyer income• If composition of buyers changes, IRS data worse reflection of buyers• Account for potential misreporting during this period.
icountyii cIRSIncomeMortgage εβ ++Δ=Δ −− 062002,1022006,
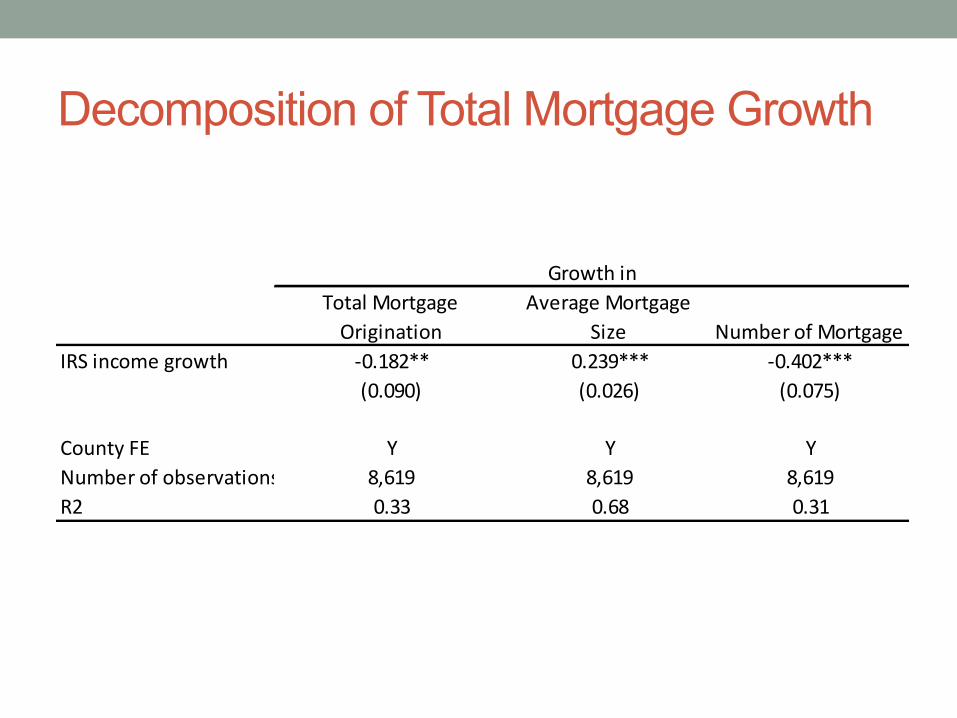
Decomposition of Total Mortgage Growth
Growthin Growth onTotalMortgageOrigination
AverageMortgageSize NumberofMortgage
IRSincomegrowth -0.182** 0.239*** -0.402***(0.090) (0.026) (0.075)
CountyFE Y Y YNumberofobservations 8,619 8,619 8,619R2 0.33 0.68 0.31

Within and Between Estimators

Across Different Time Periods
1996-1998 1998-2002 2002-2006 2007-2011IRSincomegrowth 0.131*** 0.208***
(0.021) (0.023)
Buyerincomegrowth 0.261*** 0.176*** 0.276*** 0.307***(0.015) (0.015) (0.015) (0.015)
CountyFE Y Y Y YNumberofobservations 8,597 8,605 8,619 8,550R2 0.46 0.58 0.73 0.64
GrowthinAverageMortgageAmountSize
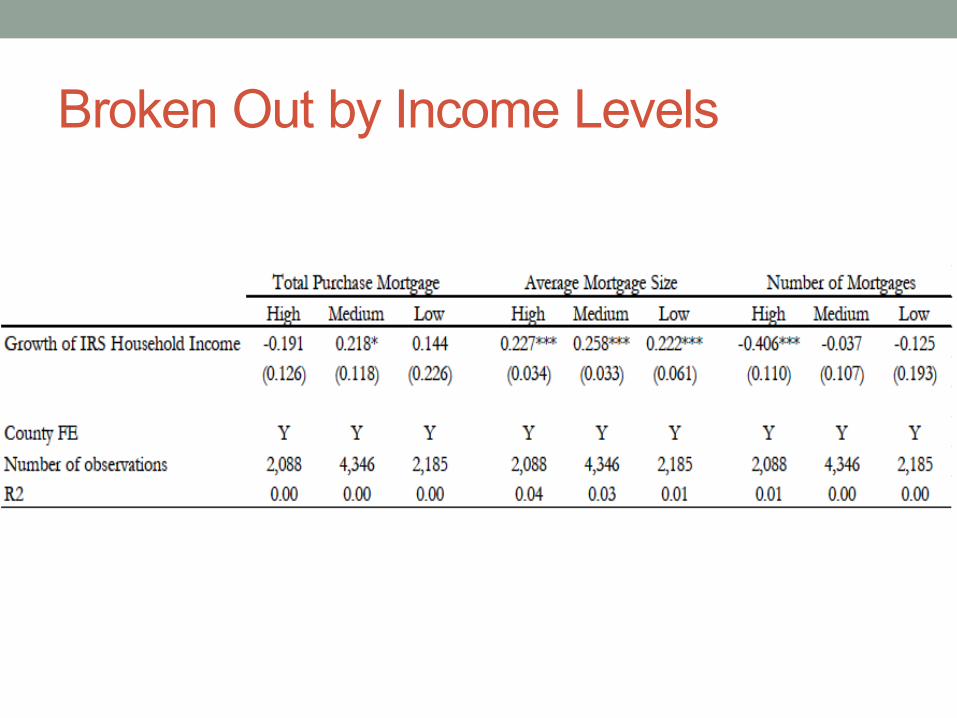
Broken Out by Income Levels
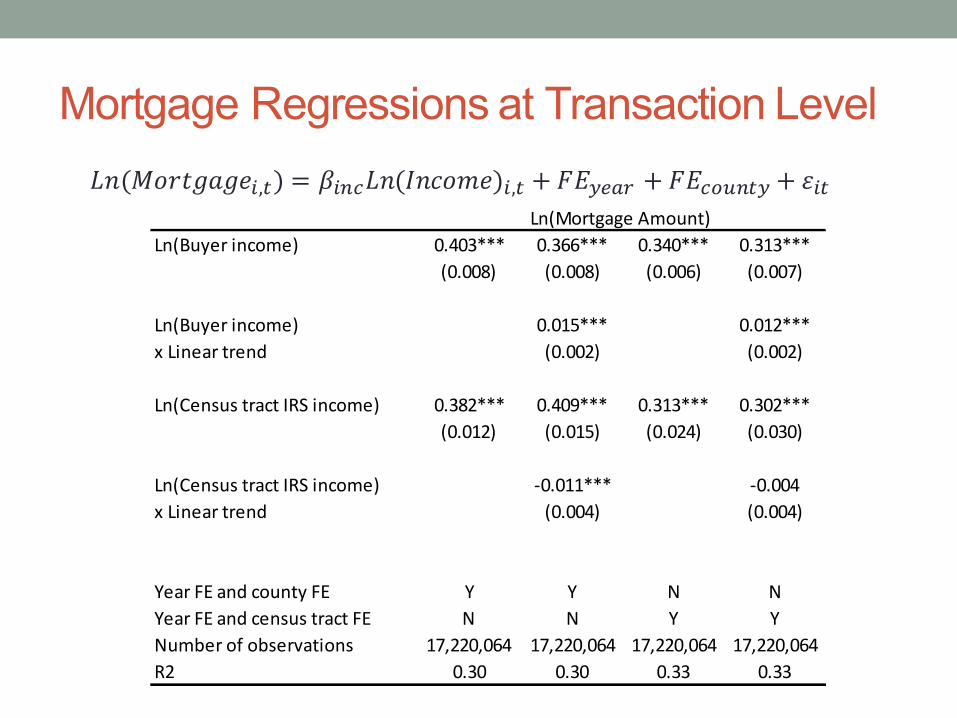
Mortgage Regressions at Transaction Level𝐿𝑛(𝑀𝑜𝑟𝑡𝑔𝑎𝑔𝑒+,-) = 𝛽+12𝐿𝑛(𝐼𝑛𝑐𝑜𝑚𝑒)+,- + 𝐹𝐸9:;< + 𝐹𝐸2=>1-9 + 𝜀+-
Ln(Buyerincome) 0.403*** 0.366*** 0.340*** 0.313***(0.008) (0.008) (0.006) (0.007)
Ln(Buyerincome) 0.015*** 0.012***xLineartrend (0.002) (0.002)
Ln(CensustractIRSincome) 0.382*** 0.409*** 0.313*** 0.302***(0.012) (0.015) (0.024) (0.030)
Ln(CensustractIRSincome) -0.011*** -0.004xLineartrend (0.004) (0.004)
YearFEandcountyFE Y Y N NYearFEandcensustractFE N N Y YNumberofobservations 17,220,064 17,220,064 17,220,064 17,220,064R2 0.30 0.30 0.33 0.33
Ln(MortgageAmount)

Takeaway: Decomposing Total Mortgage Growth
• Negative correlation within counties entirely driven by the extensive margin (differential growth in number of loans)• Average household leverage rose in line with income• Quick churning of houses in poorer neighborhoods
• Top quartile of zip codes saw very fast income growth, and slow growth in number of mortgages• Top quartile exhibits negative relationship between income growth
and population. Suggest the relative “emptying” of richer zip codes.
• Highlights the importance of understanding changes in composition of buyers across zip codes.

How to put this together?• Credit expansion due to an economy wide increase of
leverage, not just poor or marginal borrowers• Homebuyers (and lenders) at all levels of the income distribution
bought into the increasing house prices• Homebuyers re-levered via quicker churn and more refinancing• DTI levels at origination did not “decouple” from income
• Consistent with a view that systemic build-up in risk led to defaults once the economy slowed down• Dollars in default increased most in the middle/high income groups
and for high FICO scores• Defaults increase in areas with sharpest home price movements• Cannot rule our credit demand or house price expectation as
important drivers of credit expansion and crisis
Many Open Questions• Role of house price increases versus expectations
• Why did lenders ignore systemic build up of debt?• Role of strategic versus economic defaults?
• Policy Implication• More focus on macro-prudential regulations• A lot of regulation after the crisis focuses on micro-prudential
regulation, for example screening of marginal borrowers• Systemic build up of risk can lead to losses across the financial
system, e.g. strategic responses to house price drops• How to protect functioning of financial system when crisis occurs?

No expansion of ownership for marginal borrowers
Current Population Survey/ Housing Vacancy Survey, 2014
Homeownership Rate Goes up 1% from 2002-06
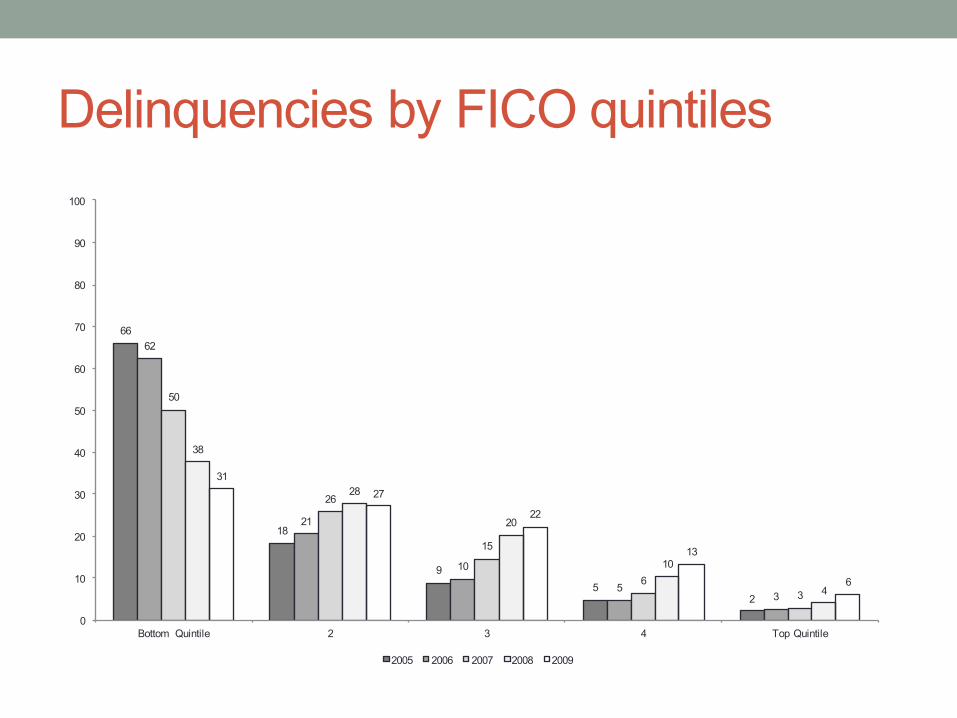
Delinquencies by FICO quintiles
66
18
95
2
62
21
10
53
50
26
15
63
38
28
20
10
4
3127
22
13
6
0
10
20
30
40
50
60
70
80
90
100
Bottom Quintile 2 3 4 Top Quintile
2005 2006 2007 2008 2009

Share of Delinquency 3 Years Out by Subprime Fraction and FICO – Value Weighted
2003 Cohort 2006 Cohort

Appendix I: Is Misreporting in HMDA Driving Results?• Results hold when using IRS data
• Central insight is that intensive and extensive margin behaved differently across the boom period
• Results on share of originations and defaults is also independent of which income data we use
• Magnitudes are too large to explain composition changes• Best estimates range from 15% to 25%. See Jiang et al (2014)• Buyer income is twice the level of residents
• Sensitivity of mortgage levels to income levels is very similar across • Prime/sub-prime lenders or GSE/non-GSE loans• zip codes where MS2015 proclaim greatest “income overstatement”

Loan Origination and MS 2015 Measure of Overstatement (All HMDA)
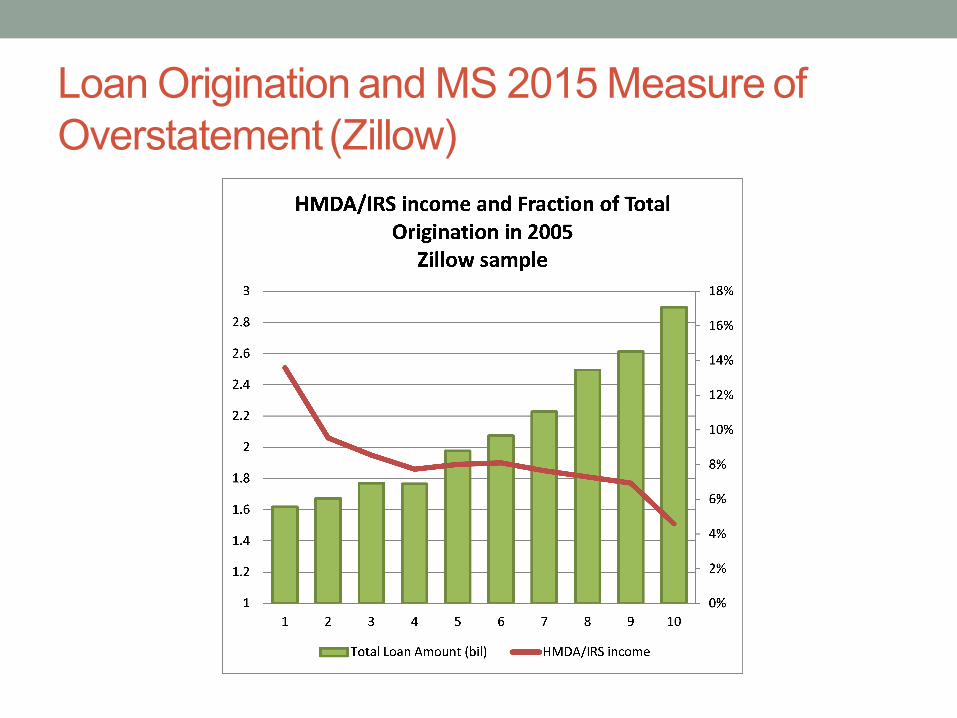
Loan Origination and MS 2015 Measure of Overstatement (Zillow)

Adding Buyer Income (HMDA)
Buyerincomegrowth 0.369*** 0.376*** 0.282*** 0.276*** 0.117*** 0.130***(0.047) (0.047) (0.015) (0.015) (0.040) (0.040)
IRSincomegrowth -0.224** 0.208*** -0.417***(0.088) (0.023) (0.075)
CountyFE Y Y Y Y Y YNumberofobservations 8,619 8,619 8,619 8,619 8,619 8,619R2 0.35 0.35 0.72 0.73 0.31 0.32
GrowthinTotalMortgageOrigination
AverageMortgageSize
NumberofMortgage

Test in Subsamples (Total Mortgage)
HighGSEFraction
MedGSEFraction
LowGSEFraction
HighSubpFraction
MedSubpFraction
LowSubpFraction
IRSincomegrowth -0.072 -0.046 -0.495*** -0.190 -0.109 -0.098(0.160) (0.112) (0.170) (0.179) (0.138) (0.123)
Buyerincomegrowth 0.338*** 0.389*** 0.363*** 0.477*** 0.316*** 0.379***(0.089) (0.060) (0.104) (0.098) (0.065) (0.092)
CountyFE Y Y Y Y Y YNumberofobservations 2,203 4,355 2,061 2,119 4,326 2,174R2 0.01 0.02 0.03 0.03 0.02 0.02
GrowthinTotalMortgageOrigination

Test in Subsample (Average Mortgage Size)
HighGSEFraction
MedGSEFraction
LowGSEFraction
HighSubpFraction
MedSubpFraction
LowSubpFraction
IRSincomegrowth 0.150*** 0.217*** 0.231*** 0.179*** 0.202*** 0.161***(0.047) (0.029) (0.045) (0.051) (0.032) (0.030)
Buyerincomegrowth 0.330*** 0.279*** 0.237*** 0.169*** 0.283*** 0.383***(0.025) (0.021) (0.026) (0.027) (0.019) (0.027)
CountyFE Y Y Y Y Y YNumberofobservations 2,203 4,355 2,061 2,119 4,326 2,174R2 0.23 0.20 0.18 0.09 0.21 0.30
GrowthinAverageMortgageSize

Dropping Zip Codes Based on MS (2015) Measure of Overstatement (Total Mortgage)
All<90th
buyer/irs<80th
buyer/irs<70th
buyer/irs<60th
buyer/irs
IRSincomegrowth -0.224** -0.150* -0.111 -0.113 -0.138(0.088) (0.083) (0.086) (0.087) (0.098)
Buyerincomegrowth 0.376*** 0.348*** 0.325*** 0.311*** 0.315***(0.047) (0.051) (0.054) (0.058) (0.066)
CountyFE Y Y Y Y YNofobservations 8,619 7,755 6,893 6,032 5,170R2 0.02 0.02 0.01 0.01 0.01
Growthintotalmortgageorigination
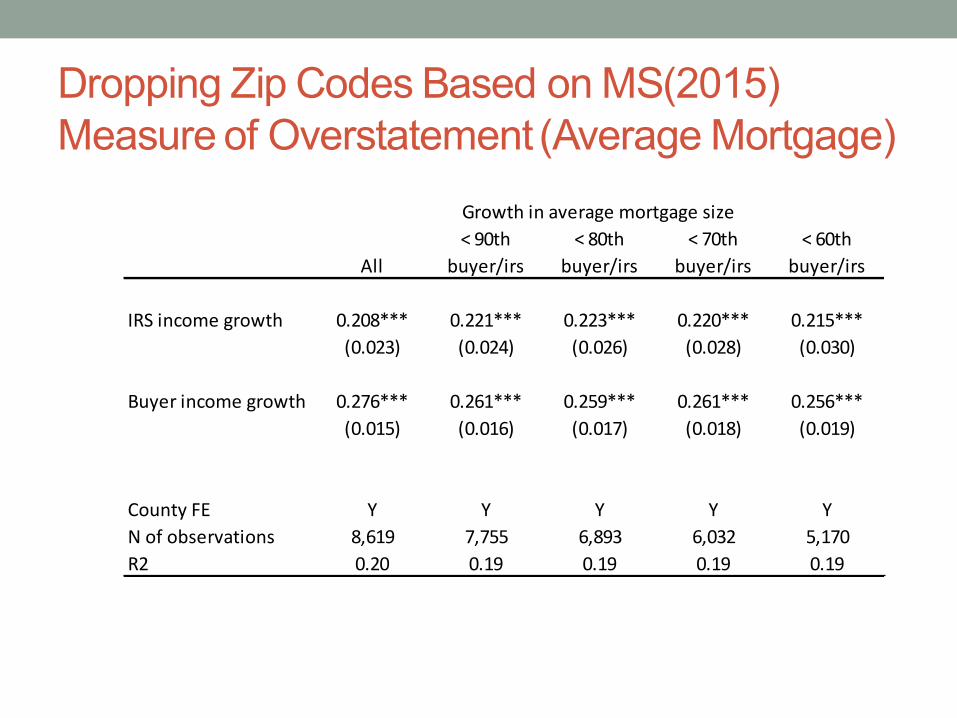
Dropping Zip Codes Based on MS(2015) Measure of Overstatement (Average Mortgage)
All<90th
buyer/irs<80th
buyer/irs<70th
buyer/irs<60th
buyer/irs
IRSincomegrowth 0.208*** 0.221*** 0.223*** 0.220*** 0.215***(0.023) (0.024) (0.026) (0.028) (0.030)
Buyerincomegrowth 0.276*** 0.261*** 0.259*** 0.261*** 0.256***(0.015) (0.016) (0.017) (0.018) (0.019)
CountyFE Y Y Y Y YNofobservations 8,619 7,755 6,893 6,032 5,170R2 0.20 0.19 0.19 0.19 0.19
Growthinaveragemortgagesize