debt investor update - commbank · debt investor update ... refer notes slide at back of this...
TRANSCRIPT

For the Half Year Ended
31 December 2016
Debt Investor Update
COMMONWEALTH BANK OF AUSTRALIA | ACN 123 123 124 | 15 FEBRUARY 2017

2
Disclaimer
The material in this presentation is general background information about the Group and its activities current as at the
date of the presentation, 15 February 2017. It is information given in summary form and does not purport to be complete.
It is not intended to be relied upon as advice to investors or potential investors and does not take into account the
investment objectives, financial situation or needs of any particular investor. Investors should consult with their own legal,
tax, business and/or financial advisors in connection with any investment decision.
Any forward-looking statements included in this presentation speak only as at the date of this presentation and undue
reliance should not be placed upon such statements. Although the Group believes the forward-looking statements to be
reasonable, they are not certain. To the maximum extent permitted by law, responsibility for the accuracy or completeness
of any forward-looking statements whether as a result of new information, future events or results or otherwise is
disclaimed.
The Group is under no obligation to update any of the forward-looking statements contained within this presentation,
subject to disclosure requirements applicable to the Group.
Cash Profit
The Management Discussion and Analysis discloses the net profit after tax on both a statutory and cash basis. The
statutory basis is prepared and reviewed in accordance with the Corporations Act 2001 and the Australian Accounting
Standards, which comply with International Financial Reporting Standards (IFRS). The cash basis is used by management
to present a clear view of the Group’s underlying operating results, excluding certain items that introduce volatility and/or
one-off distortions of the Group’s current period performance. These items, such as hedging and IFRS volatility, are
calculated consistently with the prior comparative period and prior half disclosures and do not discriminate between
positive and negative adjustments. A list of items excluded from statutory profit is provided in the reconciliation of the Net
profit after tax (“cash basis”) on page 3 of the Profit Announcement (PA) and described in greater detail on page 15 of the
PA and can be accessed at our website:
http://www.commbank.com.au/about-us/shareholders/financial-information/results/
Disclaimer

♦ Half year results
♦ Funding & Capital
♦ Strategy
♦ Credit quality
♦ Economics

4
CBA Overview
People,
Customers &
Delivery
Strength
Market Capitalisation4 #1
Capital - CET1 APRA/International5 9.9%/15.4%
Total Assets $972bn
Credit Ratings6 AA-*/Aa2/AA-
Australia NZ Other Total
Customers 13.5m 2.3m 0.5m 16.3m
Staff 41,500 5,700 4,500 51,700
Branches 1,130 131 123 1,384
ATMs 4,417 435 169 5,021
Market
Shares
Customer
Satisfaction
Main Financial Institution (MFI) #1
Home Lending1 #1
Household Deposits2 #1
FirstChoice Platform3 #1
Retail #1
Business #1
Internet Banking #1
=
Refer notes slide at back of this presentation for source information 1. Source: APRA/RBA 2. Source: APRA 3. Source: Strategic Insight Sep-16 (formerly Plan for Life)
4. Source: Bloomberg, 17 Jan 2017 5. Internationally comparable capital - refer glossary for definition. 6. S&P, Moody’s, Fitch * S&P put major Australian Banks on
“Outlook Negative” 7 Jul 2016. Moody’s applied “Negative” outlook 18 August. Fitch updated the outlook on the bank sector to “negative” on 2 Dec, 2016 – though
individual CBA issuer rating remained “Stable”

5
Total assets ($bn) 972 8%
Total liabilities ($bn) 910 8%
FUA ($bn) – average 150 4%
RWA ($bn) 436 11%
Provisions to Credit RWAs (%) 1.02 (9) bpts
Cash earnings ($m) 4,907 2%
ROE (Cash) 16.0% (130) bpts
Cash EPS ($) 2.86 -
DPS ($) 1.99 1 cent
Cost-to-Income 43.3% 120 bpts
NIM (%) 2.11 (4) bpts
NIM (%) ex Treasury & Markets 2.08 (5) bpts
Balance Sheet
Financials
1
Capital & Funding
Capital – CET1 (Int’l)4 15.4% 110 bpts
Capital – CET1 (APRA) 9.9% (30) bpts
LT wholesale funding WAM (yrs) 4.2 0.3yrs
Deposit funding (%) 66% -
Liquidity Coverage Ratio (%) 135 large
Leverage Ratio (APRA) 4.9% (10) bpts
Half Year to 31 December, 2016 1
1. All movements on prior comparative period unless stated 2. Operating Performance is Total Operating Income less Operating Expenses
3. Growth (2%) ex CVA / FVA 4. Internationally comparable capital - refer glossary for definition
Integrity
Accountability
Collaboration
Excellence
Service
To excel at securing and enhancing
the financial wellbeing of
people, businesses and communities

6
1H17 vs 1H16
Business
Unit
% of
Group
NPAT
Operating
performance
$m
Operating
performance
pcp change
LIE
$mLIE
Cash
NPATCosts
Cost-to-
Income
Dec 16
Retail Banking
Services 50% 3,868 9% (350) 14% 9% 2% 31%
Business &
Private Bank16% 1,196 2% (64) (9%) 2% 4% 39%
Institutional
Bank & Markets14% 940 (2%) (44) (69%) 1% 2% 36%
Wealth 5% 306 (35%) n/a n/a (34%) 3% 73%
ASB 9% 752 7% (49) 20% 6% - 36%
Bankwest 7% 552 (1%) (43) Lge (12%) (1%) 41%
International
Financial
Services1% 84 75% (52) 93% Lge (15%) 67%
Business Unit Summary
1
ex CVA / FVA
1. Excludes Corporate Centre and Other
2. % of Group NPAT calculated based on Group result excluding CVA / FVA
3. ASB result in NZD except for “% of Group NPAT”, which is in AUD
3
2
Divisional Contributions

7
7.5% 7.5%6.5%
7.7%5.6% 4.9%
9.1%10.1%
5.2%
12.7%
Household
DepositsHome Lending Business Lending2 ASB
(Business & Rural)
1. Source RBA/APRA/RBNZ. CBA includes BWA except Business Lending. 2. Domestic Lending balance growth (BPB & IB&M ex CMPF). Source RBA.3. Total Operating Income growth on prior comparative period – CBA June financial years, peers September
System CBA
ASB
(Home Lending)ex Bankwest
Volume and Income growth1
3.2% 3.4%
6 mths to Dec 16
4.5%
6 mths to Dec 16
4.2%5.2%
6 mths to Dec 16
2.3%
6.1%
6 mths to Dec 16
3.1% 3.0%
6 mths to Dec 16
Balance Growth – 12 months to Dec 16
5.1%
6%
(reported)
3%
(underlying)
Dec 16Jun 13 Jun 14 Jun 15 Jun 16
+3%+1%
+2%
CBA
Peer Average
Income Growth3 (%)
Balance Growth – 6 months to Dec 16

8
Underlying income up 3%
$m
Total Operating Income
12,362
12,729
13,126
316
173
397
(122)
1H16 NetInterestIncome
OtherBankingIncome
Funds&
Insurance
1H17Underlying
Visa 1H17
+3%
+6%
+4%
+7% (8%)
Volume: ↑ 5%
Margin: ↓ 4bpts
Funds Mgt: ↓3%
Insurance: ↓19%
Trading:
+$104m
Underlying Banking
+5%

9
5,210 5,284
5,677 29 43 2
393
1H16 Staff Amortisation Other 1H17Underlying
AcceleratedAmortisation
1H17
43.8
42.9
42.2 42.141.5
1H13 1H14 1H15 1H16 1H17
Expenses
$m
Total Operating Expenses
+1%+9%
Cost-to-Income (%)
Underlying
1
1. 1H16 restated to conform to presentation in the current period

10
60%52% 53%
28%36% 36%
12% 12% 11%
1H15 1H16 1H17
1st Half
2nd Half
$m
647 582 589 595681
600
639655 593
651
692
FY12 FY13 FY14 FY15 FY16 1H17
1,286
% of total
Productivity
& Growth
Branches
& Other
Risk &
Compliance
1,2371,182
1,246
Continuing to Invest
Gross Investment Spend Investment Spend
1,373
Investment
Expensed 255 299 277

11
214 209 211
3
(1)
2 (5)
(2)
2H16 AssetPricing
FundingCosts
PortfolioMix
Capital &Other
SubTotal
Treasury& Markets
1H17
bpts
Jun 15 Dec 15 Jun 16 Dec 16
213 215 214211
Margin – 6 months
(3) Deposits
(2) Wholesale

12
90+ days
1917 18 18 18 18
FY12 FY13 FY14 FY15 FY16 1H17
Credit quality
73
41
2521 20
16 1619
17
FY09Pro
Forma
FY10 FY11 FY12 FY13 FY14 FY15 FY16 1H17
Consumer
Corporate
24 23
13 1120
14
FY12 FY13 FY14 FY15 FY16 1H17
1. Cash LIE basis points (bpts) calculated as a percentage of average GLA. FY09 includes Bankwest on a pro-forma basis and is based on LIE for the year.
Statutory LIE for FY10 48bpts, FY13 21bpts and FY14 16bpts.
2. Consumer home loan arrears exclude reverse mortgage, Commonwealth Portfolio Loan (RBS only) and Residential Mortgage Group (RBS only) loans
bpts
Dec 13 Jun 14 Dec 14 Jun 15 Dec 15 Jun 16 Dec 16
1.09% 1.28%
0.91%0.88%
0.52% 0.53%
1.46%
0.99%
0.54%
Seasonally lower –
still elevated in WA
Personal
Loans
Sound and
seasonally lower
Credit Cards
Continues at
historically low
levels, higher in WA
Home Loans
Consumer arrears2Loan impairment expense1
5.8 5.23.6 3.1 3.5 3.4
4.74.3
3.42.9 3.1 3.4
Jun 12 Jun 13 Jun 14 Jun 15 Jun 16 Dec 16
10.59.5
7.06.0 6.6 6.8
Group Impaired
Corporate
Troublesome
% of TCE1.34%
1.10%
0.76%
0.60% 0.63% 0.63%
Group TIA

13
Corporate Portfolio Quality Impaired Assets to GLAs
Corporate credit quality
0
100
200
300
400
500
Dec 13 Jun 14 Dec 14 Jun 15 Dec 15 Jun 16 Dec 16
AAA/AA
A
BBB
Other
% of book rated investment grade
68.8 68.3 69.8 69.9 69.8 68.7 68.7
TCE ($bn)
CBA grades in S&P equivalents. Charts based on financial year data (CBA: 31 December, Peers: 30 September).
1H17
Peer 1
Peer 2
Peer 3
CBA
0.0%
1.0%
2.0%
FY09 FY10 FY11 FY12 FY13 FY14 FY15 FY16

14
Individual Provisions Collective Provisions
$m $m
Bankwest
Consumer
Corporate
Overlay
558 566 610
132 169195
219209
212909 944
1,017
Dec 15 Jun 16 Dec 16
812 859 811
9831,077 1,059
232187
181
774 695 756
2,801 2,818 2,807
Dec 15 Jun 16 Dec 16
Economic
Overlay
unchanged
Provisions

♦ Half year results
♦ Funding & Capital
♦ Strategy
♦ Credit quality
♦ Economics

16
Funding Overview
1. Reported at current FX rates 2. Includes the categories ‘central bank deposits’ and ‘due to other financial institutions’ (collateral received) 3. Includes net
short term collateral deposits 4. Reported at historical FX rates
1
23
7
22(14) (2)
(18)
(19)
Equity Customerdeposits
Short termfunding
New long termfunding
Long termmaturities
IFRS MTM & FX Lending Other Assets
Source of funds
$bn
2,3 4 4
Source of funds Use of funds
6 Months to Dec 16 6 Months to Dec 16
Funding Composition
1
1%
1%
2%
3%
4%
9%
14%
66%
RMBS
Short Term Collateral Deposits
Hybrids
Covered Bonds
LT Wholesale Funding ≤ 12 months
LT Wholesale > 12 months
ST Wholesale Funding
Customer Deposits
Issuance
$bn
-
5
10
15
20
25
Jun 14 Dec 14 Jun 15 Dec 15 Jun 16 Dec 16
Securitisation Long Term Wholesale Covered Bond
2131
22382

17
Strong growth across divisions
$bn
Retail Deposit Mix
Deposit funding
1H17 v 1H16
127 130
65 67
39 50
Dec 15 Dec 16
Savings &
Investments
Online4
Transactions3
247231
+30%
+7%
30%
17%
11% 10%
16%
RBS BPB IB&M BWA NZ
Group
18%
2
1. Source APRA 2. In NZD 3. Includes non-interest bearing accounts 4. Online includes NetBank Saver, Goal Saver and Business Online Saver
December 2016 ($bn)
Household
deposits
Other
deposits
241 194
119 112
221
208
196
147
CBA Peer 3 Peer 2 Peer 1
259
315
402
462
Deposits v Peers1

18
Dec 06 Dec 08 Dec 10 Dec 12 Dec 14 Dec 16
Margin to BBSW (bpts)
Average Long Term Funding Costs
Indicative Funding Cost Curves
Margin to BBSW (bpts)
Wholesale funding - Overview
Predicted LT
funding costs
if current market
rates remain
unchanged
200
175
150
125
100
75
50
25
0
1. Includes the categories ‘central bank deposits’ and ‘due to other financial institutions’ (including collateral received)
2. Includes restructure of swaps and reclassification of deals between short and long term funding
Portfolio Run-off
Indicative Funding Costs
4%
4%
6%
6%
9%
12%
12%
15%
32%
Securitisation
Other
Debt Capital
Structured MTN
FI Deposits
Covered Bonds
CP
CDs
Vanilla MTN
2
Wholesale Funding by Product
Term Wholesale Funding by Currency1
0% 20% 40% 60% 80% 100%
Jun 14
Jun 15
Jun 16
Dec 16
AUD
USD
EUR
Other3
8 13 14 17
47
74
98
114 129
50 70
91 102
112
0
20
40
60
80
100
120
140
1 year 2 year 3 year 4 year 5 year
Jun 07 Jun 16 Dec 16

19
32 29
31
17
8
21 24 25
12 13 14
7
2
7
5
7
2
6
4
8 8
5
10
15
20
25
30
35
40
45
Jun 14 Jun 15 Jun 16 Dec 16 Jun 17 Jun 18 Jun 19 Jun 20 Jun 21 Jun 22 > Jun 22
Long Term Wholesale Debt Covered Bond
Weighted average maturity 4.2 years
Long Term wholesale maturity profile
1. Includes debt with an original maturity or call date of greater than 12 months (including loan capital)
2. Includes Interbank and Central Bank
$bnMaturityIssuance
39
31
38
22
15
New Issuance Range
20
Net Cash Outflow Liquid Assets Net Cash Outflow Liquid Assets Net Cash Outflow Liquid Assets
Dec-15 Jun-16 Dec-16
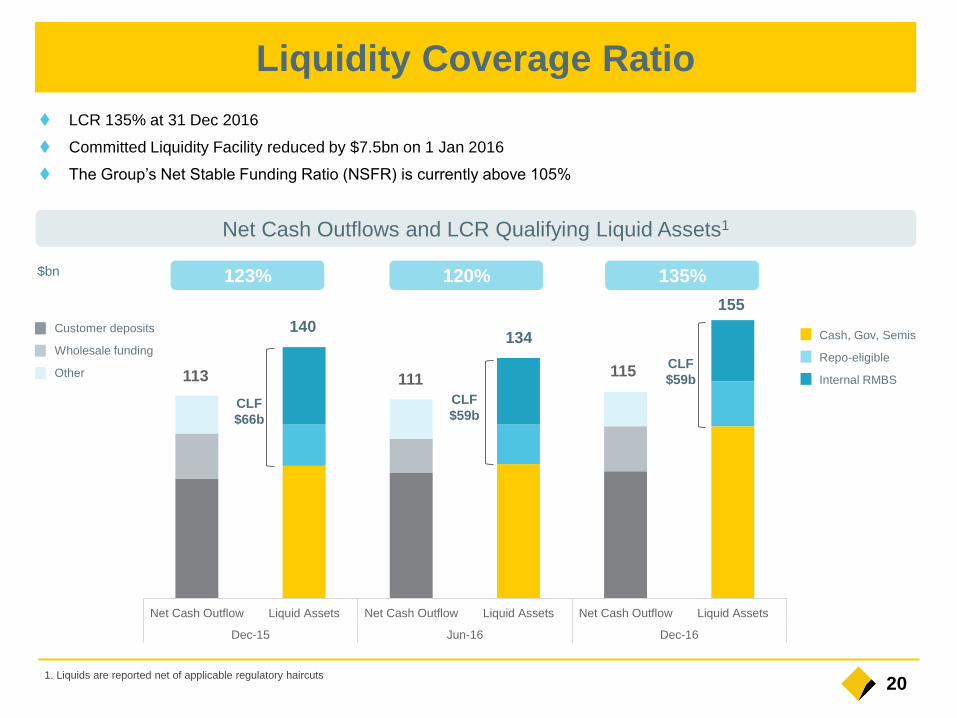
Liquidity Coverage Ratio
1. Liquids are reported net of applicable regulatory haircuts
LCR 135% at 31 Dec 2016
Committed Liquidity Facility reduced by $7.5bn on 1 Jan 2016
The Group’s Net Stable Funding Ratio (NSFR) is currently above 105%
$bn
Net Cash Outflows and LCR Qualifying Liquid Assets1
140134
155
113 111115
Customer deposits
Wholesale funding
Other
123% 120% 135%
CLF
$66b
CLF
$59b
CLF
$59b
Cash, Gov, Semis
Repo-eligible
Internal RMBS

21
Capital levels and ROE
2007 2009 2011 2013 2015 1H17
378%
121%
CET1
Assets
Capital Management Return on Equity
2008 1H172010 2012 2014 2016
16.0%

22
International CET1 ratios
20.4
15.4 15.0 14.9 14.7 14.5 14.4
14.1 14.0 14.0 14.0 13.4
13.0 12.6 12.6 12.5 12.5 12.4 12.3 12.2 12.1 12.1 12.1 12.0 11.9
11.6 11.3 11.1 11.0 11.0 11.0 11.0 10.8 10.8 10.7 10.4 10.4
7.5
3
323 3 3
3
3
APRA top quartile 1
3
G-SIBs in dark grey
1. APRA Insight Issue Two “International capital comparison update” (4 July 2016)
2. Domestic peer figures as at 30 September 2016
3. Deduction for accrued expected future dividends added back for comparability
2
3
3
3
3
3
2
3
Source: Morgan Stanley and CBA. Based on last reported CET1 ratios up to 9 February 2017 assuming Basel III capital reforms fully implemented.
Peer group comprises listed commercial banks with total assets in excess of A$750 billion and which have disclosed fully implemented Basel III ratios or provided sufficient
disclosure for a Morgan Stanley estimate.
No
rde
a
CB
A
UB
S
RB
S
ING
AN
Z
WB
C
Llo
yd
s
HS
BC
NA
B
Inte
sa
Sa
np
ao
lo
Ch
ina C
onstr
uct. B
ank
Sta
nd
ard
Ch
art
ere
d
ICB
C
Cre
dit A
grico
le S
A
Citi
Mitsu
bis
hi U
FJ
Co
mm
erz
ba
nk
JP
Mo
rga
n
Su
mito
mo
Mitsu
i
Cre
dit S
uis
se
So
cG
en
BN
P P
arib
as
De
uts
ch
e
Barc
lays
Ba
nk o
f C
hin
a
Bank o
f C
om
m.
Miz
uh
o
Sa
nta
nd
er
BB
VA
RB
C
Ba
nk o
f A
me
rica
We
lls F
arg
o
Sco
tia
ba
nk
To
ron
to D
om
inio
n
Ag
ri. B
an
k o
f C
hin
a
Un
iCre
dit
Ch
ina
Me
rch
an
ts B
an
k

23
Common Equity Tier 1 (CET1)
Capital and Leverage
112(80)
(74)(28)
10.6%
9.9%
15.4%
Jun 16APRA
Highermortgagerisk weight
June 16Final
Dividend(Net of DRP)
CashNPAT
RWA &Other
Dec 16APRA
Dec 16Int'l
1. Internationally comparable capital - refer glossary for definition
1
bpts
The Group is currently executing the issue a Tier 1 capital instrument – “Perls IX”
5.0% 5.0% 4.9%
5.6% 5.6% 5.5%
APRA Int'l
Leverage ratio = Tier 1 Capital
Total Exposures
Leverage ratio introduced to constrain the build-up
of leverage in the banking system.
Scheduled to be introduced as a minimum
requirement from 1 January 2018.
Dec 15 Jun 16
Basel
Committee
minimum
3%
Dec 16
Leverage Ratio
24
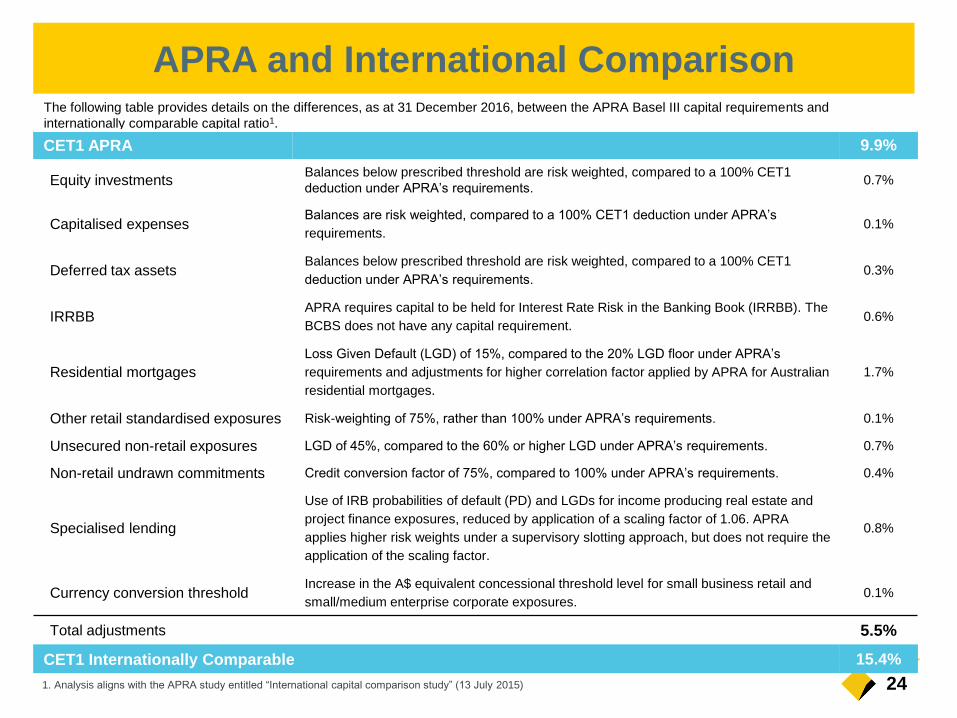
The following table provides details on the differences, as at 31 December 2016, between the APRA Basel III capital requirements and
internationally comparable capital ratio1.
CET1 APRA 9.9%
Equity investmentsBalances below prescribed threshold are risk weighted, compared to a 100% CET1
deduction under APRA’s requirements.0.7%
Capitalised expensesBalances are risk weighted, compared to a 100% CET1 deduction under APRA’s
requirements.0.1%
Deferred tax assetsBalances below prescribed threshold are risk weighted, compared to a 100% CET1
deduction under APRA’s requirements. 0.3%
IRRBBAPRA requires capital to be held for Interest Rate Risk in the Banking Book (IRRBB). The
BCBS does not have any capital requirement. 0.6%
Residential mortgages
Loss Given Default (LGD) of 15%, compared to the 20% LGD floor under APRA’s
requirements and adjustments for higher correlation factor applied by APRA for Australian
residential mortgages.
1.7%
Other retail standardised exposures Risk-weighting of 75%, rather than 100% under APRA’s requirements. 0.1%
Unsecured non-retail exposures LGD of 45%, compared to the 60% or higher LGD under APRA’s requirements. 0.7%
Non-retail undrawn commitments Credit conversion factor of 75%, compared to 100% under APRA’s requirements. 0.4%
Specialised lending
Use of IRB probabilities of default (PD) and LGDs for income producing real estate and
project finance exposures, reduced by application of a scaling factor of 1.06. APRA
applies higher risk weights under a supervisory slotting approach, but does not require the
application of the scaling factor.
0.8%
Currency conversion thresholdIncrease in the A$ equivalent concessional threshold level for small business retail and
small/medium enterprise corporate exposures.0.1%
Total adjustments 5.5%
CET1 Internationally Comparable 15.4%
1. Analysis aligns with the APRA study entitled “International capital comparison study” (13 July 2015)
APRA and International Comparison

25Cash NPAT Payout Ratio
cents per share
Increased Dividend
113 113 120132 137
164
183
198 198 199
63%
84%
63% 62% 62%71% 70% 70% 71% 70%
1H08 1H09 1H10 1H11 1H12 1H13 1H14 1H15 1H16 1H17

26
APRA
Leverage ratio
Response to FSI
Counter Party Credit
Risk
Securitisation
Basel Committee
Capital floors
Standardised &
Advanced Credit Risk
IRRBB
BCBS
expect
to
finalise
Implementation to be advised
NSFR
Standardised
Operational Risk
Market RiskFinalised
2016
Implementation to be advised
Implementation to be advised
Implementation
Implementation
Additional disclosures from 2018
APRA
expected
to consult
and
finalise
domestic
rules
1. Implementation of the standardised approach for measuring counterparty credit risk exposures (SA-CCR) may be deferred by 12 months to 1 January 2019,
subject to finalisation by APRA.
Regulatory Change
2017 2018 2019 2020
Disclosure only Implementation
Implementation from 1 Jul 2016 – increase in mortgage risk weights.
Further calibration by 1 July 2017
Implementation
Implementation1
APRA comments
Nov 2015: “.. the FSI recommended the
implementation of a domestic TLAC
framework … However, Australia should
not get ahead of international
developments,…. so it makes good
sense that we hasten slowly.”
Nov 2016: “Our most high profile policy
item for 2017 will be setting
‘unquestionably strong’ capital standards
as recommended by the FSI”
“..capital accumulation remains the
appropriate course for most ADIs, but
with sensible capital planning the actual
implementation of any changes should
be able to be managed in an orderly
fashion.”
Feb 2017:“.. The timetable for that
Basel work (bank capital regime) now
seems less certain, so it would be
remiss of us to wait any longer. We will
have more to say in the coming months“
“..lenders that choose to operate beyond
these benchmarks (10% growth in
Investor loans) are under no illusions
that supervisory intervention, probably in
the form of higher capital requirements,
is a possible consequence.”

♦ Half year results
♦ Funding & Capital
♦ Strategy
♦ Credit quality
♦ Economics

28
Productivity Technology Strength
To excel at
securing and enhancing
the financial wellbeing of
people, businesses and
communities
Our Vision, Values and Strategy
Integrity
Accountability
Collaboration
Excellence
Service
Our Vision Our Values
People
Strategic Capabilities

29* Main Financial Institution - Refer notes slide at back of this presentation for source information
By Age
Customer satisfaction opportunity
CBA Peer 3 Peer 1 Peer 2
33.8%
19.1%13.7%
11.9%
42.4%
45.9%
43.0%
30.2%
28.5%
26.6%
MF
I S
hare
Customer Lifecycle
14-17 18-24 25-34 35-49 50-64 65+
Dec 16
Dec 12
% Satisfied ('Very Satisfied' or 'Fairly Satisfied')
Retail Customer Satisfaction
66.5%
#1
19 consecutive
months
Dec 06 Dec 16
CBA
Peers
Overall – “Major Financial Institution”

30
68k Customer insights each week
32k Financial Health Checks each week
24k Video-conferencing referrals 1H17
Branches remain key
Customer Relationships
Photo – Express branch, Burwood East, Victoria
New format – 88 locations
50% reduction in branch space
IDMs across network by end 2017
Efficiency
55% 54%
57%
48% 48%46%
Dec 15 Jun 16 Dec 16
Market
Home loans - Proprietary % of Total flow

31
Channel Usage
1H17 - By Number
1H17 - By $ Value
Branch
ATM1
Point of Sale2
Internet3
The digital revolution
2%9%
65%
24%
Branch ATM Point of sale Internet
33%
5%9%
53%
Branch ATM Point of sale Internet
2003 2004 2005 2006 2007 2008 2009 2010 2011 2012 2013 2014 2015 2016 1H17X2
130
56
(deposits & withdrawals) m
m
m
m
(all transactions)
(all transactions, including credit cards)
(transactions of value)
2003 2004 2005 2006 2007 2008 2009 2010 2011 2012 2013 2014 2015 2016 1H17X2
325257
2003 2004 2005 2006 2007 2008 2009 2010 2011 2012 2013 2014 2015 2016 1H17X2
700
1,848
2003 2004 2005 2006 2007 2008 2009 2010 2011 2012 2013 2014 2015 2016 1H17X2
40
684
All figures are approximates. Full year volume of transactions has been forecast on a run rate basis by doubling the volume from 1 July 2016 to 31 December 2016.
1. All cardholder transactions at Australian CBA ATMs. ATM includes IDMs and an increase in the dollar value of deposits. ATM only transactions reduced for FY16
and are predicted to reduce again in FY17. 2. Calendar years to 2006; financial years thereafter. Includes EFTPOS Payments Australia Ltd (EPAL), MasterCard and
Visa volumes only. 3. Calendar years to ‘07; financial years thereafter includes BPAY.

32
Landmark
partnerships with
Alipay and Barclays
Albert and Pi
Empowering clients with
insights based on real-time
customer behaviours
First interbank open
account transaction
First global
government bond trial
Blockchain Digital & Analytics Payments
Continuous Innovation

33
11%
13%
15%
17%
19%
21%
23%
25%
27%
Market share1
% Dec 16 Jun 16 Dec 15
Home loans 25.4 25.3 25.1
Credit cards – RBA2 24.3 24.4 24.4
Other household lending3 16.9 16.8 16.9
Household deposits4 29.0 29.2 29.0
Business lending – RBA 16.6 16.9 17.0
Business lending – APRA 18.6 18.7 18.7
Business deposits – APRA 19.8 20.2 20.3
Asset finance 12.7 12.9 13.1
Equities trading 4.0 4.7 5.6
Equities – online trading5 55.4 55.8 56.1
Aust Retail – admin view6 15.5 15.6 15.5
FirstChoice Platform6 10.8 11.0 10.9
Aust life insure (total risk)6 11.2 11.4 11.6
Aust life insure (indiv risk)6 10.3 10.7 11.0
NZ home loans 22.0 21.8 21.8
NZ retail deposits 21.1 21.0 20.9
NZ business lending 13.1 12.4 11.9
NZ retail FUA 15.5 15.4 15.8
NZ annual inforce premiums 28.0 28.4 28.7
1. Prior periods have been restated in line with market updates 2. As at 30 Nov 16 3. Includes personal loans, margin loans and other forms of lending to individuals
4. Comparatives have been restated to include the impact of new market entrants 5. CommSec market share is an internally derived number based on publically available ASX data 6. As at 30 Sep 16.
Home Loan Market Share
Jun 07 Dec 16
25.4%
23.3%
14.8%
14.6%
Peer 1
Peer 2
Peer 3
CBA

34
CBA in Asia and South Africa
Indonesia
♦ PT Bank Commonwealth (99%): 70 branches and
144 ATMs
♦ PT Commonwealth Life (80%): 27 life offices
♦ First State Investments
Japan
♦ Tokyo CBA branch
♦ First State Investments
Singapore
♦ CBA branch
♦ First State Investments
Vietnam
♦ Vietnam International Bank (20%): 155 branches
♦ Hanoi Representative Office
♦ Ho Chi Minh City CBA branch; 25 ATMs
India
♦ Mumbai CBA branch
China
♦ Bank of Hangzhou (18%): 189 branches
♦ Qilu Bank (20%): 120 branches
♦ County Banking (Henen & Hebei):
- 15 branches (10 @ 100% holding, 5 @ 80% holding)
- 8 sub-branches (2 @ 100% holding, 6 @ 80% holding)
♦ CBA Beijing, Shanghai and Hong Kong branches
♦ BoCommLife (37.5%): operating in 11 provinces
♦ First State Cinda JV (46%) and First State Investments
Hong Kong
♦ Colonial Mutual Group Beijing Rep Office
Map not to scale
Asia
South
Africa
South Africa
♦ CBA SA (TYME
entities): 685 kiosks

♦ Half year results
♦ Funding & Capital
♦ Strategy
♦ Credit quality
♦ Economics

36
Credit exposures by industryTCE TIA $m TIA % of TCE
Jun 16 Dec 16 Jun 16 Dec 16 Jun 16 Dec 16
Consumer 54.9% 54.8% 1,405 1,409 0.24% 0.24%
Sovereign 9.0% 9.5% - - - -
Property 6.6% 6.7% 544 630 0.79% 0.87%
Banks 6.8% 6.3% 10 9 0.01% 0.01%
Finance – Other 5.2% 5.1% 64 58 0.12% 0.10%
Retail & Wholesale 2.4% 2.4% 694 571 2.71% 2.20%
Agriculture 1.9% 2.0% 853 1,104 4.32% 5.21%
Manufacturing 1.6% 1.6% 597 600 3.56% 3.48%
Transport1 1.5% 1.5% 402 513 2.55% 3.25%
Mining 1.5% 1.4% 583 538 3.63% 3.62%
Business Services 1.2% 1.3% 155 186 1.26% 1.36%
Energy 1.1% 1.2% 50 49 0.45% 0.38%
Construction 0.8% 0.8% 407 281 4.85% 3.10%
Health & Community 0.7% 0.7% 64 215 0.87% 2.94%
Culture & Recreation 0.7% 0.7% 125 71 1.77% 0.91%
Other1 4.1% 4.0% 639 561 1.49% 1.31%
Total 100.0% 100.0% 6,592 6,795 0.63% 0.63%
1. Comparative information has been reclassified to conform to presentation in the current period.

37
Exposures by Industry Top 20 Commercial Exposures
Group TCE by Geography
CBA grades in S&P equivalents.
Sector exposures
TCE $bnAAA
to AA-
A+
to A-
BBB+
to
BBB-
Other Dec 16
Sovereign 95.9 6.7 0.1 0.3 103.0
Property 2.0 5.6 14.9 49.5 72.0
Banks 30.4 27.8 7.9 2.4 68.5
Finance - Other 22.1 22.1 8.1 3.0 55.3
Retail & Wholesale
Trade- 3.2 7.6 15.1 25.9
Agriculture - 0.5 2.0 18.7 21.2
Manufacturing 0.8 3.7 5.0 7.7 17.2
Transport - 1.3 8.8 5.7 15.8
Mining 0.1 3.8 6.9 4.1 14.9
Energy 0.3 2.4 8.5 1.6 12.8
All other excl.
Consumer1.4 7.1 21.4 41.8 71.7
Total 153.0 84.2 91.2 149.9 478.3
Dec 15 Jun 16 Dec 16
Australia 75.4% 76.7% 76.4%
New Zealand 8.8% 9.2% 9.7%
Europe 6.4% 5.4% 5.8%
Other International 9.4% 8.7% 8.1%
- 500 1,000 1,500 2,000 2,500
BBB-
A-
A-
BBB+
BBB-
A+
AAA
BBB
AA-
A-
A
A+
A+
A-
A-
AA-
BBB+
BBB-
A
BBB-
TCE $m

38
Home loan portfolio - Australia
Portfolio1 Dec
15
Jun
16
Dec
16
Total Balances - Spot ($bn) 393 409 423
Total Balances - Average ($bn) 388 395 416
Total Accounts (m) 1.7 1.8 1.8
Variable Rate (%) 85 85 85
Owner Occupied (%) 62 62 63
Investment (%) 33 33 33
Line of Credit (%) 5 5 4
Proprietary (%) 56 55 54
Broker (%) 44 45 46
Interest Only (%)2 38 39 40
Lenders’ Mortgage Insurance (%)2 25 24 23
Low Doc (%)2 0.8 0.7 0.6
Mortgagee In Possession (bpts) 4 5 5
Annualised Loss Rate (bpts) 2 2 2
Portfolio Dynamic LVR (%)3 49 50 51
Customers in Advance (%)4 78 77 77
Payments in Advance incl. offset5 29 31 35
1. All portfolio and new business metrics are based on balances and fundings respectively, unless stated otherwise. All new business metrics are based on 6 months to June and December.
2. Excludes Line of Credit (Viridian LOC/Equity Line).
3. LVR defined as current balance/current valuation.
4. Any payment ahead of monthly minimum repayment; includes offset facilities.
5. Average number of payments ahead of scheduled repayments.
6. Serviceability test based on the higher of the customer rate plus a 2.25% interest rate buffer or a minimum floor rate.
New Business1 Dec
15
Jun
16
Dec
16
Total Funding ($bn) 50 51 53
Average Funding Size ($’000) 302 299 311
Serviceability Buffer (%)6 2.25 2.25 2.25
Variable Rate (%) 90 85 89
Owner Occupied (%) 66 65 62
Investment (%) 31 33 37
Line of Credit (%) 3 2 1
Proprietary (%) 52 50 54
Broker (%) 48 50 46
Interest Only (%)2 39 40 42
Lenders’ Mortgage Insurance (%)2 16 14 14
Low Doc (%)2 0.06 0.03 0.02

39
Growth profile – Australian home loans
State Profile
Determined by location of the underlying security
Balance Growth
$bn
5.6%
4.2%3.6%
1.2% 1.5%
NSW/ACT VIC/TAS QLD WA SA/NT
1H17 Balance Growth
33%
26%
18%
17%
6%
% of Portfolio
Arrears Arrears by State
Includes RBS and Bankwest. State Profile and Arrears exclude Line of Credit, Reverse Mortgage, Commonwealth Portfolio Loans (RBS only) and Residential Mortgage Group (RBS only) loans.
20132012
2016
20152014
WA NSW/ACT
SA/NT QLD
VIC/TAS
National
90+ days90+ days
0.00%
0.50%
1.00%
1.50%
Dec 13 Jun 14 Dec 14 Jun 15 Dec 15 Jun 16 Dec 16
409 423
53 15 (46)
(8)
Jun 16 NewFundings
Redraw &Interest
Repayments/ Other
ExternalRefinance
Dec 16
0.00%
0.50%
1.00%
1.50%
Jan Feb Mar Apr May Jun Jul Aug Sep Oct Nov Dec

40
Growth profile – RBS home loans
0.0%
0.5%
1.0%
1.5%
2.0%
0 6 12 18 24 30 36 42 48 54 60 66 72
90+ days
Months on Book
Home Loan Arrears by Vintage3
Home Loan Balances
Home Loan Dynamic LVR2
FY07-09
FY13
FY10
FY11
FY15FY14
FY12
FY16
Broker Share of Fundings1
$bn
47%
50%51%
52% 52% 52%54%
38%39%
40%42%
45% 46%
43%
Dec 13 Jun 14 Dec 14 Jun 15 Dec 15 Jun 16 Dec 16
Market CBA
1. % of home loan fundings ($’s). Market represents quarterly MFAA data up to Sep-16. CBA includes Residential Mortgage Group. 2. Dynamic LVR is current
balance / current valuation. 3. Vintage Arrears includes: Line of Credit, Reverse Mortgage, Commonwealth Portfolio Loan and Residential Mortgage Group loans.
0%
10%
20%
30%
40%
50%
60%
70%
0-60% 61-80% 81-90% 91-95% 96+%
Pro
po
rtio
n o
f T
ota
l P
ort
folio
Dynamic LVR Band
Average
Dynamic
LVR
Dec 15 48%
Jun 16 49%
Dec 16 50%
Jun 16 New
Fundings
Redraw &
Interest
Repayments
/ Other
External
Refinance
Dec 16
345 357 47 14 (43)
(6)

41
Consumer arrears - Group
ASB
Bankwest
RBS
ASB
Bankwest
RBS
90+ days
Home Loans
Credit Cards
Personal Loans 90+ days
90+ days 90+ days
Consumer Portfolios
Credit Cards Personal Loans
Home Loans
0.0%
1.0%
2.0%
Dec 13 Jun 14 Dec 14 Jun 15 Dec 15 Jun 16 Dec 160.0%
1.0%
2.0%
Dec 13 Jun 14 Dec 14 Jun 15 Dec 15 Jun 16 Dec 16
0.0%
1.0%
2.0%
Dec 13 Jun 14 Dec 14 Jun 15 Dec 15 Jun 16 Dec 16
ASB
Bankwest
RBS
Consumer represents Retail Banking Services, ASB Retail and Bankwest Retail. ASB write-off Credit Card and Personal Loans typically around 90 days past due
if no agreed repayment plan. Business Unit Home Loans exclude Line of Credit, Reverse Mortgage, Commonwealth Portfolio Loan (RBS only) and Residential
Mortgage Group (RBS only) loans.
0.0%
1.0%
2.0%
Dec 13 Jun 14 Dec 14 Jun 15 Dec 15 Jun 16 Dec 16

42
0
0.4
0.8
1.2
WA 1.00%
Portfolio 0.53%
90+ days %
Dec 13 Dec 16
Australian
balances WA Mining
Towns 1%
WA arrears impacted by mining downturn
Home Loan Arrears
Higher Risk Locations:
Increased provisions
Rigorous stress testing
Credit policy tightening
o LVR caps
o Insurance requirements
43
Investor home loans – Australia
0%
5%
10%
15%
20%
25%
30%
35%
40%
0k to75k
75k to100k
100k to125k
125k to150k
150k to200k
200k to500k
> 500k
0.00%
0.20%
0.40%
0.60%
0.80%
1.00%
Dec 13 Jun 14 Dec 14 Jun 15 Dec 15 Jun 16 Dec 16
New Business Profile (%)
Borrower Profile
Arrears
Owner Occupied
Investment Loan
Portfolio
90+ days
Owner Occupied
Investment Loan
Applicant Gross Income BandFundings (6 Months to Dec 16)
Investment Home Loans
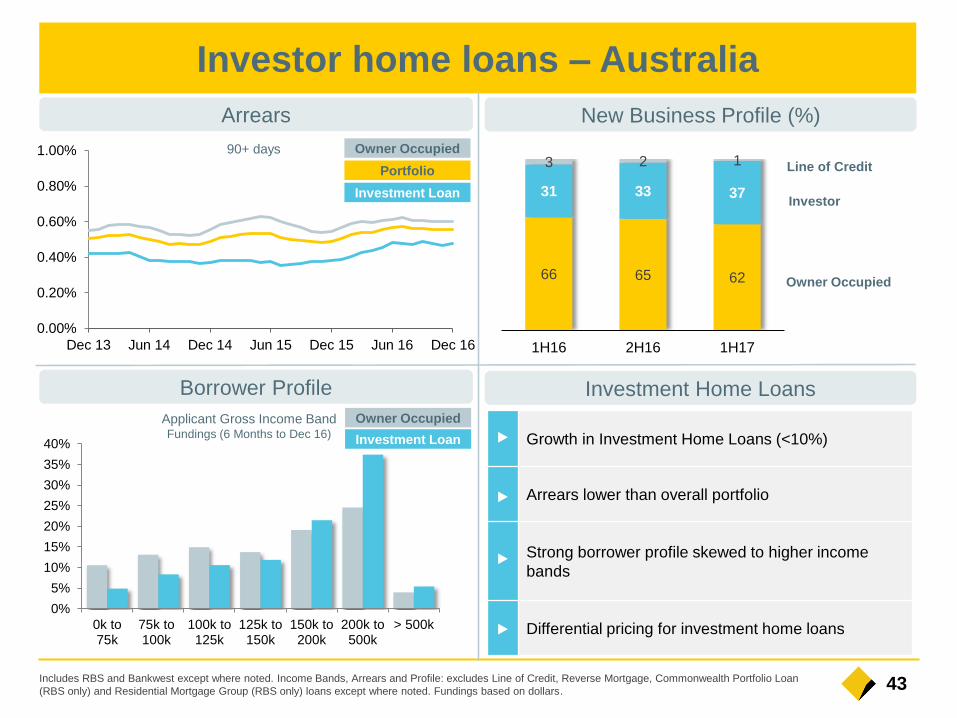
Includes RBS and Bankwest except where noted. Income Bands, Arrears and Profile: excludes Line of Credit, Reverse Mortgage, Commonwealth Portfolio Loan
(RBS only) and Residential Mortgage Group (RBS only) loans except where noted. Fundings based on dollars.
Growth in Investment Home Loans (<10%)
Arrears lower than overall portfolio
Strong borrower profile skewed to higher income
bands
Differential pricing for investment home loans
66 65 62
31 33 37
3 2 1
1H16 2H16 1H17
Owner Occupied
Investor
Line of Credit

44
Home loan stress test – Australia
Assumptions and Outcomes Summary
Assumptions (%) Base Year 1 Year 2 Year 3
Cash Rate 1.75 1.0 0.5 0.5
Unemployment 5.9 7.5 9.5 11.0
Labour Force
Under Utilisation14.2 17.4 21.4 24.4
Cumulative
reduction in house
prices
n/a 10.0 23.0 31.0
LMI claim payout
ration/a 70% 70% 70%
Outcomes ($m) Total Year 1 Year 2 Year 3
Stressed Losses 3,599 550 1,148 1,901
Insured Losses 1,314 211 422 681
Net Losses 2,285 339 726 1,220
Net Losses (bpts) 48.0 7.2 15.1 25.7
PD % n/a 1.0 1.6 2.4
Results based on June 2016 data. Labour Force Under Utilisation is the unemployment and underemployment rate combined. House prices
and Probabilities of Default (PD) are stressed at regional level. Net losses (bpts) calculated as net losses in year divided by average exposure.
Stress Test scenario represents a severe but plausible
commodities-led recession.
3 year scenario of cumulative 31% house price decline,
peak 11% unemployment and a reduction in the cash rate
to 0.5%
Total net losses after LMI recoveries over 3 years of
$2.29bn.
Stress Test loss outcomes updated to take into account
portfolio deterioration, specifically from Western Australia
and mining towns.
House prices and PDs are stressed at regional level.
One of multiple regular stress tests undertaken as part of
Risk Management and regulatory activities.
45
Overview Group Exposure
Profile
Sector Geography
Dec 1
5
Ju
n 1
6
Dec 1
6
Date Legend
% of Group
TCE
Portfolio
impaired
$m
% of portfolio
investment
grade
TCE
($bn)
% of portfolio
graded TIA
% of portfolio
Impaired
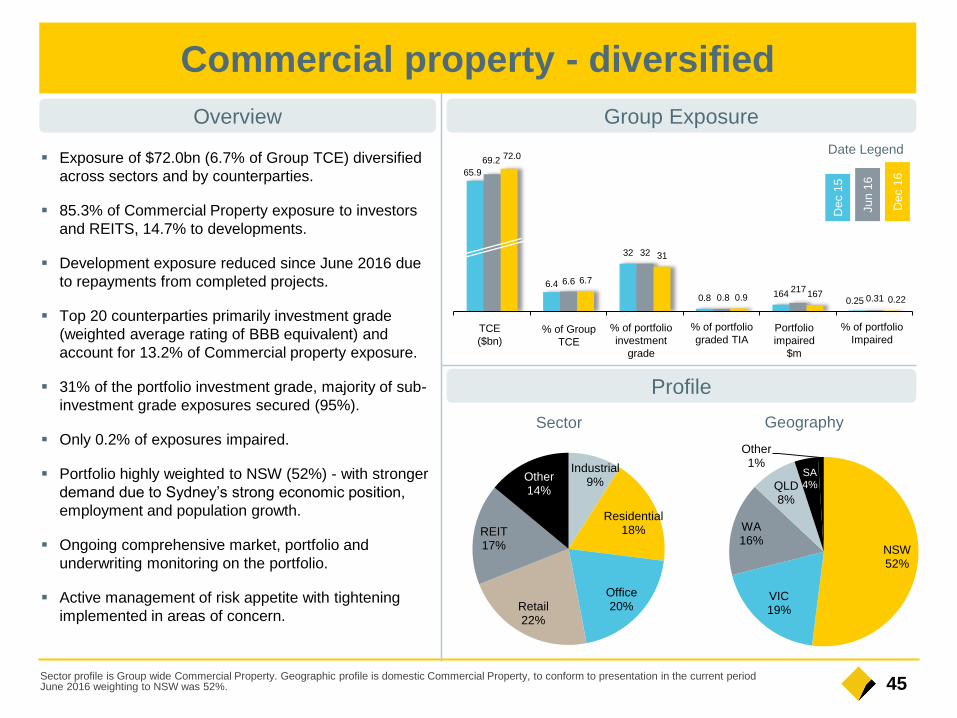
65.9
6.4
32
0.8 1640.25
69.2
6.6
32
0.8217
0.31
72.0
6.7
31
0.9 1670.22
NSW52%
VIC19%
WA16%
QLD8%
SA4%
Other1%Industrial
9%
Residential18%
Office20%Retail
22%
REIT17%
Other14%
Exposure of $72.0bn (6.7% of Group TCE) diversified
across sectors and by counterparties.
85.3% of Commercial Property exposure to investors
and REITS, 14.7% to developments.
Development exposure reduced since June 2016 due
to repayments from completed projects.
Top 20 counterparties primarily investment grade
(weighted average rating of BBB equivalent) and
account for 13.2% of Commercial property exposure.
31% of the portfolio investment grade, majority of sub-
investment grade exposures secured (95%).
Only 0.2% of exposures impaired.
Portfolio highly weighted to NSW (52%) - with stronger
demand due to Sydney’s strong economic position,
employment and population growth.
Ongoing comprehensive market, portfolio and
underwriting monitoring on the portfolio.
Active management of risk appetite with tightening
implemented in areas of concern.
Commercial property - diversified
Sector profile is Group wide Commercial Property. Geographic profile is domestic Commercial Property, to conform to presentation in the current period June 2016 weighting to NSW was 52%.

46
Residential apartments - weighted to Sydney
Overview Profile (Dec 16)
Exposure Maturity Profile
Sydney
$3.1bn
(60%)Melbourne
$1.0bn
Brisbane
$0.5bn
Perth
$0.3bn
Other
$0.3bn
Apartment
development1
40%
($5.2bn)
Other
development
28%
Investment
32%
Total Residential$13.3bn (18% of CP)
Apartment Development1
$5.2bn (0.5% of TCE) Credit quality sound
Strong qualifying pre-sales
(110.1%)1
Portfolio LVR of 59.9%1
Tighter underwriting in place,
including lower acceptance of
foreign pre-sales
Facilities being repaid on time
from pre-sale settlements
Portfolio deep dives have
demonstrated that developers
have continued to sell post
meeting origination QPS levels
Sydney developments are
diversified across the
metropolitan area
2.7
2.0
0.5
2017 2018 2019
(TCE $bn)
1. Australia-wide, >$20m.
Major Capital Cities defined as all postcodes within a 15km radius of Brisbane, Melbourne and Perth and all metropolitan Sydney based on location of the development.
QPS refers to level of Qualifying Pre-Sales accepted as a pre-condition to loan funding. QPS Cover is level of QPS held to cover the exposure.

47
Overview
Mining, Oil and Gas by Sector
Group Exposure
Mining, Oil and Gas – lower exposure
-
2.0
4.0
6.0
8.0
10.0
12.0
14.0
Oil & GasExtraction
MetalsMining
Iron OreMining
Gold OreMining
MiningServices
BlackCoal
Mining
OtherMining
($bn)
Dec 1
5
Ju
n 1
6
Dec 1
6
Date Legend
Dec 1
5
Ju
n 1
6
Dec 1
6
Date Legend
18.8
1.8
74
2.3 244 1.3
16.0
1.5
70
3.6 174 1.1
14.9
1.4
73
3.6 2361.6
% of Group
TCE
Portfolio
impaired
$m
% of portfolio
investment
grade
TCE
($bn)
% of
portfolio
graded TIA
% of
portfolio
Impaired
Exposure of $14.9bn (1.4% of Group TCE), $1.1bn
reduction on prior half due to active portfolio
management, repayments and selective origination.
Portfolio continues to perform acceptably:
73% investment grade.
Diversified by commodity/customer/region.
Focus on quality, low cost sponsors.
Mining services exposure modest (4% of total).
Oil and Gas Extraction is the largest sub-sector (57%
of total): 77% investment grade with 35% related to
LNG – typically supported by strong sponsors with
significant equity contribution.
TIA level remains stable at 3.6% of the portfolio, albeit
slight uptick in Impaired level.
Impaired asset coverage ratio is 31%.
Improved market conditions following recovery in
major commodities during the past 12 months which
has been accompanied by producers reducing costs
and restructuring balance sheets.
Risk remains of commodity price pull back with
continued selective approach to new origination.

48
6.9
0.7
5.64.3
1642.4
7.4
0.7
7.16.2
245 3.3
7.6
0.7
4.6
9.8
333 4.4
Overview Group Exposure
NZ Dairy Exposure Group Exposure by Sector
Agriculture – increased NZ dairy provisions
New Zealand dairy exposure (AUD) included in Group exposure.
Dec 1
5
Ju
n 1
6
Dec 1
6
Date Legend ($bn)
De
c 1
5
Ju
n 1
6
Dec 1
6
Date Legend
Dec 1
5
Ju
n 1
6
Dec 1
6
Date Legend
% of Group
TCE
Portfolio
impaired
$m
% of portfolio
investment
grade
TCE
($bn)
% of
portfolio
graded TIA
% of
portfolio
Impaired
18.5
1.8
11
3.9323
1.8
19.7
1.9
12
4.3336
2.0
21.2
2.0
12
5.2458
2.2
% of Group
TCE
Portfolio
impaired
$m
% of portfolio
investment
grade
TCE
($bn)
% of
portfolio
graded TIA
% of
portfolio
Impaired
-
1.0
2.0
3.0
4.0
5.0
6.0
7.0
8.0
9.0
DairyFarming
Sheep andBeef
Farming
GrainGrowing
Forestry,Fishing and
Services
Horticultureand Other
Crops
OtherLivestock
Exposure of $21.2bn (2.0% of Group TCE) is well
diversified by geography, sector and client base.
Australian agriculture portfolio performing well.
NZ dairy portfolio:
Represents 0.7% of Group TCE. Performance
being supported by improved milk prices.
Provision levels increased in the half year.
Outlook is dependent on the sustainability of the
recent improvement in milk prices (refer slide 123)

♦ Half year results
♦ Funding & Capital
♦ Strategy
♦ Credit quality
♦ Economics

50Credit Growth = 12 months to June
GDP, Unemployment & CPI = Financial year average
Cash Rate = As at June= forecast
World GDP = Calendar Year Average
Key Economic Indicators (June FY)
2012 2013 2014 2015 2016 2017 2018
World GDP 3.4 3.3 3.4 3.2 3.1 3.2 3.5
Australia Credit Growth % – Total 4.4 3.1 5.0 5.9 6.1 4¾-6¾ 4¾-6¾
Credit Growth % – Housing 5.0 4.6 6.4 7.3 6.7 5-7 5-7
Credit Growth % – Business 4.4 1.2 3.4 4.4 6.6 5-7 5-7
Credit Growth % – Other Personal -1.2 0.2 0.6 0.8 -0.8 0-2 0-2
GDP % 3.6 2.6 2.6 2.4 2.7 1.8 3.1
CPI % 2.3 2.3 2.7 1.7 1.4 1.8 1.9
Unemployment rate % 5.2 5.4 5.8 6.2 5.9 5.6 5.3
Cash Rate % 3½ 2¾ 2½ 2 1¾ 1½ 1½
New Zealand Credit Growth % – Total 2.7 4.2 4.5 6.1 7.7 6-8 5-7
Credit Growth % – Housing 1.8 5.2 5.3 5.6 8.8 7-9 5-7
Credit Growth % – Business 4.9 2.1 3.1 6.3 7.0 6-8 5-7
Credit Growth % – Agriculture 3.0 4.3 3.7 7.5 6.0 3-5 4-6
GDP % 2.8 2.3 3.0 3.3 2.7 3.3 3.7
CPI % 2.2 0.8 1.5 0.6 0.3 1.2 1.7
Unemployment rate % 6.1 6.2 5.5 5.4 5.2 4.8 4.5
Overnight Cash Rate % 2.5 2.5 3.25 3.25 2.25 1.75 1.75

51
2.6 2.62.4
2.7
1.8
3.1
201320142015201620172018
Additional
information
GDP % CPI% Unemployment Rate %
Cash Rate % Total Credit Growth % Housing Credit Growth %
2.3
2.7
1.71.4
1.8 1.9
2013 2014 2015 2016 2017 2018
5.4
5.8
6.2
5.9
5.6
5.3
2013 2014 2015 2016 2017 2018
2.752.50
2.001.75
1.50 1.50
2013 2014 2015 2016 2017 2018
3.10
5.00
5.906.20
6.75
2013 2014 2015 2016 2017 2018
4.75
6.75
4.60
6.40
7.30
6.70
5.00
2013 2014 2015 2015 2017 2018
7.00
4.75
7.00
5.00
Credit Growth = 12 months to June qtr
GDP, Unemployment & CPI = Financial year average
Cash Rate = As at end June qtr
= forecast
2.4
4.2
1.6
2.4
5.0
3.5
201320142015201620172018
Nominal GDPGDP
Key Economic Indicators (June FY)

521. Source: IMF
Global economic growth is set to firm a little
(annual % change) (GDP growth, annual % change)
Global Growth1 Advanced & Emerging Economies1
Global growth is running below
average but the pace of growth is
expected to pick up.
China and the rest of emerging Asia should
grow at a respectable rate. Advanced
economies are constrained by lower potential
growth rates.
-2
0
2
4
6
8
1966 1972 1978 1984 1990 1996 2002 2008 2014
Long-run
average
-5
0
5
10
1980 1990 2000 2010
Advanced
economies
Emerging market &
developing economies

531. Source: Bloomberg
2. Source: CEIC
(annual % change)
Australia EurozoneUK JapanUS Germany
(%) (%)
GDP1 Unemployment Rate2 10 Year Bond Yields
Australia is into its 25th year of
continuous economic growth
since the last recession
Unemployment
rates are trending lower
Financial markets remain
volatile
Australia remains well placed
-10
-6
-2
2
6
Mar 05 Mar 08 Mar 11 Mar 14
0
4
8
12
Jan 05Jan 07Jan 09Jan 11Jan 13Jan 15-1
0
1
2
3
Jan 16 Mar 16 Jun 16 Sep 16 Dec 16
"BREXIT"
"TRUMP"

541. Source: CBA
2. Source: ABS
Commodity prices have bottomed1 Drop in mining capex almost over
The drag on incomes from falling
commodity prices is complete, removing
a major risk from the outlook
The decline in mining capex is nearly over
and should be complete later in 2017 as
remaining LNG plants are completed
Australian growth headwinds easing
(CBA commodity price index)
0
4
8
12
16
Sep-00 Sep-04 Sep-08 Sep-12 Sep-16
Mining
Non-mining
(Business investment, % of GDP)
100
200
300
400
Sep 04 Sep 07 Sep 10 Sep 13 Sep 16
551. Source: ABS
2. Source: ABS / CBA
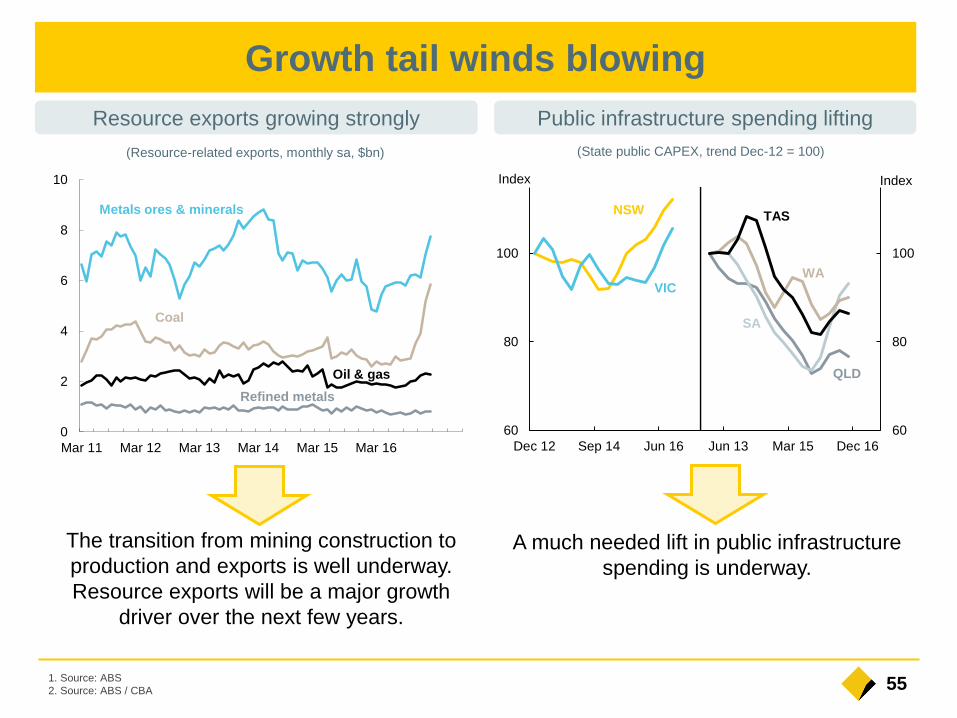
Growth tail winds blowing
Resource exports growing strongly Public infrastructure spending lifting
The transition from mining construction to
production and exports is well underway.
Resource exports will be a major growth
driver over the next few years.
A much needed lift in public infrastructure
spending is underway.
(Resource-related exports, monthly sa, $bn)
60
80
100
60
80
100
Dec 12 Sep 14 Jun 16 Jun 13 Mar 15 Dec 16
IndexIndex
(State public CAPEX, trend Dec-12 = 100)
NSW
VIC
QLD
WA
TAS
SA
0
2
4
6
8
10
Mar 11 Mar 12 Mar 13 Mar 14 Mar 15 Mar 16
Coal
Refined metals
Oil & gas
Metals ores & minerals

561. Source: ABS
2. Source: ABS / CBA
The Asian income boost continues Services trade is rising
Rising Asian incomes helps sectors like
tourism, education, agriculture and,
eventually, health and financial services.
Rising services trade is now a significant
growth driver.
0.0
0.5
1.0
1.5
Jan 02 Jan 05 Jan 08 Jan 11 Jan 14
China
New Zealand
(Short term overseas arrivals, rolling annual total millions)
UK
Japan
India
Europe ex UK
-1.0
-0.5
0.0
0.5
1.0
Sep 05 Sep 08 Sep 11 Sep 14
(Services trade, rolling annual contribution to GDP growth %)
Growth tail winds blowing

571. Source: ABS
Growth risks
Employment Non-mining capex1
Employment growth slowed in late 2016,
although leading indicators remain
encouraging. The skew toward part-time
jobs has contributed to higher
underemployment
Business remains reluctant to invest
despite encouraging fundamentals. A
reduction in policy uncertainty and some
adjustment to hurdle rates of return would
help.
0
100
200
300
400
Jan 15 Jul 15 Jan 16 Jul 16
Part-time
Full-time
Total
(change since Jan 15, ‘000) (% of GDP)
0
4
8
12
16
Sep 00 Sep 02 Sep 04 Sep 06 Sep 08 Sep 10 Sep 12 Sep 14 Sep 16

581. Source: ABS
(%)
Savings ratio Wage Price Index1
Wages growth remains subdued but the
growth rates appear to have bottomed.
A falling household saving rate has allowed
consumer spending to grow faster than
income. But the ability to cut savings further
is limited.
-5
0
5
10
15
20
Sep 72 Dec 80 Mar 89 Jun 97 Sep 05 Dec 13
(annual % change)
1
2
3
4
5
Sep 01 Sep 04 Sep 07 Sep 10 Sep 13 Sep 16
Growth risks

59
Housing fundamentals suggest slower growth ahead
(State population growth,
annual change ‘000)
Demand is slowing Supply is lifting
Population growth has slowed
as net migration eased. The
slowing is concentrated in WA
and Qld. Growth in NSW and
Vic remains robust.
Housing supply is now running
ahead of housing demand, any
backlog has now been met.
0
40
80
120
Sep 02 Sep 05 Sep 08 Sep 11 Sep 14
NSWVIC
QLD
WA
TAS
SA
0
40
80
120
Sep 79 Mar 87 Sep 94 Mar 02 Sep 09 Mar 17
(Dwelling supply,
new construction as a % of population growth)
Construction peaking
(dwelling construction,
rolling annual total ‘000)
The record residential
construction boom has lifted
employment and related parts of
retail like hardware, furnishings
and white goods. But leading
indicators have peaked.
100
150
200
Sep 86 Sep 95 Sep 04 Sep 13
Dwelling
commencements
Building
approvals

60
0
4
8
12
Jan 13 Jan 14 Jan 15 Jan 16 Jan 17
250
450
650
850
1050
Jan 06 Jan 08 Jan 10 Jan 12 Jan 14 Jan 16
1. Source: CoreLogic RP Data
2. Source: RBA
Dwelling price and credit growth trends are diverging
Dwelling prices1 Housing credit growth2
Dwelling price growth varies widely by region.
Momentum has lifted again recently
Affordability, regulatory and other issues are
driving divergent trends in housing credit
growth.
(Index)
Sydney
Melbourne
Perth
Brisbane
Regional
Adelaide
(Credit growth, annual % change)
Owner-occupier
housing
Investor
housing

611. Source: RBA
2. Source: ABS
Households have some protective buffers
Household Net Worth2
Household liabilities have increased in recent
years but household assets have grown at a
faster pace. Net worth has improved as a result
(% of GDP)
Household Debt & Deposits1
(% of annual household disposable income)
Household net debt has been stable – as low
interest rates allow pre-payments and growing
equity redraw balances. Households would be
vulnerable to a fall in asset values and/or a rise
in interest rates and unemployment.
0
40
80
120
160
200
Sep 88 Sep 92 Sep 96 Sep 00 Sep 04 Sep 08 Sep 12 Sep 16
Currency & deposits
Debt
Net debt
0
200
400
600
1988/89 1995/96 2002/03 2009/10 2016/17
Net
worth
Assets
Liabilities

62
Typical housing bubble factors not evident in Australia
Housing “Bubble” –
typical characteristicsCurrent position in Australia
Unsustainable asset prices Prices were supported by underbuilding in past years but demand
and supply are now more in balance.
Price growth has slowed in some areas but remains solid in others.
Strong lift in construction will dampen dwelling price growth
Residential rental yields easing as new supply rises
Speculative investment
artificially inflates asset prices
Investor interest is a rational response to low interest rates, rising
risk appetite and the pursuit of yield
Investor demand did slow after APRA’s regulatory changes
Strong volume growth driven
by relaxed lending standards
Minimal “low doc” lending
Mortgage insurance for higher LVR loans
Full recourse lending
Lift in rates for investors as a macroprudential policy response
Interaction of high debt levels
and interest rates
A high proportion of borrowers ahead of required repayment levels
Interest rate buffers built into loan serviceability tests at application
Housing credit growth remains modest and at the bottom end of the
range of the past three decades.
Domestic economic shock –
trigger for price correction
Respectable Australian economic growth outcomes
Unemployment rate has fallen and arrears rates are low

631. Source: GlobalDairyTrade
2. Source: Stats NZ
New Zealand
Global dairy trade auction results1 NZ short term arrivals2
Dairy prices recovered substantially in the
second half of 2016 as NZ and European
production fell. Farmers’ cashflows will lift
substantially in the second half of 2017.
Tourism (the other significant export earner)
continues to do very well through soaring
visitor numbers, though the firm NZD has
tempered per-person spend.
1,000
2,000
3,000
4,000
5,000
6,000
Jul 08 Mar 10 Nov 11 Jul 13 Mar 15 Nov 16
Whole Milk Powder
GDT overall price
(USD/tonne)
160
180
200
220
240
260
280
300
320
Jan 05 Sep 06 May 08 Jan 10 Sep 11 May 13 Jan 15 Sep 16
Lions tour
RWC CWC
(monthly, seasonally adjusted)

641. Source: Stats NZ / ASB
2. Source: ASB
New Zealand
NZ CPI inflation1 OCR forecasts2
At the end of 2016 inflation lifted back into
the 1-3% target band for the first time in
over 2 years. Inflation will edge closer to
2% over the next year.
The RBNZ cut the Official Cash Rate to a
low of 1.75% by the end of 2016. We
expect the RBNZ to remain on hold for an
extended period.
-1
0
1
2
3
4
5
6
Jun 00 Jun 03 Jun 06 Jun 09 Jun 12 Jun 15
(f)
Annual %
quarterly change
%
1.5
2.0
2.5
3.0
3.5
4.0
Sep 13 Jun 14 Mar 15 Dec 15 Sep 16 Jun 17 Mar 18 Dec 18
OCR implied by
current market
pricing
ASB Economics Forecast
(peak of 3.5% in 2020)
(ASB forecast and implied market pricing, %)

65
New Zealand
1. Source: RBNZ / ASB
2. Source: REINZ
NZ household lending growth1 NZ median house price2
Home lending accelerated over 2016. The
RBNZ introduced nationwide loan
restrictions on residential property, which
have cooled the housing market. Credit
growth will slow over 2017 in line with more
modest house price growth.
House price growth will slow over 2017.
Construction is catching up to demand
(outside Auckland). Lending restrictions are
impacting. But the housing market is still
being supported by strong net migration
inflows and interest rates that are still low.
-10
-5
0
5
10
15
20
Jan 94 Jan 98 Jan 02 Jan 06 Jan 10 Jan 14
Mortgage lending
Consumer Credit
(annual % change)
200
300
400
500
600
700
800
900
Jan 05 Jan 07 Jan 09 Jan 11 Jan 13 Jan 15 Jan 17
Auckland
Wellington
Canterbury/Westland
NZ
(3 month moving average, $’000)

66
1 Roy Morgan Research Retail Main Financial Institution (MFI) Customer Satisfaction. Australian population 14+, % “Very Satisfied” or “Fairly
Satisfied” with relationship with that MFI. 6 month rolling average to December 2016. Peers includes ANZ, NAB and Westpac. CBA excludes
Bankwest. Rankings are based on outright score and are not significance tested (Slides 5 & 31)
2 Customer Needs Met / Products per Customer – Roy Morgan Research. Australian Population 18+, Banking and Finance products per Banking
and Finance customer at main financial institution. 6 month rolling average to December 2016. CBA excludes Bankwest. Rank based on
comparison to ANZ, NAB and Westpac. Wealth includes Superannuation, Insurance and Managed Investments. Share of product is calculated by
dividing Products held at CBA by Products held anywhere. “Internet Banking” refers to CBA customers who conducted internet banking in the last 4
weeks. Note: Individual products may not add up to the overall totals due to rounding. (Slide 9)
3 Roy Morgan Research, Australians 14+, Proportion of Banking and Finance MFI Customers that nominated each bank as their Main Financial
Institution (MFI Share), 12 month average to December 2016. Peers includes ANZ, NAB and Westpac (incl. St George Group). CBA includes
Bankwest. “Internet Banking” refers to customers who conducted internet banking via app and website anywhere in the last 4 weeks. (Slide 6 & 31)
4 DBM Business Financial Services Monitor (December 2016), average satisfaction rating of business customers’ Main Financial Institution (MFI),
across all Australian businesses, using an 11 pt scale where 0 is Extremely Dissatisfied and 10 is Extremely Satisfied, 6 month rolling average.
Rankings are based on DBM significance testing (Slides 5 & 31)
5 DBM Business Financial Services Monitor. Micro businesses are defined as those with annual turnover up to $1 million, Small businesses are
those with annual turnover of $1 million to less than $5 million, Medium businesses are those with annual turnover of $5 million to less than $50
million, Large businesses are those with annual turnover of $50m to less than $500m, and IB&M businesses are those with annual turnover of $100
million or more. All charts use a 6 month rolling average. Rankings are based on DBM significance testing (Slide 5 & 31)
6 Wealth Insights platform service and overall satisfaction score - Ranking of Colonial First State (the platform provider) is calculated based on the
weighted average (using Strategic Insight FUA – formerly Plan for Life) of the overall adviser satisfaction scores of FirstChoice and FirstWrap
compared with the weighted average of other platform providers in the relevant peer set. The relevant peer set includes platforms belonging to
Westpac, NAB, ANZ, AMP and Macquarie in the Wealth Insights survey. This measure is updated annually in April. (Slide 5)
7 PT Bank Commonwealth in Indonesia rated number one among foreign banks for customer service as measured by MRI (one of the leading
industry Standards for Customer Service Excellence). (Slide 5)
8 Proportion of Banking & Finance customers’ Wealth products captured by the financial institution. Roy Morgan Research. Australian Population
18+ , 6 month average to December 2016. Calculated by dividing Wealth products held at institution by products held anywhere. Wealth Products
includes Total Insurance (excl. Private Health), Managed Investments and Superannuation. CBA excludes Bankwest. (Slide 9)
9 Roy Morgan Research. Australian population 14+. Proportion of customers who conducted internet banking via website or app with their Main
Financial Institution in the last 4 weeks, who are either “Very Satisfied” or “Fairly Satisfied” with the service provided by that institution. 6 month
average to December 2016. Rank based on comparison to ANZ, NAB and Westpac. (Slides 5, 30 & 31)
Customer Metrics

67
Apple, the Apple logo, iPhone and iPad are trademarks of Apple Inc., registered in the U.S. and other countries. App Store is a service mark of Apple Inc.
Technology MetricsSources for ‘More satisfied customers – internet’ (slide 30)
1 Free financial app: CommBank app on iOS and Android in Australia. Sources are the Apple App Store and the Google Play Store.
2 Online banking: CBA won Canstar's Bank of the Year – Online Banking award for 2016 (for the 7th year in a row). Awarded May 2016.
3 Customer satisfaction – internet banking services: Roy Morgan Research. Australian population 14+. Proportion of customers who conducted
internet banking via website or app with their Main Financial Institution in the last 4 weeks, who are either “Very Satisfied” or “Fairly Satisfied”
with the service provided by that institution. Rank based on comparison to ANZ, NAB and Westpac. CBA held the number one position for
Overall Satisfaction the entire financial year 2016.
4 Social media: CBA’s combined following across its main Facebook, Linkedin, Twitter and Instagram sites is the largest of the main Australian
banks (subsidiary and associated pages not included in count). In addition, global independent website The Financial Brand rates the social
media presence of banks and credit unions globally. For the second quarter of 2016, CBA is the #1 Australian bank on their list:
http://thefinancialbrand.com/59589/power-100-2016-q2-bank-rankings/.
5 Finder awarded CBA the Best Internet Banking award for the NetBank platform. Awarded November 2016. https://www.finder.com.au/2016-
finder-innovation-awards-best-internet-banking
6 Finder awarded CBA the Gold Innovation award for NetBank. Awarded November 2016. https://www.finder.com.au/2016-finder-innovation-
awards-best-internet-banking
7 CommSec awarded Money Magazine’s Best Feature-Packed Online Broker 10 years running. Source: http://moneymag.com.au/best2017/.
Awarded January 2017.
8 Australian Banking and Finance magazine awarded CBA the Innovative Card & Payment Product of the year for Mobile Wallet. Awarded June
2016.
9 Mobile banking: CBA won Canstar’s Bank of the Year - Mobile Banking award for 2016. Awarded May 2016.

68
Funding & Risk
Liquidity coverage
ratio (LCR)
The LCR is the first quantitative liquidity measure that is part of the
Basel III reforms. It was implemented by APRA in Australia on 1 Jan
2015. It requires Australian ADI’s to hold sufficient liquid assets to
meet 30 day net cash outflows projected under an APRA-prescribed
stress scenario.
High quality liquid
assets (HQLA)
As defined by APRA in Australian Prudential Standard APS210:
Liquidity. Qualifying HQLA includes cash, Govt and Semi Govt
securities, and RBNZ eligible securities. The Exchange Settlement
Account (ESA) balance is netted down by the Reserve Bank of
Australia open-repo of internal RMBS.
Committed liquidity
facility (CLF)
The Reserve Bank of Australia (RBA) provides the CLF to
participating ADIs under the LCR as a shortfall in Commonwealth
government and Semi-government securities exists in Australia. ADIs
can draw under the CLF in a liquidity crisis against qualifying
securities pledged to the RBA. The amount of the CLF for each ADI is
set by APRA annually.
Net Stable Funding
Ratio
The NSFR is the second quantitative measure of the Basel III
reforms, in addition to the LCR. It is scheduled to be implemented by
APRA in Australia on 1 Jan 2018. It will require Australian ADIs to
fund their assets with sufficient stable funding to reduce funding risk
over a one year horizon. APRA prescribed factors are used to
determine the stable funding requirement of assets and the stability of
funding
TIA Corporate Troublesome and (Group) Impaired assets.
Corporate
Troublesome
Corporate Troublesome includes exposures where customers are
experiencing financial difficulties which, if they persist, could result in
losses of principal or interest, and exposures where repayments are
90 days or more past due and the value of security is sufficient to
recover all amounts due.
Total Committed
Exposure (TCE)
Total Committed Exposure is defined as the balance outstanding and
undrawn components of committed facility limits. It is calculated
before collateralisation and excludes settlement exposures.
Credit Risk
Estimates (CRE)
Refers to the Group’s regulatory estimates of long-run Probability of
Default (PD), downturn Loss Given Default (LGD) and Exposure at
Default (EAD).
Capital & Other
Risk Weighted
Assets or RWA
The value of the Group’s On and Off Balance Sheet
assets are adjusted by risk weights calculated according
to various APRA prudential standards. For more
information, refer to the APRA website.
CET1 Expected
Loss (EL)
Adjustment
CET1 adjustment that represents the shortfall between
the calculated regulatory expected loss and eligible
provisions with respect to credit portfolios which are
subject to the Basel advanced capital IRB approach. The
adjustment is assessed separately for both defaulted and
non-defaulted exposures. Where there is an excess of
regulatory expected loss over eligible provisions in either
assessments, the difference must be deducted from
CET1. For non-defaulted exposures where the EL is
lower than the eligible provisions, this may be included in
Tier 2 capital up to a maximum of 0.6% of total credit
RWAs.
Leverage Ratio Tier 1 Capital divided by Total Exposures, with this ratio
expressed as a percentage. Total exposures is the sum
of On Balance Sheet items, derivatives, securities
financing transactions (SFTs), and Off Balance Sheet
items, net of any Tier 1 regulatory deductions that are
already included in these items.
Internationally
comparable capital
The Internationally Comparable CET1 ratio is an
estimate of the Group’s CET1 ratio calculated using rules
comparable with our global peers. The analysis aligns
with the APRA study entitled “International capital
comparison study” (13 July 2015).
Credit value
adjustment (CVA)
Valuation adjustment to reflect the market view of
counterparty credit risk on over the counter (OTC)
derivatives.
Funding valuation
adjustment (FVA)
The expected funding cost or benefit over the life of the
uncollateralised derivative portfolio.
Glossary
