debt overhang and secular stagnation - institute for … overhang and secular stagnation adair...
TRANSCRIPT

Debt Overhang and Secular
Stagnation
Adair TurnerSenior Fellow
Institute for New Economic Thinking
Cass Business School London, 25th March 2015
www.ineteconomics.org
300 Park Avenue South, New York, NY 10010 | 22 Park Street, London W1K 2JB

IMF Medium term growth projections
1
0
2
4
6
Advanced Economies Emerging Market &developing countries
World
Fall 2011 Spring 2012 Fall 2012 Spring 2013 Fall 2013 Spring 2014
Source: IMF World Economic Outlook, October 2014

US Payroll employment monthly increasesDecember 20112 – December 2014
2
0
50
100
150
200
250
300
350
400
20
12
-01
20
12
-02
20
12
-03
20
12
-04
20
12
-05
20
12
-06
20
12
-07
20
12
-08
20
12
-09
20
12
-10
201
2-1
1
20
12
-12
20
13
-01
20
13
-02
20
13
-03
20
13
-04
20
13
-05
20
13
-06
20
13
-07
20
13
-08
20
13
-09
201
3-1
0
20
13
-11
20
13
-12
20
14
-01
20
14
-02
20
14
-03
20
14
-04
20
14
-05
20
14
-06
20
14
-07
20
14
-08
201
4-0
9
20
14
-10
20
14
-11
20
14
-12
Source: US Bureau of Labor Statistics
%
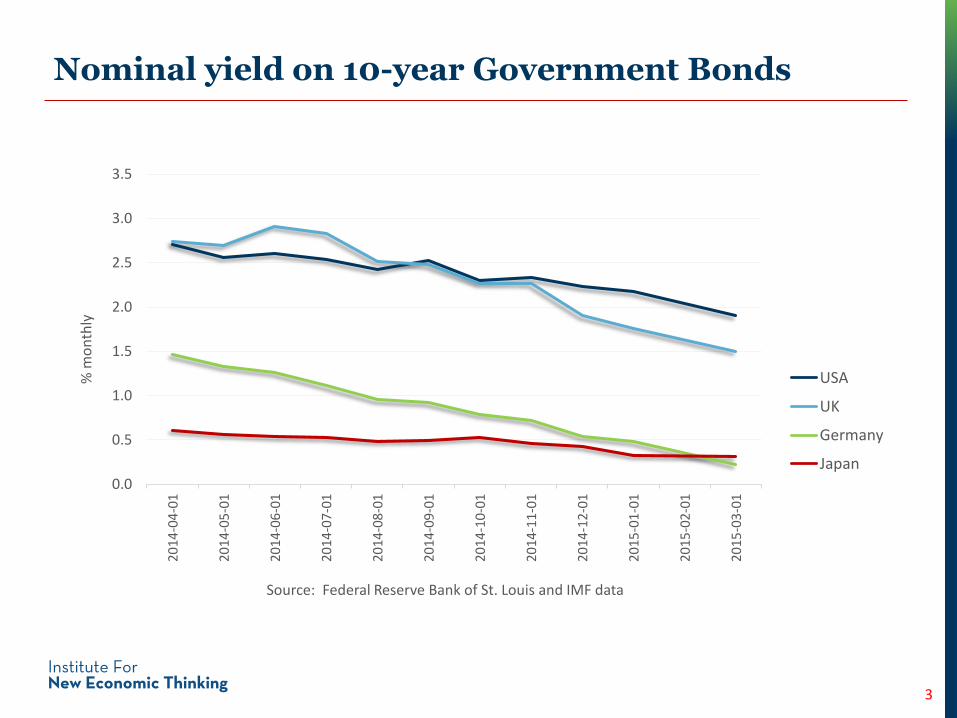
Nominal yield on 10-year Government Bonds
3
0.0
0.5
1.0
1.5
2.0
2.5
3.0
3.520
14-0
4-0
1
2014
-05
-01
201
4-0
6-0
1
2014
-07
-01
2014
-08
-01
2014
-09
-01
2014
-10
-01
2014
-11
-01
2014
-12
-01
2015
-01
-01
2015
-02
-01
2015
-03
-01
USA
UK
Germany
Japan
% m
on
thly
Source: Federal Reserve Bank of St. Louis and IMF data

Consensus commentary still fails to reflect how deep
are the deflationary pressures created by
Debt overhang and deleveraging
Long-term secular trends
4

Private domestic credit as a % of GDP
5
Source: Financial and Sovereign Debt Crises: Some Lessons Learned and Those Forgotten, C. Reinhart & K. Rogoff, 2013
Advanced economies 1950 – 2011

Share of real estate lending in total bank lending
6
Source: The Great Mortgaging, Professor Alan Taylor, University of California, Davis
Ra
tio
of re
al e
sta
te le
nd
ing
to
to
tal le
nd
ing
0
0.1
0.2
0.3
0.4
0.5
0.6
0.71880
1890
1900
1910
1920
1930
1940
1950
1960
1970
1980
1990
2000
2010
10%
20%
30%
40%
50%
60%
70%
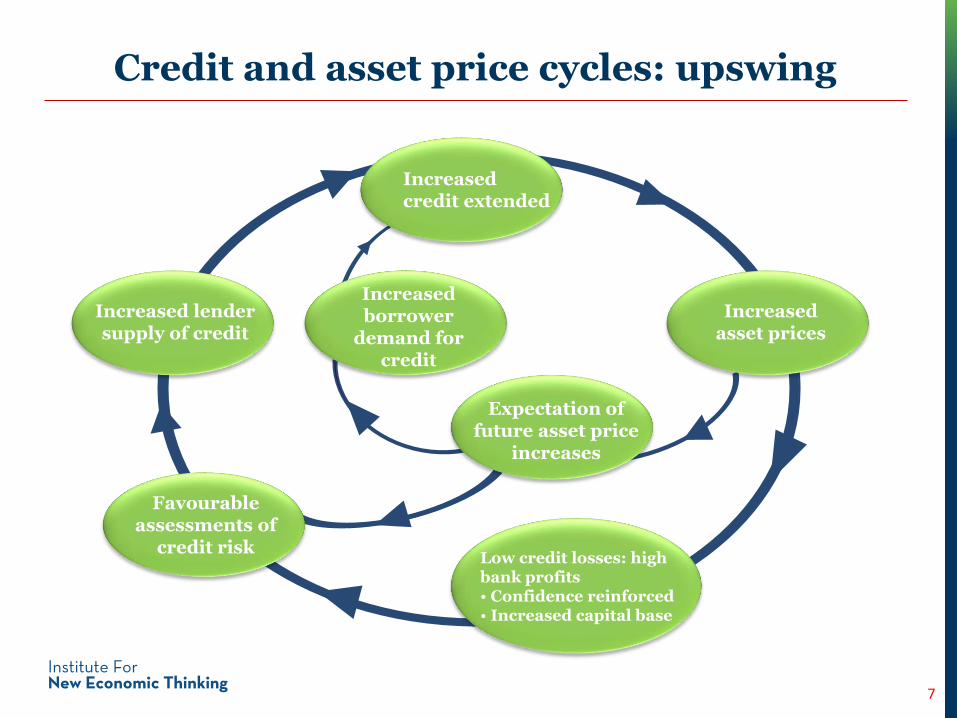
Credit and asset price cycles: upswing
7
Expectation of future asset price
increases
Increased credit extended
Low credit losses: high bank profits• Confidence reinforced • Increased capital base
Increased asset prices
Increased lender supply of credit
Favourable assessments of
credit risk
Increased borrower
demand for credit

Credit extension and house prices
House prices 2000 – 2007 Household debt as a % of GDP 2000 – 2007
Source: BEA; ONS; ECB
0
20
40
60
80
100
120
Q1 2000 Q1 2001 Q1 2002 Q1 2003 Q1 2004 Q1 2005 Q1 2006 Q1 2007%
GD
P
US UK Spain Ireland
0
50
100
150
200
250
Q1 2000 Q1 2001 Q1 2002 Q1 2003 Q1 2004 Q1 2005 Q1 2006 Q1 2007
Index:
2000 =
100
Spain US UK Ireland
Source: Ministry of Housing (Spain), S&P (US), DCLG
8

Credit and asset price cycles: downswing
9
Expectation of future asset price
falls
Less credit extended
High credit losses: low bank profits• Confidence dented• Reduced capital base
Falling asset prices
Restricted lender supply of credit
Cautious assessments of
credit risk
Reduced borrower
demand for credit
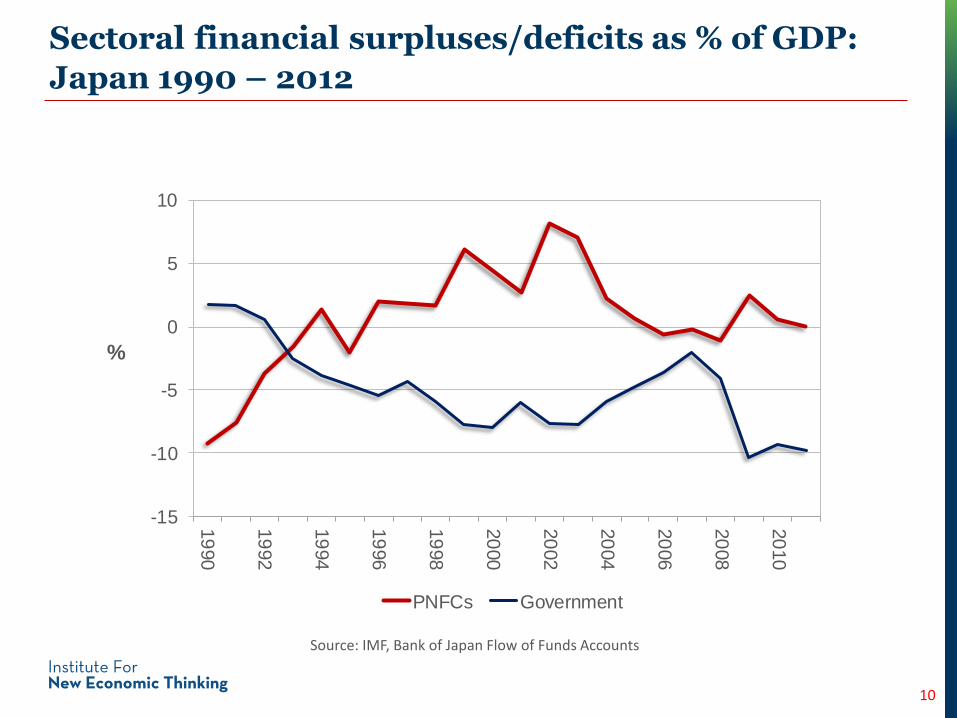
Sectoral financial surpluses/deficits as % of GDP:
Japan 1990 – 2012
10
Source: IMF, Bank of Japan Flow of Funds Accounts
-15
-10
-5
0
5
10
19
90
19
92
19
94
19
96
19
98
20
00
20
02
20
04
20
06
20
08
20
10
PNFCs Government
%
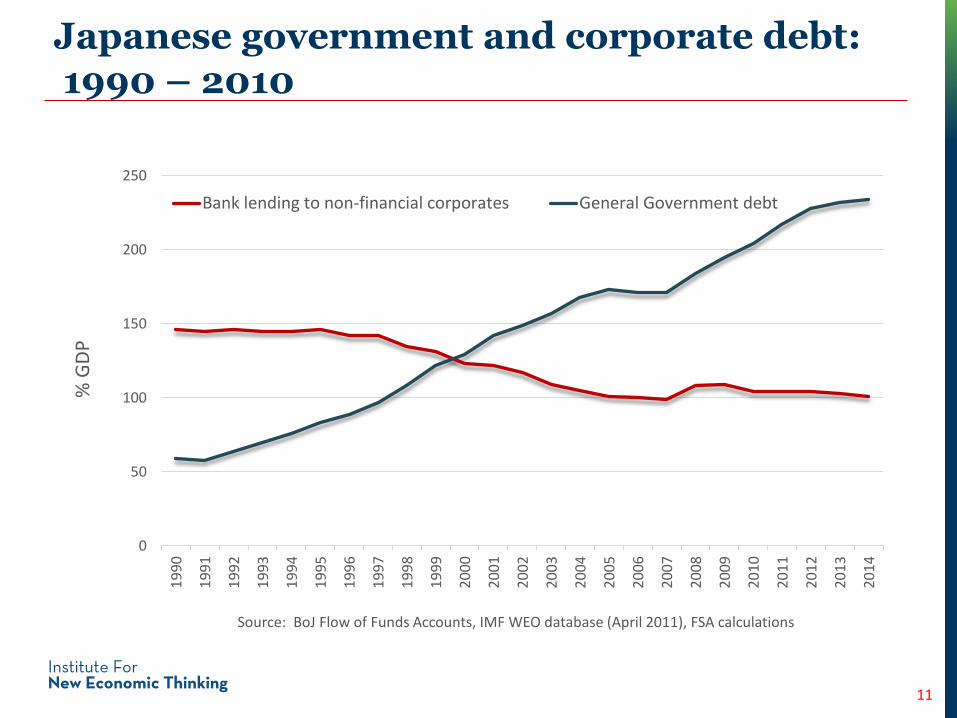
Japanese government and corporate debt:1990 – 2010
0
50
100
150
200
2501
99
0
19
91
19
92
19
93
19
94
19
95
19
96
19
97
19
98
19
99
20
00
20
01
20
02
20
03
20
04
20
05
20
06
20
07
20
08
20
09
20
10
20
11
20
12
20
13
20
14
Bank lending to non-financial corporates General Government debt
11
Source: BoJ Flow of Funds Accounts, IMF WEO database (April 2011), FSA calculations
% G
DP

Shifting leverage: Private and public debt-to-GDP
12 12

50
65
80
95
110
200
4
200
5
200
6
200
7
200
8
200
9
201
0
201
1
201
2
201
3
Household Non-financial Corp Public
% G
DP
Source: Geneva Report No 16 Deleveraging, What Deleveraging? ICMB / CEPR September 2014
Developed economies – Debt to GDP
13
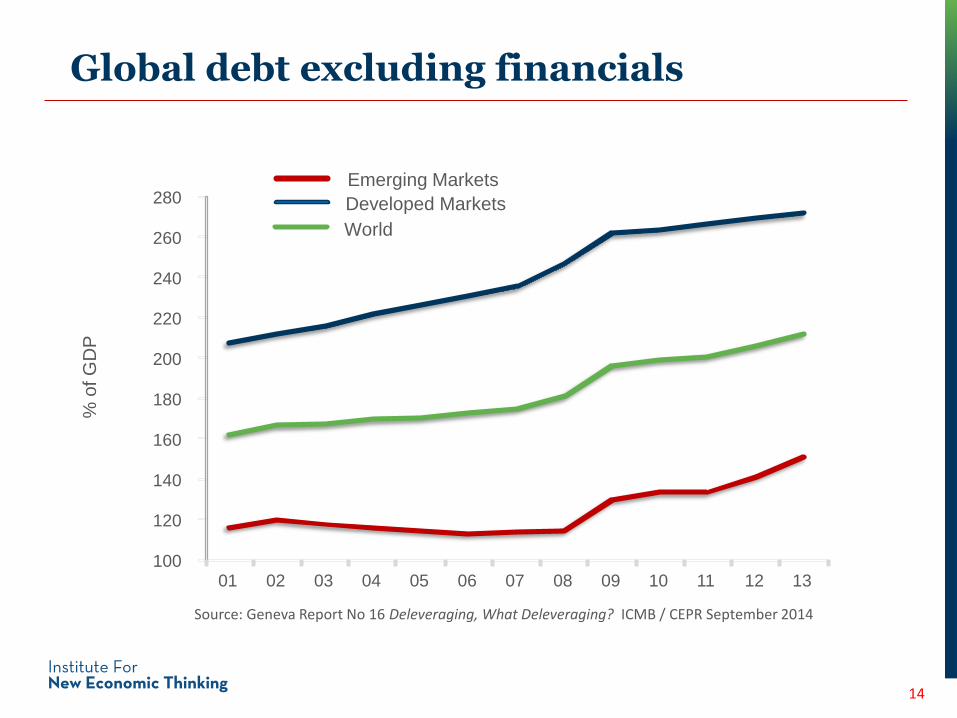
Global debt excluding financials
Source: Geneva Report No 16 Deleveraging, What Deleveraging? ICMB / CEPR September 2014
100
120
140
160
180
200
220
240
260
280
01 02 03 04 05 06 07 08 09 10 11 12 13
Developed Markets
Emerging Markets
World
% o
f G
DP
14

Emerging markets: total debt as % of GDP(excluding financial sector debt)
15
60
80
100
120
140
160
180
200
220
240
1 2 3 4 5 6 7 8 9 10 11 12 13
Series1 Series2 Series3 Series4 Series5
2001 2002 2003 2004 2005 2006 2007 2008 2009 2010 2011 2012 2013
ChinaChina
TurkeyBrazilIndia Emerging Markets
Source: Deleveraging, What deleveraging, The Geneva Report, 2014

China: debt as % of GDP
16
42 55
20
38
72
12524
65
2007 2014 Q2
Financial institutions
Non-Financial corporations
Households
Government
Source: McKinsey Global Institute
Total debt ($tr) 7.4 28.2
158
282

China’s debt exposure to property
17
Source: McKinsey Global Institute
$ trillion
Household Real estate Real estaterelated
Government Total exposureto property
As % of total non-financial debt 8 10-15 10-15 10 40-45
1.8
2.5-3
2-2.5
2.2 8.5-9.5
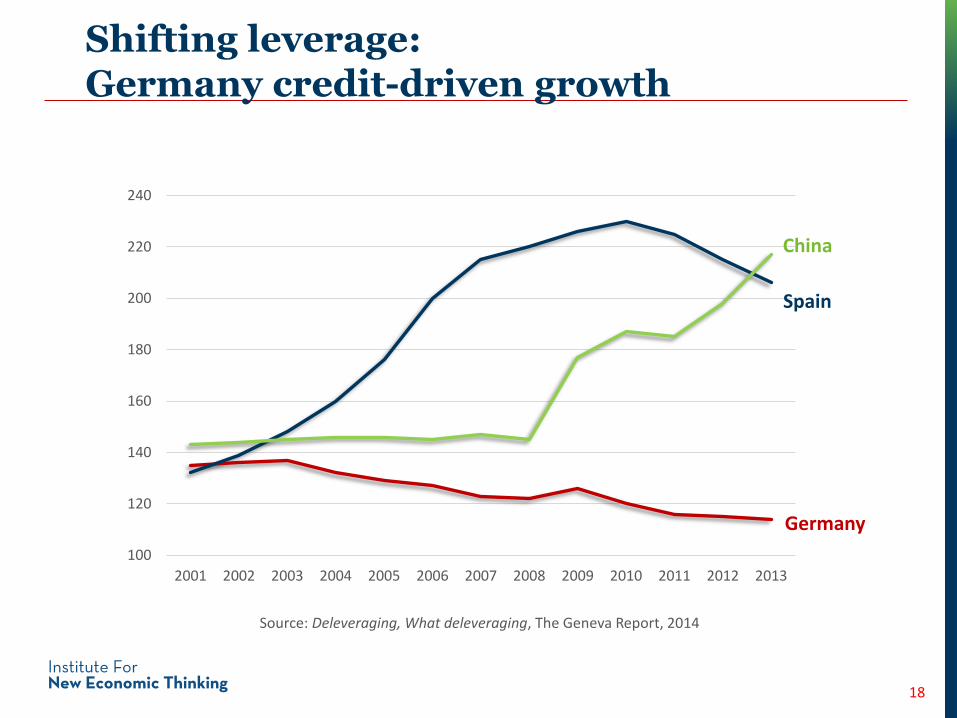
Shifting leverage: Germany credit-driven growth
18
Source: Deleveraging, What deleveraging, The Geneva Report, 2014
100
120
140
160
180
200
220
240
2001 2002 2003 2004 2005 2006 2007 2008 2009 2010 2011 2012 2013
Spain
China
Germany

General Government primary deficit
19
Eurozone
Japan
UK
US 7.2
6
7.8
1.6
Japan
Eurozone
Source: International Monetary Fund Fiscal Monitor, October 2014
% of GDP, average 2008- 2013

-6
-5
-4
-3
-2
-1
0
1
2
3
4
2008 2009 2010 2011 2012 2013
Net Exports as % of GDP
UK
USA
Japan
Eurozone
70
80
90
100
110
120
130
2008 2009 2010 2011 2012 2013 2014
Nominal GDP, 2008=100UK
USA
Japan
Eurozone
Sources: (IMF WEO, WB WDI)
70
80
90
100
110
120
130
2008 2009 2010 2011 2012 2013
UK
USA
Japan
Eurozone
Domestic Demand (GDP - Net Exports) 2008=100
20
Nominal demand growth 2008 – 2014

21
Raising actual and potential growth must remain a priority.
In advanced economies, this will require continued support
from monetary policy
The extended period of monetary accommodation and the
accompanying search for yields are leading to credit mispricing and asset
price pressures, and increasing the chance that financial stability risks
could derail the recovery.
IMFGlobal Financial Stability Review
October 2014
IMF World Economic Outlook October 2014

Shifting leverage: back to private again
22
UK Public net debt as % of GDP: 2009 - 2019
40
45
50
55
60
65
70
75
80
85
2009
2010
2011
2012
2013
2014
2015
2016
2017
2018
2019
UK Household gross debt as % of income: 2009 - 2020
% P
erce
nt
140
145
150
155
160
165
170
175
180
185
20
09
Q1
20
10
Q1
20
11
Q1
20
12
Q1
20
13
Q1
20
14
Q1
20
15
Q1
20
16
Q1
20
17
Q1
20
18
Q1
20
19
Q1
20
20
Q1
Source: Office of Budget Responsibility, Economic and Fiscal Outlook, December 2014
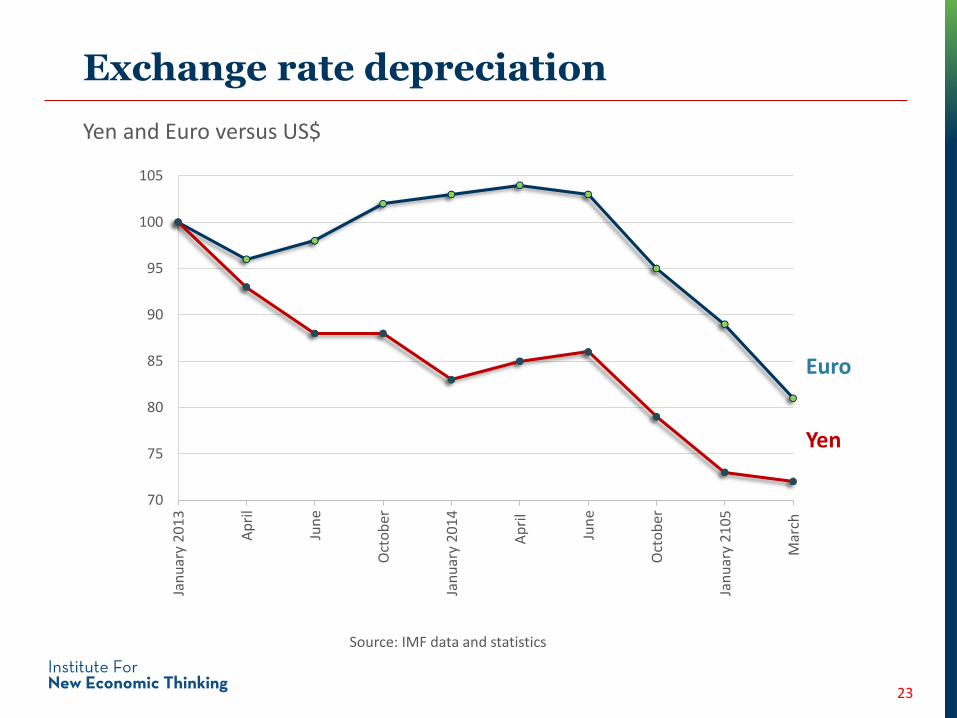
Exchange rate depreciation
23
70
75
80
85
90
95
100
105Ja
nu
ary
201
3
Ap
ril
Jun
e
Oct
ob
er
Jan
uar
y 20
14
Ap
ril
Jun
e
Oct
ob
er
Jan
uar
y 21
05
Mar
ch
Euro
Yen
Yen and Euro versus US$
Source: IMF data and statistics
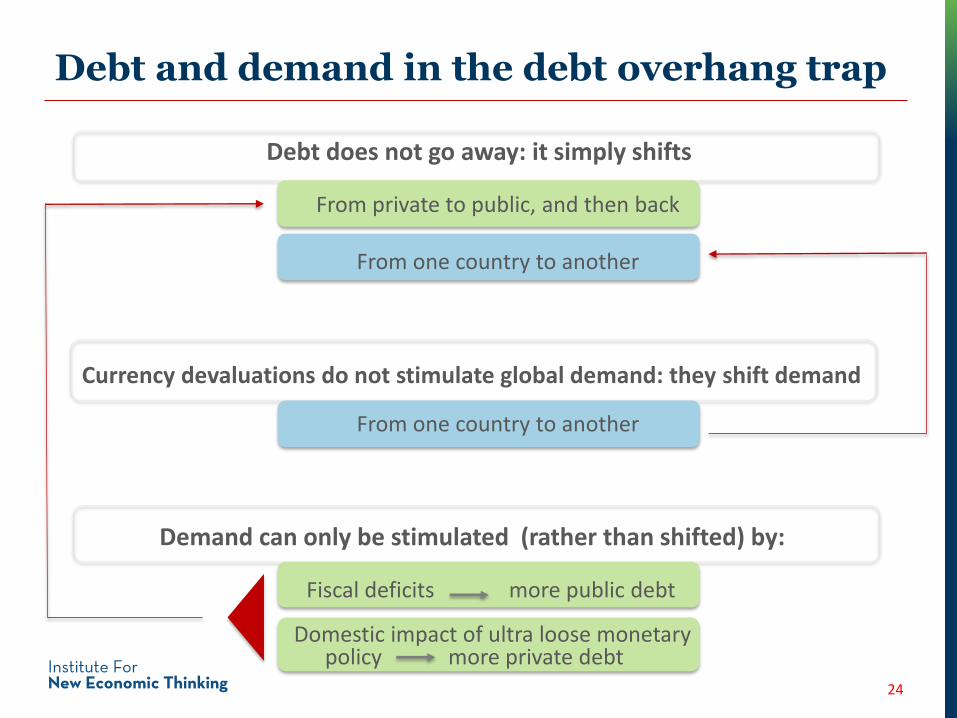
Debt and demand in the debt overhang trap
24
Domestic impact of ultra loose monetary policy more private debt
Debt does not go away: it simply shifts
Currency devaluations do not stimulate global demand: they shift demand
Demand can only be stimulated (rather than shifted) by:
From one country to another
Fiscal deficits more public debt
From private to public, and then back
From one country to another

Global debt excluding financials
Source: Geneva Report No 16 Deleveraging, What Deleveraging? ICMB / CEPR September 2014
100
120
140
160
180
200
220
240
260
280
01 02 03 04 05 06 07 08 09 10 11 12 13
Developed Markets
Emerging Markets
World
% o
f G
DP
25
26
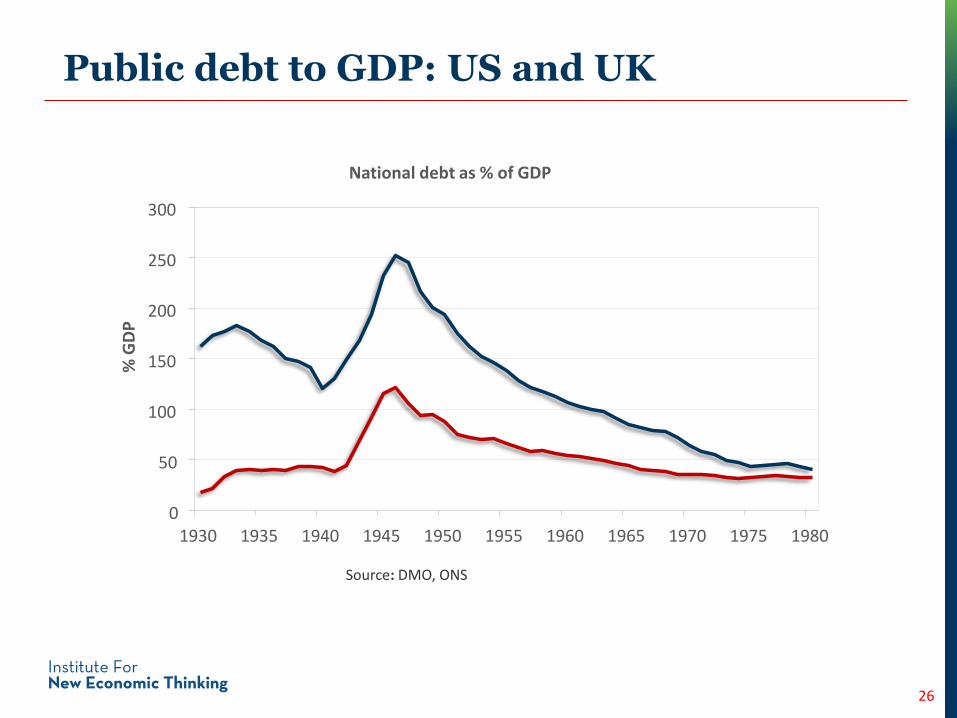
Public debt to GDP: US and UK
Source: DMO, ONS
National debt as % of GDP
0
50
100
150
200
250
300
1930 1935 1940 1945 1950 1955 1960 1965 1970 1975 1980
% G
DP

Ensuring long-term Japan debt sustainability: IMF scenarios
27
Required cyclical changes in adjusted primary balance% of GDP
2010 2014 2020
Continuous surplus thereafter to reach
• 80% net debt• 200% gross debt
by 2030October 2014Fiscal Monitor
- 6.5 + 6.4
- 6.0 + 5.6
November 2010Fiscal Monitor
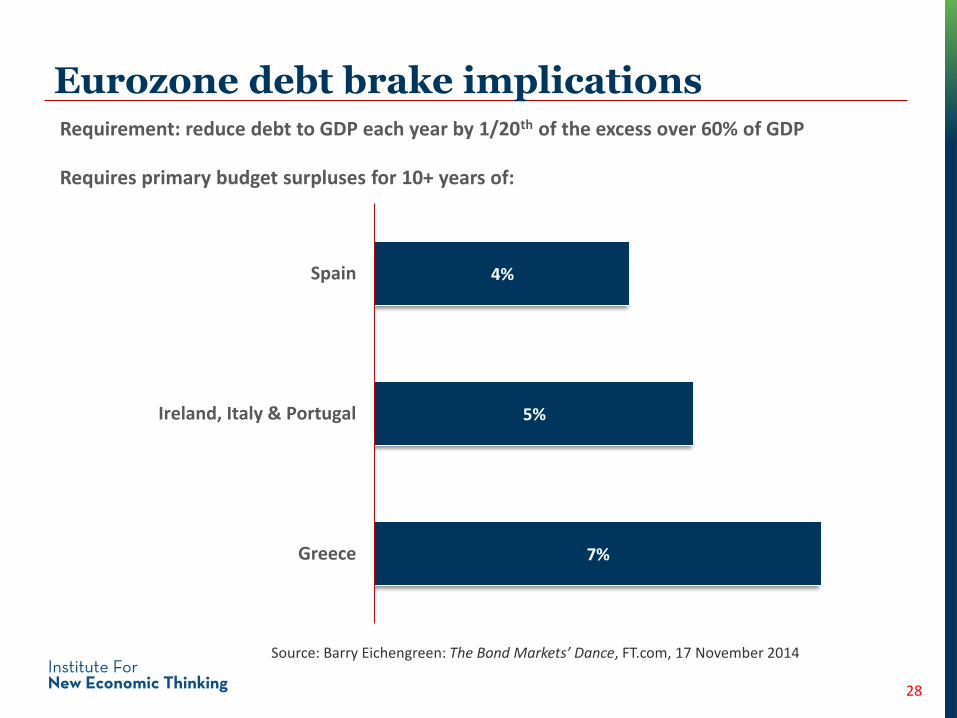
7%
5%
4%
Greece
Ireland, Italy & Portugal
Spain
28
Eurozone debt brake implications
Source: Barry Eichengreen: The Bond Markets’ Dance, FT.com, 17 November 2014
Requirement: reduce debt to GDP each year by 1/20th of the excess over 60% of GDP
Requires primary budget surpluses for 10+ years of:

Debt overhang: the unavoidable choice
29
Debt
Debt write-off,
default, restructuring
Debt erosion
via inflation, monetisation
Sustained slow
growth and low deflation
Stimulating yet
more credit
Debt overhang and deleveraging
Long-term secular trends
30
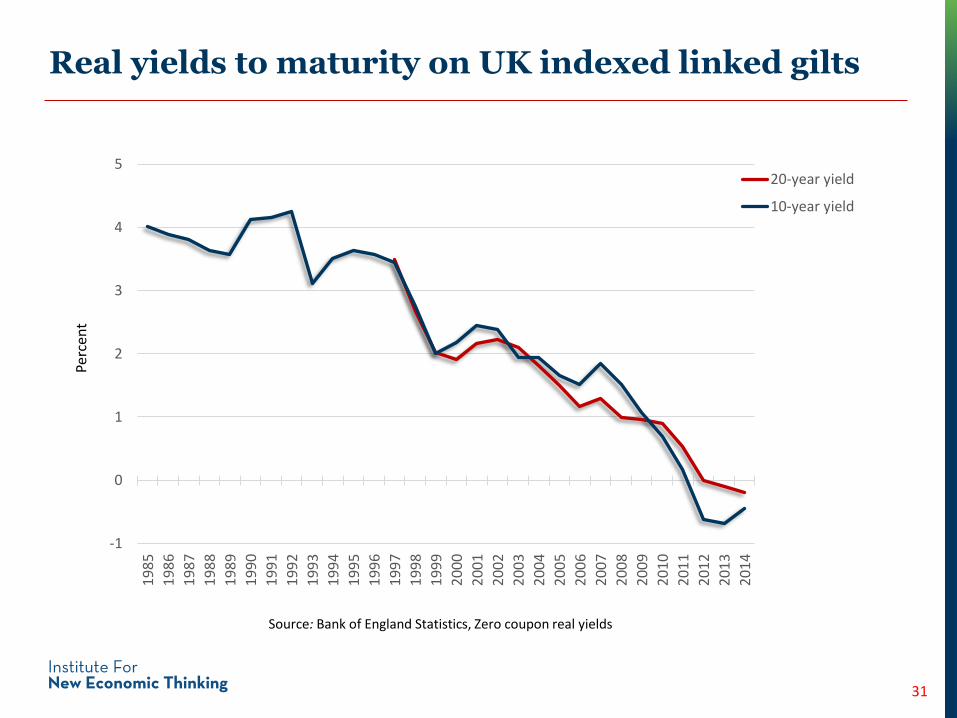
Real yields to maturity on UK indexed linked gilts
Source: Bank of England Statistics, Zero coupon real yields
31
Perc
ent
-1
0
1
2
3
4
51
98
5
19
86
19
87
19
88
19
89
19
90
19
91
19
92
19
93
19
94
19
95
19
96
19
97
19
98
19
99
20
00
20
01
20
02
20
03
20
04
20
05
20
06
20
07
20
08
20
09
20
10
20
11
20
12
20
13
20
14
20-year yield
10-year yield

Why did real rates fall so much even before the crisis?
32
Reduced investment needs?• In plant and machinery?
Ex-ante savings Ex-ante investment
Global imbalances?
Inequality?
Demographic effects?
• In advanced economy property and infrastructure?
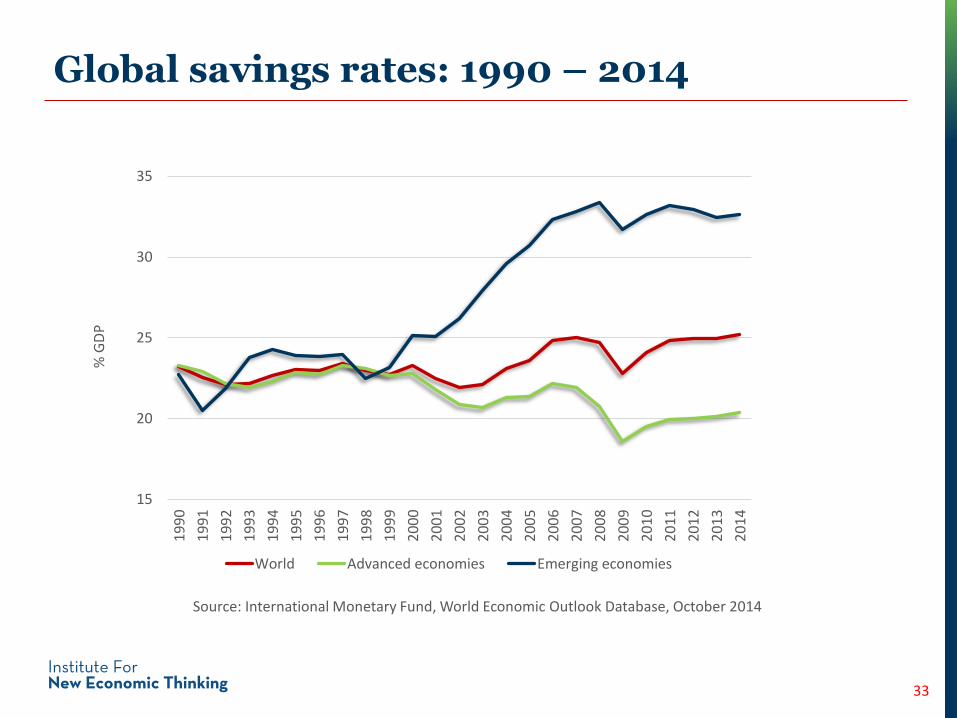
Global savings rates: 1990 – 2014
33
15
20
25
30
351
99
0
19
91
19
92
19
93
19
94
19
95
19
96
19
97
19
98
19
99
20
00
20
01
20
02
20
03
20
04
20
05
20
06
20
07
20
08
20
09
20
10
20
11
20
12
20
13
20
14
World Advanced economies Emerging economies
Source: International Monetary Fund, World Economic Outlook Database, October 2014
% G
DP
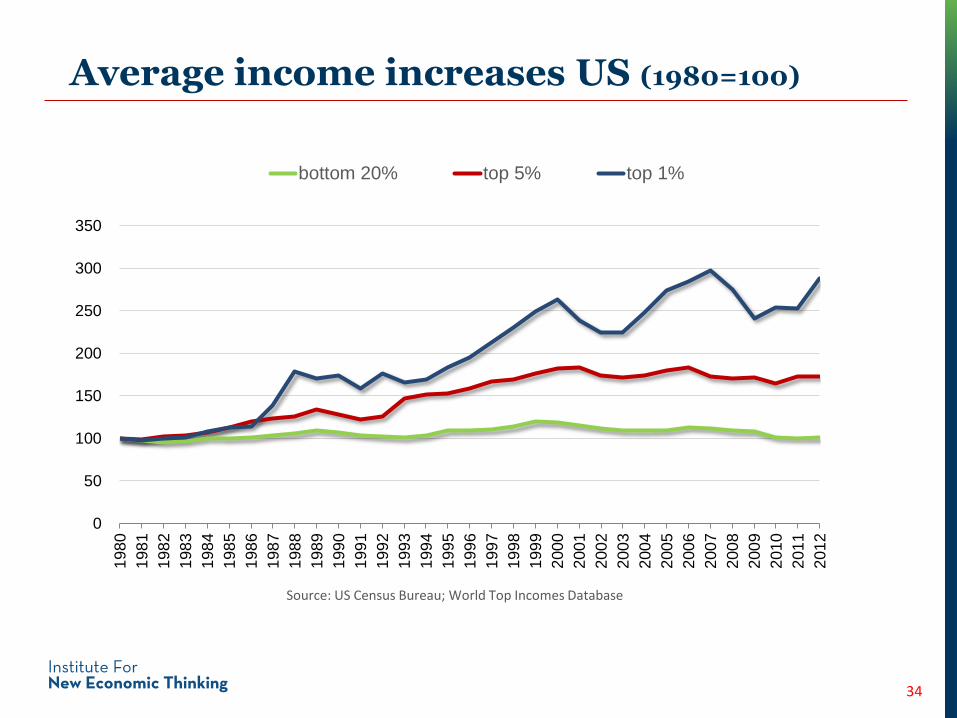
Average income increases US (1980=100)
0
50
100
150
200
250
300
350
198
0
198
1
198
2
198
3
198
4
198
5
198
6
198
7
198
8
198
9
199
0
199
1
199
2
199
3
199
4
199
5
199
6
199
7
199
8
199
9
200
0
200
1
200
2
200
3
200
4
200
5
200
6
200
7
200
8
200
9
201
0
201
1
201
2
bottom 20% top 5% top 1%
S
Source: US Census Bureau; World Top Incomes Database
34

Why did real rates fall so much even before the crisis?
35
Reduced investment needs?• In plant and machinery?
Ex-ante savings Ex-ante investment
Global imbalances?
Inequality?
Demographic effects?
• In advanced economy property and infrastructure?
Advanced economy investment as % of GDP
36
15
20
251
99
0
19
92
19
94
19
96
19
98
20
00
20
01
20
04
20
06
20
08
20
10
20
12
20
14
% o
f G
DP
Source: International Monetary Fund, World Economic Outlook Database
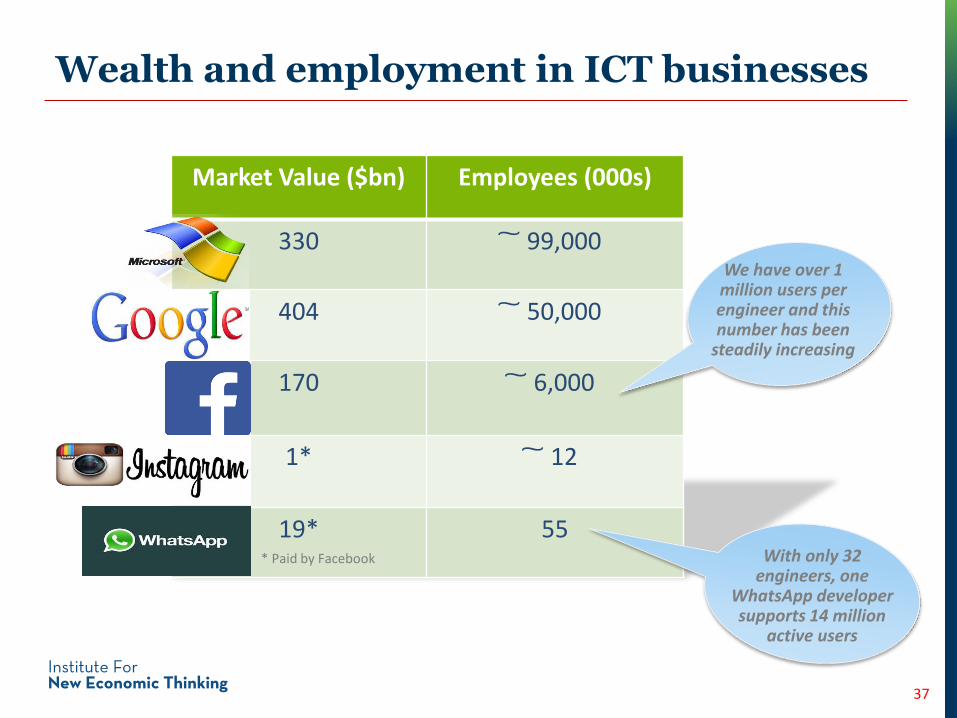
Wealth and employment in ICT businesses
Market Value ($bn) Employees (000s)
330 99,000
404 50,000
170 6,000
1* 12
19* 55
37
We have over 1 million users per engineer and this number has been
steadily increasing
* Paid by Facebook With only 32 engineers, one
WhatsApp developer supports 14 million
active users
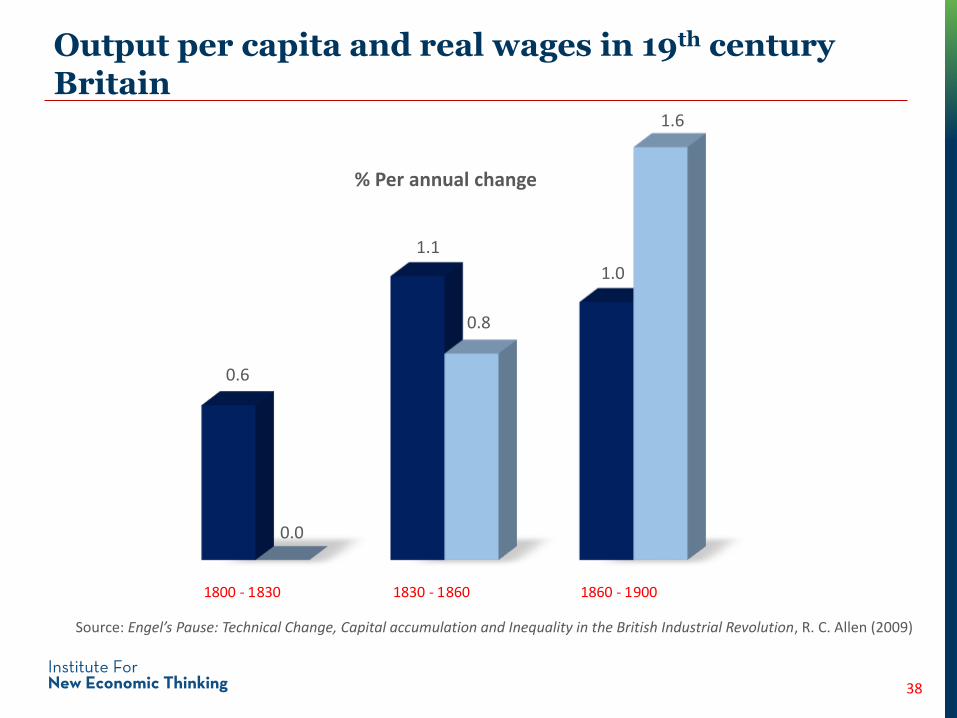
Output per capita and real wages in 19th century Britain
1800 - 1830 1830 - 1860 1860 - 1900
Source: Engel’s Pause: Technical Change, Capital accumulation and Inequality in the British Industrial Revolution, R. C. Allen (2009)
% Per annual change
0.6
0.0
1.1
1.6
1.0
0.8
38

Probability that computerisation will lead to job losses 2010 – 2030
OCCUPATION PROBABILITY
(1=certain)
Recreational Therapists 0.003
Personal Trainers 0.007
Firefighters 0.17
Economists 0.43
Machinists 0.65
Retail salesperson 0.92
Accountants & auditors 0.94
Telemarketers 0.99
Source: The Future of Employment: How Susceptible are Jobs to Computerisation? C. Frey and M. Osborne (2013)
39

US Jobs growth forecast, 2012 – 2022
40
20
65
21
21
18
24
32
30
22
30
19
90
1
2
3
4
5
6
7
8
9
10
19
26
Median annual wage ($000s)
Occupational categories by speed of job growth
Forecast job growth (000s)
1 Personal care aides 580
2 Registered nurses 527
3 Retail sales persons 435
4 Home health aides 424
5 Food preparation and serving aides 422
6 Nursing aides 312
7 Secretaries and administrative assistants
308
8 Customer services reps 299
9 Janitors and cleaners 280
10 Construction labourers 260
19 Maids and house keeping cleaners 183
26 Software developers, applications 140
Source: Bureau of Labor Statistics, www.bls.gov All sector average: 35

Growth in average wages and labour productivity
41
Real wage index
Labour productivity index
100
103
106
109
112
115
118
1999 2000 2001 2002 2003 2004 2005 2006 2007 2008 2009 2010 2011 2012 2013
Developed economies, 1999 – 2013
Source: Global Wage Report 2014/15, International Labour Organisation
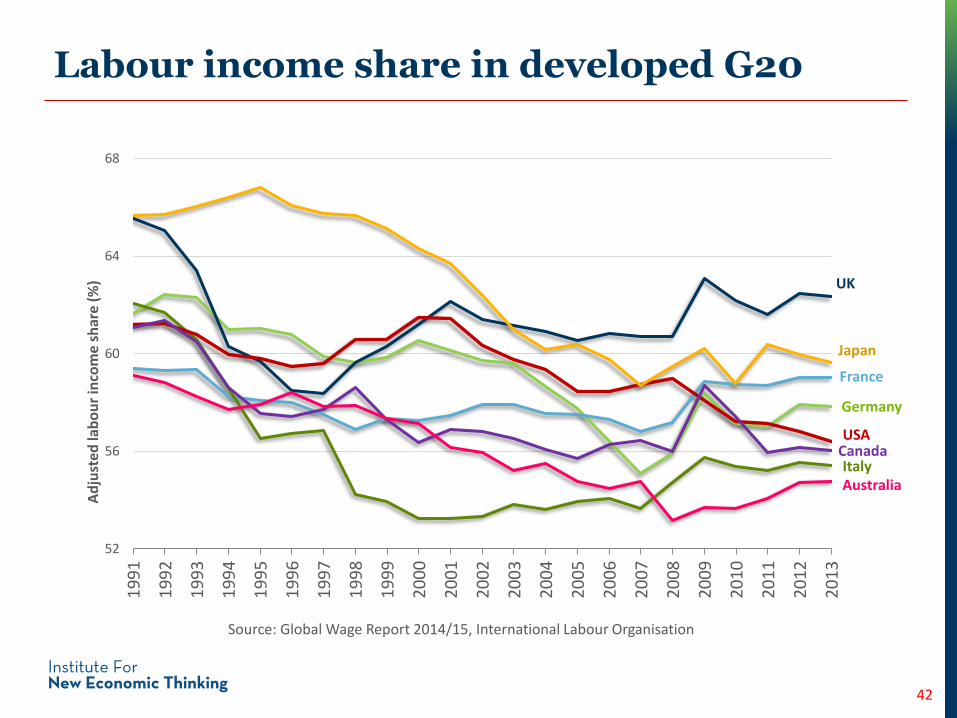
Labour income share in developed G20
42
Germany
France
Italy
UK
USA
Japan
Canada
Australia
52
56
60
64
68
19
91
19
92
19
93
19
94
19
95
19
96
19
97
19
98
19
99
20
00
20
01
20
02
20
03
20
04
20
05
20
06
20
07
20
08
20
09
20
10
20
11
20
12
20
13
Ad
just
ed la
bo
ur
inco
me
shar
e (%
)
Source: Global Wage Report 2014/15, International Labour Organisation
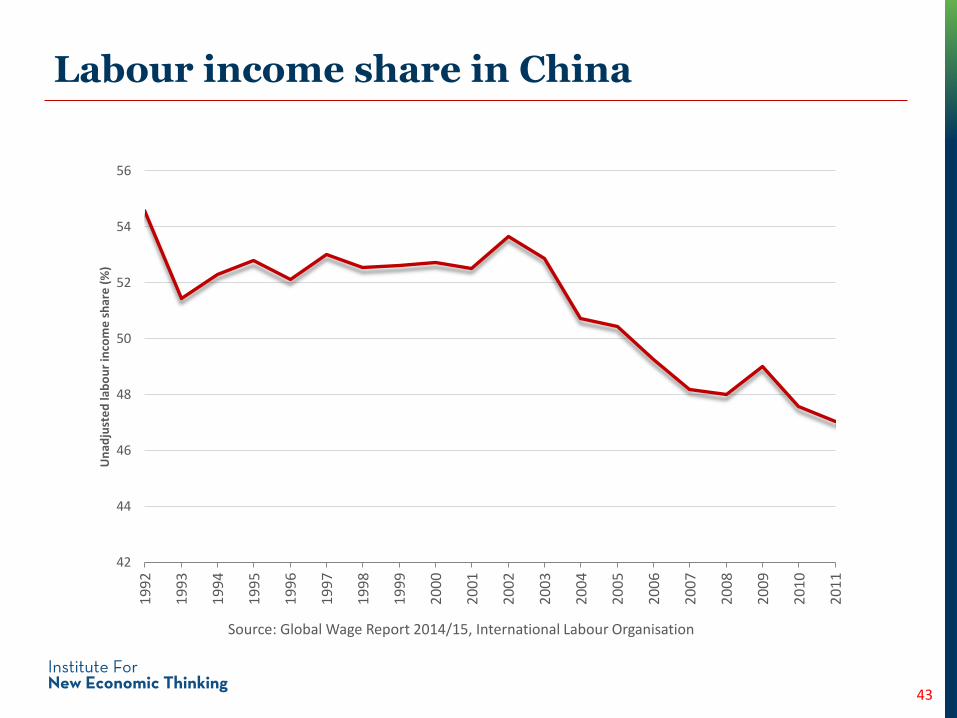
Labour income share in China
43
42
44
46
48
50
52
54
56
19
92
19
93
19
94
19
95
19
96
19
97
19
98
19
99
20
00
20
01
20
02
20
03
20
04
20
05
20
06
20
07
20
08
20
09
20
10
20
11
Un
adju
ste
d la
bo
ur
inco
me
sh
are
(%
)
Source: Global Wage Report 2014/15, International Labour Organisation
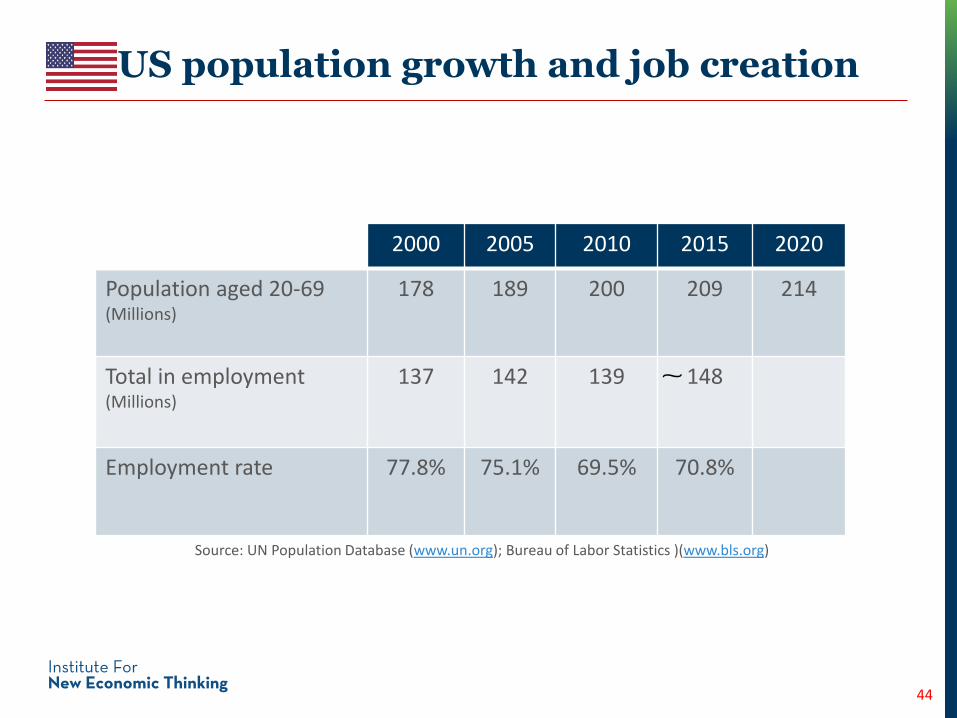
US population growth and job creation
44
2000 2005 2010 2015 2020
Population aged 20-69(Millions)
178 189 200 209 214
Total in employment(Millions)
137 142 139 148
Employment rate 77.8% 75.1% 69.5% 70.8%
Source: UN Population Database (www.un.org); Bureau of Labor Statistics )(www.bls.org)

Why did real rates fall so much even before the crisis?
45
Reduced investment needs?• In plant and machinery?
Ex-ante savings Ex-ante investment
Global imbalances?
Inequality?
Demographic effects?
• In advanced economy property and infrastructure?
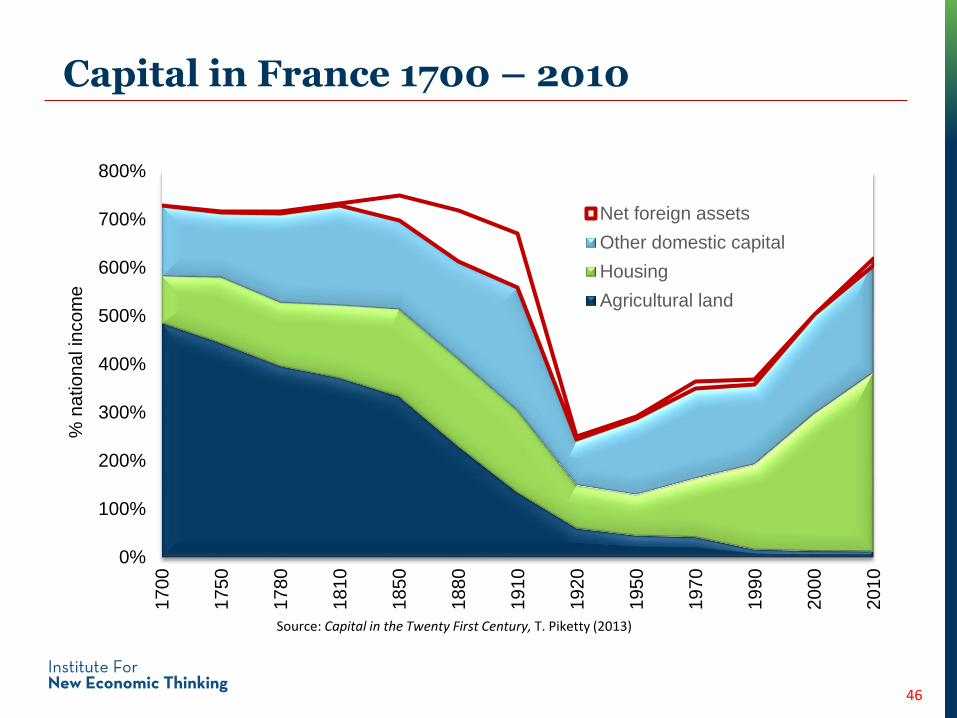
Capital in France 1700 – 2010
46
0%
100%
200%
300%
400%
500%
600%
700%
800%1700
1750
1780
1810
1850
1880
1910
1920
1950
1970
1990
2000
2010
% n
atio
na
l in
co
me
Net foreign assets
Other domestic capital
Housing
Agricultural land
Source: Capital in the Twenty First Century, T. Piketty (2013)
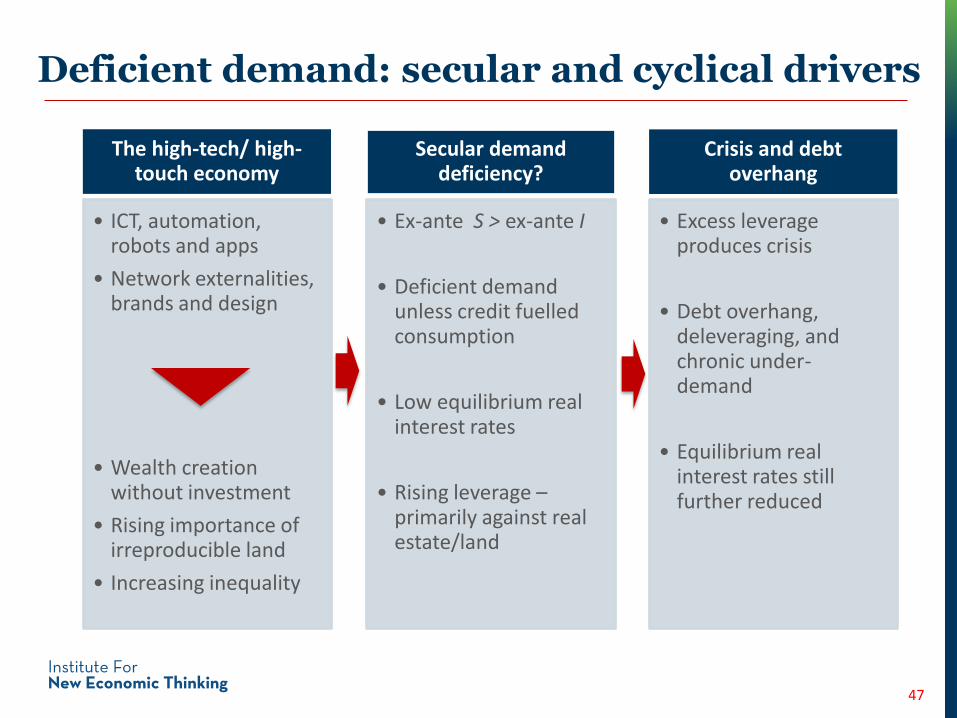
Deficient demand: secular and cyclical drivers
47
The high-tech/ high-touch economy
• ICT, automation, robots and apps
• Network externalities, brands and design
• Wealth creation without investment
• Rising importance of irreproducible land
• Increasing inequality
Secular demand deficiency?
• Ex-ante S ˃ ex-ante I
• Deficient demand unless credit fuelled consumption
• Low equilibrium real interest rates
• Rising leverage –primarily against real estate/land
Crisis and debt overhang
• Excess leverage produces crisis
• Debt overhang, deleveraging, and chronic under-demand
• Equilibrium real interest rates still further reduced

What will happen
48
No crisis, but big slowdown
The helicopter money end game: no big deal?
Playing with social and political fire
OK but unbalanced growth
Robust but not as good as hoped