debt relief-and-changing-governance-structures-in-developing-countries
TRANSCRIPT

Debt Relief and Changing Governance Structures in Developing Countries Andreas FreytagAndreas Freytag ([email protected]) is a Fellow of ECIPE and a Professor of Economics at the Friedrich-Schiller-University in Jena.
Gernot PehneltGernot Pehnelt ([email protected]) is a Researcher in Economic Policy at the Friedrich-Schiller-University in Jena.
AbstractIn this paper we empirically discuss the question whether or not debt relief in the past fteen years has been fieconomically rational. Analysing the determinants of debt relief our results suggest that governance quality did not play a role in the decision of creditor countries to forgive debt in the 1990s. Furthermore, even the actual debt burden of highly indebted poor countries had not been crucial for the decision whether or not debt forgiveness was granted. Rather, debt relief followed a strong path dependence: those countries whose debt had been forgiven in the rst half of the 1990s were also granted debt forgiveness in the second half fiof this decade. However, this allocation pattern changed at the beginning of the 21st century, when the path dependence became less strong and at least some dimensions of governance quality have been taken into account by donor countries.
ECIPE WORKING PAPER • No. 02/2006
www.ecipe.org
Phone +32 (0)2 501 53 08 Fax +32 (0)2 501 53 20 [email protected] Rue Du Luxembourg 3, B-1000, Brussels, Belgium
Keywords: O17, O19, O29JEL Code: debt relief, HIPC, development, governance, institutional quality
2
ECIPE WORKING PAPER
No. 02/2006
1 INTRODUCTION*1
During the last decade, developing countries have received a huge amount of debt relief. In the rst place, the objective of debt relief programmes is to reduce the external debt of sefi -verely indebted poor countries to a ‘sustainable’ level. The alleviation of the debt burden for develop-ing countries is supposed to improve the resource position of these countries and to enhance investments and further economic growth and development. There have been high expectations that debt reduction initiatives, especially the Heavily Indebted Poor Countries Initiative (HIPC) and the Enhanced HIPC Initiative (HIPC II), launched by the IMF and the World Bank in 1996 and 1999 respectively, would set free HIPC resources for spending on the poor.
In this paper we analyse the political and economic determinants of debt relief for highly indebted poor countries. This is a relevant topic not only because debt relief implies that scarce public funds in creditor countries are used, which should always be done carefully and after sound cost-bene t analysis. Moreover, bailing out broke countries that became highly fiindebted mainly because of inappropriate and irresponsible policies could create negative incentives and cause serious problems of moral hazard.
For this purpose we rst ask whether or not debt relief can be expected to be effective in fistimulating economic growth as well as – since good governance and decent institutions have been proved to be of special importance for economic growth and development – in improv-ing governance structures in these countries. After answering this question, we concentrate on the central topic of this paper, namely the question whether debt relief has been given mainly to countries that have shown decent governance structures or at least improvements in their institutional settings. There is a rich literature dealing with the determinants of debt relief. The contribution of this paper is to analyse the change in these determinants due to new public insights into the nature of governance structure.
We distinguish three sub periods in the time span between 1990 and 2004 to see whether or not governments of creditor countries have taken into account the governance structures and institutional quality of debtor countries. We are also interested in the question whether or not donor behaviour changed after the low impact of debt relief programmes on economic perform-ance and governance structures in the 1990s had become obvious.
The remainder of the paper is structured as follows. In the second section, we give an outline of debt relief programmes that have been initialized since the 1980s. After that we present the literature covering three important issues related to debt relief, namely the rationale, the effectiveness, as well as the determinants of debt relief. In section 4, we brie y introduce flour theoretical hypotheses, which we want to test empirically. Section 5 is dedicated to an overview about the data and the presentation of the results of the empirical analysis. Section 6 concludes our ndings.fi
* The ECIPE Working Paper series presents ongoing research and work in progress. These Working Papers might therefore present preliminary results that have not been subject to the usual review process for ECIPE publications. We welcome feedback and recommend you to send comments directly to the author(s).

3
ECIPE WORKING PAPER
No. 02/2006
2 DEBT RELIEF PROGRAMS IN RECENT HISTORY
Although the world had seen earlier concerns about the debt situation in developing countries resulting in some debt relief initiatives like the Pearson Report in 1969 and the Retroactive Terms Adjustment (RTA) programme in 1978, the debt problem became apparent in 1982 with Mexico defaulting on its debt payments. This event marks the beginning of the debt crisis of developing countries. In the subsequent years, various debt relief and restructuring programmes had been introduced, mainly to prevent further defaults of debtors through the provision of new loans and debt rescheduling. Most of the debt restructuring programmes of the 1980s, such as the Baker Plan and the Brady Plan, bailed out private sector creditors and allowed commercial banks to write off some of the active debts by rescheduling them, converting them into bonds (e g Brady-Bonds), or “selling” them to the IFIs. Some authors claim that the main goal of these plans was to avert a nancial crisis in the West (Pettifor & fiGreenhill 2002, p 13). Nevertheless, the Brady Plan was successful with respect to the prob-lem of debt overhang (Arslanalp & Henry 2005). Since the early 1990s, however, of cial debt fiis in the centre of the political activity. The Paris Club, a group of creditor countries with 19 permanent members, agreed on various debt cancellations and rescheduling programmes, focusing on the rescheduling of ODA debt and a partial cancellation of Non-ODA debt. 2 The so-called London Terms were formulated in 1991 and provided a reduction of up to 50 percent of Non-ODA debt. The Paris Club agreements contained some rather vague clauses that took a country’s need for debt forgiveness or rescheduling into account and should have stipulated adjustment programmes in the creditor countries. 3 With the introduction of the Cologne Terms in 1999, the Paris Club creditor countries accepted to raise the level of debt cancellation for the poorest countries up to 90 percent or even more if necessary. This debt forgiveness is taking place within the framework of the initiative for Heavily Indebted Poor Countries (HIPC). Cologne terms are implemented on a case-by-case basis. To qualify for these terms, debtor countries have to show continuing strong economic adjustments (Paris Club 2006b). Given these terms, one would expect that the debt relief plans implemented by the Paris Club in recent history stipulated sound policies in debtor countries and therefore contributed to economic growth there.
However, the debt relief initiatives until the mid-1990s did not solve the debt problem. Many developing countries, particularly in Sub-Saharan Africa, rather experienced a dramatic rise of their external debt over two decades. The constant dif culties to meet their debt obligafi -tions can be traced back to several factors, including exogenous shocks, such as the dete -rioration in the terms of trade, civil strife, a lack of sustained adjustment or the denial of structural reforms, improper lending behaviour of creditors, and the lack of prudent debt management policies by debtor countries (Boote & Thugge 1997, p 4). In view of the fact that the traditional mechanisms for dealing with the debt problem of the HIPC could not solve this suf ciently, the IMF and the World Bank launched the Heavily Indebted Poor Countries fiinitiative in 1996, which focused on the debt burden of the poorest countries in the world by reducing the multilateral debt of these countries. The main goal was to reduce debt burdens to a sustainable level, which was de ned as a debt-to-export ratio within the range between fi200 to 250 percent, and a ratio of debt service to exports within a range of 20 to 25 percent, all in net present value terms (NPV). For the rst time, this initiative included the main fimultilateral creditors such as the IMF, the International Development Association (IDA), and

4
ECIPE WORKING PAPER
No. 02/2006
the African Development Fund (AfDB). The HIPC initiative introduced some guiding prin-ciples regarding a country’s eligibility for debt relief. To be considered for HIPC Initiative assistance, a country must face an unsustainable debt burden, beyond traditionally available debt-relief mechanisms, and establish a track record of reform and sound policies through IMF- and IDA-supported programmes. In late 1999, the HIPC initiative was expanded in order to provide deeper and more rapid debt relief to a larger number of countries. The en-hanced HIPC initiative (HIPC II) integrated debt relief plans into a comprehensive poverty reduction strategy requiring Poverty Reduction Strategy Papers (PRSPs) on a broad-based participatory process as a necessary condition to qualify for debt relief. With this approach, the global donor community for the rst time took governance structures in the debtor ficountries (at least implicitly) into account. Furthermore, the thresholds for sustainable debt levels were rede ned and lowered to a debt-per-export ratio of 150 percent and a debt-to-firevenue ratio of 250 percent. The eligibility of a country is proved in a staged process. If a country is deemed eligible, the debt relief is delivered at the so-called completion point. During the period of the initial decision point and the completion point, the progress of the country with respect to institutional reforms and structural adjustments is under observation and supported by the IMF and the World Bank.4 In practise the time span between HIPC II and the completion point is rather large (IMF/IDA 2004, Annex III). Some countries are still waiting to reach the completion point.
Contrary to some traditional debt relief programmes the HIPC initiative and especially the HIPC II initiative emphasize explicitly on poverty reduction and the institutional dimensions of economic development in low-income countries. As soon as the awarding procedures of multilateral creditors and the Paris Club members really started to follow these conditions, one would expect that debt relief since the late 1990s would have been provided almost ex-clusively to countries that ful l these conditions, which would be a good sign with respect to fithe expected success of recent debt relief programmes.
3 THE LITERATURE
3.1 The Rationale of Debt Relief
One popular ef ciency argument for the provision of debt relief is the so called ‘debt over-fihang’.5 It has been stated that highly indebted countries bene t very little, if at all, from fithe returns on any additional investment because of the debt service obligation. Large debt obligations – so the underlying argumentation goes – can be seen as a high tax on invest -ment, policy reforms and development, because a signi cant part of the gains from economic fiadjustment would go to foreign creditors and not to the country itself. Put another way, the higher the stock of external debt, the higher the opportunity costs of current sacri ces for fithe sake of future economic growth are. This is the basis for the hypothesis of the debt Laffer curve, which refers to the relationship between the size of a country’s debt and the value of repay-ments. The net present value of debt repayments increases with the face value of total debt up to a certain threshold. Beyond this level of indebtedness a higher face value of debt is associated with lower efforts and investments, lower economic growth and therefore with a lower (expected) net present value of debt service. Creditors should therefore offer debt

5
ECIPE WORKING PAPER
No. 02/2006
relief to countries with large stocks of external debt in order to reduce future debt obliga-tions. This would increase the share of any marginal gains from economic adjustments that goes to the debtor country and create incentives to make these adjustments (Corden 1991). This strategy could end up in a win-win-situation by not only easing the debt burden of debt-ors but also increasing future repayments to the creditors. 6 Debt overhang is also supposed to depress growth by increasing private investors’ uncertainty about actions the government might take to meet its debt-servicing obligations, such as a sudden and stark increase of money supply causing in ation (Clements, Bhattacharya & Nguyen 2005), or distorting fu-flture tax policies.
Several studies have examined the existence of a debt overhang in developing countries. De-spite a few ambivalent and mixed results, 7 the empirical literature mainly provides support of the debt overhang hypothesis. Deshpande (1997) nds the debt overhang effect to be valid fifor a small sample of 13 countries in the period from 1971 to 1991. Pattillo, Poirson & Ricci (2002), using panel regressions for 93 developing countries over the period 1969-1998, sug-gest that debt levels beyond 160-170 percent of the exports or 35-40 percent of GDP are detrimental to growth. Bhattacharya & Clements (2004) estimate the debt overhang thresh-old at about 50 percent of GDP for the face value of external debt and about 100-105 percent of exports for the net present value of external debt based on data over the period 1970-1999 for a group of 55 low-income countries. Imbs & Ranciere (2005) provide non-parametric evidence supporting the existence of a debt Laffer curve among developing countries. Their results indicate that debt overhang occurs when the face value of debt reaches 60 percent of GDP or 200 percent of exports.
Since both theoretical literature and empirical evidence suggest that huge debt burdens tend to be associated with low investment and low economic growth in low-income countries, debt relief might have a stimulating effect on investment and economic development. This justi ca-tion of debt relief seems to be quite convincing at rst glance. But the clincher with fi firespect to the resource position of low-income countries and therefore to the capacity to pay their obligations – at least in the short run – and to invest, is still the net resource transfer from donors, including bilateral and multilateral aid which is of special importance for HIPCs. Since the reduction of multilateral debt is partly nanced by bilateral donors fi (e g through their contributions to multilateral funds), and these contributions usually come from the same political reservoir, namely the donors’ aid budget, there might be a trade-off between debt relief and of cial development assistance (Birdsall, Claessens & Diwan 2002, fi p 10). As Martin (2004) suggests, there is evidence of aid diversion to fund debt relief. How-ever, the empirical literature on additionality of debt relief does not provide strong support for these qualms about it.
Ndikumana (2003) investigating the relationship between debt alleviation programmes and of cial development assistance (ODA) does not nd a direct causal link between the volume fi fiof debt relief or debt forgiveness respectively and the volume of ODA disbursed, although the total supply of ODA and grants declined in the 1990s. Hernández/Katada (1996) nd a fislight crowding-out effect between ODA debt relief and new lending from bilateral resources in a sample of 32 Sub-Saharan African countries during the period 1989-1993. While there is at least no clear-cut empirical evidence of a crowding out of ODA or other sources of nance fi

6
ECIPE WORKING PAPER
No. 02/2006
by debt relief, there is no evidence for additionality either. In the face of very little, if not zero addition-ality, the question turns out to be whether it is better to have debt relief or more conventional forms of aid (Bird & Milne 2000, p 201).
Furthermore, taking into account the net resource transfer given to highly indebted low-in-come countries, the incentive argument becomes more complex than in the traditional debt overhang theory. If the net resource transfer from donors is positively related to a country’s level of indebtedness, the (dis)incentive effects of initial external debts and debt services to invest and to repay the credits may switch in the opposite direction. Bird & Milne (2003) show that higher levels of outstanding debt are usually associated with higher levels of net resource transfers from of cial sources. This fact contradicts the hypothesis of debt overhang: ficountries that increase their capacity (and willingness) to pay are expected to receive less future resource transfers. The disincentives to introduce promising but costly adjustments do not occur because of the so called debt overhang but because of the tax on development, which stems from the declining share in aid budgets given to relatively successful develop -ing countries. The ndings of Cordella, Ricci & Ruiz-Arranz (2005) in a way support this fihypothesis. The authors found that HIPCs indebtedness did not effect either investments or growth. In their ndings the so called debt irrelevance threshold is situated between 50 and fi60 percent of GDP.8 One explana-tion is that severely indebted low-income countries bene t fimost from the resource transfer provided by donors.
Birdsall & Claessen/Diwan (2002) suggest that net transfers are larger in high debt and es -pecially in the high multilateral debt regimes. Countries with high debt ratios and high debts due to multinational institutions have received larger net transfers. This can be interpreted as a debt subsidy rather than a debt tax.
Considering these theoretical and empirical ndings high debt burdens seem on the one hand fito be detrimental to economic growth in low-income countries. On the other hand, because of the crucial role of net transfers especially through bilateral and multilateral aid and because of ambivalent incentive effects, it is far from sure that debt relief alone can enhance further economic growth in highly indebted poor countries. In the next sub-section we will present a brief overview of the existing literature on the effectiveness of debt relief.
3.2 The Effectiveness of Debt Relief
Any debt relief would be economically irrational if the success was low. Therefore, future policy measures should be based on careful analysis with respect to effectiveness (and ef -ficiency).9 Is debt relief a proper instrument to reduce debt overhang, to diminish poverty, to increase growth, and to improve governance structures? Hernández & Katada (1996), in analysing grants and ODA debt forgiveness to 32 Sub-Saharan African countries, reveal that debt relief did not reduce the debt overhang of Sub-Saharan African countries at all, but that the nominal debt stock of many countries even doubled between 1984 and 1993 and their arrears increased dramatically. The authors suggest that it may be the case that the ODA debt which had been forgiven was not being serviced, which indicates that debt relief activities have not freed additional resources for the recipient countries. They also nd that receiving fimore debt relief did not increase a country’s import capacity. Some countries that have re -
7
ECIPE WORKING PAPER
No. 02/2006
ceived less debt relief have been able to expand their imports more than countries that have received debt relief to a substantially larger extent. Since the written-off debt has not been serviced, this shows that debt relief does not free resources.
Because the consensus of opinion in economic literature is that decent institutions and gov -ernance structures play a crucial role for economic development and growth,10 the question remains if debt forgiveness can be expected to contribute to improvement in governance quality in low-income countries, thus creating institutional conditions that are conducive to economic growth. Chauvin & Kraay (2005) show that debt relief in 62 developing countries between 1989 and 2003 did not improve the institutional quality, nor lead to rising FDI or higher rates of economic growth. Easterly (1999) nds that highly indebted poor countries fibecame highly indebted mainly because of poor policies, not because of external shocks or wars. He estimates a statistically signi cant association between debt relief and new net borfi -rowing in 40 HIPCs during the period 1989-1997. He concludes that of cial lenders did not fiadhere to prudential rules, and the IMF and the World Bank provided far more nancing to fiHIPCs over 1979-1997 than to other developing countries of similar income levels, although the policies in many HIPCs have been worse. Given these rather unsatisfying results, the ef-fectiveness of debt relief with respect to governance quality and economic development in low-income countries becomes highly questionable, because it might cause moral hazard and incentives to delay institutional reforms necessary for growth. Bauer (1991) raises moral haz-ard and disincentive issues, too, claiming that the bene ciaries of debt relief are governments fithat have not ful lled their obligations and have been allowed to do so very largely unscathed. fiThomas (2001) points out, that some HIPCs had no policy responses to poverty, Hiv/Aids, or corruption until they were required to do so as conditions for debt relief under the HIPC Initiative. Therefore, he suggests, unless debt relief is effectively conditioned on the proper use of funds and the pursuit of structural reforms, it is unlikely to help the poor.11
Clements, Bhattacharya & Nguyen (2005), using data for 55 low-income countries over the period 1970-1999, nd that large debt burdens have not seriously hampered public investfi -ment in low-income countries and that in most cases debt relief has lead to greater pub -lic consump-tion rather than investment that could have contributed to further economic growth. Taking into account that only a relatively small share of debt is supposed to be chan-nelled into public investment, the impact of debt relief on growth will at best be modest.
To the contrary, Arslanalp & Henry (2005), on the other hand, show that the debt restructur-ing and reduction under the Brady Plan led to rising asset prices, increased investment, and faster growth in the 16 countries that received Brady deals between 1989 and 1995. Accord-ing to the authors, the Brady Plan worked quite well, because debt relief was granted to a group of middle-income developing countries where debt overhang genuinely stood in the way of pro table new lending and investment. It is far from certain that the positive results fiof the Brady Plan can be used to forecast the potential impact of further debt relief on HIPCs (Arslanalp & Henry 2005, p 1048). Consequently, Arslanalp &Henry (2006) do not expect that further debt relief will address the fundamental problem of inadequate economic institu-tions that impedes investment and growth in the world’s poorest countries. In their opinion, the (indirect) approach of debt relief does little, if any, good.
8
ECIPE WORKING PAPER
No. 02/2006
Given the overwhelming evidence that debt relief cannot be expected to have notable posi-tive effects on governance quality and economic growth, why do creditor countries actually grant debt forgiveness and what are the main determinants of the allocation of debt relief?
3.3 The Determinants of Debt Relief
As debt relief has been barely effective, it makes sense to study its determinants. They obvi-ously deviate from economic reasoning as discussed in section 3.1. This is exempli ed by fiHernández & Katada (1996). They argue that neither absolute poverty nor lack of access to foreign exchange (through exports) have been criteria in allocating ODA debt relief and pure grants during the period 1989-1993.
Michaelowa (2003) provides a theoretical explanation for this evidence. In a political eco -nomic model, based on the utility maximizing behaviour of the political actors participating in the decision making process of debt relief programmes she argues that, if politicians and interna-tional bureaucrats realize that default risks become very high, they prefer to grant debt relief in order to conceal their imprudent past lending and to “sell” the renunciation of funds as an innovative poverty reduction measure, especially if lobbying by non-govern -mental organiza-tions (NGOs) in favour of debt relief increases their chances of obtaining positive public credit for the delivered debt relief. The enhanced HIPC initiative serves as an example.
Empirical evidence is in line with this reasoning. Birdsall, Claessen & Diwan (2002, 2003), analysing a sample of 37 Sub-Saharan African countries, prove that debt relief between 1977 and 1998 has been rather independent of policy variables in high debt countries, whereas net transfers are more dependent on governance indicators in the low debt regimes. Conse-quently, they suggest that the international community as a whole seems to be less selective with respect to the institutional quality of high debt countries. The authors also nd that fipolicy selectivity has declined over time, and that in the 1990s multilateral and bilateral do-nors were actually nancing bad policies in high debt countries. Neumayer (2002) nds very fi filittle evidence of a connection between the quality of governance and the allocation of debt forgiveness between 1989 and 1998. Only one out of six governance indicators seemed to be a statistically signi -cant determinant of whether or not a country is deemed eligible for fireceiving debt relief.
Alesina & Weder (2002) point out that corrupt governments pursuing very poor policies have received just as much aid and debt relief as less corrupt ones. According to their em -pirical study, covering several time periods between 1970 and 1995, there is not even weak evidence of a negative effect of corruption on received foreign aid or debt relief. Alesina & Dollar (2000) nd a strategic nature of aid, which implies the same behaviour of donors with firespect to debt relief. They use control variables such as colonial status (number of years in the 20th century in which countries have been colonies), FDI ow relative to GDP, and UN flvoting patterns.
In sum, theoretical literature and empirical evidence clearly show that it is not the gover-nance quality or the effort to create better economic and political circumstances that drives debt relief.
9
ECIPE WORKING PAPER
No. 02/2006
4 IS GOOD GOVERNANCE A DRIVER FOR DEBT RELIEF – THEORETICAL CONSIDERATIONS
This section deals with the determinants of debt relief in the perspective of the creditor countries. As stipulated in the Enhanced HIPCs Initiative only those countries receive debt forgiveness that seriously reform their institutional setting and their economic policy, so it seems adequate to look behind the motives of creditor countries. There are several determi-nants of debt relief one can think of. First, it may be the case that debt relief is given on the basis of economic reasoning. This would imply that debt relief is expected to free additional resources and enhance economic growth, and, because of the importance of good govern-ance for economic development, that good governance is rewarded and bad governance is sanctioned. In this case, one would expect that debt relief would be more successful with respect to economic performance and improvements of governance quality than documented in the literature. We discuss the hypothesis that debt relief programmes have contributed to economic growth and to improvements in governance quality (H1) in section 5.2.
Another justi cation for debt relief could be the existence of the so called debt burden, which fiwe will test in Stage 2. Since high levels of indebtedness seem to be detrimental to growth in low-income countries, debt forgiveness could be one way to enhance economic develop-ment in HIPCs. Therefore, the amount of debt relief should be positively related to the level of indebtedness, which is the second hypothesis (H2) to be tested.
However, a political economy perspective rather suggests a different theoretical reasoning along the lines raised by Michaelowa (2003). According to this reasoning, politicians in donor countries do not like to admit policy errors. Suppose that despite (or even because of) past debt relief, the debtor country did not improve its economic and political situation. Never -theless, politically rational governments in creditor countries would not take this result as a signal to stop their activities, as this would be a confession of bad economic policy in the recent past. Rather, they would nd arguments for further debt relief measures.fi 12 Applied to the three sub-periods we have chosen, one would then expect a path dependence. Our third hypothesis (H3) is as follows: debt relief in the second and third sub-period is positively related to the amount of debt forgiven in the rst, and the rst and second sub-period re-fi fispectively.
For governments in rich countries there may be another incentive for debt relief, namely poverty, in particular poverty to be observed in the daily news. Famines, natural catastrophes and the like can be instrumental when the government is not willing or able to run differ -ent, and probably more effective, development policies such as opening foreign trade for agricultural products and Heckscher-Ohlin goods. 13 Debt relief then is a politically cheap, but economically expensive form of publicly visible development policy. The government can improve its position against the country’s opposition that cannot argue against it without appearing heartless and stingy. Therefore, one could expect debt relief to be positively cor-related with the degree of poverty, which is our fourth hypothesis (H4) to be tested.
10
ECIPE WORKING PAPER
No. 02/2006
Another determinant of debt relief may be the abundance of natural resources. Especially oil exporting countries may be more easily subject to debt forgiveness than others, as their gov-ernments have to be treated carefully by industrialized countries. 14 A reasonable hypothesis (H5) is that oil-exporting countries receive more debt relief than others.
Thus, according to the hypotheses H2-H5, debt relief for developing countries can be inter-preted as a function of debt relief, the actual debt burden, debt relief in the past, the colonial history, the degree of a country’s poverty, and a dummy for oil exporting countries.
One can also formulate an alternative hypothesis, namely that governments in creditor coun-tries are able to learn about and to distinguish debtor countries from each other. The justifi-cation is that the knowledge and awareness about both the elusiveness of debt relief and the enormous impact of institutions on economic development is rather new – at least in terms of publicly accepted knowledge. This would imply that governments of creditor countries do take into account governance quality or changes in the governance structures of debtor countries more carefully in later periods of debt relief. It does, however, not imply that the other determinants are irrelevant.
Our alternative hypothesis, that good governance (H6a) or improvement in governance qual-ity (H6b) in uences the amount of debt forgiveness in the third sub-period positively, asfl -sumes economic rationality to a greater extent than in the rst one. Beside the variables fide ned for H2-H5, the governance quality and changes in the governance structures over fitime are relevant according to H6a and H6b.
We will test our hypotheses empirically in the following section.
5 EMPIRICAL ANALYSIS
This section reports the results of the empirical analysis. We do cross-country estimates for three periods (1990-1994, 1995-1999, 2000-2004). We start by giving a brief overview of various debt relief programmes in recent history. In sub-section 5.1 we introduce the data -base for 127 developing countries in the period 1990-2004. After that, in “Stage 1” we assess whether debt relief contributes to higher growth and improvements of governance structures (H1). In “Stage 2” we test our theoretical considerations about the determinants of debt relief (H2-H6).
5.1 Data
The data include macroeconomic variables, a variety of institutional variables describing the quality of governance structures as well as different control variables. We split the period into three sub-periods, namely 1990-1994, 1995-1999 and 2000-2004, and use average data for these sub-periods. We have chosen these sub-periods because the second and third almost match the introduction of the HIPC I and HIPC II initiative respectively.15 Another reason is that some of the variables used, especially debt relief, occur in a rather discontinuous manner, and some data are not available for every single year.

11
ECIPE WORKING PAPER
No. 02/2006
The sum of debt relief for the countries in our sample between 1990 and 2004 amounts to about US$ 51 billion (face value). We use data on debt relief reported by the Development Assistance Committee (DAC) of the Organisation for Economic Co-operation and Develop-ment (OECD 2006). These include the forgiveness of loans reported by creditor countries as a component of of cial development assistance (ODA). Further data on debt are taken from fithe Joint BIS-IMF-OECD-World Bank statistics on external debt.16 It may be argued that the face value of debt and debt relief is not appropriate to calculate their economic effects, and some authors already claimed that one should rather use net present value terms. Although a few attempts to calculate the net present value of debt relief have been made, no comprehen-sive database on the net present value of debt relief calculated on a loan-by-loan basis exists so far. Since the reliability of the existing estimations of debt relief in net present value terms is questionable, we shall use the reported face values.
A second argument for this mode of procedure is that we mean to analyse the effects of and justi cation for debt relief from the donors’ point of view, or – so to speak – from the fiperspec-tive of the OECD countries’ tax payers. One can also argue that in the creditors’ perspective, the net present value of the loans does not matter in practice, because the prob-ability that HIPCs would have met their obligations (including interest etc) can be expected to be close to zero, anyway. Therefore, it is the reported (nominal) amount of debt relief provided that counts (among others as a “selling” argument for tax payers, NGOs etc). Donor countries usually report the amount of debt relief in face value terms.
Finally, since we are discussing the problem of additionality of debt relief, our method can be justi ed because of the possible trade-off between debt relief and real resource transfer fithrough ODA.
Our main economic indicators, such as GDP, GDP growth, GDP per capita, and data on international trade, are taken from IMF (2006) and WTO (2006) sources. The descriptive statistics referring to GDP per capita, total external debt per GDP, debt service per exports, and debt relief per GDP are reported in Table 1.
12
ECIPE WORKING PAPER
No. 02/2006
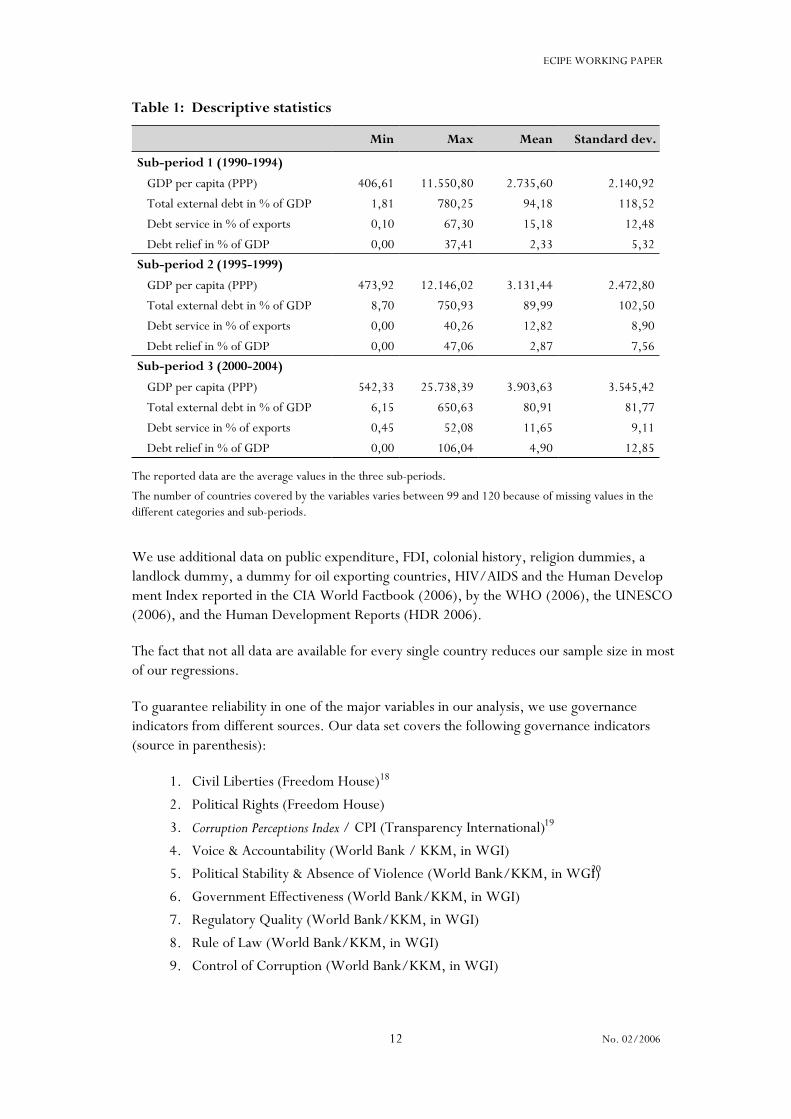
Table 1: Descriptive statistics
Min Max Mean Standard dev.
Sub-period 1 (1990-1994)
GDP per capita (PPP) 406,61 11.550,80 2.735,60 2.140,92
Total external debt in % of GDP 1,81 780,25 94,18 118,52
Debt service in % of exports 0,10 67,30 15,18 12,48
Debt relief in % of GDP 0,00 37,41 2,33 5,32
Sub-period 2 (1995-1999)
GDP per capita (PPP) 473,92 12.146,02 3.131,44 2.472,80
Total external debt in % of GDP 8,70 750,93 89,99 102,50
Debt service in % of exports 0,00 40,26 12,82 8,90
Debt relief in % of GDP 0,00 47,06 2,87 7,56Sub-period 3 (2000-2004)
GDP per capita (PPP) 542,33 25.738,39 3.903,63 3.545,42
Total external debt in % of GDP 6,15 650,63 80,91 81,77
Debt service in % of exports 0,45 52,08 11,65 9,11
Debt relief in % of GDP 0,00 106,04 4,90 12,85
The reported data are the average values in the three sub-periods.
The number of countries covered by the variables varies between 99 and 120 because of missing values in the different categories and sub-periods.
We use additional data on public expenditure, FDI, colonial history, religion dummies, a landlock dummy, a dummy for oil exporting countries, HIV/AIDS and the Human Develop-ment Index reported in the CIA World Factbook (2006), by the WHO (2006), the UNESCO (2006), and the Human Development Reports (HDR 2006).
The fact that not all data are available for every single country reduces our sample size in most of our regressions.
To guarantee reliability in one of the major variables in our analysis, we use governance indicators from different sources. Our data set covers the following governance indicators (source in parenthesis):
1. Civil Liberties (Freedom House)18
2. Political Rights (Freedom House)
3. Corruption Perceptions Index / CPI (Transparency International)19
4. Voice & Accountability (World Bank / KKM, in WGI)
5. Political Stability & Absence of Violence (World Bank/KKM, in WGI)20
6. Government Effectiveness (World Bank/KKM, in WGI)
7. Regulatory Quality (World Bank/KKM, in WGI)
8. Rule of Law (World Bank/KKM, in WGI)
9. Control of Corruption (World Bank/KKM, in WGI)
13
ECIPE WORKING PAPER
No. 02/2006
10. Index of Economic Freedom (Heritage Foundation)21
11. Economic Freedom of the World (Fraser Institute)22
The indicators “Civil Liberties” (1) and “Political Rights” (2) provided by Freedom House on a yearly basis covering the whole period 1990-2004 have been transformed so that higher values indicate “better” performance. The original indicators range from 1 (“free”) to 7 (“not free”). The survey includes both analytical reports and numerical ratings. The survey ndfi -ings are reached after a multi-layered process of analysis and evaluation by a team of regional experts and scholars.23
The Corruption perceptions index (CPI) (3) ranks the countries in terms of perceived levels of corruption, as determined by expert assessments and opinion surveys. The sources measure the overall extent of corruption in the public and political sectors.24 The CPI Score, ranging between 0 (highly corrupt) and 10 (highly clean), is only available for a larger group of coun-tries for the second and third of our sub-periods.
The same holds for the aggregated governance indicators estimated by World Bank staff, which are provided in a two-year-cycle. The indicator “Voice & Accountability” (4) includes a number of measures of the political process, civil liberties, political and human rights. “Po-litical Stability & Absence of Violence” (5) combines several indicators that measure percep-tions of the likelihood that the government in power will be destabilized or overthrown by unconstitu-tional or violent means. “Government Effectiveness” (6) combines responses on the quality of public service provision, the quality of the bureaucracy, the competence of civil servants, the independence of the civil service from political pressures, and the credibility of the govern-ment’s commitment to policies.
“Regulatory Quality” (7) focuses on the policies themselves, including measures of the inci -dence of market-unfriendly policies such as price controls or inadequate bank supervision, as well as perceptions of the burdens imposed by excessive regulation in areas such as foreign trade and business development. The indicator “Rule of Law” (8) includes several measures of the extent to which agents have con dence in and abide by the rules of society. These include fiperceptions of the incidence of crime, the effectiveness and predictability of the judiciary, and the enforceability of contracts. “Control of Corruption” (9) is a measure of the extent of corruption, conventionally de ned as the exercise of public power for private gain. It is based fion scores of variables from polls of experts and surveys (The World Bank 2005). The six indi-cators are normalized in every reported year range from -2.5 to 2.5 and have a mean of zero and a standard deviation of one. Higher values indicate “better” governance.
The Index of economic freedom (10) provided by the Heritage Foundation includes a broad array of institutional factors determining economic freedom, especially corruption in the judiciary, and government bureaucracy, non-tariff barriers to trade, the scal burden of government, fithe rule of law, ef ciency within the judiciary, and the ability to enforce contracts, regulatory fiburdens on business, restrictions on banks, labour market regulations, and informal market activities, including corruption, smuggling, piracy of intellectual property rights. We trans-formed the index so that higher scores indicate an economic environment or set of policies

14
ECIPE WORKING PAPER
No. 02/2006
that are most conducive to economic freedom. The original score ranges from 1 to 5, where higher scores signify lower economic freedom.
Economic freedom in the world (11) calculated by the Fraser Institute measures the degree of economic freedom present in the ve areas “Size of government”, “Legal structure and secufi -rity of property rights”, “Access to sound money”, “Freedom to trade internationally”, and “Regulation of credit, labor, and business.” This indicator is a broad measure of conditions that are supposed to be supportive of economic growth. 25 Within the ve major areas, 21 ficomponents are incorporated into the index but many of those components are themselves made up of several sub-components. 26 The scale runs from 0 to 10. Higher values indicate a higher degree of economic freedom. We use data from the years 1990, 1995, 2000, 2001, 2002, and 2003.
5.2 Stage One – Did Debt Relief Bring out any Good?
First, we discuss the rst hypothesis (H1) claiming that debt relief provided in the rst and fi fisecond of our sub-periods improved the economic development in low-income countries. The literature is explicit about the poor effectiveness of debt relief (and development aid). We have used our database to control whether or not our data are consistent with the general thrust of the literature (see also sub-section 3.2). The results of an OLS-model (with White correction because of possible heteroscedasticity) show that neither economic growth (mea-sured by GDP per capita in PPP-$) nor governance indicators were positively in uenced by fldebt relief during our estima-tion period 1990 through 2004, which one would expect.27
We also test whether ODA aid contributed to growth and better governance, and again we have to reject the hypothesis. The only variables that were positively correlated with growth are governance indicators.
The economic freedom of a country measured by the Fraser Index (Fraser) has – as expected – a positive and preponderantly signi cant effect on economic development in most of our fiestimations. We controlled our estimations for variables such as geographical speci cation, finamely a dummy for a country’s access to oceans (landlock-dummy), a dummy for the domi-nating religion (Christian, Muslim or other), a dummy that indicates if the country is an oil exporter, and some other factors, such as the stock and the in ow of foreign direct investfl -ment (FDI). Although some of these variables show the expected signs (e g Landlock) and add some explanatory power to our models, this extra explanatory power is negligibly small, and most of the variables turned out to be highly insigni cant, except for FDI that contribute sig-fini cantly to growth in some of our regressions. The answer to the question if debt relief has fibrought out any good with respect to the economic development in low-income countries so far is disillusioning. All in all, our results suggest that debt relief programmes in the 1990s have not lead to higher economic growth in the world’s poorest countries. According to the results of some of our estimations, neither did ODA. The result is the same with respect to governance. We cannot identify a positive relationship between debt relief and governance in-dicators in the second and third sub-periods. Debt relief did not contribute to better govern-ance in highly indebted countries in the 1990s and the early 21st century. Our estimations do not produce even the weakest relationship between the amount of debt relief and governance

15
ECIPE WORKING PAPER
No. 02/2006
indicators. Our rst hypothesis (H1), in line with the existing literature on this issue, must fithus be rejected. Debt relief in the period from 1990 to 1999 did not contribute to better economic performance and political conditions in most developing countries.
5.3 Stage Two – The Determinants of Debt Relief
If not the economic and political development of low-income countries, what drives the deci-sions of policymakers in industrialized countries towards more debt relief? This question is addressed by hypotheses 2 through 6 of section 4. We shall use a Tobit regression to test the hypotheses empirically. We start with the sub-period 1995-1999 in section 5.3.1, and pro-ceed with the sub-period 2000-2004 sub-section 5.3.2.
5.3.1 Determinants of Debt Relief during the 1990s
Our dependent variable is the amount of debt relief awarded in the sub-period 1995-1999 relative to the average GDP in this sub-period. Since quite a few countries in our sample did not receive any debt relief at all resulting in a skewed distribution of the dependent variable, we apply (left-censored) Tobit estimation techniques to distinguish between countries that received debt relief and those who did not, and to take into account the amount of debt relief relative to GDP at the same time. By doing so we do not only cover the question of whether or not a country was found to be eligible for debt relief, which is the rst step if one wants to fiidentify determinants of debt forgiveness, but also address the assumption that a factor that has a positive effect on the probability of actually receiving debt relief should also in uence flthe amount of the debt forgiveness positively. 28
with DebtperGDP2 being the debt stock relative to the GDP in sub-period 2, DRperGDP1 the amount of debt relief relative to the GDP in sub-period 1, ODAperGDP1 the aid to GDP ratio in sub-period 1, Debtserviceperexports2 being the ratio of debt service per exports in sub-period 2, XM representing a vector of institutional variables and XN representing a vector of controls. We use each governance indicator separately because we want to identify governance dimen-sions that might have been weighted stronger by donor countries when they decided about granting debt forgiveness.
åXßXâseperexportDebtservic
ODAperGDPâDRperGDPâDebtperGDPâcDRperGDP
NNMM2
1312212
++++
+++=
16
ECIPE WORKING PAPER
No. 02/2006
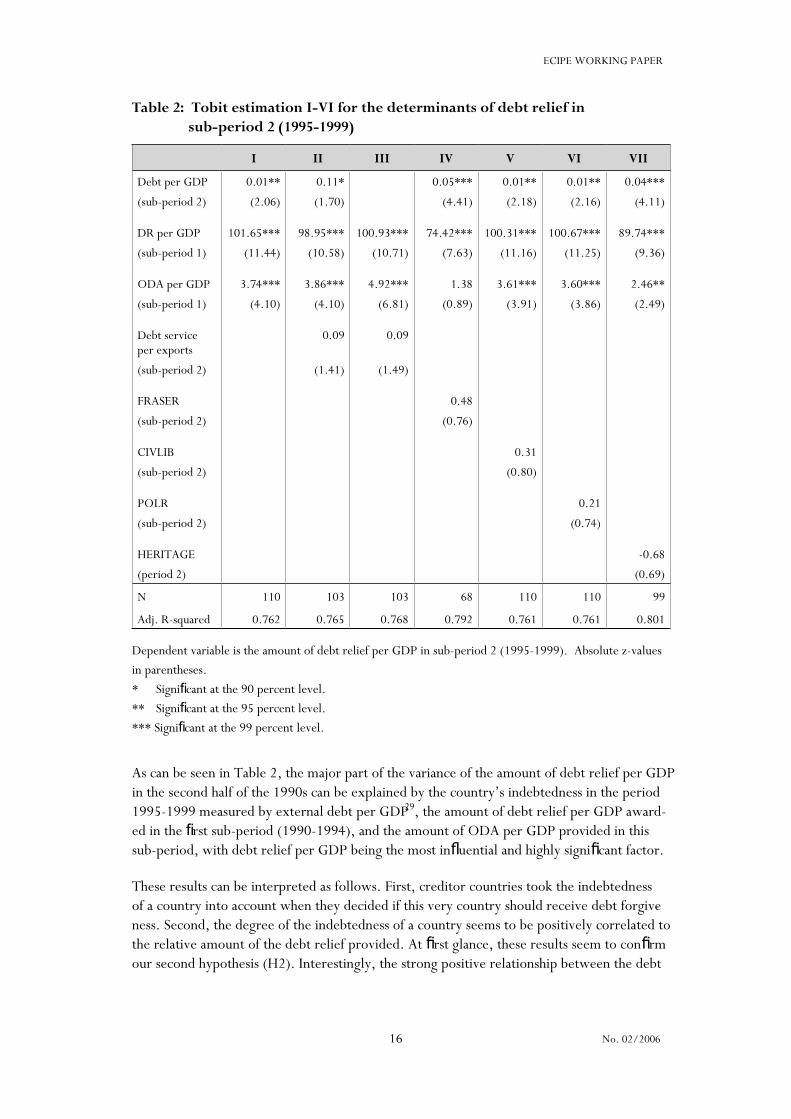
Table 2: Tobit estimation I-VI for the determinants of debt relief in sub-period 2 (1995-1999)
I II III IV V VI VII
Debt per GDP 0.01** 0.11* 0.05*** 0.01** 0.01** 0.04***
(sub-period 2) (2.06) (1.70) (4.41) (2.18) (2.16) (4.11)
DR per GDP 101.65*** 98.95*** 100.93*** 74.42*** 100.31*** 100.67*** 89.74***
(sub-period 1) (11.44) (10.58) (10.71) (7.63) (11.16) (11.25) (9.36)
ODA per GDP 3.74*** 3.86*** 4.92*** 1.38 3.61*** 3.60*** 2.46**
(sub-period 1) (4.10) (4.10) (6.81) (0.89) (3.91) (3.86) (2.49)
Debt service per exports
0.09 0.09
(sub-period 2) (1.41) (1.49)
FRASER 0.48
(sub-period 2) (0.76)
CIVLIB 0.31
(sub-period 2) (0.80)
POLR 0.21
(sub-period 2) (0.74)
HERITAGE -0.68
(period 2) (0.69)
N 110 103 103 68 110 110 99
Adj. R-squared 0.762 0.765 0.768 0.792 0.761 0.761 0.801
Dependent variable is the amount of debt relief per GDP in sub-period 2 (1995-1999). Absolute z-values in parentheses. * Signi cant at the 90 percent level.fi** Signi cant at the 95 percent level.fi*** Signi cant at the 99 percent level.fi
As can be seen in Table 2, the major part of the variance of the amount of debt relief per GDP in the second half of the 1990s can be explained by the country’s indebtedness in the period 1995-1999 measured by external debt per GDP29, the amount of debt relief per GDP award-ed in the rst sub-period (1990-1994), and the amount of ODA per GDP provided in this fisub-period, with debt relief per GDP being the most in uential and highly signi cant factor.fl fi
These results can be interpreted as follows. First, creditor countries took the indebtedness of a country into account when they decided if this very country should receive debt forgive-ness. Second, the degree of the indebtedness of a country seems to be positively correlated to the relative amount of the debt relief provided. At rst glance, these results seem to con rm fi fiour second hypothesis (H2). Interestingly, the strong positive relationship between the debt
17
ECIPE WORKING PAPER
No. 02/2006
burden and the amount of debt relief does not occur if we add (or use) the amount of debt service per exports as a measure of a country’s debt burden (estimation II and III). The coef-
cient of this variable is positive but insigni cant. Hence, it seems that the level of indebtedfi fi -ness has been taken into account by creditors to some extent, but the actual debt burden has not played a major role in the calculus of donors in the 1990s. This somehow con rms our ficonjecture that some severely indebted countries did not pay their obligations or at least fell into substantial arrears. The correlation between the relative debt stock and the debt service per exports is remarkably low, with a coef cient of correlation just about 0.24. Creditor ficountries obviously provided higher debt forgiveness through debt restructuring, postpone-ments or debt cancellation in order to prevent additional arrears, which is also in line with our theoretical presumptions. This, indeed, might have created even more disincentives to necessary adjustments in some highly indebted poor countries.
However, the most striking result is the strong path dependence of debt relief. Once a coun-try received debt forgiveness in the early 1990s, the probability of gaining from additional debt forgiveness in the second half of the 1990s is close to one. Furthermore, the higher the amount of the debt relief granted in the past, the higher is the expected relative debt relief in the future. The data strongly con rm our third hypothesis (H3). Donor countries obviously fido not interpret past ODA and debt relief as “sunk costs,” which they clearly are. Contrary to reasonable economic considerations, the costs of past ODA and debt relief programmes are not irrelevant in the decision-making process about current and future debt forgiveness, even if it becomes clear that these “expenditures” did not bring out any good with respect to economic development or governance quality.31 Governments in creditor countries did not tend to admit past errors; they rather accepted new ones to prevent political costs, at least in the 1990s. The governance indicators do not add any extra explanatory power to the estima-tion (see Table 3), but – at least – show a positive sign, indicating that governance has been taken into account.32

18
ECIPE WORKING PAPER
No. 02/2006
Table 3: Tobit estimation VII-XIV for the determinants of debt relief in sub-period 2 (1995-1999)
VII VIII IX X XI XII XIII XIV
Debt per GDP 0.02** 0.02** 0.01 0.02** 0.01* 0.01** 0.01** 0.01*(sub-period 2) (2.32) (2.56) (0.65) (2.50) (1.92) (2.18) (2.11) (1.80)
DR per GDP 100.66*** 101.52*** 101.56*** 97.42*** 101.64*** 100.41*** 101.10*** 102.38***(sub-period 1) (11.37) (11.67) (10.21) (10.61) (11.32) (11.16) (11.51) (11.66)
ODA per GDP 3.63*** 3.50*** 4.45*** 3.72*** 3.74*** 3.57*** 3.56*** 4.18***(sub-period 1) (3.99) (3.87) (3.15) (4.11) (4.11) (3.80) (3.91) (4.45)
GOVEFF 1.13(sub-period 2) (1.10)
CONTROLC 2.10*(sub-period 2) (1.65)
POLSTAB -0.50(sub-period 2) (0.73)
REGQUAL 1.27(sub-period 2) (1.56)
RULEOFLAW 0.01(sub-period 2) (0.01)
VOICE 0.55(sub-period 2) (0.73)
COLONTOT 0.005(1.43)
OILEX 1.90(1.64)
N 110 110 98 110 110 110 110 110
Adj. R-squared 0.764 0.773 0.748 0.763 0.759 0.762 0.768 0.769
Dependent variable is the amount of debt relief per GDP in sub-period 2 (1995-1999). Absolute z-values in parentheses. * Signi cant at the 90 percent level.fi** Signi cant at the 95 percent level.fi*** Signi cant at the 99 percent level.fi
Control of Corruption is the only “promising” coef cient, being signi cant at the 10 percent fi filevel and showing the expected sign (estimation VIII, Table 3). On the other hand, POLSTAB shows a negative sign, as does HERITAGE in estimation VII in Table 2. All in all, the hypo-thesis, that donor countries have taken the state of governance quality into account when they were deciding about debt relief (H6a) has to be rejected for the second half of the 1990s.

19
ECIPE WORKING PAPER
No. 02/2006
The other variables do not contribute to the explanation of the determinants of debt re-lief in sub-period 2. Colonial history is irrelevant, no matter if we use a variable counting the number of years a country was a colony in the 20th century (COLON20) or in total (COLONTOT). Therefore, the hypothesis of the history-related path dependence has to be dismissed. The dummy OILEX shows the expected sign and is close to signi cance. Neverthefi -less, we do not nd support for the hypothesis that debt relief has been granted in favour of fioil exporting countries (H5).
5.3.2 Determinants of Debt Relief at the Beginning of the 21 st Century
Now we turn to sub-period 3 testing the hypothesis that governments of creditor countries are able to learn and change the allocation pattern of debt relief with respect to governance quality. The dependent variable is now the amount of debt relief per GDP provided in the third sub-period (2000-2004). Again we use the level of indebtedness measured by the debt stock per GDP as the rst independent variable. In order to test the path dependence found fiin the last section, we integrate the amount of debt relief relative to GDP awarded in the 1990s (sub-periods 1 and 2). We shall also test if the path dependence can be found with respect to ODA payments provided in sub-periods 1 and 2. This leads us to the following equation that we use in Tobit estimations:
with X∆M representing a vector of changes in institutional variables. The explanatory power of our rst two regressions in Table 4 falls way behind the comparable ones from the previous fisection. Only about 25 to 27 percent of the variance of the amount of debt relief awarded in the third sub-period can be explained by the level of indebtedness, the amount of previous debt relieves and previous ODA payments. The coef cients of the relative amount of debt refi -lief in the past remain positive and signi cant, but the path dependence of debt relief has lost fisome of its weight at the beginning of the 21 st century.33 The integration of the actual debt burden, measured by debt service per exports does not add any extra explanatory power to our model. Although the coef cient of the stock of foreign debt per GDP is positive and fisigni cant in the rst two estimations, a country’s indebtedness does not seem to be a major fi fideterminant of debt relief in the third sub-period. The results do not con rm hypothesis 2. fiThis becomes clear if we introduce a measure of poverty into our regressions.
åXßXâXâseperexportDebtservic
ODAperGDPâDRperGDPâDEBTperGDPâcDRperGDP
NNÄMÄMMM2
213212313
+++++
+++= ++

20
ECIPE WORKING PAPER
No. 02/2006
Table 4: Tobit estimation I-V for the determinants of debt relief in sub-period 3 (2000-2004)
I II III IV V
Debt per GDP 0.10*** 0.11*** 0.02 0.02 0.02(sub-period 3) (3.66) (3.33) (0.69) (0.66) (0.79)
DR per GDP 0.85*** 0.86*** 0.49*** 0.47*** 0.47***(sub-periods 1 & 2) (3.64) (3.40) (3.29) (3.08) (3.15)
ODA per GDP -2.81 -3.66 8.23** 8.51** 8.90**(sub-periods 1 & 2) (0.79) (0.84) (2.35) (2.42) (2.54)
Debt service per exports -0.10(sub-period 3) (0.55)
POVERTY 0.11** 0.11** 0.11**(sub-period 3) (2.36) (2.41) (2.43)
COLONTOT 0.00(0.64)
OILEX 2.12(1.17)
N 109 96 74 74 74
Adj. R-squared 0.272 0.258 0.625 0.623 0.627
Dependent variable is the amount of debt relief per GDP in sub-period 3 (2000-2004). Absolute z-values in parentheses. * Signi cant at the 90 percent level.fi** Signi cant at the 95 percent level.fi*** Signi cant at the 99 percent level.fi
The variable POVERTY is the percentage of the population that lived below the poverty line at the beginning of the 21 st century. The integration of this variable adds much explanatory power to the model and rules out the signi cance on the relative debt stock.fi 34 Debt relief per GDP in the previous two sub-periods remain signi cant, and ODA per GDP in these two fisub-periods becomes weakly signi cant. Controlling for other factors, such as colonial hisfi -tory and OILEX does not change the pattern of the estimation.
Summarizing the ndings of Table 4, it seems to be the case that recent debt relief has been fiprovided primarily to the poorest countries, but still dependent on debt relief programs in the early 1990s. These ndings give strong support to hypothesis 4. The level of indebtedfi -ness cannot be judged as an important determinant of debt forgiveness in the early 21st cen-tury.35
The question, yet to be answered, is if recent debt relief has been provided to those countries that have shown sound policies or at least improved their governance quality. We tested the effects of several institutional dimensions on the allocation of the debt forgiveness in sub-pe-riod 3 by using the different institutional indicators separately. Table 5 provides some promis-

21
ECIPE WORKING PAPER
No. 02/2006
ing results. The coef cients of all governance indicators are positive and two of them reach fithe 95 percent signi cance level.fi 36
Table 5: Tobit estimation VI-XIV for the determinants of debt relief in sub-period 3 (2000-2004)
VI VII VIII IX X XI XII XIII XIV
Debt per GDP 0.05** 0.05** 0.06** 0.06** 0.05** 0.05** 0.06** 0.06** 0.05**(sub-period 3) (2.15) (2.24) (2.44) (2.55) (2.33) (2.23) (2.52) (2.32) (2.23)
DR per GDP 0.68*** 0.66*** 0.64*** 0.64*** 0.67*** 0.66*** 0.62*** 0.67*** 0.65***(sub-period 1 & 2) (4.85) (4.79) (4.74) (4.95) (5.08) (5.00) (4.73) (5.03) (4.62)
POVERTY 0.16*** 0.16*** 0.17*** 0.20*** 0.17*** 0.16*** 0.18*** 0.17*** 0.16***(sub-period 3) (3.58) (3.53) (3.80) (4.17) (3.81) (3.64) (4.03) (3.77) (3.60)
CIVLIB 0.21(sub-period 3) (0.26)
POLR 0.38(sub-period 3) (0.67)
HERITAGE 3.12(sub-period 3) (1.53)
GOVEFF 4.51**(sub-period 3) (2.23)
CONTROLC 3.13(sub-period 3) (1.49)
POLSTAB 1.38(sub-period 3) (1.07)
REGQUAL 4.13**(sub-period 3) (2.25)
RULEOFLAW 2.53(sub-period 3) (1.26)
VOICE 0.95(sub-period 3) (0.63)
N 74 74 74 74 74 74 74 74 74
Adj. R-squared 0.571 0.574 0.583 0.605 0.583 0.592 0.605 0.582 0.573
Dependent variable is the amount of debt relief per GDP in sub-period 3 (2000-2004). Absolute z-values in parentheses. * Signi cant at the 90 percent level.fi** Signi cant at the 95 percent level.fi*** Signi cant at the 99 percent level.fi

22
ECIPE WORKING PAPER
No. 02/2006
Although we still identify some sort of path dependence, as the highly signi cant coef cients fi fiof DR per GDP in sub-period 2 imply,37 the provision of debt relief in recent years seems to follow some prudential rules and to be conditioned on relatively decent policies rather than only the level of indebtedness and the amount of previous debt forgiveness. Two governance indicators (government effectiveness and regulatory quality) have had a signi cant effect on fithe decision of creditor countries to forgive debt as well as on the decision about the amount of debt relief.
Our ndings show a relevant and interesting policy result. Obviously, governments of donor ficountries seem to have learned and adjusted their forgiveness pattern to some extent. Debt relief at the beginning of the 21 st century still followed some sort of path dependence. The quality of governance indicators was more important in the third sub-period. It seems that international donors do pay attention to the criteria of the HIPC and HIPC II initiative that refer explicitly to poverty reduction and – at least implicitly – take some institutional aspects into account. This result is promising and suggests that the discussion of institutions in de -velopment, which has its roots in academic circles and has been transferred into the interna-tional development organiza-tions, has not only produced political statements but also some policy measures. A recent study by Heckelman & Knack (2006) reaches similar conclusions with respect to of cial development aid. Whereas in the 1980s institutions did not play a role fiin the decisions to grant aid, this in the 1990s has changed. At the same time when interna -tional donors started to link debt relief to institutional reforms, aid has been given – at least partially – depending on governance quality.
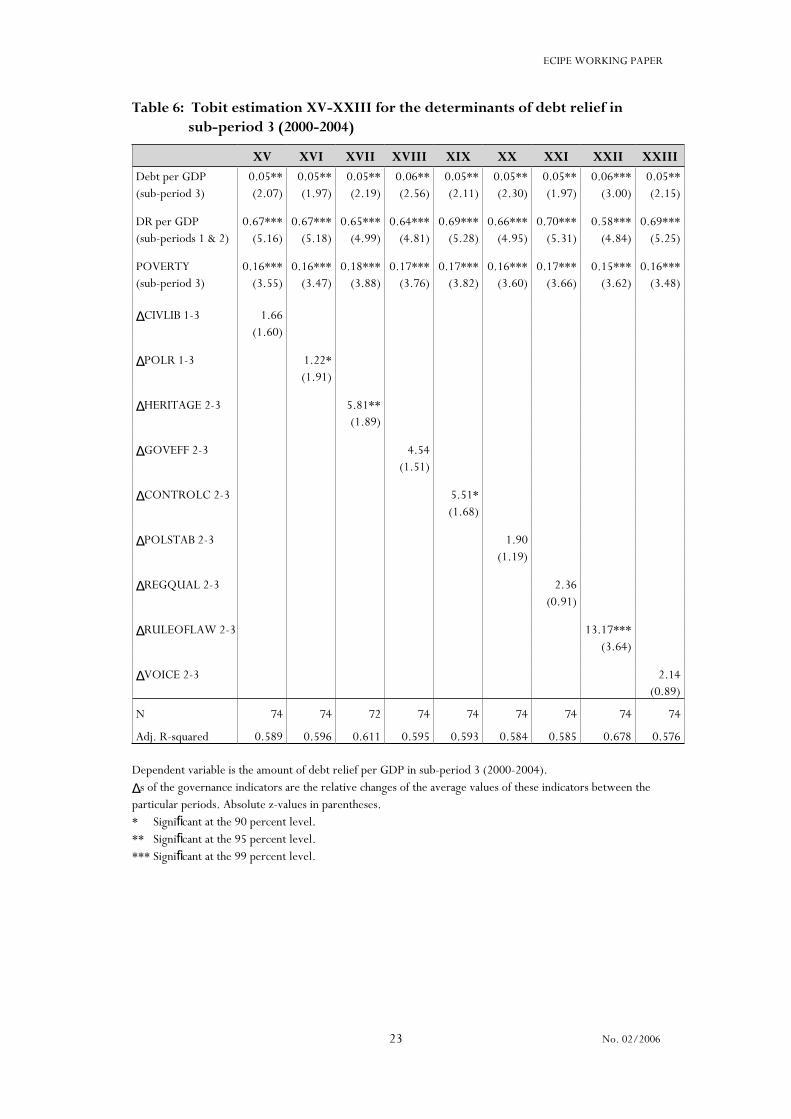
Finally we analyse whether or not debt relief was granted to acknowledge successful efforts to improve governance structures in debtor countries. In order to do so, in addition to the total values of our governance indicators (H6a), we also tested if the change in governance quality in uenced the pattern of debt relief at the beginning of the 21fl st century (H6b).
Table 6 shows that four of the eight variables reach (at least weak) signi cance with the imfi -provement in the rule of law being highly signi cant and most in uential (estimation XXII fi flwith the highest R2).
23
ECIPE WORKING PAPER
No. 02/2006
Table 6: Tobit estimation XV-XXIII for the determinants of debt relief in sub-period 3 (2000-2004)
XV XVI XVII XVIII XIX XX XXI XXII XXIIIDebt per GDP 0.05** 0.05** 0.05** 0.06** 0.05** 0.05** 0.05** 0.06*** 0.05**(sub-period 3) (2.07) (1.97) (2.19) (2.56) (2.11) (2.30) (1.97) (3.00) (2.15)
DR per GDP 0.67*** 0.67*** 0.65*** 0.64*** 0.69*** 0.66*** 0.70*** 0.58*** 0.69***(sub-periods 1 & 2) (5.16) (5.18) (4.99) (4.81) (5.28) (4.95) (5.31) (4.84) (5.25)
POVERTY 0.16*** 0.16*** 0.18*** 0.17*** 0.17*** 0.16*** 0.17*** 0.15*** 0.16***(sub-period 3) (3.55) (3.47) (3.88) (3.76) (3.82) (3.60) (3.66) (3.62) (3.48)
ΔCIVLIB 1-3 1.66(1.60)
ΔPOLR 1-3 1.22*(1.91)
ΔHERITAGE 2-3 5.81**(1.89)
ΔGOVEFF 2-3 4.54(1.51)
ΔCONTROLC 2-3 5.51*(1.68)
ΔPOLSTAB 2-3 1.90(1.19)
ΔREGQUAL 2-3 2.36(0.91)
ΔRULEOFLAW 2-3 13.17***(3.64)
ΔVOICE 2-3 2.14(0.89)
N 74 74 72 74 74 74 74 74 74
Adj. R-squared 0.589 0.596 0.611 0.595 0.593 0.584 0.585 0.678 0.576
Dependent variable is the amount of debt relief per GDP in sub-period 3 (2000-2004).
Δs of the governance indicators are the relative changes of the average values of these indicators between the particular periods. Absolute z-values in parentheses. * Signi cant at the 90 percent level.fi** Signi cant at the 95 percent level.fi*** Signi cant at the 99 percent level.fi
24
ECIPE WORKING PAPER
No. 02/2006
These ndings con rm that recent debt relief has been provided in favour of poor countries fi fithat have shown improvements in their governance quality, of course not neglecting the level of indebtedness and the amount of debt relief granted in the 1990s. It has to be noted that the signi cant institutional variables differ from those in Table 5. All in all these results are fipromising but the conclusions with respect to the learning effects in donor countries have to be careful and modest. However, looking at these results, our hypothesis H6b cannot be rejected.
6 CONCLUSIONS
Our ndings con rm the acknowledged cognition that debt forgiveness did not have a great fi fipositive impact of economic development in highly indebted poor countries and seem even to have been detrimental to growth in the past, at least in some countries. One reason for this rather unsatisfactory result is the inappropriate allocation pattern of debt relief in the 1990s. Analysing the determinants of debt relief programmes in the 1990s, we derive a standard re-sult of international political economy. Governments of creditor countries have granted debt relief rather because of political than of economic reasoning. “Political rationality” outreached “economical rationality” in the 1990s. In particular, we can con rm a path dependence with firespect to debt relief granted. However, recent debt relief programmes since 2000 seem to be positively in uenced by economic and institutional development. This may be the result flof a successful learning process of donor countries’ governments and a slight change in the allocation pattern of debt relief along with the introduction of some sensible criteria during the last decade. Recent debt relief seems to be – at least partly – driven by the improve -ment of governance structures in developing countries. Analysing debt forgiveness within the frame-work of the Enhanced HIPC initiative, one can nd a relation between grants and fiinstitutional quality. Institutional quality and good governance eventually are taken into ac-count in the decision-making processes of creditor countries and the International Financial Institutions right now. This is a very promising sign for those who still aim at development in highly indebted poor countries in the southern hemisphere. Before this result is taken for granted, however, more research is necessary. It also remains to be seen whether or not the G8’s Gleneagles Multilateral Debt Relief Initiative (MDRI) is also driven by economic ration-ality. Although our ndings give hope that this will be the case, the expectations of the impact fiof the MDRI should be kept modest. The effects will be long-term and probably dif cult to fimeasure.38 Our results strongly support the case for further conditionality in future debt relief programmes. They show that it is sensible for debtor countries to reform their policy structures to obtain a debt relief. Donor countries should maintain this signal and reward sound policies and improvements of governance quality in debtor countries.
25
ECIPE WORKING PAPER
No. 02/2006
Notes
1.We gratefully acknowledge helpful comments by Fredrik Erixon, Simon Renaud, Kristin Reichardt, Christoph Vietze and Hans-Juergen Wagener.
2. All in all, the agreements reached by the members of the Paris Club since the mid-1980s covered an amount of more than $500 billion so far. Of course, the amount of the debt that has been actually forgiven falls way behind the amount negotiated.
3. “Debt treatments are applied only for countries that need a rescheduling and that imple -ment reforms to resolve their payment dif culties. In practice conditionality is provided by fithe existence of an appropriate programme supported by the IMF, which demonstrates the need for debt relief.” (Paris Club 2006a)
4. For further details on the HIPC II initiatives see Andrews et al (1999).
5. The concept of debt overhang was initially introduced by Sachs (1983). See also Sachs (1989). Krugman (1988) de ned debt overhang as a situation in which the expected repayfi -ment on foreign debt falls short of the contrac-tual value of the debt.
6. Tengstam (2006) provides a multi-period model to show that debt relief stimulates adjust-ment even in the absence of an initial debt overhang and questions the hypothesis that a too generous debt relief might reduce the adjust-ment efforts of developing countries.
7. Claessens (1990) generally con rms the existence of the debt Laffer curve in a sample of fi29 highly indebted Sub-Saharan African countries but found only a handful on the “wrong” side of the inverted U-curve. Hansen (2001), recognizing a negative impact of the initial stock of external debt and debt service on growth for 54 developing countries, stressed that these relationships become insigni cant once some policy indicators are added to the regresfi -sion model.
8. The authors suggest that, at intermediate levels of debt, there is a negative relation be -tween the degree of indebtedness and economic growth. According to their study, the debt to GDP overhang lies between 25 and 40 percent. Once the debt irrelevance threshold is reached, this relation becomes nil.
9. The literature concentrates on effectiveness, one exception being Arsanalp & Henry (2005) who claim to deal with ef ciency, but rather model effectiveness. Ef ciency would imply that fi fian objective is met with a minimum of resources. This question is barely discussed in the literature.
10. See Rodrik, Subramanian & Trebbi (2004). Sachs (2003) questions the dominance of institutions and claims that geographical conditions are of special relevance to economic de-velopment.
11. “Even worse, debt-relief funds may be used to support activities that actually worsen poverty, such as war...” (Thomas 2001, p 42). However, the pleading for strong conditional-ity in order to force developing countries to introduce reforms is not undisputed. Dollar & Svensson (2000), analysing the failure of structural adjustment programmes, claim that the role of donors is to identify reformers, not to create them.

26
ECIPE WORKING PAPER
No. 02/2006
12. The political gains can be even increased if the debt relief initiative is a joint undertaking of many countries. In particular, the G8 provides a good platform for its members’ govern-ments to gain a competitive edge against the opposition at home. By forming a front, the governments can agree and assign a greater competence to each other. Thus, the opposition has moral as well as medial dif culties to argue against the policy deal. In addition, the moral fiand intellectual support of NGOs demanding debt relief can be obtained. This sort of history-related path depend-ence can be extended by looking at colonial history. Countries, which in the past were colonies of European G8-members, may be treated more generously than others. For a theoretical analysis see Vaubel (1991), for an applica-tion (to the G8’s initiative to bridge the global digital divide) see Freytag (2003).
13. This does not say that debt relief is useless in any poor country. The evidence however suggests that debt relief is more helpful in middle-income countries to reduce the debt over-hang (Arslanalp & Henry 2006) and that poor countries are poor mainly because of poor governance (Easterly 1999).
14. The fact that a country exports oil can be interpreted as “economic proximity” to major OECD countries, which consume the largest share of the world’s oil production. Barro & Lee (2005) suggest that economic proximity to the United States and major Western European countries is positively related to the probability and the size of IMF loans granted to a speci c ficountry. The oil abundance of Iran may be one reason for the intensive negotiating efforts undertaken by the EU to solve the problem of Iran’s nuclear strategy.
15. Although some HIPCs received debt relief in the HIPC initiative framework in the second sub-period, the vast amount of debt forgiveness has been delivered in the third sub-period.
16. The World Bank (2006).
17. The discovery and exploitation of large oil reserves in Equatorial Guinea caused a tre -mendous economic growth in recent years.
18. Freedom House (2005).
19. Transparency International (2005).
20. For the methodology of aggregating governance indicators see Kaufmann, Kraay & Mas-truzzi (KKM) (2005) and Kaufmann, Kraay & Zoido-Lobatón (1999).
21. Heritage Foundation (2006).
22. Fraser Institute (2005).
23. For a documentation of the methodology see Freedom House (2005).
24. For a documentation of the methodology see Lambsdorff (2005).
25. Interestingly, the correlation between the Fraser Index and most of the other institutional variables is pretty low, especially in the second sub-period. The coef cients of correlation are fisigni cantly higher in the third sub-period but still do not indicate a strong correlation.fi
26. Gwartney, Lawson & Gartzke (2005) provide a documentation of the methodology.

27
ECIPE WORKING PAPER
No. 02/2006
27. We do not report the results as they document only a very loose relationship between the dependent and the exogenous variables.
28. Neumayer (2002, p 920), using the same technique to prove if good governance has been rewarded, gives a similar justi cation. fi
29. Using the initial indebtedness at the beginning of the second sub-period as an alternative explanatory variable we got very similar results.
30. Sunk costs are costs that have already been incurred and which cannot be recovered to any signi cant degree. This, indeed, is true for debt relief and ODA payments granted in the fipast.
31. It should me mentioned that we, in addition to these interesting results, have not found evidence for a crowding out of ODA by debt relief in the 1990s at least not in the highly indebted countries.
32. Unfortunately, the availability of the CPI for the second sub-period did not meet our re-quirements. We therefore dropped the CPI as an independent variable in our estimates.
33. This pattern does not change if we use debt relief per GDP in the second sub-period as an independent variable.
34. The correlation between POVERTY and the debt burden (irrespectively of the measure applied) is rather low.
35. The coef cient for debt service per exports stands out as highly insigni cant and even has fi fia negative sign.
36. The coef cient for the CPI is positive but insigni cant, as well. The implementation of fi fithe CPI as the independent institutional variable basically produces the same results (with DR per GDP and POVERTY remaining highly signi cant) but affects the signi cance of the fi filevel of indebtedness (debt per GDP). This could be due to the reduced sample size, because the CPI does not cover all of the 74 countries included in the other estimations. Because of consistency we do not present the results in Table 5.
37. This variable measures the amount of debt relief relative to the GDP provided in both sub-periods.
38. This has been correctly stated by Moss (2006).

28
ECIPE WORKING PAPER
No. 02/2006
References
Alesina, A & Dollar, D (2000), “Who gives foreign aid to whom and why? Journal of Economic Growth, vol 5(1), pp 33-63.
Alesina, A & Weder, B (2002), “Do corrupt governments receive less foreign aid?” The Ameri-can Economic Review, vol 92(4), pp 1126-1137.
Andrews, D, Boote, A R & Rizavi, S S & Singh, S (1999), Debt relief for low-income countries : the enhanced HIPC initiative . Washington, DC: International Monetary Fund (IMF Pamphlet Series No. 51), <www.imf.org/external/pubs/ft/pam/pam51/contents.htm>.
Arslanalp, S & Henry, P B (2005), “Is debt relief ef cient?” fi The Journal of Finance, vol 60(2), pp 1017-1051.
Arslanalp, S & Henry, P B (2006), “Debt relief.” Journal of Economic Perspectives , vol 20(1), pp 207-220.
Bauer, P T (1991), The development frontier : essays in applied economics . London: Harvester Wheatsheaf.
Bhattacharya, R & Clements, B (2004), “Calculating the bene ts of debt relief.” fi Finance & Development, December.
Birdsall, N, Claessens, S & Diwan, I (2002), Will HIPC matter?: the debt game and donor behav-ior in Africa. London: Center for Economic Policy Research (CEPR Discussion Paper 3297;WIDER Discussion Paper No 50).
Birdsall, N, Claessens, S & Diwan, I (2003), “Policy selectivity forgone : debt and donor be-havior in Africa. The World Bank Economic Review, vol 17(3), pp 409-435.
Bird, G & Milne, A (2000), “Debt relief for poor countries : distinguishing rhetoric from real-ity.” New Economy, vol 7(4), pp 199-204.
Bird, G & Milne, A (2003), “Debt relief for low income countries : is it effective and effi -cient?” The World Economy, vol 26(1), pp 43-59.
Boote, A R & Thugge, K (1997), Debt relief for low-income countries and the HIPC initiative. Wash-ington, DC: International Monetary Fund (IMF Working Paper WP/97/24).
Chauvin, N D & Kraay, A (2005), “What has 100 billion dollars worth of debt relief done for low-income countries?” Washington (mimeo). Available at SSRN.
Claessens, S (1990), “The debt laffer curve : some estimates.” World Development, vol 18(12), pp 1671-1677.
Clements, B, Bhattacharya, R & Nguyen, T Q (2005), Can debt relief boost growth in poor coun-tries? Washington, DC: International Monetary Fund (IMF Economic Issues No 34).
Cordella, T, Ricci, L A & Ruiz-Arranz, M (2005), Deconstructing HIPCs’ debt overhang. Washing-ton, DC: International Monetary Fund.
29
ECIPE WORKING PAPER
No. 02/2006
Corden, W M (1991), “The theory of debt relief : sorting out some issues.” The Journal of Development Studies, vol 27(3), pp 135-145.
Deshpande, A (1997), “The debt overhang and the disincentive to invest.” Journal of Develop-ment Economics, vol 52(1), pp 169-187.
Dollar, D & Svensson, J (2000), “What explains the success or failure of structural adjustment programmes?” The Economic Journal, vol 110(466), pp 894-917.
Easterly, W (1999), How did highly indebted poor countries become highly indebted? : reviewing two decades of debt relief . Washington, DC: The World Bank (Policy Research Working Paper 2225).
Freytag, A (2003), “The global information society and development : smoke without a re? fiIn Fratianni, M, Savona, P & Kirton, J J (eds), Sustaining global growth and development . Aldershot: Ashgate, pp 65-79.
Gwartney, J, Lawson, R & Gartzke, E (2005), Economic freedom of the world : 2005 annual report. Vancouver, BC: Fraser Institute.
Hansen, H (2001), The impact of aid and external debt on growth and investment : insights from cross-country regression analysis. Paper presented at the WIDER Conference on Debt Relief 17-18 August 2001. Helsinki: United Nations University.
Heckelman, J & Knack, S (2006), Foreign aid and market liberalizing reforms . Winston- Salem, NC: Wake Forest University, mimeo (World Bank Policy Research Working Pa-per no 3557. Available at SSRN).
Hernández, L & Katada, S N (1996), Grants and debt forgiveness in Africa. Washington, DC: The World Bank (Policy Research Working Paper 1653).
Imbs, J & Ranciere, R (2005), The overhang hangover. Washington, DC: The World Bank (Policy Research Working Paper 3673).
IMF/IDA (2006), Heavily indebted poor countries initiative : statistical update . Washington, DC: International Monetary Fund.
Kaufmann, D, Kraay, A & Mastruzzi, M (2005), Governance matters IV : governance indicators for 1996-2004. Washington, DC: The World Bank (Policy Research Working Paper 3630).
Kaufmann, D, Kraay, A & Zoido-Lobatón, P (1999), Aggregating governance indicators. Wash-ington, DC: The World Bank (Policy Research Working Paper 2195).
Krugman, P (1988), “Financing vs forgiving debt overhang.” Journal of Development Economics, vol 29(3), pp 253-268.
Lambsdorff, J G (2005), The methodology of the TI Corruption Perceptions Index. Berlin: Transparency International (TI) and University of Passau, September.
Martin, M (2004), “Assessing the HIPC initiative : the key policy debates,” in Teunissen, J & Akkerman, A (eds), HIPC debt relief : myths and reality. The Hague: FONDAD, pp 11-47.
30
ECIPE WORKING PAPER
No. 02/2006
Michaelowa, K (2003), “The political economy of the enhanced HIPC-Initiative.” Public Choice, vol 114(3-4), pp 461-476.
Moss, T (2006), Will debt relief make a Difference? : impact and expectations of the Multilateral Debt Relief Initiative. Washington, DC: Center for Global Development (Working Paper Number 88).
Ndikumana, L (2003), “Additionality of debt relief and debt forgiveness, and implications for future volumes of of cial assistance.” fi International Review of Economics and Finance , vol 13(3), pp 325-340.
Neumayer, E (2002), “Is good governance rewarded? : a cross-national analysis of debt for -giveness.” World Development, vol 30(6), pp 913-930.
Pattillo, C, Poirson, H & Ricci, L (2002), External debt and growth. Washington, DC: Interna-tional Monetary Fund (IMF Working Paper WP/02/69).
Pettifor, A & Greenhill, R (2002), Debt relief and the millennium development goals : background paper. New York: United Nations Development Programme (Human Development Re-port 2003).
Rodrik, D, Subramanian, A & Trebbi, F (2004), “Institutions rule : the primacy of institutions over integration and geography in economic development.” Journal of Economic Growth , vol 9(2), pp 131-165.
Sachs, J (1983), Theoretical issues in international borrowing. Cambridge, MA: National Bureau of Economic Research (NBER Working Paper 1189).
Sachs, J (1989), “The debt overhang of developing countries,” in Calvo, G, Findlay, R, Kouri, P & de Macebo, J (eds), Debt stabilization and development : essays in memory of Carlos Diaz-Alejandro. Oxford: Blackwell, pp 80-102.
Sachs, J (2003), Institutions don’t rule : direct effects of geography on per capita income. Cambridge, MA: National Bureau of Economic Research (NBER Working Paper 9490).
Tengstam, S (2006), “Debt relief and adjustment effort in a multi-period model.” Economic Letters, vol 91(2006), pp 127-130.
Thomas, M A (2001), “Getting debt relief right.” Foreign Affairs, vol 80(5), pp 36-45.
Vaubel, R (1991), “A public choice view of international organization,” in Vaubel, R & Willett, T D (eds), The political economy of international organizations : a public choice ap -proach. Boulder, San Francisco and Oxford: Westview Press, pp 27-45.

31
ECIPE WORKING PAPER
No. 02/2006
Internet sources
CIA (2006), The world factbook, <www.cia.gov/cia/publications/factbook/index.html>.
Fraser Institute (2005), Economic freedom of the world. Various years, <www.freetheworld.com/download.html#efw>.
Freedom House (2005), Freedom in the world comparative rankings : 1973-2005, <www.freedomhouse.org/uploads/FIWrank7305.xls>.
Heritage Foundation (2006), Index of economic freedom. Various years, <www.heritage.org/research/features/index>.
HDR (2006), Human development report. Various years, <hdr.undp.org/reports/view_reports.cfm?type=1>.
IMF (2006), Data and statistics. (International Monetary Fund), <www.imf.org/external/data.htm>.
OECD (2006), “DAC online.” (OECD Development Assistance Committee), <www.oecd.org/dataoecd/50/16/5037775.htm>.
Paris Club (2006a), “Presentation : rules and principles,” <www.clubdeparis.org/en/presentation/presentation.php?BATCH=B01WP04>.
Paris Club (2006b), “Presentation : Cologne terms,” <www.clubdeparis.org/en/presentation/presentation.php?BATCH=B02WP07>.
The World Bank (2005), “Questions and answers : governance indicators,” <http://info.worldbank.org/governance/kkz2004/q&a.htm>.
The World Bank (2006), “JEDH database” (Joint External Debt Hub), <devdata.worldbank.org/sdmx/jedh/jedh_dbase.html>.
Transparency International (2005), Corruption perceptions index. Various years, <www.transparency.org/policy_research/surveys_indices/cpi>.
UNESCO (2006), “UIS database.” (UNESCO Institute for Statistics), <http://stats.uis.unesco.org/ReportFolders/reportfolders.aspx>.
WGI (Worldwide Governance Indicators : 1996-2005), World Bank, <http://web.worldbank.org/WBSITE/EXTERNAL/WBI/EXTWBIGOVANTCOR/0,,contentMDK:20771165~menuPK:1866365~pagePK:64168445~piPK:64168309~theSitePK:1740530,00.html>.
WHO (2006), Core health indicators (World Health Organization), <http://www3.who.int/whosis/core/core_select.cfm>.
WTO (2006), International trade statistics (World Trade Organization), <www.wto.org/english/res_e/statis_e/its2005_e/its05_appendix_e.htm>.