debug clns igrp packets - cisco.com · also use the show cls command to display additional...
TRANSCRIPT

Debug Commandsdebug clns igrp packets
197Cisco IOS Debug Command Reference
debug clns igrp packetsTo display debugging information on all ISO-IGRP routing activity, use the debug clns igrp packets privileged EXEC command. The no form of this command disables debugging output.
debug clns igrp packets
no debug clns igrp packets
Syntax Description This command has no arguments or keywords.
Examples The following is sample output from the debug clns igrp packets command:
Router# debug clns igrp packets
ISO-IGRP: Hello sent on Ethernet3 for DOMAIN_green1ISO-IGRP: Received hello from 39.0001.3333.3333.3333.00, (Ethernet3), ht 51ISO-IGRP: Originating level 1 periodic updateISO-IGRP: Advertise dest: 2222.2222.2222ISO-IGRP: Sending update on interface: Ethernet3ISO-IGRP: Originating level 2 periodic updateISO-IGRP: Advertise dest: 0001ISO-IGRP: Sending update on interface: Ethernet3ISO-IGRP: Received update from 3333.3333.3333 (Ethernet3)ISO-IGRP: Opcode: areaISO-IGRP: Received level 2 adv for 0001 metric 1100ISO-IGRP: Opcode: stationISO-IGRP: Received level 1 adv for 3333.3333.3333 metric 1100
The following line indicates that the router is sending a hello packet to advertise its existence in the DOMAIN_green1 domain:
ISO-IGRP: Hello sent on Ethernet3 for DOMAIN_green1
The following line indicates that the router received a hello packet from a certain network service access point (NSAP) on Ethernet interface 3. The hold time for this information is 51 seconds.
ISO-IGRP: Received hello from 39.0001.3333.3333.3333.00, (Ethernet3), ht 51
The following lines indicate that the router is generating a Level 1 update to advertise reachability to destination NSAP 2222.2222.2222 and that it is sending that update to all systems that can be reached through Ethernet interface 3:
ISO-IGRP: Originating level 1 periodic updateISO-IGRP: Advertise dest: 2222.2222.2222ISO-IGRP: Sending update on interface: Ethernet3
The following lines indicate that the router is generating a Level 2 update to advertise reachability to destination area 1 and that it is sending that update to all systems that can be reached through Ethernet interface 3:
ISO-IGRP: Originating level 2 periodic updateISO-IGRP: Advertise dest: 0001ISO-IGRP: Sending update on interface: Ethernet3
The following lines indicate that the router received an update from NSAP 3333.3333.3333 on Ethernet interface 3. This update indicated the area that the router at this NSAP could reach.

Debug Commandsdebug clns igrp packets
198Cisco IOS Debug Command Reference
ISO-IGRP: Received update from 3333.3333.3333 (Ethernet3)ISO-IGRP: Opcode: area
The following lines indicate that the router received an update advertising that the source of that update can reach area 1 with a metric of 1100. A station opcode indicates that the update included system addresses.
ISO-IGRP: Received level 2 adv for 0001 metric 1100ISO-IGRP: Opcode: station

Debug Commandsdebug clns packet
199Cisco IOS Debug Command Reference
debug clns packetTo display information about packet receipt and forwarding to the next interface, use the debug clns packet privileged EXEC command. The no form of this command disables debugging output.
debug clns packet
no debug clns packet
Syntax Description This command has no arguments or keywords.
Examples The following is sample output from the debug clns packet command:
Router# debug clns packet
CLNS: Forwarding packet size 157from 47.0023.0001.0000.0000.0003.0001.1920.3614.3002.00 STUPI-RBSto 47.0005.80ff.ef00.0000.0001.5940.1600.8906.4017.00via 1600.8906.4017 (Ethernet0 0000.0c00.bda8)
CLNS: Echo PDU received on Ethernet0 from 47.0005.80ff.ef00.0000.0001.5940.1600.8906.4017.00!
CLNS: Sending from 47.0005.80ff.ef00.0000.0001.5940.1600.8906.4023.00 to 47.0005.80ff.ef00.0000.0001.5940.1600.8906.4017.00via 1600.8906.4017 (Ethernet0 0000.0c00.bda8)
In the following lines, the first line indicates that a Connectionless Network Service (CLNS) packet of size 157 bytes is being forwarded. The second line indicates the network service access point (NSAP) and system name of the source of the packet. The third line indicates the destination NSAP for this packet. The fourth line indicates the next hop system ID, interface, and SNPA of the router interface used to forward this packet.
CLNS: Forwarding packet size 157from 47.0023.0001.0000.0000.0003.0001.1920.3614.3002.00 STUPI-RBSto 47.0005.80ff.ef00.0000.0001.5940.1600.8906.4017.00via 1600.8906.4017 (Ethernet0 0000.0c00.bda8)
In the following lines, the first line indicates that the router received an echo PDU on the specified interface from the source NSAP. The second line indicates which source NSAP is used to send a CLNS packet to the destination NSAP, as shown on the third line. The fourth line indicates the next hop system ID, interface, and SNPA of the router interface used to forward this packet.
CLNS: Echo PDU received on Ethernet0 from 47.0005.80ff.ef00.0000.0001.5940.1600.8906.4017.00!
CLNS: Sending from 47.0005.80ff.ef00.0000.0001.5940.1600.8906.4023.00 to 47.0005.80ff.ef00.0000.0001.5940.1600.8906.4017.00via 1600.8906.4017 (Ethernet0 0000.0c00.bda8)

Debug Commandsdebug clns routing
200Cisco IOS Debug Command Reference
debug clns routingTo display debugging information for all Connectionless Network Service (CLNS) routing cache updates and activities involving the CLNS routing table, use the debug clns routing privileged EXEC command. The no form of this command disables debugging output.
debug clns routing
no debug clns routing
Syntax Description This command has no arguments or keywords.
Examples The following is sample output from the debug clns routing command:
Router# debug clns routing
CLNS-RT: cache increment:17CLNS-RT: Add 47.0023.0001.0000.0000.0003.0001 to prefix table, next hop 1920.3614.3002CLNS-RT: Aging cache entry for: 47.0023.0001.0000.0000.0003.0001.1920.3614.3002.06CLNS-RT: Deleting cache entry for: 47.0023.0001.0000.0000.0003.0001.1920.3614.3002.06
The following line indicates that a change to the routing table has resulted in an addition to the fast-switching cache:
CLNS-RT: cache increment:17
The following line indicates that a specific prefix route was added to the routing table, and indicates the next hop system ID to that prefix route. In other words, when the router receives a packet with the prefix 47.0023.0001.0000.0000.0003.0001 in the destination address of that packet, it forwards that packet to the router with the MAC address 1920.3614.3002.
CLNS-RT: Add 47.0023.0001.0000.0000.0003.0001 to prefix table, next hop 1920.3614.3002
The following lines indicate that the fast-switching cache entry for a certain network service access point (NSAP) has been invalidated and then deleted:
CLNS-RT: Aging cache entry for: 47.0023.0001.0000.0000.0003.0001.1920.3614.3002.06CLNS-RT: Deleting cache entry for: 47.0023.0001.0000.0000.0003.0001.1920.3614.3002.06

Debug Commandsdebug cls message
201Cisco IOS Debug Command Reference
debug cls messageTo display information about Cisco Link Services (CLS) messages, use the debug cls message privileged EXEC command. The no form of this command disables debugging output.
debug cls message
no debug cls message
Syntax Description This command has no arguments or keywords.
Usage Guidelines The debug cls message command displays the primitives (state), selector, header length, and data size.
Examples The following is sample output from the debug cls message command. For example, CLS-->DLU indicates the direction of the flow that is described by the status. From CLS to DLU, a request was established to the connection endpoint. The header length is 48 bytes, and the data size is 104 bytes.
Router# debug cls message
(FRAS Daemon:CLS-->DLU):ID_STN.Ind to uSAP: 0x607044C4 sel: LLC hlen: 40, dlen: 54
(FRAS Daemon:CLS-->DLU):ID_STN.Ind to uSAP: 0x6071B054 sel: LLC hlen: 40, dlen: 46
(FRAS Daemon:DLU-->SAP):REQ_OPNSTN.Req to pSAP: 0x608021F4 sel: LLC hlen: 48, dlen: 104
(FRAS Daemon:CLS-->DLU):REQ_OPNSTN.Cfm(NO_REMOTE_STN) to uCEP: 0x607FFE84 sel: LLC hlen: 48, dlen: 104
The status possibilities include the following: enabled, disabled, request open station, open station, close station, activate SA, deactivate SAP, XID, XID station, connect station, signal station, connect, disconnect, connected, data, flow, unnumbered data, modify SAP, test, activate ring, deactivate ring, test station, and unnumbered data station.
Related Commands Command Description
debug fras error Displays information about FRAS protocol errors.
debug fras message Displays general information about FRAS messages.
debug fras state Displays information about FRAS data-link control state changes.

Debug Commandsdebug cls vdlc
202Cisco IOS Debug Command Reference
debug cls vdlcTo display information about Cisco Link Services (CLS) Virtual Data Link Control (VDLC), use the debug cls vdlc privileged EXEC command. The no form of this command disables debugging output.
debug cls vdlc
no debug cls vdlc
Syntax Description This command has no arguments or keywords.
Usage Guidelines The debug cls message command displays primitive state transitions, selector, and source and destination MAC and service access points (SAPs).
Also use the show cls command to display additional information on CLS VDLC.
Caution Use the debug cls vdlc command with caution because it can generate a substantial amount of output.
Examples The following messages are sample output from the debug cls vdlc command. In the following scenario, the SNA service point—also called native service point (NSP)—is setting up two connections through VDLC and data-link switching (DLSw): one from NSP to VDLC and one from DLSw to VDLC. VDLC joins the two.
The NSP initiates a connection from 4000.05d2.0001 as follows:
VDLC: Req Open Stn Req PSap 0x7ACE00, port 0x79DF98 4000.05d2.0001(0C)->4000.1060.1000(04)
In the next message, VDLC sends a test station request to DLSw for destination address 4000.1060.1000.
VDLC: Send UFrame E3: 4000.05d2.0001(0C)->4000.1060.1000(00)
In the next two messages, DLSw replies with test station response, and NSP goes to a half-open state. NSP is waiting for the DLSw connection to VDLC.
VDLC: Sap to Sap TEST_STN_RSP VSap 0x7B68C0 4000.1060.1000(00)->4000.05d2.0001(0C)VDLC: 4000.05d2.0001(0C)->4000.1060.1000(04): VDLC_OPENING->VDLC_HALF_OPEN
The NSP sends an exchange identification (XID) and changes state as follows:
VDLC: 4000.05d2.0001(0C)->4000.1060.1000(04): VDLC_HALF_OPEN->VDLC_XID_RSP_PENDINGVDLC: CEP to SAP ID_REQ 4000.05d2.0001(0C)->4000.1060.1000(04) via bridging SAP (DLSw)
In the next several messages, DLSw initiates its connection, which matches the half-open connection with NSP:
VDLC: Req Open Stn Req PSap 0x7B68C0, port 0x7992A0 4000.1060.1000(04)->4000.05d2.0001(0C)
VDLC: two-way connection establishedVDLC: 4000.1060.1000(04)->4000.05d2.0001(0C): VDLC_IDLE->VDLC_OPEN
In the following messages, DLSw sends an XID response, and NSP’s connection goes from the state XID Response Pending to Open. The XID exchange follows:

Debug Commandsdebug cls vdlc
203Cisco IOS Debug Command Reference
VDLC: CEP to CEP ID_RSP 4000.1060.1000(04)->4000.05d2.0001(0C) VDLC: 4000.05d2.0001(0C)->4000.1060.1000(04): VDLC_XID_RSP_PENDING->VDLC_OPENVDLC: 4000.05d2.0001(0C)->4000.1060.1000(04): VDLC_OPEN->VDLC_XID_RSP_PENDINGVDLC: CEP to CEP ID_REQ 4000.05d2.0001(0C)->4000.1060.1000(04) VDLC: CEP to CEP ID_RSP 4000.1060.1000(04)->4000.05d2.0001(0C) VDLC: 4000.05d2.0001(0C)->4000.1060.1000(04): VDLC_XID_RSP_PENDING->VDLC_OPENVDLC: 4000.05d2.0001(0C)->4000.1060.1000(04): VDLC_OPEN->VDLC_XID_RSP_PENDINGVDLC: CEP to CEP ID_REQ 4000.05d2.0001(0C)->4000.1060.1000(04) VDLC: CEP to CEP ID_RSP 4000.1060.1000(04)->4000.05d2.0001(0C) VDLC: 4000.05d2.0001(0C)->4000.1060.1000(04): VDLC_XID_RSP_PENDING->VDLC_OPENVDLC: 4000.05d2.0001(0C)->4000.1060.1000(04): VDLC_OPEN->VDLC_XID_RSP_PENDINGVDLC: CEP to CEP ID_REQ 4000.05d2.0001(0C)->4000.1060.1000(04) VDLC: CEP to CEP ID_RSP 4000.1060.1000(04)->4000.05d2.0001(0C) VDLC: 4000.05d2.0001(0C)->4000.1060.1000(04): VDLC_XID_RSP_PENDING->VDLC_OPENVDLC: 4000.05d2.0001(0C)->4000.1060.1000(04): VDLC_OPEN->VDLC_XID_RSP_PENDINGVDLC: CEP to CEP ID_REQ 4000.05d2.0001(0C)->4000.1060.1000(04)
When DLSw is ready to connect, the front-end processor (FEP) sends a set asynchronous balanced mode extended (SABME) command as follows:
VDLC: CEP to CEP CONNECT_REQ 4000.1060.1000(04)->4000.05d2.0001(0C) VDLC: 4000.05d2.0001(0C)->4000.1060.1000(04): VDLC_XID_RSP_PENDING->VDLC_OPEN
In the following messages, NSP accepts the connection and sends an unnumbered acknowledgment (UA) to the FEP:
VDLC: CEP to CEP CONNECT_RSP 4000.05d2.0001(0C)->4000.1060.1000(04) VDLC: FlowReq QUENCH OFF 4000.1060.1000(04)->4000.05d2.0001(0C)
The following messages show the data flow:
VDLC: DATA 4000.1060.1000(04)->4000.05d2.0001(0C) VDLC: DATA 4000.05d2.0001(0C)->4000.1060.1000(04) ...VDLC: DATA 4000.1060.1000(04)->4000.05d2.0001(0C) VDLC: DATA 4000.05d2.0001(0C)->4000.1060.1000(04)
Related Commands Command Description
debug cls message Displays information about CLS messages
Debug Commandsdebug compress
204Cisco IOS Debug Command Reference
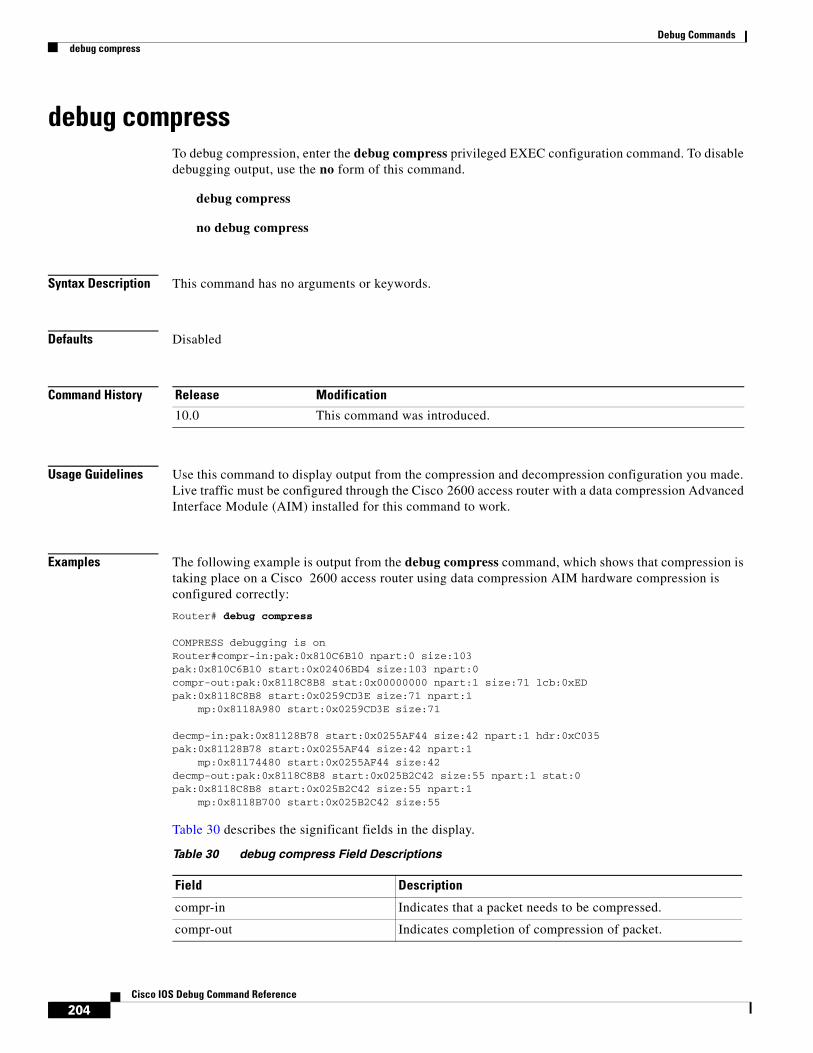
debug compressTo debug compression, enter the debug compress privileged EXEC configuration command. To disable debugging output, use the no form of this command.
debug compress
no debug compress
Syntax Description This command has no arguments or keywords.
Defaults Disabled
Command History
Usage Guidelines Use this command to display output from the compression and decompression configuration you made. Live traffic must be configured through the Cisco 2600 access router with a data compression Advanced Interface Module (AIM) installed for this command to work.
Examples The following example is output from the debug compress command, which shows that compression is taking place on a Cisco 2600 access router using data compression AIM hardware compression is configured correctly:
Router# debug compress
COMPRESS debugging is onRouter#compr-in:pak:0x810C6B10 npart:0 size:103pak:0x810C6B10 start:0x02406BD4 size:103 npart:0compr-out:pak:0x8118C8B8 stat:0x00000000 npart:1 size:71 lcb:0xEDpak:0x8118C8B8 start:0x0259CD3E size:71 npart:1 mp:0x8118A980 start:0x0259CD3E size:71
decmp-in:pak:0x81128B78 start:0x0255AF44 size:42 npart:1 hdr:0xC035pak:0x81128B78 start:0x0255AF44 size:42 npart:1 mp:0x81174480 start:0x0255AF44 size:42decmp-out:pak:0x8118C8B8 start:0x025B2C42 size:55 npart:1 stat:0pak:0x8118C8B8 start:0x025B2C42 size:55 npart:1 mp:0x8118B700 start:0x025B2C42 size:55
Table 30 describes the significant fields in the display.
Release Modification
10.0 This command was introduced.
Table 30 debug compress Field Descriptions
Field Description
compr-in Indicates that a packet needs to be compressed.
compr-out Indicates completion of compression of packet.

Debug Commandsdebug compress
205Cisco IOS Debug Command Reference
Related Commands
decmp-in Indicates receipt of a compressed packet that needs to be decompressed.
decmp-out Indicates completion of decompression of a packet.
pak:0x810C6B10 Provides the address in memory of a software structure that describes the compressed packet.
start:0x02406BD4 size:103 npart:0 The “npart:0” indicates that the packet is contained in a single, contiguous area of memory. The start address of the packet is 0x02406bd4 and the size of the packet is 103.
start:0x0259CD3E size:71 npart:1 The “npart:1” indicates that the packet is contained in 1 or more regions of memory. The start address of the packet is 0x0259CD3E and the size of the packet is 71.
mp:0x8118A980 start:0x0259CD3e size:71
Describes one of these regions of memory.
mp:0x8118A980 Provides the address of a structure describing this region.
start 0x0259CD3E Provides the address of the start of this region.
Table 30 debug compress Field Descriptions (continued)
Field Description
Command Description
debug frame-relay Displays debugging information about the packets that are received on a Frame Relay interface.
debug ppp Displays information on traffic and exchanges in an internetwork implementing the PPP.
show compress Displays compression statistics.
show diag Displays hardware information including DRAM, SRAM, and the revision-level information on the line card.

Debug Commandsdebug condition
206Cisco IOS Debug Command Reference
debug conditionTo limit output for some debugging commands based on specified conditions, use the debug condition privileged EXEC command. The no form of this command removes the specified condition.
debug condition {username username | called dial-string | caller dial-string}
no debug condition {condition-id | all}
Syntax Description
Defaults All debugging messages for enabled protocol-specific debug commands are generated.
Usage Guidelines Use the debug condition command to restrict the debug output for some commands. If any debug condition commands are enabled, output is only generated for interfaces associated with the specified username, called party number, or calling party number. In addition, this command enables debugging output for conditional debugging events. Messages are displayed as different interfaces meet specific conditions.
The no form of this command removes the debug condition specified by the condition identifier. The condition identifier is displayed after you enter a debug condition command or in the output of the show debug condition command. If the last condition is removed, debugging output resumes for all interfaces. You will be asked for confirmation before removing the last condition or all conditions.
Not all debugging output is affected by the debug condition command. Some commands generate output whenever they are enabled, regardless of whether they meet any conditions. The commands that are affected by the debug condition commands are generally related to dial access functions, where a large amount of output is expected. Output from the following commands is controlled by the debug condition command:
• debug aaa {accounting | authorization | authentication}
• debug dialer {events | packets}
• debug isdn {q921 | q931}
• debug modem {oob | trace}
• debug ppp {all | authentication | chap | error | negotiation | multilink events | packet}
username username Generates debugging messages for interfaces with the specified username.
called dial-string Generates debugging messages for interfaces with the called party number.
caller dial-string Generates debugging messages for interfaces with the calling party number.
condition-id Removes the condition indicated.
all Removes all debugging conditions, and conditions specified by the debug condition interface command. Use this keyword to disable conditional debugging and reenable debugging for all interfaces.

Debug Commandsdebug condition
207Cisco IOS Debug Command Reference
Examples In the following example, the router displays debugging messages only for interfaces that use a username of fred. The condition identifier displayed after the command is entered identifies this particular condition.
Router# debug condition username fred
Condition 1 set
Related Commands Command Description
debug condition interface Limits output for some debugging commands based on the interfaces.

Debug Commandsdebug condition interface
208Cisco IOS Debug Command Reference
debug condition interfaceTo limit output for some debugging commands based on the interface, use the debug condition interface privileged EXEC command. The no form of this command removes the interface condition and resets the interface so that it must be triggered by a condition.
debug condition interface {interface | all}
no debug condition interface {interface | all}
Syntax Description
Defaults All debug messages for enabled debugging commands are displayed.
Usage Guidelines Use this command to restrict the debug output for some commands to output based on its related interface. When you enter this command, debugging output is turned off for all interfaces except the specified interface. In addition, this command enables debugging output for conditional debugging events. Messages are displayed as different interfaces meet specific conditions.
The no form of the command has two functions:
• It disables the debug condition interface command for the specified interface. Output is no longer generated for the interface, assuming that the interface meets no other conditions. If the interface meets other active conditions, as set by another debug condition command, debugging output will still be generated for the interface.
• The command also resets the debugging trigger on the interface. If some other debug condition command has been enabled, this command resets the trigger on the interface. Output is stopped for that interface until the condition is met on the interface.
You will be asked for confirmation before removing the last condition or all conditions.
Not all debugging output is affected by the debug condition command. Some commands generate output whenever they are enabled, regardless of whether they meet any conditions. The commands that are affected by the debug condition commands are generally related to dial access functions, where a large amount of output is expected. Output from the following commands is controlled by the debug condition command:
• debug aaa {accounting | authorization | authentication}
• debug dialer {events | packets}
• debug isdn {q921 | q931}
• debug modem {oob | trace}
• debug ppp {all | authentication | chap | error | negotiation | multilink events | packet}
Examples In this example, only debug command output related to serial interface 1 is displayed. The condition identifier for this command is 1.
Router# debug condition interface serial1
interface The interface type and number.
all Displays all interfaces.

Debug Commandsdebug condition interface
209Cisco IOS Debug Command Reference
Condition 1 set
Related Commands Command Description
debug condition Limits output for some debugging commands based on specific conditions.

Debug Commandsdebug condition standby
210Cisco IOS Debug Command Reference
debug condition standbyTo filter the output of the debug standby command on the basis of interface and Hot Standby Router Protocol (HSRP) group number, use the debug condition standby command in privileged EXEC mode. To remove the specified filter condition, use the no form of this command.
debug condition standby interface group-number
no debug condition standby interface group-number
Syntax Description
Defaults All debugging messages for the debug standby command aregenerated.
Command Modes Privileged EXEC
Command History
Usage Guidelines Use the debug condition standby command to restrict the debug output for the debug standby command. If the debug condition standby command is enabled, output is generated only for the interfaces and HSRP group numbers specified. The interface you specify must be a valid interface capable of supporting HSRP. The group can be any group (0 to 255 for HSRPv1 and 0 to 4095 for HSRPv2).
Use the no form of this command to remove the HSRP debug condition. If the last condition is removed, debugging output resumes for all interfaces. You will be asked for confirmation before removing the last condition or all conditions.
You can set debug conditions for groups that do not exist, which allows you to capture debug information during the initialization of a new group.
You must enable the debug standby command in order for any HSRP debug output to be produced. If you do not configure the debug condition standby command after entering the debug standby command, then debug output is produced for all groups on all interfaces.
Examples In the following example, the router displays debugging messages only for Ethernet interface 0/0 that are part of HSRP group 23:
Router# debug standbyHSRP debugging is on
Router# debug condition standby ethernet0/0 23
interface Filters output on the basis of the interface.
group-number Filters output on the basis of HSRP group number. The range is 0 to 255 for HSRP Version 1 and 0 to 4095 for HSRP Version 2.
Release Modification
12.1(2) This command was introduced.

Debug Commandsdebug condition standby
211Cisco IOS Debug Command Reference
Condition 1 set00:27:39: HSRP: Et0/0 Grp 23 Hello out 10.0.0.1 Active pri 100 vIP 172.16.6.500:27:42: HSRP: Et0/0 Grp 23 Hello out 10.0.0.1 Active pri 100 vIP 172.16.6.500:27:45: HSRP: Et0/0 Grp 23 Hello out 10.0.0.1 Active pri 100 vIP 172.16.6.500:27:48: HSRP: Et0/0 Grp 23 Hello out 10.0.0.1 Active pri 100 vIP 172.16.6.500:27:51: HSRP: Et0/0 Grp 23 Hello out 10.0.0.1 Active pri 100 vIP 172.16.6.5
The following example shows how to remove an HSRP debug condition:
Router# no debug condition standby ethernet0/0 23
This condition is the last hsrp condition set.Removing all conditions may cause a flood of debuggingmessages to result, unless specific debugging flagsare first removed.
Proceed with removal? [yes/no]: YCondition 1 has been removed.
Related Commands Command Description
debug condition interface Limits output for some debugging commands based on the interfaces.
debug standby Displays HSRP state changes.
debug standby errors Displays error messages related to HSRP.
debug standby events Displays events related to HSRP.
debug standby events icmp Displays debugging messages for the HSRP ICMP redirects filter.
debug standby packets Displays debugging information for packets related to HSRP.

Debug Commandsdebug confmodem
212Cisco IOS Debug Command Reference
debug confmodemTo display information associated with the discovery and configuration of the modem attached to the router, use the debug confmodem privileged EXEC command. The no form of this command disables debugging output.
debug confmodem
no debug confmodem
Syntax Description This command has no arguments or keywords.
Usage Guidelines The debug confmodem command is used in debugging configurations that use the modem autoconfig command.
Examples The following is sample output from the debug confmodem command. In the first three lines, the router is searching for a speed at which it can communicate with the modem. The remaining lines show the actual sending of the modem command.
Router# debug confmodem
TTY4:detection speed(115200) response ------TTY4:detection speed(57600) response ------TTY4:detection speed(38400) response ---OK---TTY4:Modem command: --AT&F&C1&D2S180=3S190=1S0=1--TTY4: Modem configuration succeededTTY4: Done with modem configuration

Debug Commandsdebug cops
213Cisco IOS Debug Command Reference
debug copsTo display a one-line summary of each COPS message sent from and received by the router, use the debug cops privileged EXEC command. Use the no form of this command to disable the debug output.
debug cops [detail]
no debug cops [detail]
Syntax Description
Defaults COPS process debugging is not enabled.
Command History
Usage Guidelines To generate a complete record of the policy process, enter this command and, after entering a carriage return, enter the additional command debug ip rsvp policy.
Examples This first example displays the one-line COPS message summaries, as the router goes through six different events.
Router# debug cops
COPS debugging is on
Event 1
The router becomes configured to communicate with a policy server:
Router# configure terminal
Enter configuration commands, one per line. End with CNTL/Z.Router(config)# ip rsvp policy cops servers 2.0.0.1Router(config)#15:13:45:COPS: Opened TCP connection to 2.0.0.1/328815:13:45:COPS: ** SENDING MESSAGE ** 15:13:45:COPS OPN message, Client-type:1, Length:28. Handle:[NONE]15:13:45:COPS: ** RECEIVED MESSAGE ** 15:13:45:COPS CAT message, Client-type:1, Length:16. Handle:[NONE]Router(config)#
Event 2
The router receives a PATH message:
15:13:53:COPS:** SENDING MESSAGE **
detail (Optional) Displays additional debug information, including the contents of COPS and RSVP messages.
Release Modification
12.1(1)T This command was introduced.

Debug Commandsdebug cops
214Cisco IOS Debug Command Reference
15:13:53:COPS REQ message, Client-type:1, Length:216. Handle:[ 00 00 04 01]15:13:53:COPS:** RECEIVED MESSAGE ** 15:13:53:COPS DEC message, Client-type:1, Length:104. Handle:[ 00 00 04 01]Router(config)#
Event 3
The router receives a unicast FF RESV message:
15:14:00:COPS:** SENDING MESSAGE ** 15:14:00:COPS REQ message, Client-type:1, Length:148. Handle:[ 00 00 05 01]15:14:00:COPS:** RECEIVED MESSAGE ** 15:14:00:COPS DEC message, Client-type:1, Length:64. Handle:[ 00 00 05 01]15:14:00:COPS:** SENDING MESSAGE ** 15:14:00:COPS RPT message, Client-type:1, Length:24. Handle:[ 00 00 05 01]Router(config)#
Event 4
The router receives a RESV tear:
15:14:06:COPS:** SENDING MESSAGE ** 15:14:06:COPS DRQ message, Client-type:1, Length:24. Handle:[ 00 00 05 01]Router(config)#
Event 5
The router receives a PATH tear:
15:14:11:COPS:** SENDING MESSAGE ** 15:14:11:COPS DRQ message, Client-type:1, Length:24. Handle:[ 00 00 04 01]Router(config)#
Event 6
The router gets configured to cease communicating with the policy server:
Router(config)# no ip rsvp policy cops servers15:14:23:COPS:** SENDING MESSAGE ** 15:14:23:COPS CC message, Client-type:1, Length:16. Handle:[NONE]15:14:23:COPS:Closed TCP connection to 2.0.0.1/3288Router(config)#
This second example uses the detail keyword to display the contents of the COPS and RSVP messages, and additional debugging information:
Router# debug cops detail
COPS debugging is on
02:13:29:COPS:** SENDING MESSAGE ** COPS HEADER:Version 1, Flags 0, Opcode 1 (REQ), Client-type:1, Length:216 HANDLE (1/1) object. Length:8. 00 00 21 01 CONTEXT (2/1) object. Length:8. R-type:5. M-type:1 IN_IF (3/1) object. Length:12. Address:10.1.2.1. If_index:4 OUT_IF (4/1) object. Length:12. Address:10.33.0.1. If_index:3 CLIENT SI (9/1) object. Length:168. CSI data:02:13:29: SESSION type 1 length 12:02:13:29: Destination 10.33.0.1, Protocol_Id 17, Don't Police , DstPort 44

Debug Commandsdebug cops
215Cisco IOS Debug Command Reference
02:13:29: HOP type 1 length 12:0A01020102:13:29: :0000000002:13:29: TIME_VALUES type 1 length 8 :0000753002:13:29: SENDER_TEMPLATE type 1 length 12:02:13:29: Source 10.31.0.1, udp_source_port 4402:13:29: SENDER_TSPEC type 2 length 36:02:13:29: version=0, length in words=702:13:29: Token bucket fragment (service_id=1, length=6 words02:13:29: parameter id=127, flags=0, parameter length=502:13:29: average rate=1250 bytes/sec, burst depth=10000 bytes02:13:29: peak rate =1250000 bytes/sec02:13:29: min unit=0 bytes, max unit=1514 bytes02:13:29: ADSPEC type 2 length 84:02:13:29: version=0 length in words=1902:13:29: General Parameters break bit=0 service length=802:13:29: IS Hops:102:13:29: Minimum Path Bandwidth (bytes/sec):125000002:13:29: Path Latency (microseconds):002:13:29: Path MTU:150002:13:29: Guaranteed Service break bit=0 service length=802:13:29: Path Delay (microseconds):19200002:13:29: Path Jitter (microseconds):120002:13:29: Path delay since shaping (microseconds):19200002:13:29: Path Jitter since shaping (microseconds):120002:13:29: Controlled Load Service break bit=0 service length=002:13:29:COPS:Sent 216 bytes on socket, 02:13:29:COPS:Message event!02:13:29:COPS:State of TCP is 402:13:29:In read function02:13:29:COPS:Read block of 96 bytes, num=104 (len=104)02:13:29:COPS:** RECEIVED MESSAGE ** COPS HEADER:Version 1, Flags 1, Opcode 2 (DEC), Client-type:1, Length:104 HANDLE (1/1) object. Length:8. 00 00 21 01 CONTEXT (2/1) object. Length:8. R-type:1. M-type:1 DECISION (6/1) object. Length:8. COMMAND cmd:1, flags:0 DECISION (6/3) object. Length:56. REPLACEMENT 00 10 0E 01 61 62 63 64 65 66 67
68 69 6A 6B 6C 00 24 0C 02 0000 00 07 01 00 00 06 7F 00 00 05 44 9C 40 00 46 1C 40 00 49 9896 80 00 00 00 C8 00 00 01 C8
CONTEXT (2/1) object. Length:8. R-type:4. M-type:1 DECISION (6/1) object. Length:8. COMMAND cmd:1, flags:0
02:13:29:Notifying client (callback code 2)02:13:29:COPS:** SENDING MESSAGE ** COPS HEADER:Version 1, Flags 1, Opcode 3 (RPT), Client-type:1, Length:24 HANDLE (1/1) object. Length:8. 00 00 21 01 REPORT (12/1) object. Length:8. REPORT type COMMIT (1)
02:13:29:COPS:Sent 24 bytes on socket, 02:13:29:Timer for connection entry is zero
To see an example where the debug cops command is used along with the debug ip rsvp policy command, refer to the second example of the debug ip rsvp policy command.
Related Commands Command Description
debug ip rsvp policy Displays debug messages for RSVP policy processing.

Debug Commandsdebug cot
216Cisco IOS Debug Command Reference
debug cotTo display information about the COT functionality, use the debug cot privileged EXEC command. The no form of this command disables debugging output.
debug cot {api | dsp | queue | detail}
no debug cot {api | dsp | queue | detail}
Syntax Description
Command History
Examples The following is sample output of the debug cot api command.
Figure 2 Sample debug cot api Command Output
Router# debug cot api
COT API debugging is on08:29:55: cot_request_handler(): CDB@0x60DEDE14, req(COT_CHECK_TONE_ON):08:29:55: shelf 0 slot 0 appl_no 1 ds0 108:29:55: freqTX 2010 freqRX 1780 key 0xFFF1 duration 60000
Table 31 describes the significant fields in the display.
api Displays information about the COT Application Program Interface (API).
dsp Displays information related to the COT/DSP interface. Typical DSP functions include data modems, voice codecs, fax modems and codecs, and low-level signaling such as CAS/R2.
queue Display information related to the COT internal queue.
detail Display information about COT internal detail; summary of the debug cot api, debug cot dsp, and debug cot queue commands.
Release Modification
11.3(7) This command was introduced.
Table 31 debug cot api Field Descriptions
Field Description
CDB Internal controller information.
req Type of COT operation requested.
shelf Shelf ID of the COT operation request.
slot Designates the slot number, 1 to 4.
appl-no Hardware unit that provides the external interface connections from a router to the network.
ds0 Number of the COT operation request.
key COT operation identifier.
duration Timeout duration of the COT operation.

Debug Commandsdebug cot
217Cisco IOS Debug Command Reference
The following is sample output of the debug cot dsp command.
Figure 3 Sample debug cot dsp Command Output
Router# debug cot dsp
Router#00:10:42:COT:DSP (1/1) Allocated00:10:43:In cot_callback00:10:43: returned key 0xFFF1, status = 000:10:43:COT:Received DSP Q Event00:10:43:COT:DSP (1/1) Done00:10:43:COT:DSP (1/1) De-allocated
Table 32 describes the significant fields in the display.
The following is sample output of the debug cot queue command.
Router# debug cot queue
Router#00:11:26:COT(0x60EBB48C):Adding new request (0x61123DBC) to InProgress Q00:11:26:COT(0x60EBB48C):Adding COT(0x61123DBC) to the Q head00:11:27:In cot_callback00:11:27: returned key 0xFFF1, status = 0
freqTX Requested transmit tone frequency.
freqRX Requested receive tone frequency.
Table 31 debug cot api Field Descriptions (continued)
Field Description
Table 32 debug cot dsp Field Descriptions
Field Description
DSP (1/1) Allocated Slot and port of the DSP allocated for the COT operation.
Received DSP Q Event Indicates the COT subsystem received an event from the DSP.
DSP (1/1) Done Slot and port of the DSP transitioning to IDLE state.
DSP (1/1) De-allocated Slot and port of the DSP de-allocated after the completion of the COT operation.

Debug Commandsdebug cot
218Cisco IOS Debug Command Reference
Table 33 describes the significant fields in the display.
The following is sample output of the debug cot detail command.
Router# debug cot detail
Router#00:04:57:cot_request_handler():CDB@0x60EBB48C, req(COT_CHECK_TONE_ON):
00:04:57: shelf 0 slot 0 appl_no 1 ds0 100:04:57: freqTX 1780 freqRX 2010 key 0xFFF1 duration 1000
00:04:57:COT:DSP (1/0) Allocated00:04:57:COT:Request Transition to COT_WAIT_TD_ON00:04:57:COT(0x60EBB48C):Adding new request (0x61123DBC) to InProgress Q00:04:57:COT(0x60EBB48C):Adding COT(0x61123DBC) to the Q head00:04:57:COT:Start Duration Timer for Check Tone Request00:04:58:COT:Received Timer Event00:04:58:COT:T24 Timer Expired00:04:58:COT Request@ 0x61123DBC, CDB@ 0x60EBB48C, Params@0x61123E0800:04:58: request type = COT_CHECK_TONE_ON00:04:58: shelf 0 slot 0 appl_no 1 ds0 100:04:58: duration 1000 key FFF1 freqTx 1780 freqRx 201000:04:58: state COT_WAIT_TD_ON_CT00:04:58: event_proc(0x6093B55C)
00:04:58:Invoke NI2 callback to inform COT request status00:04:58:In cot_callback00:04:58: returned key 0xFFF1, status = 000:04:58:Return from NI2 callback00:04:58:COT:Request Transition to IDLE00:04:58:COT:Received DSP Q Event00:04:58:COT:DSP (1/0) Done00:04:58:COT:DSP (1/0) De-allocated
Because the debug cot detail command is a summary of the debug cot api, debug cot dsp, and debug cot queue commands, the field descriptions are the same.
Table 33 debug cot api Field Descriptions
Field Description
COT Internal COT operation request.
Adding new request Internal COT operation request queue.

Debug Commandsdebug cpp event
219Cisco IOS Debug Command Reference
debug cpp eventTo display general Combinet Proprietary Protocol (CPP) events, use the debug cpp event privileged EXEC command. The no form of this command disables debugging output.
debug cpp event
no debug cpp event
Syntax Description This command has no arguments or keywords.
Usage Guidelines CPP allows a router to engage in negotiation over an ISDN B channel to establish connections with a Combinet bridge.
The debug cpp event command displays events such as CPP sequencing, group creation, and keepalives.
Examples One or more of the messages in Table 34 appear when you use the debug cpp event command. Each message begins with the short name of the interface the event occurred on (for example, SERIAL0:1 or BRI0:1) and might contain one or more packet sequence numbers or remote site names.
Related Commands
Table 34 debug cpp event Messages
Message Description
BRI0:1: negotiation complete Call was set up on the interface (in this example, BRI0:1).
BRI0:1: negotiation timed out Call timed out.
BRI0:1: sending negotiation packet Negotiation packet was sent to set up the call.
BRI0:1: out of sequence packet - got 10, range 1 8
Packet was received that was out of sequence. The first number displayed in the message is the sequence number received, and the following numbers are the range of valid sequence numbers.
BRI0:1: Sequence timer expired - Lost 11 Trying sequence 12
Timer expired before the packet was received. The first number displayed in the message is the sequence number of the packet that was lost, and the second number is the next sequence number.
BRI0:1: Line Integrity Violation Router fails to maintain keepalives.
BRI0:1: create cpp group ber19 destroyed cpp group ber19
Dialer group is created on the remote site (in this example, ber19).
Command Description
debug cpp negotiation Displays CPP negotiation events.
debug cpp packet Displays CPP packets.

Debug Commandsdebug cpp negotiation
220Cisco IOS Debug Command Reference
debug cpp negotiationTo display Combinet Proprietary Protocol (CPP) negotiation events, use the debug cpp negotiation privileged EXEC command. The no form of this command disables debugging output.
debug cpp negotiation
no debug cpp negotiation
Syntax Description This command has no arguments or keywords.
Usage Guidelines CPP allows a router to engage in negotiation over an ISDN B channel to establish connections with a Combinet bridge.
The debug cpp negotiation command displays events such as the type of packet and packet size being sent.
Examples The following is sample output from the debug cpp negotiation command. In this example, a sample connection is shown.
Router# debug cpp negotiation
%LINK-3-UPDOWN: Interface BRI0: B-Channel 2, changed state to down%LINK-3-UPDOWN: Interface BRI0, changed state to up%SYS-5-CONFIG_I: Configured from console by console%LINK-3-UPDOWN: Interface BRI0: B-Channel 1, changed state to upBR0:1:(I) NEG packet - len 77
attempting proto:2ether id:0040.f902.c7b4port 1 number:5559876port 2 number:5559876origination port:1remote name:berl9password is correct
The following describes the significant fields in the display.
Table 35 Debug CPP Negotiation Field Descriptions
Field Description
BR0:1 (I) NEG packet - len 77 Interface name, packet type, and packet size.
attempting proto: CPP protocol type.
ether id: Ethernet address of the destination router.
port 1 number: ISDN phone number of remote B channel #1.
port 2 number: ISDN phone number of remote B channel #2.
origination port: B channel 1 or 2 called.
remote name: Remote site name to which this call is connecting.
password is correct Password is accepted so the connection is established.

Debug Commandsdebug cpp negotiation
221Cisco IOS Debug Command Reference
Related Commands Command Description
debug cot Displays information about the COT functionality.
debug cpp packet Displays CPP packets.

Debug Commandsdebug cpp packet
222Cisco IOS Debug Command Reference
debug cpp packetTo display Combinet Proprietary Protocol (CPP) packets, use the debug cpp packet privileged EXEC command. The no form of this command disables debugging output.
debug cpp packet
no debug cpp packet
Syntax Description This command has no arguments or keywords.
Usage Guidelines CPP allows a router to engage in negotiation over an ISDN B channel to establish connections with a Combinet bridge.
The debug cpp packet command displays the hexadecimal values of the packets.
Examples The following is sample output from the debug cpp packet command. This example shows the interface name, packet type, packet size, and the hexadecimal values of the packet.
Router# debug cpp packet
BR0:1:input packet - len 6000 00 00 00 00 00 00 40 F9 02 C7 B4 08 0.!6 00 01 08 00 06 04 00 02 00 40 F9 02 C7 B4 83 6C A1 02!!!Success rate is 80 percent (4/5), round-trip min/avg/max = 64/66/68 msBR0:1 output packet - len 11606 00 00 40 F9 02 C7 B4 00 00 0C 3E 12 3A 08 00 45 00 00 64 00 01 00 00 FF 01 72 BB 83 6C A1 01
Related Commands Command Description
debug cot Displays information about the COT functionality.
debug cpp negotiation Displays CPP negotiation events.

Debug Commandsdebug crypto engine
223Cisco IOS Debug Command Reference
debug crypto engineTo display debug messages about crypto engines, which perform encryption and decryption, use the debug crypto engine privileged EXEC command. To disable debugging output, use the no form of this command.
debug crypto engine
no debug crypto engine
Syntax Description This command has no arguments or keywords.
Command History
Usage Guidelines Use the debug crypto engine command to display information pertaining to the crypto engine, such as when Cisco IOS software is performing encryption or decryption operations.
The crypto engine is the actual mechanism that performs encryption and decryption. A crypto engine can be software or a hardware accelerator. Some platforms can have multiple crypto engines; therefore, the router will have multiple hardware accelerators.
Examples The following is sample output from the debug crypto engine command. The first sample output shows messages from a router that successfully generates RSA keys. The second sample output shows messages from a router that decrypts the RSA key during Internet Key Exchange (IKE) negotiation.
Router# debug crypto engine
00:25:13:CryptoEngine0:generate key pair00:25:13:CryptoEngine0:CRYPTO_GEN_KEY_PAIR00:25:13:CRYPTO_ENGINE:key process suspended and continued00:25:14:CRYPTO_ENGINE:key process suspended and continuedcr
Router# debug crypto engine
00:27:45:%SYS-5-CONFIG_I:Configured from console by console00:27:51:CryptoEngine0:generate alg parameter00:27:51:CRYPTO_ENGINE:Dh phase 1 status:000:27:51:CRYPTO_ENGINE:Dh phase 1 status:000:27:51:CryptoEngine0:generate alg parameter00:27:52:CryptoEngine0:calculate pkey hmac for conn id 000:27:52:CryptoEngine0:create ISAKMP SKEYID for conn id 100:27:52:Crypto engine 0:RSA decrypt with public key00:27:52:CryptoEngine0:CRYPTO_RSA_PUB_DECRYPT00:27:52:CryptoEngine0:generate hmac context for conn id 100:27:52:CryptoEngine0:generate hmac context for conn id 100:27:52:Crypto engine 0:RSA encrypt with private key
Release Modification
12.0 This command was introduced.

Debug Commandsdebug crypto engine
224Cisco IOS Debug Command Reference
00:27:52:CryptoEngine0:CRYPTO_RSA_PRIV_ENCRYPT00:27:53:CryptoEngine0:clear dh number for conn id 100:27:53:CryptoEngine0:generate hmac context for conn id 100:27:53:validate proposal 000:27:53:validate proposal request 000:27:54:CryptoEngine0:generate hmac context for conn id 100:27:54:CryptoEngine0:generate hmac context for conn id 100:27:54:ipsec allocate flow 000:27:54:ipsec allocate flow 0
Related Commands Command Description
crypto key generate rsa Generates RSA key pairs.
Debug Commandsdebug crypto engine accelerator logs
225Cisco IOS Debug Command Reference
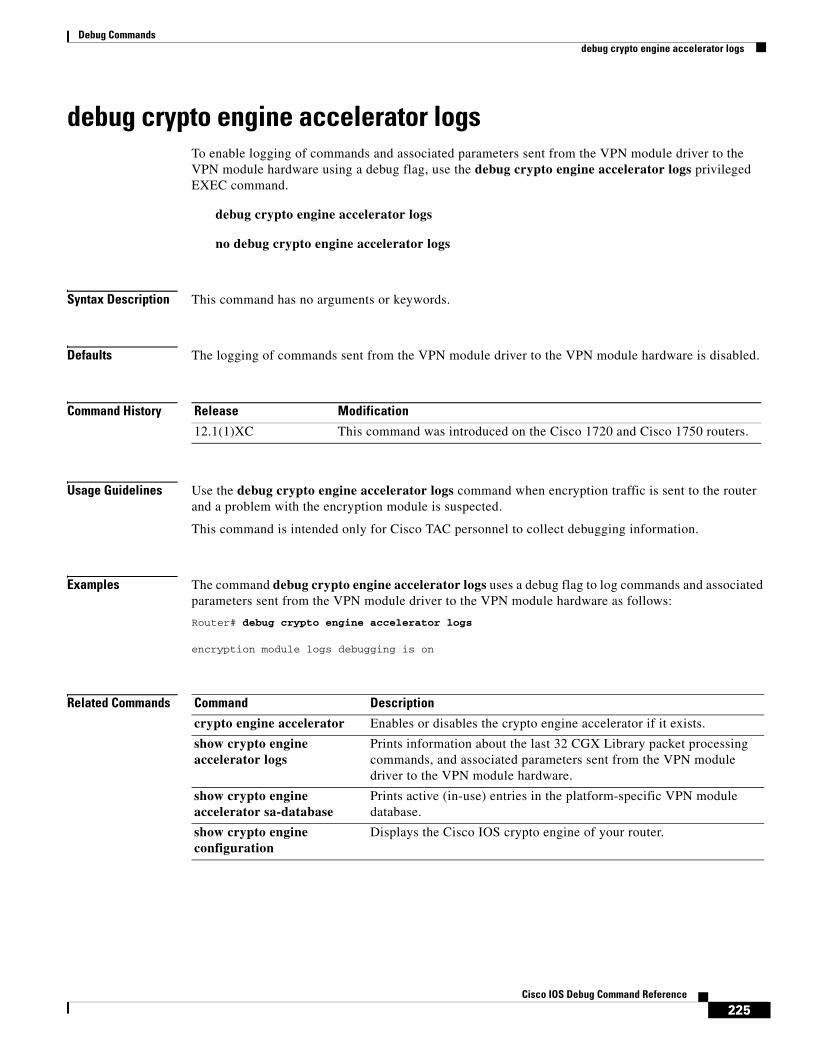
debug crypto engine accelerator logsTo enable logging of commands and associated parameters sent from the VPN module driver to the VPN module hardware using a debug flag, use the debug crypto engine accelerator logs privileged EXEC command.
debug crypto engine accelerator logs
no debug crypto engine accelerator logs
Syntax Description This command has no arguments or keywords.
Defaults The logging of commands sent from the VPN module driver to the VPN module hardware is disabled.
Command History
Usage Guidelines Use the debug crypto engine accelerator logs command when encryption traffic is sent to the router and a problem with the encryption module is suspected.
This command is intended only for Cisco TAC personnel to collect debugging information.
Examples The command debug crypto engine accelerator logs uses a debug flag to log commands and associated parameters sent from the VPN module driver to the VPN module hardware as follows:
Router# debug crypto engine accelerator logs
encryption module logs debugging is on
Related Commands
Release Modification
12.1(1)XC This command was introduced on the Cisco 1720 and Cisco 1750 routers.
Command Description
crypto engine accelerator Enables or disables the crypto engine accelerator if it exists.
show crypto engine accelerator logs
Prints information about the last 32 CGX Library packet processing commands, and associated parameters sent from the VPN module driver to the VPN module hardware.
show crypto engine accelerator sa-database
Prints active (in-use) entries in the platform-specific VPN module database.
show crypto engine configuration
Displays the Cisco IOS crypto engine of your router.

Debug Commandsdebug crypto ipsec
226Cisco IOS Debug Command Reference
debug crypto ipsecTo display IPSec events, use the debug crypto ipsec privileged EXEC command. The no form of this command disables debugging output.
debug crypto ipsec
no debug crypto ipsec
Syntax Description This command has no arguments or keywords.
Examples The following is sample output from the debug crypto ipsec command. In this example, security associations (SAs) have been successfully established.
Router# debug crypto ipsec
IPSec requests SAs between 172.21.114.123 and 172.21.114.67, on behalf of the permit ip host 172.21.114.123 host 172.21.114.67 command. It prefers to use the transform set esp-des w/esp-md5-hmac, but it will also consider ah-sha-hmac.
00:24:30: IPSEC(sa_request): , (key eng. msg.) src= 172.21.114.123, dest= 172.21.114.67, src_proxy= 172.21.114.123/255.255.255.255/0/0 (type=1), dest_proxy= 172.21.114.67/255.255.255.255/0/0 (type=1), protocol= ESP, transform= esp-des esp-md5-hmac , lifedur= 120s and 4608000kb, spi= 0x0(0), conn_id= 0, keysize= 0, flags= 0x400:24:30: IPSEC(sa_request): , (key eng. msg.) src= 172.21.114.123, dest= 172.21.114.67, src_proxy= 172.21.114.123/255.255.255.255/0/0 (type=1), dest_proxy= 172.21.114.67/255.255.255.255/0/0 (type=1)., protocol= AH, transform= ah-sha-hmac , lifedur= 120s and 4608000kb, spi= 0x0(0), conn_id= 0, keysize= 0, flags= 0x0.
IKE asks for SPIs from IPSec. For inbound security associations, IPSec controls its own SPI space.
00:24:34: IPSEC(key_engine): got a queue event...00:24:34: IPSEC(spi_response): getting spi 302974012ld for SA from 172.21.114.67 to 172.21.114.123 for prot 300:24:34: IPSEC(spi_response): getting spi 525075940ld for SA from 172.21.114.67 to 172.21.114.123 for prot 2
IKE will ask IPSec if it accepts the SA proposal. In this case, it will be the one sent by the local IPSec in the first place:
00:24:34: IPSEC(validate_proposal_request): proposal part #1, (key eng. msg.) dest= 172.21.114.67, src= 172.21.114.123, dest_proxy= 172.21.114.67/255.255.255.255/0/0 (type=1), src_proxy= 172.21.114.123/255.255.255.255/0/0 (type=1), protocol= ESP, transform= esp-des esp-md5-hmac , lifedur= 0s and 0kb, spi= 0x0(0), conn_id= 0, keysize= 0, flags= 0x4
After the proposal is accepted, IKE finishes the negotiations, generates the keying material, and then notifies IPSec of the new security associations (one security association for each direction).

Debug Commandsdebug crypto ipsec
227Cisco IOS Debug Command Reference
00:24:35: IPSEC(key_engine): got a queue event...
The following output pertains to the inbound SA. The conn_id value references an entry in the crypto engine connection table.
00:24:35: IPSEC(initialize_sas): , (key eng. msg.) dest= 172.21.114.123, src= 172.21.114.67, dest_proxy= 172.21.114.123/255.255.255.255/0/0 (type=1), src_proxy= 172.21.114.67/255.255.255.255/0/0 (type=1), protocol= ESP, transform= esp-des esp-md5-hmac , lifedur= 120s and 4608000 kb, spi= 0x120F043C(302974012), conn_id= 29, keysize= 0, flags= 0x4
The following output pertains to the outbound SA:
00:24:35: IPSEC(initialize_sas): , (key eng. msg.) src= 172.21.114.123, dest= 172.21.114.67, src_proxy= 172.21.114.123/255.255.255.255/0/0 (type=1), dest_proxy= 172.21.114.67/255.255.255.255/0/0 (type=1), protocol= ESP, transform= esp-des esp-md5-hmac , lifedur= 120s and 4608000kb, spi= 0x38914A4(59315364), conn_id= 30, keysize= 0, flags= 0x4
IPSec now installs the SA information into its SA database.
00:24:35: IPSEC(create_sa): sa created, (sa) sa_dest= 172.21.114.123, sa_prot= 50, sa_spi= 0x120F043C(302974012), sa_trans= esp-des esp-md5-hmac , sa_conn_id= 2900:24:35: IPSEC(create_sa): sa created, (sa) sa_dest= 172.21.114.67, sa_prot= 50, sa_spi= 0x38914A4(59315364), sa_trans= esp-des esp-md5-hmac , sa_conn_id= 30
The following is sample output for the debug crypto ipsec command as seen on the peer router. In this example, IKE asks IPSec if it will accept an SA proposal. Although the peer sent two proposals, IPSec accepted the first proposal.
00:26:15: IPSEC(validate_proposal_request): proposal part #1, (key eng. msg.) dest= 172.21.114.67, src= 172.21.114.123, dest_proxy= 172.21.114.67/255.255.255.255/0/0 (type=1), src_proxy= 172.21.114.123/255.255.255.255/0/0 (type=1), protocol= ESP, transform= esp-des esp-md5-hmac , lifedur= 0s and 0kb, spi= 0x0(0), conn_id= 0, keysize= 0, flags= 0x4
IKE asks for SPIs.
00:26:15: IPSEC(key_engine): got a queue event...00:26:15: IPSEC(spi_response): getting spi 59315364ld for SA from 172.21.114.123 to 172.21.114.67 for prot 3
IKE does the remaining processing, completing the negotiation and generating keys. It then tells IPSec about the new SAs.
00:26:15: IPSEC(key_engine): got a queue event...
The following output pertains to the inbound SA:
00:26:15: IPSEC(initialize_sas): , (key eng. msg.) dest= 172.21.114.67, src= 172.21.114.123, dest_proxy= 172.21.114.67/0.0.0.0/0/0 (type=1), src_proxy= 172.21.114.123/0.0.0.0/0/0 (type=1), protocol= ESP, transform= esp-des esp-md5-hmac , lifedur= 120s and 4608000kb,

Debug Commandsdebug crypto ipsec
228Cisco IOS Debug Command Reference
spi= 0x38914A4(59315364), conn_id= 25, keysize= 0, flags= 0x4
The following output pertains to the outbound SA:
00:26:15: IPSEC(initialize_sas): , (key eng. msg.) src= 172.21.114.67, dest= 172.21.114.123, src_proxy= 172.21.114.67/0.0.0.0/0/0 (type=1), dest_proxy= 172.21.114.123/0.0.0.0/0/0 (type=1), protocol= ESP, transform= esp-des esp-md5-hmac , lifedur= 120s and 4608000kb, spi= 0x120F043C(302974012), conn_id= 26, keysize= 0, flags= 0x4
IPSec now installs the SA information into its SA database:
00:26:15: IPSEC(create_sa): sa created, (sa) sa_dest= 172.21.114.67, sa_prot= 50, sa_spi= 0x38914A4(59315364), sa_trans= esp-des esp-md5-hmac , sa_conn_id= 2500:26:15: IPSEC(create_sa): sa created, (sa) sa_dest= 172.21.114.123, sa_prot= 50, sa_spi= 0x120F043C(302974012), sa_trans= esp-des esp-md5-hmac , sa_conn_id= 26

Debug Commandsdebug crypto isakmp
229Cisco IOS Debug Command Reference
debug crypto isakmpTo display messages about IKE events, use the debug crypto isakmp privileged EXEC command. The no form of this command disables debugging output.
debug crypto isakmp
no debug crypto isakmp
Syntax Description This command has no arguments or keywords.
Examples The following is sample output from the debug crypto isakmp command for an IKE peer that initiates an IKE negotiation.
First, IKE negotiates its own security association (SA), checking for a matching IKE policy:
Router# debug crypto isakmp
20:26:58: ISAKMP (8): beginning Main Mode exchange20:26:58: ISAKMP (8): processing SA payload. message ID = 020:26:58: ISAKMP (8): Checking ISAKMP transform 1 against priority 10 policy20:26:58: ISAKMP: encryption DES-CBC20:26:58: ISAKMP: hash SHA20:26:58: ISAKMP: default group 120:26:58: ISAKMP: auth pre-share20:26:58: ISAKMP (8): atts are acceptable. Next payload is 0
IKE has found a matching policy. Next, the IKE SA is used by each peer to authenticate the other peer:
20:26:58: ISAKMP (8): SA is doing pre-shared key authentication20:26:59: ISAKMP (8): processing KE payload. message ID = 020:26:59: ISAKMP (8): processing NONCE payload. message ID = 020:26:59: ISAKMP (8): SKEYID state generated20:26:59: ISAKMP (8): processing ID payload. message ID = 020:26:59: ISAKMP (8): processing HASH payload. message ID = 020:26:59: ISAKMP (8): SA has been authenticated
Next, IKE negotiates to set up the IPSec SA by searching for a matching transform set:
20:26:59: ISAKMP (8): beginning Quick Mode exchange, M-ID of 76716284520:26:59: ISAKMP (8): processing SA payload. message ID = 76716284520:26:59: ISAKMP (8): Checking IPSec proposal 120:26:59: ISAKMP: transform 1, ESP_DES20:26:59: ISAKMP: attributes in transform:20:26:59: ISAKMP: encaps is 120:26:59: ISAKMP: SA life type in seconds20:26:59: ISAKMP: SA life duration (basic) of 60020:26:59: ISAKMP: SA life type in kilobytes20:26:59: ISAKMP: SA life duration (VPI) of 0x0 0x46 0x50 0x0 20:26:59: ISAKMP: authenticator is HMAC-MD520:26:59: ISAKMP (8): atts are acceptable.
A matching IPSec transform set has been found at the two peers. Now the IPSec SA can be created (one SA is created for each direction):
20:26:59: ISAKMP (8): processing NONCE payload. message ID = 76716284520:26:59: ISAKMP (8): processing ID payload. message ID = 76716284520:26:59: ISAKMP (8): processing ID payload. message ID = 767162845

Debug Commandsdebug crypto isakmp
230Cisco IOS Debug Command Reference
20:26:59: ISAKMP (8): Creating IPSec SAs20:26:59: inbound SA from 155.0.0.2 to 155.0.0.1 (proxy 155.0.0.2 to 155.0.0.1 )20:26:59: has spi 454886490 and conn_id 9 and flags 420:26:59: lifetime of 600 seconds20:26:59: lifetime of 4608000 kilobytes20:26:59: outbound SA from 155.0.0.1 to 155.0.0.2 (proxy 155.0.0.1 to 155.0.0.2 )20:26:59: has spi 75506225 and conn_id 10 and flags 420:26:59: lifetime of 600 seconds20:26:59: lifetime of 4608000 kilobytes

Debug Commandsdebug crypto key-exchange
231Cisco IOS Debug Command Reference
debug crypto key-exchangeTo show Digital Signature Standard (DSS) public key exchange messages, use the debug crypto key-exchange privileged EXEC command. The no form of this command disables debugging output.
debug crypto key-exchange
no debug crypto key-exchange
Syntax Description This command has no arguments or keywords.
Usage Guidelines Encryption and authentication are provided by a software service on the router called a crypto engine. The crypto engine performs authentication through DSS public and private keys when a connection is set up. DSS is a means of sending a “signature” at the end of a message that positively identifies the author of the message. The signature cannot be forged or duplicated by others, so whoever received a message with a DSS signature knows exactly who sent the message.
If the process of exchanging DSS public keys with a peer router by means of the config crypto key-exchange command is not successful, try to exchange DSS public keys again after enabling the debug crypto key-exchange command to help you diagnose the problem.
Examples The following is sample output from the debug crypto key-exchange command. The first shows output from the initiating router in a key exchange. The second shows output from the passive router in a key exchange. The number of bytes received should match the number of bytes sent from the initiating side, although the number of messages can be different.
Router# debug crypto key-exchange
CRYPTO-KE: Sent 4 bytes.CRYPTO-KE: Sent 2 bytes.CRYPTO-KE: Sent 2 bytes.CRYPTO-KE: Sent 2 bytes.CRYPTO-KE: Sent 64 bytes.
Router# debug crypto key-exchange
CRYPTO-KE: Received 4 bytes.CRYPTO-KE: Received 2 bytes.CRYPTO-KE: Received 2 bytes.CRYPTO-KE: Received 2 bytes.CRYPTO-KE: Received 49 bytes.CRYPTO-KE: Received 15 bytes.
Related Commands Command Description
debug crypto sesmgmt Displays connection setup messages and their flow through the router.

Debug Commandsdebug crypto pki messages
232Cisco IOS Debug Command Reference
debug crypto pki messagesTo display debug messages for the details of the interaction (message dump) between the certification authority (CA) and the router, use the debug crypto pki messages privileged EXEC command. To disable debugging output, use the no form of this command.
debug crypto pki messages
no debug crypto pki messages
Syntax Description This command has no arguments or keywords.
Defaults Disabled
Command History
Usage Guidelines Use the debug crypto pki messages command to display messages about the actual data being sent and received during public key infrastructure (PKI) transactions.
You can also use the show crypto ca certificates command to display information about your certificate.
Examples The following example is sample output for the debug crypto pki messages command:
Router# debug crypto pki messages
Fingerprint: 2CFC6265 77BA6496 3AEFCB50 29BC2BF200:48:23:Write out pkcs#10 content:27400:48:23:30 82 01 0E 30 81 B9 02 01 00 30 22 31 20 30 1E 06 09 2A 86 00:48:23:48 86 F7 0D 01 09 02 16 11 70 6B 69 2D 33 36 61 2E 63 69 73 00:48:23:63 6F 2E 63 6F 6D 30 5C 30 0D 06 09 2A 86 48 86 F7 0D 01 01 00:48:23:01 05 00 03 4B 00 30 48 02 41 00 DD 2C C6 35 A5 3F 0F 97 6C 00:48:23:11 E2 81 95 01 6A 80 34 25 10 C4 5F 3D 8B 33 1C 19 50 FD 91 00:48:23:6C 2D 65 4C B6 A6 B0 02 1C B2 84 C1 C8 AC A4 28 6E EF 9D 3B 00:48:23:30 98 CB 36 A2 47 4E 7E 6F C9 3E B8 26 BE 15 02 03 01 00 01 00:48:23:A0 32 30 10 06 09 2A 86 48 86 F7 0D 01 09 07 31 03 13 01 63 00:48:23:30 1E 06 09 2A 86 48 86 F7 0D 01 09 0E 31 11 14 0F 30 0D 30 00:48:23:0B 06 03 55 1D 0F 04 04 03 02 05 A0 30 0D 06 09 2A 86 48 86 00:48:23:F7 0D 01 01 04 05 00 03 41 00 2C FD 88 2C 8A 13 B6 81 88 EA 00:48:23:5C FD AE 52 8F 2C 13 95 9E 9D 8B A4 C9 48 32 84 BF 05 03 49 00:48:23:63 27 A3 AC 6D 74 EB 69 E3 06 E9 E4 9F 0A A8 FB 20 F0 02 03 00:48:23:BE 90 57 02 F2 75 8E 0F 16 60 10 6F BE 2B 00:48:23:Enveloped Data ... 00:48:23:30 80 06 09 2A 86 48 86 F7 0D 01 07 03 A0 80 30 80 02 01 00 00:48:23:31 80 30 82 01 0F 02 01 00 30 78 30 6A 31 0B 30 09 06 03 55 00:48:23:04 06 13 02 55 53 31 0B 30 09 06 03 55 04 08 13 02 43 41 31 00:48:23:13 30 11 06 03 55 04 07 13 0A 53 61 6E 74 61 20 43 72 75 7A 00:48:23:31 15 30 13 06 03 55 04 0A 13 0C 43 69 73 63 6F 20 53 79 73 00:48:23:74 65 6D 31 0E 30 0C 06 03 55 04 0B 13 05 49 50 49 53 55 31
Release Modification
12.0 This command was introduced.

Debug Commandsdebug crypto pki messages
233Cisco IOS Debug Command Reference
00:48:23:Signed Data 1382 bytes00:48:23:30 80 06 09 2A 86 48 86 F7 0D 01 07 02 A0 80 30 80 02 01 01 00:48:23:31 0E 30 0C 06 08 2A 86 48 86 F7 0D 02 05 05 00 30 80 06 09 00:48:23:2A 86 48 86 F7 0D 01 07 01 A0 80 24 80 04 82 02 75 30 80 06 00:48:23:02 55 53 31 0B 30 09 06 03 55 04 08 13 02 43 41 31 13 30 11 00:48:23:33 34 5A 17 0D 31 30 31 31 31 35 31 38 35 34 33 34 5A 30 22 00:48:23:31 20 30 1E 06 09 2A 86 48 86 F7 0D 01 09 02 16 11 70 6B 69 00:48:23:2D 33 36 61 2E 63 69 73 63 6F 2E 63 6F 6D 30 5C 30 0D 06 09 00:48:23:2A 86 48 86 F7 0D 01 01 01 05 00 03 4B 00 30 48 02 41 00 DD 00:48:23:2C C6 35 A5 3F 0F 97 6C 11 E2 81 95 01 6A 80 34 25 10 C4 5F 00:48:23:3D 8B 33 1C 19 50 FD 91 6C 2D 65 4C B6 A6 B0 02 1C B2 84 C1 00:48:23:86 F7 0D 01 01 01 05 00 04 40 C6 24 36 D6 D5 A6 92 80 5D E5 00:48:23:15 F7 3E 15 6D 71 E1 D0 13 2B 14 64 1B 0C 0F 96 BF F9 2E 05 00:48:23:EF C2 D6 CB 91 39 19 F8 44 68 0E C5 B5 84 18 8B 2D A4 B1 CD 00:48:23:3F EC C6 04 A5 D9 7C B1 56 47 3F 5B D4 93 00 00 00 00 00 00 00:48:23:00 00 00:48:24:Received pki message:1778 types00:48:24:30 82 06 EE 06 09 2A 86 48 86 F7 0D 01 07 02 A0 82 06 DF 30 00:48:24:82 06 DB 02 01 01 31 0E 30 0C 06 08 2A 86 48 86 F7 0D 02 05 00:48:24:05 00 30 82 04 C5 06 09 2A 86 48 86 F7 0D 01 07 01 A0 82 04 00:48:24:B6 04 82 04 B2 30 82 04 AE 06 09 2A 86 48 86 F7 0D 01 07 03 00:48:24:0E 61 85 48 B1 DA 3D 73 F1 4B D8 5E 03 6E F3 E5 72 5D D7 17 00:48:24:17 3D 03 19 B3 8F 06 8B FE FB B1 CE D4 4C 4D 1B 81 CF 59 B7 00:48:24:78 DD 27 BA 28 2F 85 09 F0 61 74 0F 0F 92 F0 C8 C7 5B 96 E7 00:48:24:71 AF 87 D2 72 75 B7 F7 89 6F E4 E7 57 84 76 53 0B 50 8A B9 00:48:24:05 54 6F 06 75 72 8A AF 54 A6 EF 70 2D 15 6C B7 30 91 1C 00 00:48:24:CB 26 80 8D DC 89 77 57 1E D5 7A 37 86 BE 44 F8 66 60 00:48:24:Verified signed data 1202 bytes:00:48:24:30 82 04 AE 06 09 2A 86 48 86 F7 0D 01 07 03 A0 82 04 9F 30 00:48:24:82 04 9B 02 01 00 31 81 9F 30 81 9C 02 01 00 30 46 30 22 31 00:48:24:20 30 1E 06 09 2A 86 48 86 F7 0D 01 09 02 16 11 70 6B 69 2D 00:48:24:33 36 61 2E 63 69 73 63 6F 2E 63 6F 6D 02 20 34 45 45 41 44 00:48:24:E2 55 65 DE DB 23 91 D7 60 53 96 64 BE F2 30 A7 8B 1B D9 EB 00:48:24:2E EB 9B 0D 75 EC 8E AF C0 9C 62 78 29 E0 97 00 EA 84 80 DD 00:48:24:AB 83 32 89 3E 5B A9 9F A9 9A 6D 3A 87 E2 71 16 C9 C1 E4 DB 00:48:24:FA 5A FC F3 31 98 2B 8E 55 71 C4 F6 BF CE 45 CA A5 47 40 9B 00:48:24:19 E3 1A C3 F5 ED 4D 81 1F 6F 34 35 E2 00 B3 93 DD A0 6A 74 00:48:24:EA 2B A8 D4 32 53 A7 86 50 71 5E 2A 64 BE 4B B1 72 AB 8C DA 00:48:24:AB 7A 2A 07 C0 7E C1 A7 12 31 33 AB 94 E0 3B A2 68 17 DE CE 00:48:24:57 70 2D 0B F5 C8 A7 FC FE 40 74 E8 EB 9C 82 77 DE A4 FA 75 00:48:24:FF 6F 7B E6 74 E2 F5 A1 9A C8 3C 23 DB 4A 90 BE 4A 94 EB 8B 00:48:24:ED F3 00:48:24:Decrypted enveloped content:00:48:24:30 82 03 C8 06 09 2A 86 48 86 F7 0D 01 07 02 A0 82 03 B9 30 00:48:24:82 03 B5 02 01 01 31 00 30 0B 06 09 2A 86 48 86 F7 0D 01 07 00:48:24:01 A0 82 03 9D 30 82 03 99 30 82 03 43 A0 03 02 01 02 02 0A 00:48:24:70 45 B3 F6 00 00 00 00 01 23 30 0D 06 09 2A 86 48 86 F7 0D 000:48:24:35 35 32 32 5A 30 22 31 20 30 1E 06 09 2A 86 48 86 F7 0D 01 00:48:24:09 02 13 11 70 6B 69 2D 33 36 61 2E 63 69 73 63 6F 2E 63 6F 00:48:24:6D 30 5C 30 0D 06 09 2A 86 48 86 F7 0D 01 01 01 05 00 03 4B 00:48:24:00 30 48 02 41 00 DD 2C C6 35 A5 3F 0F 97 6C 11 E2 81 95 01 00:48:24:6A 80 34 25 10 C4 5F 3D 8B 33 1C 19 50 FD 91 6C 2D 65 4C B6 00:48:24:63 6F 2E 63 6F 6D 2F 43 65 72 74 45 6E 72 6F 6C 6C 2F 6D 73 00:48:24:63 61 2D 72 6F 6F 74 5F 6D 73 63 61 2D 72 6F 6F 74 2E 63 72 00:48:24:74 30 41 06 08 2B 06 01 05 05 07 30 02 86 35 66 69 6C 65 3A 00:48:24:2F 2F 5C 5C 6D 73 63 61 2D 72 6F 6F 74 5C 43 65 72 74 45 6E 00:48:24:72 6F 6C 6C 5C 6D 73 63 61 2D 72 6F 6F 74 5F 6D 73 63 61 2D 00:48:24:72 6F 6F 74 2E 63 72 74 30 0D 06 09 2A 86 48 86 F7 0D 01 01 00:48:24:05 05 00 03 41 00 56 30 AD 99 1F FA 0D 1A C3 3D 71 2A DB A0 00:48:24:48 C5 EB C8 D4 FE 62 49 9C 69 5D E4 80 77 19 3E 07 B8 2B 4F 00:48:24:9A D7 72 A7 26 25 61 AE 5B 1C B5 7B 4C 18 CA 17 C3 D0 76 84 00:48:24:75 41 92 74 5E A4 E8 9E 09 60 31 00 00:48:24:%CRYPTO-6-CERTRET:Certificate received from Certificate Authority

Debug Commandsdebug crypto pki messages
234Cisco IOS Debug Command Reference
Related Commands Command Description
crypto ca enroll Obtains the certificate of your router from the CA.
debug crypto pki transactions Displays debug messages for the trace of interaction (message type) between the CA and the router.
show crypto ca certificates Displays information about your certificate, the certificate of the CA, and any RA certificates.

Debug Commandsdebug crypto sesmgmt
235Cisco IOS Debug Command Reference
debug crypto sesmgmtTo show connection setup messages and their flow through the router, use the debug crypto sesmgmt privileged EXEC command. The no form of this command disables debugging output.
debug crypto sesmgmt
no debug crypto sesmgmt
Syntax Description This command has no arguments or keywords.
Usage Guidelines Encryption and authentication are provided by a software service on the router called a crypto engine. The crypto engine performs authentication through DSS public and private keys when a connection is set up. DSS is a means of sending a “signature” at the end of a message that positively identifies the author of the message. The signature cannot be forged or duplicated by others, so whoever receives a message with a DSS signature knows exactly who sent the message.
When connections are not completing, use the debug crypto sesmgmt command to follow the progress of connection messages as a first step in diagnosing the problem. You see a record of each connection message as the router discovers it, and can track its progress through the necessary signing, verifying, and encryption session setup operations. Other significant connection setup events, such as the pregeneration of Diffie-Hellman public numbers, are also shown. For information on Diffie-Hellman public numbers, refer to the Security Configuration Guide.
Also use the show crypto connections command to display additional information on connections.
Examples The following is sample output from the debug crypto sesmgmt command. The first shows messages from a router that initiates a successful connection. The second shows messages from a router that receives a connection.
Router# debug crypto sesmgmt
CRYPTO: Dequeued a message: Inititate_ConnectionCRYPTO: DH gen phase 1 status for conn_id 2 slot 0:OKCRYPTO: Signing done. Status:OKCRYPTO: ICMP message sent: s=172.21.114.163, d=172.21.114.162CRYPTO-SDU: send_nnc_req: NNC Echo Request sentCRYPTO: Dequeued a message: CRMCRYPTO: DH gen phase 2 status for conn_id 2 slot 0:OKCRYPTO: Verify done. Status=OKCRYPTO: Signing done. Status:OKCRYPTO: ICMP message sent: s=172.21.114.163, d=172.21.114.162CRYPTO-SDU: recv_nnc_rpy: NNC Echo Confirm sentCRYPTO: Create encryption key for conn_id 2 slot 0:OKCRYPTO: Replacing -2 in crypto maps with 2 (slot 0)
Router# debug crypto sesmgmt
CRYPTO: Dequeued a message: CIMCRYPTO: Verify done. Status=OKCRYPTO: DH gen phase 1 status for conn_id 1 slot 0:OKCRYPTO: DH gen phase 2 status for conn_id 1 slot 0:OKCRYPTO: Signing done. Status:OKCRYPTO: ICMP message sent: s=172.21.114.162, d=172.21.114.163

Debug Commandsdebug crypto sesmgmt
236Cisco IOS Debug Command Reference
CRYPTO-SDU: act_on_nnc_req: NNC Echo Reply sentCRYPTO: Create encryption key for conn_id 1 slot 0:OKCRYPTO: Replacing -2 in crypto maps with 1 (slot 0)CRYPTO: Dequeued a message: CCMCRYPTO: Verify done. Status=OK
Related Commands Command Description
debug crypto key-exchange Displays DSS public key exchange messages.

Debug Commandsdebug crypto pki transactions
237Cisco IOS Debug Command Reference
debug crypto pki transactionsTo display debug messages for the trace of interaction (message type) between the certification authority (CA) and the router, use the debug crypto pki transactions privileged EXEC command. To disable debugging output, use the no form of this command.
debug crypto pki transactions
no debug crypto pki transactions
Syntax Description This command has no arguments or keywords.
Defaults Disabled
Command History
Usage Guidelines Use the debug crypto pki transactions command to display debug messages pertaining to public key infrastructure (PKI) certificates. The messages will show status information during certificate enrollment and verification.
You can also use the show crypto ca certificates command to display information about your certificate.
Examples The following example, which authenticates and enrolls a CA, contains sample output for the debug crypto pki transactions command:
Router(config)# crypto ca authenticate mscaCertificate has the following attributes:Fingerprint:A5DE3C51 AD8B0207 B60BED6D 9356FB00 % Do you accept this certificate? [yes/no]:y
Router# debug crypto pki transactions
00:44:00:CRYPTO_PKI:Sending CA Certificate Request:GET /certsrv/mscep/mscep.dll/pkiclient.exe?operation=GetCACert&message=msca HTTP/1.0
00:44:00:CRYPTO_PKI:http connection opened00:44:01:CRYPTO_PKI:HTTP response header: HTTP/1.1 200 OKServer:Microsoft-IIS/5.0Date:Fri, 17 Nov 2000 18:50:59 GMTContent-Length:2693Content-Type:application/x-x509-ca-ra-cert Content-Type indicates we have received CA and RA certificates. 00:44:01:CRYPTO_PKI:WARNING:A certificate chain could not be constructed while selecting certificate status
Release Modification
12.0 This command was introduced.

Debug Commandsdebug crypto pki transactions
238Cisco IOS Debug Command Reference
00:44:01:CRYPTO_PKI:WARNING:A certificate chain could not be constructed while selecting certificate status 00:44:01:CRYPTO_PKI:Name:CN = msca-rootRA, O = Cisco System, C = US00:44:01:CRYPTO_PKI:Name:CN = msca-rootRA, O = Cisco System, C = US00:44:01:CRYPTO_PKI:transaction GetCACert completed00:44:01:CRYPTO_PKI:CA certificate received.00:44:01:CRYPTO_PKI:CA certificate received.Router(config)# crypto ca enroll msca%% Start certificate enrollment .. % Create a challenge password. You will need to verbally provide this password to the CA Administrator in order to revoke your certificate. For security reasons your password will not be saved in the configuration. Please make a note of it.
Password:Re-enter password:
% The subject name in the certificate will be:Router.cisco.com% Include the router serial number in the subject name? [yes/no]:n% Include an IP address in the subject name? [yes/no]:nRequest certificate from CA? [yes/no]:y% Certificate request sent to Certificate Authority% The certificate request fingerprint will be displayed.% The 'show crypto ca certificate' command will also show the fingerprint.
Router(config)# Fingerprint: 2CFC6265 77BA6496 3AEFCB50 29BC2BF2
00:44:29:CRYPTO_PKI:transaction PKCSReq completed00:44:29:CRYPTO_PKI:status:00:44:29:CRYPTO_PKI:http connection opened00:44:29:CRYPTO_PKI: received msg of 1924 bytes00:44:29:CRYPTO_PKI:HTTP response header: HTTP/1.1 200 OKServer:Microsoft-IIS/5.0Date:Fri, 17 Nov 2000 18:51:28 GMTContent-Length:1778Content-Type:application/x-pki-message
00:44:29:CRYPTO_PKI:signed attr:pki-message-type: 00:44:29:13 01 33 00:44:29:CRYPTO_PKI:signed attr:pki-status: 00:44:29:13 01 30 00:44:29:CRYPTO_PKI:signed attr:pki-recipient-nonce: 00:44:29:04 10 B4 C8 2A 12 9C 8A 2A 4A E1 E5 15 DE 22 C2 B4 FD 00:44:29:CRYPTO_PKI:signed attr:pki-transaction-id: 00:44:29:13 20 34 45 45 41 44 42 36 33 38 43 33 42 42 45 44 45 39 46 00:44:29:34 38 44 33 45 36 39 33 45 33 43 37 45 39 00:44:29:CRYPTO_PKI:status = 100:certificate is granted00:44:29:CRYPTO__PKI:All enrollment requests completed.00:44:29:%CRYPTO-6-CERTRET:Certificate received from Certificate Authority
Related Commands Command Description
crypto ca authenticate Authenticates the CA (by getting the certificate of the CA).
crypto ca enroll Obtains the certificate of your router from the CA.

Debug Commandsdebug crypto pki transactions
239Cisco IOS Debug Command Reference
debug crypto pki messages Displays debug messages for details of the interaction (message dump) between the CA and the router.
show crypto ca certificates Displays information about your certificate, the certificate of the CA, and any RA certificates.
Command Description

Debug Commandsdebug csm voice
240Cisco IOS Debug Command Reference
debug csm voiceTo turn on debugging for all CSM VoIP calls, use the debug csm voice privileged EXEC command. Use the no form of this command to disable debugging output.
debug csm voice [slot | dspm | dsp | dsp-channel]
no debug csm voice [slot | dspm | dsp | dsp-channel]
Syntax Description
Usage Guidelines The debug csm voice command turns on debugging for all CSM Voice-over-IP calls. If this command has no keyword specified, then debugging is enabled for all voice calls. The no debug cms voice command turns off debugging information for all voice calls.
If the keyword slot | dspm | dsp | dsp-channel argument is specified, then (if the specified DSP channel is engaged in a CSM call) CSM call-related debugging information will be turned on for this channel. The no form of this command turns off debugging for that particular channel.
Examples The following examples show sample output from the debug csm voice command. The following shows that CSM has received an event from ISDN.
Oct 18 04:05:07.052: EVENT_FROM_ISDN::dchan_idb=0x60D7B6B8, call_id=0xCF, ces=0x1bchan=0x0, event=0x1, cause=0x0
In this example, terms are explained as follows:
• dchan_idb—Indicates the address of the hardware IDB for the D channel
• call_id—Indicates the call ID assigned by ISDN
• bchan—Indicates the number of the B channel assigned for this call
• cause—Indicates the ISDN event cause
The following shows that CSM has allocated the CSM voice control block for the DSP device on slot 1 port 10 for this call.
Oct 18 04:05:07.052: VDEV_ALLOCATE: slot 1 and port 10 is allocated.
This AS5300 access server might not be actually used to handle this call. CSM must first allocate the CSM voice control block to initiate the state machine. After the voice control block has been allocated, CSM obtains from the DSP Resource Manager the actual DSP channel that will be used for the call. At that point, CSM will switch to the actual logical port number. The slot number refers to the physical slot on the AS5300 access server. The port number is the logical DSP number interpreted as listed in Table 36.
slot | dspm | dsp | dsp-channel (Optional) Identifies the location of a particular DSP channel.

Debug Commandsdebug csm voice
241Cisco IOS Debug Command Reference
Table 36 Logical DSP Numbers
Logical Port Number Physical DSP Channel
Port 0 DSPRM 1, DSP 1, DSP channel 1
Port 1 DSPRM 1, DSP 1, DSP channel 2
Port 2 DSPRM 1, DSP 2, DSP channel 1
Port 3 DSPRM 1, DSP 2, DSP channel 2
Port 4 DSPRM 1, DSP 3, DSP channel 1
Port 5 DSPRM 1, DSP 3, DSP channel 2
Port 6 DSPRM 1, DSP 4, DSP channel 1
Port 7 DSPRM 1, DSP 4, DSP channel 2
Port 8 DSPRM 1, DSP 5, DSP channel 1
Port 9 DSPRM 1, DSP 5, DSP channel 2
Port 10 DSPRM 1, DSP 6, DSP channel 1
Port 11 DSPRM 1, DSP 6, DSP channel 2
Port 12 DSPRM 2, DSP 1, DSP channel 1
Port 13 DSPRM 2, DSP 1, DSP channel 2
Port 14 DSPRM 2, DSP 2, DSP channel 1
Port 15 DSPRM 2, DSP 2, DSP channel 2
Port 16 DSPRM 2, DSP 3, DSP channel 1
Port 17 DSPRM 2, DSP 3, DSP channel 2
Port 18 DSPRM 2, DSP 4, DSP channel 1
Port 19 DSPRM 2, DSP 4, DSP channel 2
Port 20 DSPRM 2, DSP 5, DSP channel 1
Port 21 DSPRM 2, DSP 5, DSP channel 2
Port 22 DSPRM 2, DSP 6, DSP channel 1
Port 23 DSPRM 2, DSP 6, DSP channel 2
Port 48 DSPRM 5, DSP 1, DSP channel 1
Port 49 DSPRM 5, DSP 1, DSP channel 2
Port 50 DSPRM 5, DSP 2, DSP channel 1
Port 51 DSPRM 5, DSP 2, DSP channel 2
Port 52 DSPRM 5, DSP 3, DSP channel 1
Port 53 DSPRM 5, DSP 3, DSP channel 2
Port 54 DSPRM 5, DSP 4, DSP channel 1
Port 55 DSPRM 5, DSP 4, DSP channel 2
Port 56 DSPRM 5, DSP 5, DSP channel 1
Port 57 DSPRM 5, DSP 5, DSP channel 2
Port 58 DSPRM 5, DSP 6, DSP channel 1
Port 59 DSPRM 5, DSP 6, DSP channel 2

Debug Commandsdebug csm voice
242Cisco IOS Debug Command Reference
The following shows that the function csm_vtsp_init_tdm() has been called with a voice control block of address 0x60B8562C. This function will be called only when the call is treated as a voice call.
Oct 18 04:05:07.052: csm_vtsp_init_tdm (voice_vdev=0x60B8562C)
The following shows that CSM has obtained a DSP channel from the DSP Resource Manager:
Oct 18 04:05:07.052: csm_vtsp_init_tdm: dsprm_tdm_allocate: tdm slot 1, dspm 2, dsp 5, dsp_channel 1csm_vtsp_init_tdm: dsprm_tdm_allocate: tdm stream 5, channel 9, bank 0, bp_channel 10
The DSP channel has the following initialized TDM channel information:
• TDM slot 1, dspm 2, dsp 5, dsp_channel 1—Indicates the physical DSP channel that will be used for this call.
• TDM stream 5, channel 9, bank 0, bp_channel 10—Indicates the on-chip and backplane TDM channel assigned to this DSP channel. Stream 5, channel 9 gives the on-chip TDM channel mapped to the DSP; bank 0, bp_channel 10 means that the backplane stream 0 and backplane channel #1 are assigned to this DSP.
The following shows that CSM has received an incoming call event from ISDN:
Oct 18 04:05:07.052: EVENT_FROM_ISDN:(00CF): DEV_INCALL at slot 1 and port 20
Slot 1, port 20 means the logical DSP channel 20 (mapped to DSPRM 2, DSP 5, DSP channel 1).
The following shows that the DEV_INCALL message has been translated into a CSM_EVENT_ISDN_CALL message:
Oct 18 04:05:07.052: CSM_PROC_IDLE: CSM_EVENT_ISDN_CALL at slot 1, port 20
This message is passed to the CSM central state machine while it is in the CSM_IDLE state and is in the CSM_PROC_IDLE procedure. The logical DSP channel port 20 on slot 1 is used to handle this call.
The following shows that CSM has invoked the vtsp_ic_notify() function with a CSM voice call control block 0x60B8562C.
Oct 18 04:05:07.052: vtsp_ic_notify : (voice_vdev= 0x60B8562C)
Inside this function, CSM will send a SETUP INDICATION message to the VTSP. This function will be invoked only if the call is a voice call.
The following shows that CSM has received a SETUP INDICATION RESPONSE message from the VTSP as an acknowledgement.
Oct 18 04:05:07.056: csm_vtsp_call_setup_resp (vdev_info=0x60B8562C, vtsp_cdb=0x60FCA114)
This means that the VTSP has received the CALL SETUP INDICATION message previously sent and has proceeded to process the call.
• vdev_info—Contains the address of the CSM voice data block.
• vtsp_cdb—Contains the address of the VTSP call control block.
The following shows that CSM has received a CALL CONNECT message from the VTSP:
Oct 18 04:05:07.596: csm_vtsp_call_connect (vtsp_cdb=0x60FCA114, voice_vdev=0x60B8562C)
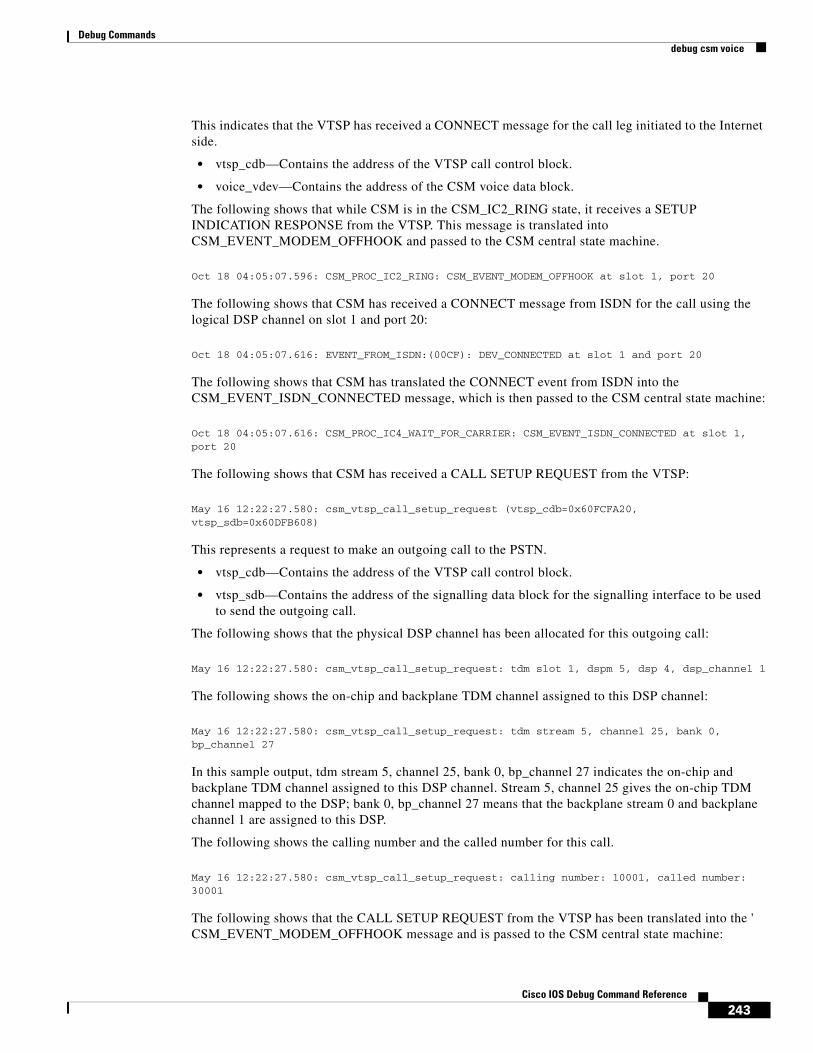
Debug Commandsdebug csm voice
243Cisco IOS Debug Command Reference
This indicates that the VTSP has received a CONNECT message for the call leg initiated to the Internet side.
• vtsp_cdb—Contains the address of the VTSP call control block.
• voice_vdev—Contains the address of the CSM voice data block.
The following shows that while CSM is in the CSM_IC2_RING state, it receives a SETUP INDICATION RESPONSE from the VTSP. This message is translated into CSM_EVENT_MODEM_OFFHOOK and passed to the CSM central state machine.
Oct 18 04:05:07.596: CSM_PROC_IC2_RING: CSM_EVENT_MODEM_OFFHOOK at slot 1, port 20
The following shows that CSM has received a CONNECT message from ISDN for the call using the logical DSP channel on slot 1 and port 20:
Oct 18 04:05:07.616: EVENT_FROM_ISDN:(00CF): DEV_CONNECTED at slot 1 and port 20
The following shows that CSM has translated the CONNECT event from ISDN into the CSM_EVENT_ISDN_CONNECTED message, which is then passed to the CSM central state machine:
Oct 18 04:05:07.616: CSM_PROC_IC4_WAIT_FOR_CARRIER: CSM_EVENT_ISDN_CONNECTED at slot 1, port 20
The following shows that CSM has received a CALL SETUP REQUEST from the VTSP:
May 16 12:22:27.580: csm_vtsp_call_setup_request (vtsp_cdb=0x60FCFA20, vtsp_sdb=0x60DFB608)
This represents a request to make an outgoing call to the PSTN.
• vtsp_cdb—Contains the address of the VTSP call control block.
• vtsp_sdb—Contains the address of the signalling data block for the signalling interface to be used to send the outgoing call.
The following shows that the physical DSP channel has been allocated for this outgoing call:
May 16 12:22:27.580: csm_vtsp_call_setup_request: tdm slot 1, dspm 5, dsp 4, dsp_channel 1
The following shows the on-chip and backplane TDM channel assigned to this DSP channel:
May 16 12:22:27.580: csm_vtsp_call_setup_request: tdm stream 5, channel 25, bank 0, bp_channel 27
In this sample output, tdm stream 5, channel 25, bank 0, bp_channel 27 indicates the on-chip and backplane TDM channel assigned to this DSP channel. Stream 5, channel 25 gives the on-chip TDM channel mapped to the DSP; bank 0, bp_channel 27 means that the backplane stream 0 and backplane channel 1 are assigned to this DSP.
The following shows the calling number and the called number for this call.
May 16 12:22:27.580: csm_vtsp_call_setup_request: calling number: 10001, called number: 30001
The following shows that the CALL SETUP REQUEST from the VTSP has been translated into the ' CSM_EVENT_MODEM_OFFHOOK message and is passed to the CSM central state machine:

Debug Commandsdebug csm voice
244Cisco IOS Debug Command Reference
May 16 12:22:27.580: CSM_PROC_IDLE: CSM_EVENT_MODEM_OFFHOOK at slot 1, port 54
The logical DSP channel number for the DSP (slot 1, port 54) is now displayed, which maps to the physical DSP channel slot 1, dspm 5, dsp 4, dsp_channel 1.
The following shows that CSM has collected all the digits for dialing out:
May 16 12:22:27.580: CSM_PROC_OC3_COLLECT_ALL_DIGIT: CSM_EVENT_GET_ALL_DIGITS at slot 1, port 54
For PRI and for applications that do not require digit collection of outdialing digits (for example, voice calls), the intermediate digit collection states are omitted and the CSM state machine moves to this state directly, pretending that the digit collection has been done.
The following shows an information message:
May 16 12:22:27.580: CSM_PROC_OC3_COLLECT_ALL_DIGIT: called party num: (30001) at slot 1, port 54
The following shows that CSM attempts to find a free signalling D channel to direct the outgoing call:
May 16 12:22:27.580: csm_vtsp_check_dchan (voice_vdev=0x60B8562C)May 16 12:22:27.580: csm_vtsp_check_dchan (vtsp requested dchan=0x60D7ACB0, dchan_idb=0x60E8ACF0)May 16 12:22:27.580: csm_vtsp_check_dchan (voice_vdev=0x60B8562C)May 16 12:22:27.580: csm_vtsp_check_dchan (vtsp requested dchan=0x60D7ACB0, dchan_idb=0x60D7ACB0)
In the case of voice calls, the free signalling D channel must match the voice interface specified inside the signalling data block (vtsp_sdb) passed from the VTSP.
The following shows that CSM has received an event from ISDN:
May 16 12:22:27.624: EVENT_FROM_ISDN::dchan_idb=0x60D7ACB0, call_id=0xA121, ces=0x1 bchan=0x1E, event=0x3, cause=0x0
In this sample output:
• dchan_idb—indicates the address of the hardware IDB for the D channel
• call_id—Indicates the call id assigned by ISDN
• bchan—Indicates the number of the B channel assigned for this call
• cause—Indicates the ISDN event cause
The following shows that CSM has received a CALL PROCEEDING message from ISDN.
May 16 12:22:27.624: EVENT_FROM_ISDN:(A121): DEV_CALL_PROC at slot 1 and port 54
The following shows that the CALL PROCEEDING event received from ISDN has been interpreted as a CSM_EVENT_ISDN_BCHAN_ASSIGNED message:
*May 16 12:22:27.624: CSM_PROC_OC4_DIALING: CSM_EVENT_ISDN_BCHAN_ASSIGNED at slot 1, port 54
ISDN has assigned a B channel for this outgoing call. This B channel must be on the same PRI span as the signalling D channel allocated previously.
The following shows that the csm_vtsp_setup_for_oc function is called:

Debug Commandsdebug csm voice
245Cisco IOS Debug Command Reference
May 16 12:22:27.624: csm_vtsp_setup_for_oc (voice_vdev=0x60B8562C)
This is invoked when an outgoing call initiated by the VTSP receives a response from the ISDN stack.
The following shows that ISDN has sent a CONNECT message to CSM indicating that the call leg to the PSTN side has been established:
May 16 12:22:28.084: EVENT_FROM_ISDN::dchan_idb=0x60D7ACB0, call_id=0xA121, ces=0x1 bchan=0x1E, event=0x4, cause=0x0May 16 12:22:28.084: EVENT_FROM_ISDN:(A121): DEV_CONNECTED at slot 1 and port 54
The following shows that while CSM is in the OC5_WAIT_FOR_CARRIER state, it has received the 'CONNECT' message from ISDN and has translated it into the CSM_EVENT_ISDN_CONNECTED message, which is passed to the CSM central state machine:
May 16 12:22:28.084: CSM_PROC_OC5_WAIT_FOR_CARRIER: CSM_EVENT_ISDN_CONNECTED at slot 1, port 54
The following shows that the function vtsp_confirm_oc() has been called:
May 16 12:22:28.084: vtsp_confirm_oc : (voice_vdev= 0x60B8562C)
This is invoked after CSM received the CONNECT message from ISDN. CSM sends a confirmation of the CONNECT to the VTSP.

Debug Commandsdebug ctunnel
246Cisco IOS Debug Command Reference
debug ctunnelTo display debug messages for the IP over a CLNS Tunnel feature, use the debug ctunnel privileged EXEC command. To disable the debug messages, use the no form of this command.
debug ctunnel
no debug ctunnel
Syntax Description This command has no arguments or keywords.
Defaults No default behavior or values.
Command History
Examples As packets are sent over the virtual interface, the following type of output will appear on the console when the debug ctunnel command is used:
4d21h: CTunnel1: IPCLNP encapsulated 49.0001.1111.1111.1111.00->49.0001.2222.2222.2222.00 (linktype=7, len=89)
Release Modification
12.1(5) This command was introduced.

Debug Commandsdebug custom-queue
247Cisco IOS Debug Command Reference
debug custom-queueTo enable custom queueing output, use the debug custom-queue EXEC command. Use the no form of this command to disable custom queueing output.
debug custom-queue
no debug custom-queue
Syntax Description This command has no arguments or keywords.
Examples The following is an example of enabling custom queueing output:
Router# debug custom-queue
Custom output queueing debugging is on
The following is sample output from the debug custom-queue command:
00:27:38: CQ: Serial0 output (Pk size/Q: 232/1) Q # was 1 now 100:27:38: CQ: Serial0 output (Pk size/Q: 232/1) Q # was 1 now 100:27:38: CQ: Serial0 output (Pk size/Q: 232/1) Q # was 1 now 100:27:38: CQ: Serial0 output (Pk size/Q: 232/1) Q # was 1 now 200:27:38: CQ: Serial0 output (Pk size/Q: 232/1) Q # was 2 now 100:27:38: CQ: Serial0 output (Pk size/Q: 232/1) Q # was 1 now 100:27:38: CQ: Serial0 output (Pk size/Q: 232/1) Q # was 1 now 100:27:38: CQ: Serial0 output (Pk size/Q: 232/1) Q # was 1 now 100:27:38: CQ: Serial0 output (Pk size/Q: 232/1) Q # was 1 now 100:27:38: CQ: Serial0 output (Pk size/Q: 232/1) Q # was 1 now 100:27:38: CQ: Serial0 output (Pk size/Q: 232/1) Q # was 1 now 200:27:38: CQ: Serial0 output (Pk size/Q: 232/1) Q # was 2 now 100:27:38: CQ: Serial0 output (Pk size/Q: 232/1) Q # was 1 now 100:27:38: CQ: Serial0 output (Pk size/Q: 232/1) Q # was 1 now 100:27:38: CQ: Serial0 output (Pk size/Q: 232/1) Q # was 1 now 100:27:38: CQ: Serial0 output (Pk size/Q: 232/1) Q # was 1 now 100:27:38: CQ: Serial0 output (Pk size/Q: 232/1) Q # was 1 now 200:27:38: CQ: Serial0 output (Pk size/Q: 232/1) Q # was 2 now 100:27:38: CQ: Serial0 output (Pk size/Q: 232/1) Q # was 1 now 100:27:38: CQ: Serial0 output (Pk size/Q: 232/1) Q # was 1 now 100:27:38: CQ: Serial0 output (Pk size/Q: 232/1) Q # was 1 now 1
Related Commands Command Description
debug priority Enables priority queueing output.

Debug Commandsdebug dbconn all
248Cisco IOS Debug Command Reference
debug dbconn allTo turn on all debug flags for Database Connection, use the debug dbconn all privileged EXEC command. The Database Connection debug flags are appc, config, drda, event, and tcp. Use the no form of this command to disable all debugging output.
debug dbconn all
no debug dbconn all
Syntax Description This command has no arguments or keywords.
Defaults Debugging is not enabled for Database Connection.
Usage Guidelines The debug dbconn all command displays debug output for APPC, Database Connection configuration, DRDA, error messages, event traces, and TCP.
Examples See the sample output provided for the debug dbconn appc, debug dbconn config, debug dbconn drda, debug dbconn event, and debug dbconn tcp commands.
Related Commands Command Description
debug dbconn appc Displays APPC-related trace or error messages.
debug dbconn config Displays trace or error messages for Database Connection configuration and control blocks.
debug dbconn drda Displays error messages and stream traces for DRDA.
debug dbconn event Displays trace or error messages for Database Connection events.
debug dbconn tcp Displays error messages and traces for TCP.

Debug Commandsdebug dbconn appc
249Cisco IOS Debug Command Reference
debug dbconn appcTo display APPC-related trace or error messages, use the debug dbconn appc privileged EXEC command. Use the no form of this command to disable debugging output.
debug dbconn appc
no debug dbconn appc
Syntax Description This command has no arguments or keywords.
Usage Guidelines In a router with stable Database Connection, the alias_cp_name field in the trace message should not be blank. There should be no other APPC error message. You can use APPN debug commands with this debug command to track APPN-related errors.
Examples The following is sample output from the debug dbconn appc command. In a normal situation, only the following message is displayed:
DBCONN-APPC: alias_cp_name is "ASH"
The following error messages are displayed if there is a network configuration error or other APPN-related problem:
DBCONN-APPC-612C2B28: APPC error: opcode 0x1, primary_rc 0x0003,secondary_rc 0x00000004DBCONN-APPC-612C2B28: Verb block =DBCONN-APPC-612C2B28: 0001 0200 0003 0000 0000 0004 0020 100CDBCONN-APPC-612C2B28: 610A 828B 0000 0000 0000 0000 0000 0000DBCONN-APPC-612C2B28: 0000 0000 8014 0003 0000 0000 0000 0000DBCONN-APPC-612C2B28: D3E4 F6F2 E2E3 C1D9 C4C2 F240 4040 4040DBCONN-APPC-612C2B28: 4040 4040 4040 4040 4040 4040 4040 4040DBCONN-APPC-612C2B28: 4040 4040 4040 4040 4040 4040 4040 4040DBCONN-APPC-612C2B28: 4040 4040 4040 4040 4040 4040 4040 4040DBCONN-APPC-612C2B28: 4040 4040 4040 4040 0200 0000 0000 0000DBCONN-APPC-612C2B28: 0000 0000 D4C5 D9D9 C9C5 4040 4040 D7C5DBCONN-APPC-612C2B28: E3C5 D940 4040 4040 0000 0000 0000 0000DBCONN-APPC-612C2B28: 00E2 E3C1 D9E6 4BE3 D6D9 C3C8 4040 4040DBCONN-APPC-612C2B28: 4040 0000 0000 0000 0000 0000DBCONN-APPC-612C2B28: ALLOCATE verb block =DBCONN-APPC-612C2B28: 0001 0200 0003 0000 0000 0004 0020 100CDBCONN-APPC-612C2B28: 610A 828B 0000 0000 0000 0000 0000 0000DBCONN-APPC-612C2B28: 0000 0000 8014 0003 0000 0000 0000 0000DBCONN-APPC-612C2B28: D3E4 F6F2 E2E3 C1D9 C4C2 F240 4040 4040DBCONN-APPC-612C2B28: 4040 4040 4040 4040 4040 4040 4040 4040DBCONN-APPC-612C2B28: 4040 4040 4040 4040 4040 4040 4040 4040DBCONN-APPC-612C2B28: 4040 4040 4040 4040 4040 4040 4040 4040DBCONN-APPC-612C2B28: 4040 4040 4040 4040 0200 0000 0000 0000
You can use the debug appn command to obtain more information.
The following message is displayed if a database connection is manually cleared and an outstanding APPC verb is pending:
DBCONN-APPC-%612C2B28: Canceling pending APPC verb 0x1

Debug Commandsdebug dbconn appc
250Cisco IOS Debug Command Reference
Related Commands Command Description
debug dbconn all Turns on all debug flags for Database Connection.
debug dbconn config Displays trace or error messages for Database Connection configuration and control blocks.
debug dbconn drda Displays error messages and stream traces for DRDA.
debug dbconn event Displays trace or error messages for Database Connection events.
debug dbconn tcp Displays error messages and traces for TCP.

Debug Commandsdebug dbconn config
251Cisco IOS Debug Command Reference
debug dbconn configTo display trace or error messages for Database Connection configuration and control blocks, use the debug dbconn config privileged EXEC command. Use the no form of this command to disable debugging output.
debug dbconn config
no debug dbconn config
Syntax Description This command has no arguments or keywords.
Usage Guidelines Most of the messages for Database Connection and control blocks do not report any errors. If a connection is inactive and cannot be cleared, use this command with the debug dbconn appc, debug dbconn tcp, and debug appn commands to locate the problem. The alias_cp_name field must match the configured APPN cpname.
Examples The following is sample output from the debug dbconn config command:
DBCONN-CONFIG: alias_cp_name is "ASH "DBCONN-CONFIG: connection 612BDAAC matching server on 198.147.235.5:0 withrdbname=STELLADBCONN-CONFIG: APPN shutdown; clearing connection 1234abcdDBCONN-CONFIG: created server 612C2720DBCONN-CONFIG: server 612C2720 (listen 60F72E94) is activeDBCONN-CONFIG: server 612C2720 (listen 60F72E94) is activeDBCONN-CONFIG: new connection 612BDAACDBCONN-CONFIG: listen 60F72E94 accepts connection 612BDAACDBCONN-CONFIG: server 60F74614 takes connection 612BDAACDBCONN-CONFIG: listen 60F72E94 releases connection 612BDAACDBCONN-CONFIG: server 60F74614 releases connection 612BDAACDBCONN-CONFIG: deleting connection 612BDAACDBCONN-CONFIG: listen 60F72E94 abandons connection 612BDAACDBCONN-CONFIG: server 612C2720 abandons connection 612BDAACDBCONN-CONFIG: deleting server 612C2720DBCONN-CONFIG: daemon 60381738 takes zombie connection 612BDAACDBCONN-CONFIG: daemon 60381738 releases zombie connection 612BDAAC
Related Commands Command Description
debug dbconn all Turns on all debug flags for Database Connection.
debug dbconn appc Displays APPC-related trace or error messages.
debug dbconn drda Displays error messages and stream traces for DRDA.
debug dbconn event Displays trace or error messages for Database Connection events.
debug dbconn tcp Displays error messages and traces for TCP.

Debug Commandsdebug dbconn drda
252Cisco IOS Debug Command Reference
debug dbconn drdaTo display error messages and stream traces for DRDA, use the debug dbconn drda privileged EXEC command. Use the no form of this command to disable debugging output.
debug dbconn drda
no debug dbconn drda
Syntax Description This command has no arguments or keywords.
Defaults By default, debugging is not enabled for the dbconn subsystem.
Command History
Examples The following example displays output from the debug dbconn drda command:
Router# debug dbconn drda
*Jun 30 16:09:32.363: DBCONN-DRDA-62008300: DSS X'006CD0410001', length 108, in chain, REQDSS, correlator 1*Jun 30 16:09:32.363: DBCONN-DRDA-62008300: OBJECT X'00661041', length 98, code point X'1041'*Jun 30 16:09:32.363: DBCONN-DRDA-62008300: OBJECT X'0020115E' in COLLECTION X'1041', length 28, code point X'115E'*Jun 30 16:09:32.363: DBCONN-DRDA-62008300: OBJECT X'000C116D' in COLLECTION X'1041', length 8, code point X'116D'*Jun 30 16:09:32.363: DBCONN-DRDA-62008300: OBJECT X'0013115A' in COLLECTION X'1041', length 15, code point X'115A' (skipping...)
Related Commands
Release Modification
11.3(2)T This command was introduced.
12.0(5)XN This command was moved from the CDBC feature to the CTRC feature.
Command Description
debug dbconn all Displays all CTRC debugging information related to communications with DB2.
debug dbconn appc Displays APPC-related trace or error messages for communications with DB2.
debug dbconn config Displays trace or error messages for CTRC configuration and control blocks for DB2 communications.
debug dbconn event Displays trace or error messages for CTRC events related to DB2 communications.
debug dbconn tcp Displays error messages or traces for TCP/IP communications with DB2.
debug snasw Displays debugging information related to SNA Switching Services.

Debug Commandsdebug dbconn event
253Cisco IOS Debug Command Reference
debug dbconn eventTo display trace or error messages for CTRC events related to DB2 communications, use the debug dbconn event privileged EXEC command. Use the no form of this command to disable debugging output.
debug dbconn event
no debug dbconn event
Syntax Description This command has no arguments or keywords.
Defaults By default, debugging is not enabled for the dbconn subsystem.
Command History
Examples The following examples display output from the debug dbconn event command in a variety of situations. A normal trace for the debug dbconn event displays as follows:
Router# debug dbconn event
DBCONN-EVENT: Dispatch to 60FD6C00, from 0, msg 60F754CC, msgid 6468 'dh',buffer 0.DBCONN-EVENT: [*] Post to 61134240(cn), from 60EC5470(tc), msg 611419E4,msgid 0x6372 'cr', buffer 612BF68C.DBCONN-EVENT: Flush events called for pto 61182742, pfrom 61239837.DBCONN-EVENT: Event discarded: to 61182742 (cn), from 61239837(ap), msg61339273, msgid 0x6372 'cr' buffer 0.DBCONN-EVENT: == Send to 1234abcd, from 22938acd, msg 72618394, msgid0x6372 'cr', buffer 0.
If the following messages are displayed, contact Cisco technical support personnel:
DBCONN-TCPFSM-1234abcd: Cannot occur in state 2 on input 6363 ('cc')DBCONN-APPCFSM-1234abcd: Cannot occur in state 3 on input 6363 ('cc')
Release Modification
11.3(2)T This command was introduced.
12.0(5)XN This command was moved from the CDBC feature to the CTRC feature.

Debug Commandsdebug dbconn event
254Cisco IOS Debug Command Reference
Related Commands Command Description
debug dbconn all Displays all CTRC debugging information related to communications with DB2.
debug dbconn appc Displays APPC-related trace or error messages for communications with DB2.
debug dbconn config Displays trace or error messages for CTRC configuration and control blocks for DB2 communications.
debug dbconn drda Displays error messages or stream traces for DRDA communications with DB2.
debug dbconn tcp Displays error messages or traces for TCP/IP communications with DB2.
debug snasw Displays debugging information related to SNA Switching Services.
show debugging Displays the state of each debugging option.

Debug Commandsdebug dbconn tcp
255Cisco IOS Debug Command Reference
debug dbconn tcpTo display error messages and traces for TCP, use the debug dbconn tcp privileged EXEC command. Use the no form of this command to disable debugging output.
debug dbconn tcp
no debug dbconn tcp
Syntax Description This command has no arguments or keywords.
Defaults Debugging is not enabled for the dbconn subsystem.
Command History
Examples The following example displays output from the debug dbconn tcp command:
Router# debug dbconn tcp
DBCONN-TCP-63528473: tcpdriver_passive_open returned NULLDBCONN-TCP-63528473: (no memory) tcp_reset(63829482) returns 4DBCONN-TCP: tcp_accept(74625348,&error) returns tcb 63829482, error 4DBCONN-TCP: (no memory) tcp_reset(63829482) returns 4DBCONN-TCP-63528473: (open) tcp_create returns 63829482, error = 4DBCONN-TCP-63528473: tcb_connect(63829482,1.2.3.4,2010) returns 4DBCONN-TCP-63528473: (open error) tcp_reset(63829482) returns 4DBCONN-TCP-63528473: tcp_create returns 63829482, error = 4DBCONN-TCP-63528473: tcb_bind(63829482,0.0.0.0,2001) returns 4DBCONN-TCP-63528473: tcp_listen(63829482,,) returns 4DBCONN-TCP-63528473: (errors) Calling tcp_close (63829482)
Related Commands
Release Modification
11.3(2)T This command was introduced.
12.0(5)XN This command was moved from the CDBC feature to the CTRC feature.
Command Description
debug dbconn all Displays all CTRC debugging information related to communications with DB2.
debug dbconn appc Displays APPC-related trace or error messages for communications with DB2.
debug dbconn config Displays trace or error messages for CTRC configuration and control blocks for DB2 communications.
debug dbconn drda Displays error messages or stream traces for DRDA communications with DB2.

Debug Commandsdebug dbconn tcp
256Cisco IOS Debug Command Reference
debug dbconn event Displays trace or error messages for CTRC events related to DB2 communications.
debug ip tcp Displays debugging information related to TCP/IP.
debug snasw Displays debugging information related to SNA Switching Services.
show debugging Displays the state of each debugging option.
Command Description

Debug Commandsdebug decnet adj
257Cisco IOS Debug Command Reference
debug decnet adjTo display debugging information on DECnet adjacencies, use the debug decnet adj privileged EXEC command. The no form of this command disables debugging output.
debug decnet adj
no debug decnet adj
Syntax Description This command has no arguments or keywords.
Examples The following is sample output from the sample debug decnet adj command:
Router# debug decnet adj
DNET-ADJ: Level 1 hello from 1.3DNET-ADJ: sending hellosDNET-ADJ: Sending hellos to all routers on interface Ethernet0, blksize 1498DNET-ADJ: Level 1 hello from 1.3DNET-ADJ: 1.5 adjacency initializingDNET-ADJ: sending triggered hellosDNET-ADJ: Sending hellos to all routers on interface Ethernet0, blksize 1498DNET-ADJ: Level 1 hello from 1.3DNET-ADJ: 1.5 adjacency upDNET-ADJ: Level 1 hello from 1.5DNET-ADJ: 1.5 adjacency down, listener timeout
The following line indicates that the router is sending hello messages to all routers on this segment, which in this case is Ethernet 0:
DNET-ADJ: Sending hellos to all routers on interface Ethernet0, blksize 1498
The following line indicates that the router has heard a hello message from address 1.5 and is creating an adjacency entry in its table. The initial state of this adjacency will be initializing.
DNET-ADJ: 1.5 adjacency initializing
The following line indicates that the router is sending an unscheduled (triggered) hello message as a result of some event, such as new adjacency being heard:
DNET-ADJ: sending triggered hellos
The following line indicates that the adjacency with 1.5 is now up, or active:
DNET-ADJ: 1.5 adjacency up
The following line indicates that the adjacency with 1.5 has timed out, because no hello message has been heard from adjacency 1.5 in the time interval originally specified in the hello message from 1.5:
DNET-ADJ: 1.5 adjacency down, listener timeout
The following line indicates that the router is sending an unscheduled hello message, as a result of some event, such as the adjacency state changing:
DNET-ADJ: hello update triggered by state changed in dn_add_adjacency

Debug Commandsdebug decnet connects
258Cisco IOS Debug Command Reference
debug decnet connectsTo display debugging information of all connect packets that are filtered (permitted or denied) by DECnet access lists, use the debug decnet connects privileged EXEC command. The no form of this command disables debugging output.
debug decnet connects
no debug decnet connects
Syntax Description This command has no arguments or keywords.
Usage Guidelines When you use connect packet filtering, it may be helpful to use the decnet access-group configuration command to apply the following basic access list:
access-list 300 permit 0.0 63.1023 eq any
You can then log all connect packets sent on interfaces to which you applied this list, in order to determine those elements on which your connect packets must be filtered.
Note Packet password and account information is not logged in the debug decnet connects message, nor is it displayed by the show access EXEC command. If you specify password or account information in your access list, they can be viewed by anyone with access to the configuration of the router.
Examples The following is sample output from the debug decnet connects command:
Router# debug decnet connects
DNET-CON: list 300 item #2 matched src=19.403 dst=19.309 on Ethernet0: permitted srcname=“RICK” srcuic=[0,017] dstobj=42 id=“USER”
Table 37 describes significant fields in the output.
Table 37 debug decnet connects Field Descriptions
Field Description
DNET-CON: Indicates that this is a debug decnet connects packet.
list 300 item #2 matched Indicates that a packet matched the second item in access list 300.
src=19.403 Indicates the source DECnet address for the packet.
dst=19.309 Indicates the destination DECnet address for the packet.
on Ethernet0: Indicates the router interface on which the access list filtering the packet was applied.
permitted Indicates that the access list permitted the packet.
srcname = “RICK” Indicates the originator user of the packet.
srcuic=[0,017] Indicates the source UIC of the packet.

Debug Commandsdebug decnet connects
259Cisco IOS Debug Command Reference
dstobj=42 Indicates that DECnet object 42 is the destination.
id=“USER” Indicates the access user.
Table 37 debug decnet connects Field Descriptions (continued)
Field Description

Debug Commandsdebug decnet events
260Cisco IOS Debug Command Reference
debug decnet eventsTo display debugging information on DECnet events, use the debug decnet events privileged EXEC command. The no form of this command disables debugging output.
debug decnet events
no debug decnet events
Syntax Description This command has no arguments or keywords.
Examples The following is sample output from the debug decnet events command:
Router# debug decnet events
DNET: Hello from area 50 rejected - exceeded ‘max area' parameter (45)DNET: Hello from area 50 rejected - exceeded ‘max area' parameter (45)
The following line indicates that the router received a hello message from a router whose area was greater than the max-area parameter with which this router was configured:
DNET: Hello from area 50 rejected - exceeded'max area' parameter (45)
The following line indicates that the router received a hello message from a router whose node ID was greater than the max-node parameter with which this router was configured:
DNET: Hello from node 1002 rejected - exceeded'max node' parameter (1000)

Debug Commandsdebug decnet packet
261Cisco IOS Debug Command Reference
debug decnet packetTo display debugging information on DECnet packet events, use the debug decnet packet privileged EXEC command. The no form of this command disables debugging output.
debug decnet packet
no debug decnet packet
Syntax Description This command has no arguments or keywords.
Examples The following is sample output from the debug decnet packet command:
Router# debug decnet packet
DNET-PKT: src 1.4 dst 1.5 sending to PHASEVDNET-PKT: Packet fwded from 1.4 to 1.5, via 1.5, snpa 0000.3080.cf90, TokenRing0
The following line indicates that the router is sending a converted packet addressed to node 1.5 toPhase V:
DNET-PKT: src 1.4 dst 1.5 sending to PHASEV
The following line indicates that the router forwarded a packet from node 1.4 to node 1.5. The packet is being sent to the next hop of 1.5 whose subnetwork point of attachment (MAC address) on that interface is 0000.3080.cf90.
DNET-PKT: Packet fwded from 1.4 to 1.5, via 1.5, snpa 0000.3080.cf90, TokenRing0
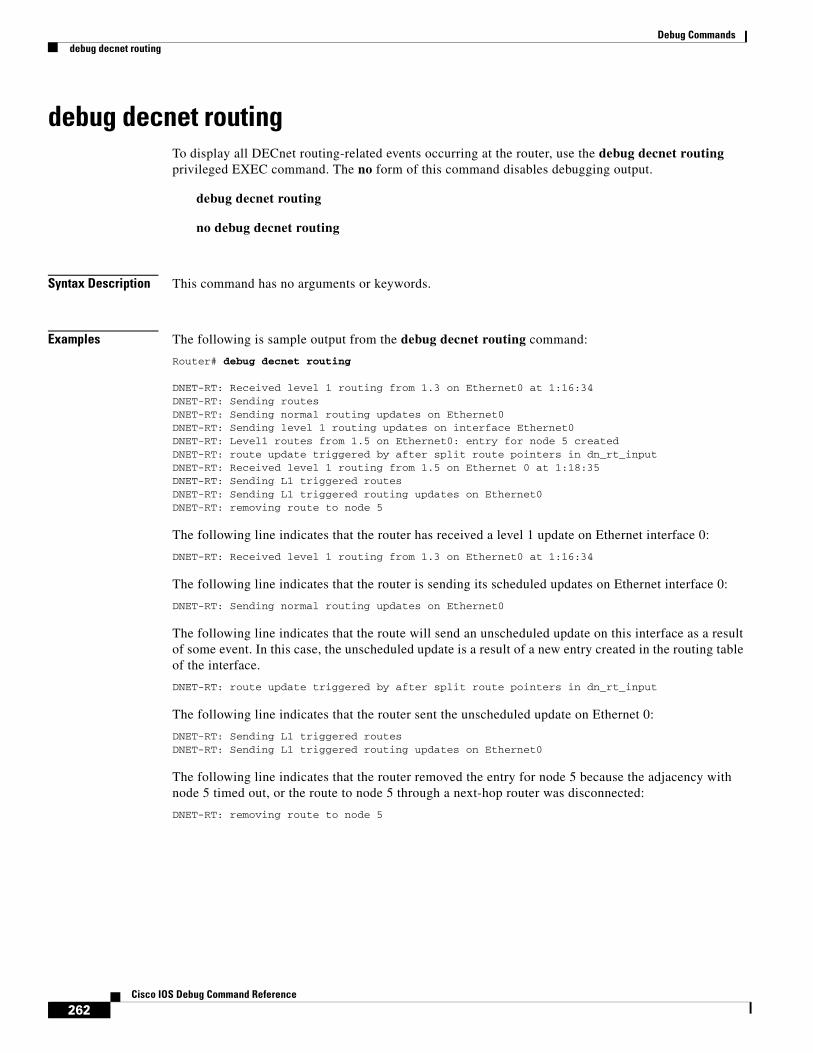
Debug Commandsdebug decnet routing
262Cisco IOS Debug Command Reference
debug decnet routingTo display all DECnet routing-related events occurring at the router, use the debug decnet routing privileged EXEC command. The no form of this command disables debugging output.
debug decnet routing
no debug decnet routing
Syntax Description This command has no arguments or keywords.
Examples The following is sample output from the debug decnet routing command:
Router# debug decnet routing
DNET-RT: Received level 1 routing from 1.3 on Ethernet0 at 1:16:34DNET-RT: Sending routesDNET-RT: Sending normal routing updates on Ethernet0DNET-RT: Sending level 1 routing updates on interface Ethernet0DNET-RT: Level1 routes from 1.5 on Ethernet0: entry for node 5 createdDNET-RT: route update triggered by after split route pointers in dn_rt_inputDNET-RT: Received level 1 routing from 1.5 on Ethernet 0 at 1:18:35DNET-RT: Sending L1 triggered routesDNET-RT: Sending L1 triggered routing updates on Ethernet0DNET-RT: removing route to node 5
The following line indicates that the router has received a level 1 update on Ethernet interface 0:
DNET-RT: Received level 1 routing from 1.3 on Ethernet0 at 1:16:34
The following line indicates that the router is sending its scheduled updates on Ethernet interface 0:
DNET-RT: Sending normal routing updates on Ethernet0
The following line indicates that the route will send an unscheduled update on this interface as a result of some event. In this case, the unscheduled update is a result of a new entry created in the routing table of the interface.
DNET-RT: route update triggered by after split route pointers in dn_rt_input
The following line indicates that the router sent the unscheduled update on Ethernet 0:
DNET-RT: Sending L1 triggered routesDNET-RT: Sending L1 triggered routing updates on Ethernet0
The following line indicates that the router removed the entry for node 5 because the adjacency with node 5 timed out, or the route to node 5 through a next-hop router was disconnected:
DNET-RT: removing route to node 5

Debug Commandsdebug dhcp
263Cisco IOS Debug Command Reference
debug dhcpTo display debugging information about the Dynamic Host Configuration Protocol (DHCP) client activities and to monitor the status of DHCP packets, use the debug dhcp command in privileged EXEC mode. The no form of this command disables debugging output.
debug dhcp [detail]
no debug dhcp [detail]
Syntax Description
Usage Guidelines You can also use the debug dhcp command to monitor the subnet allocation and releasing for on-demand address pools.
For debugging purposes, the debug dhcp detail command provides the most useful information such as the lease entry structure of the client and the state transitions of the lease entry. The debug output shows the scanned option values from received DHCP messages that are replies to a router request. The values of the op, htype, hlen, hops, server identifier option, xid, secs, flags, ciaddr, yiaddr, siaddr, and giaddr fields of the DHCP packet are shown in addition to the length of the options field.
Examples The following examples show and explain some of the typical debug messages you might see when using the debug dhcp detail command.
The following example shows the debug output when a DHCP client sends out a DHCPDISCOVER broadcast message to find its local DHCP server:
Router# debug dhcp detail00:07:16:DHCP:DHCP client process started:1000:07:16:RAC:Starting DHCP discover on Ethernet200:07:16:DHCP:Try 1 to acquire address for Ethernet200:07:16:%SYS-5-CONFIG_I:Configured from console by console00:07:19:DHCP:Shutting down from get_netinfo()00:07:19:DHCP:Attempting to shutdown DHCP Client00:07:21:DHCP:allocate request00:07:21:DHCP:new entry. add to queue00:07:21:DHCP:SDiscover attempt # 1 for entry:
The first seven lines of the following output show the current values stored in the lease entry structure for the client:
00:07:21:Temp IP addr:0.0.0.0 for peer on Interface:Ethernet200:07:21:Temp sub net mask:0.0.0.000:07:21: DHCP Lease server:0.0.0.0, state:1 Selecting00:07:21: DHCP transaction id:58200:07:21: Lease:0 secs, Renewal:0 secs, Rebind:0 secs00:07:21: Next timer fires after:00:00:0300:07:21: Retry count:1 Client-ID:cisco-0010.7b6e.afd8-Et200:07:21:DHCP:SDiscover:sending 308 byte length DHCP packet00:07:21:DHCP:SDiscover 308 bytes00:07:21: B'cast on Ethernet2 interface from 0.0.0.0
detail (Optional) Displays additional debug information.

Debug Commandsdebug dhcp
264Cisco IOS Debug Command Reference
The following example shows the offered addresses and parameters sent to the DHCP client by the DHCP server via a DHCPOFFER message. The messages containing the field “Scan” indicate the options that were scanned from the received BOOTP packet and the corresponding values.
00:07:23:DHCP:Received a BOOTREP pkt00:07:23:DHCP:Scan:Message type:DHCP Offer00:07:23:DHCP:Scan:Server ID Option:10.1.1.1 = A01010100:07:23:DHCP:Scan:Lease Time:18000:07:23:DHCP:Scan:Renewal time:9000:07:23:DHCP:Scan:Rebind time:15700:07:23:DHCP:Scan:Subnet Address Option:255.255.255.0
The following debug output shows selected fields in the received BOOTP packet:
00:07:23:DHCP:rcvd pkt source:10.1.1.1, destination: 255.255.255.25500:07:23: UDP sport:43, dport:44, length:30800:07:23: DHCP op:2, htype:1, hlen:6, hops:000:07:23: DHCP server identifier:10.1.1.100:07:23: xid:582, secs:0, flags:800000:07:23: client:0.0.0.0, your:10.1.1.200:07:23: srvr: 0.0.0.0, gw:0.0.0.000:07:23: options block length:60
00:07:23:DHCP Offer Message Offered Address:10.1.1.200:07:23:DHCP:Lease Seconds:180 Renewal secs: 90 Rebind secs:15700:07:23:DHCP:Server ID Option:10.1.1.100:07:23:DHCP:offer received from 10.1.1.1
The following example shows the debug output when the DHCP client sends out a DHCPREQUEST broadcast message to the DHCP server to accept the offered parameters:
00:07:23:DHCP:SRequest attempt # 1 for entry:00:07:23:Temp IP addr:10.1.1.2 for peer on Interface:Ethernet200:07:23:Temp sub net mask:255.255.255.000:07:23: DHCP Lease server:10.1.1.1, state:2 Requesting00:07:23: DHCP transaction id:58200:07:23: Lease:180 secs, Renewal:0 secs, Rebind:0 secs00:07:23: Next timer fires after:00:00:0200:07:23: Retry count:1 Client-ID:cisco-0010.7b6e.afd8-Et200:07:23:DHCP:SRequest- Server ID option:10.1.1.100:07:23:DHCP:SRequest- Requested IP addr option:10.1.1.200:07:23:DHCP:SRequest placed lease len option:18000:07:23:DHCP:SRequest:326 bytes00:07:23:DHCP:SRequest:326 bytes00:07:23: B'cast on Ethernet2 interface from 0.0.0.0
The following example shows the debug output when the DHCP server sends a DHCPACK message to the client with the full set of configuration parameters:
00:07:23:DHCP:Received a BOOTREP pkt00:07:23:DHCP:Scan:Message type:DHCP Ack00:07:23:DHCP:Scan:Server ID Option:10.1.1.1 = A01010100:07:23:DHCP:Scan:Lease Time:18000:07:23:DHCP:Scan:Renewal time:9000:07:23:DHCP:Scan:Rebind time:15700:07:23:DHCP:Scan:Subnet Address Option:255.255.255.000:07:23:DHCP:rcvd pkt source:10.1.1.1, destination: 255.255.255.25500:07:23: UDP sport:43, dport:44, length:30800:07:23: DHCP op:2, htype:1, hlen:6, hops:000:07:23: DHCP server identifier:10.1.1.100:07:23: xid:582, secs:0, flags:800000:07:23: client:0.0.0.0, your:10.1.1.200:07:23: srvr: 0.0.0.0, gw:0.0.0.000:07:23: options block length:60

Debug Commandsdebug dhcp
265Cisco IOS Debug Command Reference
00:07:23:DHCP Ack Messag00:07:23:DHCP:Lease Seconds:180 Renewal secs: 90 Rebind secs:15700:07:23:DHCP:Server ID Option:10.1.1.1Interface Ethernet2 assigned DHCP address 10.1.1.2, mask 255.255.255.0
00:07:26:DHCP Client Pooling:***Allocated IP address:10.1.1.200:07:26:Allocated IP address = 10.1.1.2 255.255.255.0
Most fields are self-explanatory; however, fields that may need further explanation are described in Table 38.
Related Commands
Table 38 debug dhcp Command Field Descriptions
Fields Description
DHCP:Scan:Subnet Address Option:255.255.255.0 Subnet mask option (option 1).
DHCP server identifier:1.1.1.1 Value of the DHCP server id option (option 54). Note that this is not the same as the siaddr field, which is the server IP address.
srvr:0.0.0.0, gw:0.0.0.0 srvr is the value of the siaddr field. gw is the value of the giaddr field.
Command Description
debug ip dhcp server Enables DHCP server debugging.
show dhcp lease Displays DHCP addresses leased from a server.

Debug Commandsdebug dialer events
266Cisco IOS Debug Command Reference
debug dialer eventsTo display debugging information about the packets received on a dialer interface, use the debug dialer events privileged EXEC command. The no form of this command disables debugging output.
debug dialer events
no debug dialer events
Syntax Description This command has no arguments or keywords.
Examples When DDR is enabled on the interface, information concerning the cause of any call (called the Dialing cause) is displayed. The following line of output for an IP packet lists the name of the DDR interface and the source and destination addresses of the packet:
Dialing cause: Serial0: ip (s=172.16.1.111 d=172.16.2.22)
The following line of output for a bridged packet lists the DDR interface and the type of packet (in hexadecimal). For information on these packet types, see the “Ethernet Type Codes” appendix of the Cisco IOS Bridging and IBM Networking Command Reference publication.
Dialing cause: Serial1: Bridge (0x6005)
Most messages are self-explanatory; however, messages that may need some explanation are described in Table 39.
Table 39 General debug dialer events Message Descriptions
Message Description
Dialer0: Already xxx call(s) in progress on Dialer0, dialing not allowed
Number of calls in progress (xxx) exceeds the maximum number of calls set on the interface.
Dialer0: No free dialer - starting fast idle timer
All the lines in the interface or rotary group are busy, and a packet is waiting to be sent to the destination.
BRI0: rotary group to xxx overloaded (yyy)
Number dialer (xxx) exceeds the load set on the interface (yyy).
BRI0: authenticated host xxx with no matching dialer profile
No dialer profile matches xxx, the CHAP name or remote name of the remote host.
BRI0: authenticated host xxx with no matching dialer map
No dialer map matches xxx, the CHAP name or remote name of the remote host.
BRI0: Can’t place call, verify configuration
Dialer string or dialer pool on an interface not set.

Debug Commandsdebug dialer events
267Cisco IOS Debug Command Reference
Table 40 describes the messages that the debug dialer events command can generate for a serial interface used as a V.25bis dialer for DDR.
Related Commands
Table 40 debug dialer events Message Descriptions for DDR
Message Description
Serial 0: Dialer result = xxxxxxxxxx Result returned from the V.25bis dialer. It is useful in debugging if calls are failing. On some hardware platforms, this message cannot be displayed due to hardware limitations. Possible values for the xxxxxxxxxx variable depend on the V.25bis device with which the router is communicating.
Serial 0: No dialer string defined. Dialing cannot occur.
Packet is received that should cause a call to be placed. However, no dialer string is configured, so dialing cannot occur. This message usually indicates a configuration problem.
Serial 0: Attempting to dial xxxxxxxxxx
Packet has been received that passes the dial-on-demand access lists. That packet causes phone number xxxxxxxxxx to be dialed.
Serial 0: Unable to dial xxxxxxxxxx Phone call to xxxxxxxxxx cannot be placed. This failure might be due to a lack of memory, full output queues, or other problems.
Serial 0: disconnecting call Router hangs up a call.
Serial 0: idle timeout
Serial 0: re-enable timeout
Serial 0: wait for carrier timeout
One of these three messages is displayed when a dialer timer expires. These messages are mostly informational, but are useful for debugging a disconnected call or call failure.
Command Description
debug dialer packets Displays debugging information about the packets received on a dialer interface.

Debug Commandsdebug dialer forwarding
268Cisco IOS Debug Command Reference
debug dialer forwardingTo display debugging information about the control plane at the home gateway (HGW) for Layer 2 Tunneling Protocol (L2TP) dialout, use the debug dialer forwarding command in privileged EXEC mode. The no form of this command disables debugging output.
debug dialer forwarding
no debug dialer forwarding
Syntax Description This command has no keywords or arguments.
Defaults This command is disabled by default.
Command Modes Privileged EXEC
Command History
Usage Guidelines Use the debug dialer forwarding command to configure a virtual private dialout network (VPDN) on the HGW and a network access server (NAS) to dial from the HGW to the client.
An L2TP tunnel is created between the HGW and the NAS and the packets are forwarded transparently at the NAS.
Examples The following is sample output from the debug dialer forwarding command for dialing from the HGW to the client.
Note DDR-FWD is debug dialer forwarding information. (DDR= dial-on-demand routing.)
Router# debug dialer forwarding
Dialer forwarding events debugging is on
Router# ping
Protocol [ip]:Target IP address:1.1.1.3Repeat count [5]:1Datagram size [100]:Timeout in seconds [2]:Extended commands [n]:Sweep range of sizes [n]:Type escape sequence to abort.Sending 1, 100-byte ICMP Echos to 1.1.1.3, timeout is 2 seconds:
Release Modification
12.2 T This command was introduced.

Debug Commandsdebug dialer forwarding
269Cisco IOS Debug Command Reference
1d00h:Vi3 DDR-FWD 83093A60:event [REQUEST] state before [IDLE]1d00h:Vi3 DDR-FWD 83093A60:VPN Authorization started1d00h:Vi3 DDR-FWD 83093A60:VPN author result 11d00h:Vi3 DDR-FWD 83093A60:event [AUTHOR FOUND] state before [AUTHORIZING]1d00h:Vi3 DDR-FWD 83093A60:event [FORWARDED] state before [FORWARDING]1d00h:Vi3 DDR-FWD 83093A60:Connection is up, start LCP now*Mar 2 00:31:33:%LINK-3-UPDOWN:Interface Virtual-Access3, changed state to up.Success rate is 0 percent (0/1)R2604#*Mar 2 00:31:35:%LINEPROTO-5-UPDOWN:Line protocol on Interface Virtual-Access3, changedstate to upRouter#
Outgoing call disconnected:
Router#1d00h:Vi3 DDR-FWD 83093A60:event [VPDN DISC] state before [FORWARDED]*Mar 2 00:33:33:%LINK-3-UPDOWN:Interface Virtual-Access3, changed state to down*Mar 2 00:33:34:%LINEPROTO-5-UPDOWN:Line protocol on Interface Virtual-Access3, changedstate to down
Related Commands Command Description
debug dialer events Displays debugging information about events on a dialer interface.
debug dialer packets Displays debugging information about packets received on a dialer interface.
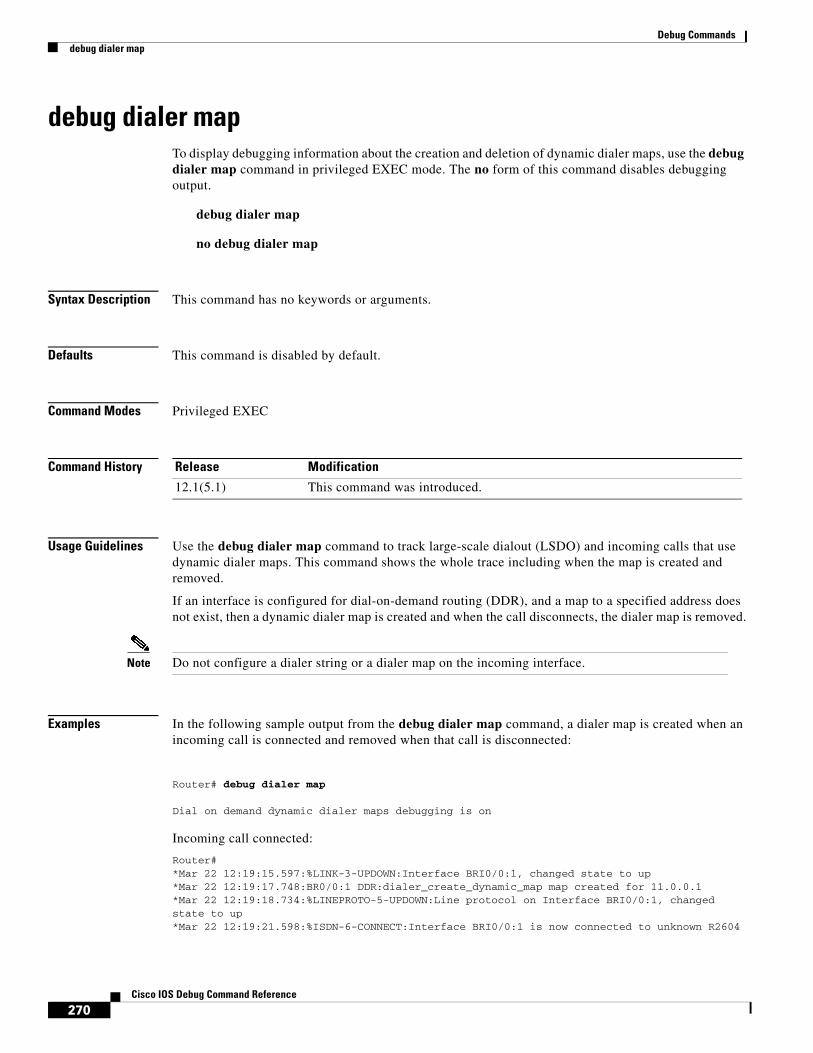
Debug Commandsdebug dialer map
270Cisco IOS Debug Command Reference
debug dialer mapTo display debugging information about the creation and deletion of dynamic dialer maps, use the debug dialer map command in privileged EXEC mode. The no form of this command disables debugging output.
debug dialer map
no debug dialer map
Syntax Description This command has no keywords or arguments.
Defaults This command is disabled by default.
Command Modes Privileged EXEC
Command History
Usage Guidelines Use the debug dialer map command to track large-scale dialout (LSDO) and incoming calls that use dynamic dialer maps. This command shows the whole trace including when the map is created and removed.
If an interface is configured for dial-on-demand routing (DDR), and a map to a specified address does not exist, then a dynamic dialer map is created and when the call disconnects, the dialer map is removed.
Note Do not configure a dialer string or a dialer map on the incoming interface.
Examples In the following sample output from the debug dialer map command, a dialer map is created when an incoming call is connected and removed when that call is disconnected:
Router# debug dialer map
Dial on demand dynamic dialer maps debugging is on
Incoming call connected:
Router# *Mar 22 12:19:15.597:%LINK-3-UPDOWN:Interface BRI0/0:1, changed state to up*Mar 22 12:19:17.748:BR0/0:1 DDR:dialer_create_dynamic_map map created for 11.0.0.1*Mar 22 12:19:18.734:%LINEPROTO-5-UPDOWN:Line protocol on Interface BRI0/0:1, changed state to up*Mar 22 12:19:21.598:%ISDN-6-CONNECT:Interface BRI0/0:1 is now connected to unknown R2604
Release Modification
12.1(5.1) This command was introduced.

Debug Commandsdebug dialer map
271Cisco IOS Debug Command Reference
Incoming call disconnected:
Router#*Mar 22 12:21:15.597:%ISDN-6-DISCONNECT:Interface BRI0/0:1 disconnected from R2604, call lasted 120 seconds*Mar 22 12:21:15.645:%LINK-3-UPDOWN:Interface BRI0/0:1, changed state to down*Mar 22 12:21:15.649:BR0/0:1 DDR:dialer_remove_dynamic_map map 11.0.0.1 removed *Mar 22 12:21:16.647:%LINEPROTO-5-UPDOWN:Line protocol on Interface BRI0/0:1, changed state to down
Related Commands Command Description
debug dialer events Displays debugging information about events on a dialer interface.
debug dialer packets Displays debugging information about packets received on a dialer interface.

Debug Commandsdebug dlsw
272Cisco IOS Debug Command Reference
debug dlswTo enable debugging of DLSw+, use the debug dlsw privileged EXEC command. The no form of this command disables debugging output.
debug dlsw [border-peers [interface interface | ip address ip-address] | core [flow-control messages | state | xid] [circuit-number] | local-circuit circuit-number | peers [interface interface [fast-errors | fast-paks] | ip address ip-address [fast-errors | fast-paks | fst-seq | udp]] | reachability [error | verbose] [sna | netbios]
no debug dlsw [border-peers [interface interface | ip address ip-address] | core [flow-control messages | state | xid] [circuit-number] | local-circuit circuit-number | peers [interface interface [fast-errors | fast-paks] | ip address ip-address [fast-errors | fast-paks | fst-seq | udp]] | reachability [error | verbose] [sna | netbios]
Syntax Description border-peers (Optional) Enables debugging output for border peer events.
interface interface (Optional) Specifies a remote peer to debug by a direct interface.
ip address ip-address (Optional) Specifies a remote peer to debug by its IP address.
core (Optional) Enables debugging output for DLSw core events.
flow-control (Optional) Enables debugging output for congestion in the WAN or at the remote end station.
messages (Optional) Enables debugging output of core messages—specific packets received by DLSw either from one of its peers or from a local medium via the Cisco link services interface.
state (Optional) Enables debugging output for state changes on the circuit.
xid (Optional) Enables debugging output for the exchange identification state machine.
circuit-number (Optional) Specifies the circuit for which you want core debugging output to reduce the of output.
local-circuit circuit-number (Optional) Enables debugging output for circuits performing local conversion. Local conversion occurs when both the input and output data-link connections are on the same local peer and no remote peer exists.
peers (Optional) Enables debugging output for peer events.
fast-errors (Optional) Debugs errors for fast-switched packets.
fast-paks (Optional) Debugs fast-switched packets.
fst-seq (Optional) Debugs FST sequence numbers on fast switched packets.
udp (Optional) Debugs UDP packets.
reachability (Optional) Enables debugging output for reachability events (explorer traffic). If no options are specified, event-level information is displayed for all protocols.

Debug Commandsdebug dlsw
273Cisco IOS Debug Command Reference
Usage Guidelines When you specify no optional keywords, the debug dlsw command enables all available DLSw debugging output.
Normally you need to use only the error or verbose option of the debug dlsw reachability command to help identify problems. The error option is recommended for use by customers and provides a subset of the messages from the normal event-level debugging. The verbose option provides a very detailed view of events, and is typically used only by service personnel.
To reduce the amount of debug information displayed, use the sna or netbios option with the debug dlsw reachability command if you know that you have an SNA or NetBIOS problem.
The DLSw core is the engine that is responsible for the establishment and maintenance of remote circuits. If possible, specifying the index of the specific circuit you want to debug reduces the amount of output displayed. However, if you want to watch a circuit initially come up, do not use the circuit-number option with the core keyword.
The core flow-control option provides information about congestion in the WAN or at the remote end station. In these cases, DLSw sends Receiver Not Ready (RNR) frames on its local circuits, slowing data traffic on established sessions and giving the congestion an opportunity to clear.
The core state option allows you to see when the circuit changes state. This capability is especially useful for determining why a session cannot be established or why a session is being disconnected.
The core XID option allows you to track the XID-state machine. The router tracks XID commands and responses used in negotiations between end stations before establishing a session.
Examples The following examples show and explain some of the typical DLSw debug messages you might see when using the debug dlsw command.
The following example enables UDP packet debugging for a specific remote peer:
Router# debug dlsw peers ip-address 1.1.1.6 udp
The following message is sample output from the debug dlsw border-peers command:
*Mar 10 17:39:56: CSM: delete group mac cache for group 0*Mar 10 17:39:56: CSM: delete group name cache for group 0*Mar 10 17:40:19: CSM: update group cache for mac 0000.3072.1070, group 10*Mar 10 17:40:22: DLSw: send_to_group_members(): copy to peer 10.19.32.5
The following message is from a router that initiated a TCP connection:
DLSw: START-TPFSM (peer 10.3.8.7(2065)): event:ADMIN-OPEN CONNECTION state:DISCONNDLSw: dtp_action_a() attempting to connect peer 10.3.8.7(2065)DLSw: END-TPFSM (peer 10.3.8.7(2065)): state:DISCONN->WAIT_WRDLSw: Async Open Callback 10.3.8.7(2065) -> 11002DLSw: START-TPFSM (peer 10.3.8.7(2065)): event:TCP-WR PIPE OPENED state:WAIT_WRDLSw: dtp_action_f() start read open timer for peer 10.3.8.7(2065)DLSw: END-TPFSM (peer 10.3.8.7(2065)): state:WAIT_WR->WAIT_RDDLSw: passive open 10.3.8.7(11004) -> 2065
error | verbose (Optional) Specifies how much reachability information you want displayed. The verbose keyword displays everything, including errors and events. The error keyword displays error information only. If no option is specified, event-level information is displayed.
sna | netbios (Optional) Specifies that reachability information be displayed for only SNA or NetBIOS protocols. If no option is specified, information for all protocols is displayed.

Debug Commandsdebug dlsw
274Cisco IOS Debug Command Reference
DLSw: START-TPFSM (peer 10.3.8.7(2065)): event:TCP-RD PIPE OPENED state:WAIT_RDDLSw: dtp_action_g() read pipe opened for peer 10.3.8.7(2065)DLSw: CapExId Msg sent to peer 10.3.8.7(2065)DLSw: END-TPFSM (peer 10.3.8.7(2065)): state:WAIT_RD->WAIT_CAPDLSw: START-TPFSM (peer 10.3.8.7(2065)): event:SSP-CAP MSG RCVD state:WAIT_CAPDLSw: dtp_action_j() cap msg rcvd from peer 10.3.8.7(2065)DLSw: Recv CapExId Msg from peer 10.3.8.7(2065)DLSw: Pos CapExResp sent to peer 10.3.8.7(2065)DLSw: END-TPFSM (peer 10.3.8.7(2065)): state:WAIT_CAP->WAIT_CAPDLSw: START-TPFSM (peer 10.3.8.7(2065)): event:SSP-CAP MSG RCVD state:WAIT_CAPDLSw: dtp_action_j() cap msg rcvd from peer 10.3.8.7(2065)DLSw: Recv CapExPosRsp Msg from peer 10.3.8.7(2065)DLSw: END-TPFSM (peer 10.3.8.7(2065)): state:WAIT_CAP->WAIT_CAPDLSw: Processing delayed event:SSP-CAP EXCHANGED - prev state:WAIT_CAPDLSw: START-TPFSM (peer 10.3.8.7(2065)): event:SSP-CAP EXCHANGED state:WAIT_CAPDLSw: dtp_action_k() cap xchged for peer 10.3.8.7(2065)DLSw: closing read pipe tcp connection for peer 10.3.8.7(2065)DLSw: END-TPFSM (peer 10.3.8.7(2065)): state:WAIT_CAP->PCONN_WTDLSw: Processing delayed event:TCP-PEER CONNECTED - prev state:PCONN_WTDLSw: START-TPFSM (peer 10.3.8.7(2065)): event:TCP-PEER CONNECTED state:PCONN_WTDLSw: dtp_action_m() peer connected for peer 10.3.8.7(2065)DLSw: END-TPFSM (peer 10.3.8.7(2065)): state:PCONN_WT->CONNECTDLSw: START-TPFSM (peer 10.3.8.7(2065)): event:CORE-ADD CIRCUIT state:CONNECTDLSw: dtp_action_u(), peer add circuit for peer 10.3.8.7(2065)DLSw: END-TPFSM (peer 10.3.8.7(2065)): state:CONNECT->CONNECT
The following message is from a router that received a TCP connection:
DLSw: passive open 10.10.10.4(11002) -> 2065DLSw: START-TPFSM (peer 10.10.10.4(2065)): event:TCP-RD PIPE OPENED state:DISCONNDLSw: dtp_action_c() opening write pipe for peer 10.10.10.4(2065)DLSw: END-TPFSM (peer 10.10.10.4(2065)): state:DISCONN->WWR_RDOPDLSw: Async Open Callback 10.10.10.4(2065) -> 11004DLSw: START-TPFSM (peer 10.10.10.4(2065)): event:TCP-WR PIPE OPENED state:WWR_RDOPDLSw: dtp_action_i() write pipe opened for peer 10.10.10.4(2065)DLSw: CapExId Msg sent to peer 10.10.10.4(2065)DLSw: END-TPFSM (peer 10.10.10.4(2065)): state:WWR_RDOP->WAIT_CAPDLSw: START-TPFSM (peer 10.10.10.4(2065)): event:SSP-CAP MSG RCVD state:WAIT_CAPDLSw: dtp_action_j() cap msg rcvd from peer 10.10.10.4(2065)DLSw: Recv CapExId Msg from peer 10.10.10.4(2065)DLSw: Pos CapExResp sent to peer 10.10.10.4(2065)DLSw: END-TPFSM (peer 10.10.10.4(2065)): state:WAIT_CAP->WAIT_CAPDLSw: START-TPFSM (peer 10.10.10.4(2065)): event:SSP-CAP MSG RCVD state:WAIT_CAPDLSw: dtp_action_j() cap msg rcvd from peer 10.10.10.4(2065)DLSw: Recv CapExPosRsp Msg from peer 10.10.10.4(2065)DLSw: END-TPFSM (peer 10.10.10.4(2065)): state:WAIT_CAP->WAIT_CAPDLSw: Processing delayed event:SSP-CAP EXCHANGED - prev state:WAIT_CAPDLSw: START-TPFSM (peer 10.10.10.4(2065)): event:SSP-CAP EXCHANGED state:WAIT_CAPDLSw: dtp_action_k() cap xchged for peer 10.10.10.4(2065)DLSw: END-TPFSM (peer 10.10.10.4(2065)): state:WAIT_CAP->PCONN_WTDLSw: dlsw_tcpd_fini() for peer 10.10.10.4(2065)DLSw: dlsw_tcpd_fini() closing write pipe for peer 10.10.10.4DLSw: START-TPFSM (peer 10.10.10.4(2065)): event:TCP-CLOSE WR PIPE state:PCONN_WTDLSw: dtp_action_l() close write pipe for peer 10.10.10.4(2065)DLSw: closing write pipe tcp connection for peer 10.10.10.4(2065)DLSw: END-TPFSM (peer 10.10.10.4(2065)): state:PCONN_WT->PCONN_WTDLSw: Processing delayed event:TCP-PEER CONNECTED - prev state:PCONN_WTDLSw: START-TPFSM (peer 10.10.10.4(2065)): event:TCP-PEER CONNECTED state:PCONN_WTDLSw: dtp_action_m() peer connected for peer 10.10.10.4(2065)DLSw: END-TPFSM (peer 10.10.10.4(2065)): state:PCONN_WT->CONNECTDLSw: START-TPFSM (peer 10.10.10.4(2065)): event:CORE-ADD CIRCUIT state:CONNECTDLSw: dtp_action_u(), peer add circuit for peer 10.10.10.4(2065)DLSw: END-TPFSM (peer 10.10.10.4(2065)): state:CONNECT->CONNECT

Debug Commandsdebug dlsw
275Cisco IOS Debug Command Reference
The following message is from a router that initiated an FST connection:
DLSw: START-FSTPFSM (peer 10.10.10.4(0)): event:ADMIN-OPEN CONNECTION state:DISCONNDLSw: dfstp_action_a() attempting to connect peer 10.10.10.4(0)DLSw: Connection opened for peer 10.10.10.4(0)DLSw: CapExId Msg sent to peer 10.10.10.4(0)DLSw: END-FSTPFSM (peer 10.10.10.4(0)): state:DISCONN->WAIT_CAPDLSw: START-FSTPFSM (peer 10.10.10.4(0)): event:SSP-CAP MSG RCVD state:WAIT_CAPDLSw: dfstp_action_e() cap msg rcvd for peer 10.10.10.4(0)DLSw: Recv CapExPosRsp Msg from peer 10.10.10.4(0)DLSw: END-FSTPFSM (peer 10.10.10.4(0)): state:WAIT_CAP->WAIT_CAPDLSw: START-FSTPFSM (peer 10.10.10.4(0)): event:SSP-CAP MSG RCVD state:WAIT_CAPDLSw: dfstp_action_e() cap msg rcvd for peer 10.10.10.4(0)DLSw: Recv CapExId Msg from peer 10.10.10.4(0)DLSw: Pos CapExResp sent to peer 10.10.10.4(0)DLSw: END-FSTPFSM (peer 10.10.10.4(0)): state:WAIT_CAP->WAIT_CAPDLSw: Processing delayed event:SSP-CAP EXCHANGED - prev state:WAIT_CAPDLSw: START-FSTPFSM (peer 10.10.10.4(0)): event:SSP-CAP EXCHANGED state:WAIT_CAPDLSw: dfstp_action_f() cap xchged for peer 10.10.10.4(0)DLSw: END-FSTPFSM (peer 10.10.10.4(0)): state:WAIT_CAP->CONNECT
The following message is from a router that received an FST connection:
DLSw: START-FSTPFSM (peer 10.3.8.7(0)): event:SSP-CAP MSG RCVD state:DISCONNDLSw: dfstp_action_c() cap msg rcvd for peer 10.3.8.7(0)DLSw: Recv CapExId Msg from peer 10.3.8.7(0)DLSw: Pos CapExResp sent to peer 10.3.8.7(0)DLSw: CapExId Msg sent to peer 10.3.8.7(0)DLSw: END-FSTPFSM (peer 10.3.8.7(0)): state:DISCONN->WAIT_CAPDLSw: START-FSTPFSM (peer 10.3.8.7(0)): event:SSP-CAP MSG RCVD state:WAIT_CAPDLSw: dfstp_action_e() cap msg rcvd for peer 10.3.8.7(0)DLSw: Recv CapExPosRsp Msg from peer 10.3.8.7(0)DLSw: END-FSTPFSM (peer 10.3.8.7(0)): state:WAIT_CAP->WAIT_CAPDLSw: Processing delayed event:SSP-CAP EXCHANGED - prev state:WAIT_CAPDLSw: START-FSTPFSM (peer 10.3.8.7(0)): event:SSP-CAP EXCHANGED state:WAIT_CAPDLSw: dfstp_action_f() cap xchged for peer 10.3.8.7(0)DLSw: END-FSTPFSM (peer 10.3.8.7(0)): state:WAIT_CAP->CONNECT
The following message is from a router that initiated an LLC2 connection:
DLSw-LLC2: Sending enable port ; port no : 0 PEER-DISP Sent : CLSI Msg : ENABLE.Req dlen: 20 DLSw: Peer Received : CLSI Msg : ENABLE.Cfm CLS_OK dlen: 20 DLSw-LLC2 : Sending activate sap for Serial1 - port_id = 887C3C port_type = 7 dgra(UsapID) = 952458 PEER-DISP Sent : CLSI Msg : ACTIVATE_SAP.Req dlen: 60 DLSw: Peer Received : CLSI Msg : ACTIVATE_SAP.Cfm CLS_OK dlen: 60 DLSw Got ActSapcnf back for Serial1 - port_id = 8978204, port_type = 7, psap_id = 0
DLSw: START-LLC2PFSM (peer on interface Serial1): event:ADMIN-OPEN CONNECTION state:DISCONNDLSw: dllc2p_action_a() attempting to connect peer on interface Serial1 PEER-DISP Sent : CLSI Msg : REQ_OPNSTN.Req dlen: 106 DLSw: END-LLC2PFSM (peer on interface Serial1): state:DISCONN->ROS_SENT
DLSw: Peer Received : CLSI Msg : REQ_OPNSTN.Cfm CLS_OK dlen: 106 DLSw: START-LLC2PFSM (peer on interface Serial1): event:CLS-REQOPNSTN.CNF state:ROS_SENTDLSw: dllc2p_action_c() PEER-DISP Sent : CLSI Msg : CONNECT.Req dlen: 16 DLSw: END-LLC2PFSM (peer on interface Serial1): state:ROS_SENT->CON_PEND
DLSw: Peer Received : CLSI Msg : CONNECT.Cfm CLS_OK dlen: 28 DLSw: START-LLC2PFSM (peer on interface Serial1): event:CLS-CONNECT.CNF state:CON_PENDDLSw: dllc2p_action_e() send capabilities to peer on interface Serial1 PEER-DISP Sent : CLSI Msg : SIGNAL_STN.Req dlen: 8

Debug Commandsdebug dlsw
276Cisco IOS Debug Command Reference
PEER-DISP Sent : CLSI Msg : DATA.Req dlen: 418 DLSw: CapExId Msg sent to peer on interface Serial1DLSw: END-LLC2PFSM (peer on interface Serial1): state:CON_PEND->WAIT_CAP
DLSw: Peer Received : CLSI Msg : DATA.Ind dlen: 418 DLSw: START-LLC2PFSM (peer on interface Serial1): event:SSP-CAP MSG RCVD state:WAIT_CAPDLSw: dllc2p_action_k() cap msg rcvd for peer on interface Serial1DLSw: Recv CapExId Msg from peer on interface Serial1 PEER-DISP Sent : CLSI Msg : DATA.Req dlen: 96 DLSw: Pos CapExResp sent to peer on interface Serial1DLSw: END-LLC2PFSM (peer on interface Serial1): state:WAIT_CAP->WAIT_CAP
DLSw: Peer Received : CLSI Msg : DATA.Ind dlen: 96 DLSw: START-LLC2PFSM (peer on interface Serial1): event:SSP-CAP MSG RCVD state:WAIT_CAPDLSw: dllc2p_action_k() cap msg rcvd for peer on interface Serial1DLSw: Recv CapExPosRsp Msg from peer on interface Serial1DLSw: END-LLC2PFSM (peer on interface Serial1): state:WAIT_CAP->WAIT_CAP
DLSw: Processing delayed event:SSP-CAP EXCHANGED - prev state:WAIT_CAPDLSw: START-LLC2PFSM (peer on interface Serial1): event:SSP-CAP EXCHANGED state:WAIT_CAPDLSw: dllc2p_action_l() cap xchged for peer on interface Serial1DLSw: END-LLC2PFSM (peer on interface Serial1): state:WAIT_CAP->CONNECT
The following message is from a router that received an LLC2 connection:
DLSw-LLC2: Sending enable port ; port no : 0 PEER-DISP Sent : CLSI Msg : ENABLE.Req dlen: 20 DLSw: Peer Received : CLSI Msg : ENABLE.Cfm CLS_OK dlen: 20 DLSw-LLC2 : Sending activate sap for Serial0 - port_id = 887C3C port_type = 7 dgra(UsapID) = 93AB34 PEER-DISP Sent : CLSI Msg : ACTIVATE_SAP.Req dlen: 60 DLSw: Peer Received : CLSI Msg : ACTIVATE_SAP.Cfm CLS_OK dlen: 60 DLSw Got ActSapcnf back for Serial0 - port_id = 8944700, port_type = 7, psap_id = 0
DLSw: Peer Received : CLSI Msg : CONECT_STN.Ind dlen: 39 DLSw: START-LLC2PFSM (peer on interface Serial0): event:CLS-CONNECT_STN.IND state:DISCONNDLSw: dllc2p_action_s() conn_stn for peer on interface Serial0 PEER-DISP Sent : CLSI Msg : REQ_OPNSTN.Req dlen: 106 DLSw: END-LLC2PFSM (peer on interface Serial0): state:DISCONN->CONS_PEND
DLSw: Peer Received : CLSI Msg : REQ_OPNSTN.Cfm CLS_OK dlen: 106 DLSw: START-LLC2PFSM (peer on interface Serial0): event:CLS-REQOPNSTN.CNF state:CONS_PENDDLSw: dllc2p_action_h() send capabilities to peer on interface Serial0 PEER-DISP Sent : CLSI Msg : CONNECT.Rsp dlen: 20 PEER-DISP Sent : CLSI Msg : DATA.Req dlen: 418 DLSw: CapExId Msg sent to peer on interface Serial0DLSw: END-LLC2PFSM (peer on interface Serial0): state:CONS_PEND->WAIT_CAP
DLSw: Peer Received : CLSI Msg : CONNECTED.Ind dlen: 8 DLSw: START-LLC2PFSM (peer on interface Serial0): event:CLS-CONNECTED.IND state:WAIT_CAPDLSw: END-LLC2PFSM (peer on interface Serial0): state:WAIT_CAP->WAIT_CAP
DLSw: Peer Received : CLSI Msg : DATA.Ind dlen: 418 DLSw: START-LLC2PFSM (peer on interface Serial0): event:SSP-CAP MSG RCVD state:WAIT_CAPDLSw: dllc2p_action_k() cap msg rcvd for peer on interface Serial0DLSw: Recv CapExId Msg from peer on interface Serial0 PEER-DISP Sent : CLSI Msg : DATA.Req dlen: 96 DLSw: Pos CapExResp sent to peer on interface Serial0DLSw: END-LLC2PFSM (peer on interface Serial0): state:WAIT_CAP->WAIT_CAP
DLSw: Peer Received : CLSI Msg : DATA.Ind dlen: 96 DLSw: START-LLC2PFSM (peer on interface Serial0): event:SSP-CAP MSG RCVD state:WAIT_CAPDLSw: dllc2p_action_k() cap msg rcvd for peer on interface Serial0DLSw: Recv CapExPosRsp Msg from peer on interface Serial0

Debug Commandsdebug dlsw
277Cisco IOS Debug Command Reference
DLSw: END-LLC2PFSM (peer on interface Serial0): state:WAIT_CAP->WAIT_CAP
DLSw: Processing delayed event:SSP-CAP EXCHANGED - prev state:WAIT_CAPDLSw: START-LLC2PFSM (peer on interface Serial0): event:SSP-CAP EXCHANGED state:WAIT_CAPDLSw: dllc2p_action_l() cap xchged for peer on interface Serial0DLSw: END-LLC2PFSM (peer on interface Serial0): state:WAIT_CAP->CONNECT
The following messages occur when a CUR_ex (CANUREACH explorer) frame is received from other peers, and the peer statements or the promiscuous keyword have not been enabled so that the router is not configured correctly:
22:42:44: DLSw: Not promiscuous - Rej conn from 172.20.96.1(2065)22:42:51: DLSw: Not promiscuous - Rej conn from 172.20.99.1(2065)
In the following messages, the router sends a keepalive message every 30 seconds to keep the peer connected. If three keepalive messages are missed, the peer is torn down. These messages are displayed only if keepalives are enabled (by default, keepalives are disabled):
22:44:03: DLSw: Keepalive Request sent to peer 172.20.98.1(2065) (168243148)22:44:03: DLSw: Keepalive Response from peer 172.20.98.1(2065) (168243176)22:44:34: DLSw: Keepalive Request sent to peer 172.20.98.1(2065) (168274148)22:44:34: DLSw: Keepalive Response from peer 172.20.98.1(2065) (168274172)
The following peer debug messages indicate that the local peer is disconnecting from the specified remote peer because of missed peer keepalives:
0:03:24: DLSw: keepalive failure for peer on interface Serial00:03:24: DLSw: action_d(): for peer on interface Serial00:03:24: DLSW: DIRECT aborting connection for peer on interface Serial00:03:24: DLSw: peer on interface Serial0, old state CONNECT, new state DISCONN
The following peer debug messages result from an attempt to connect to an IP address that does not have DLSw enabled. The local router attempts to connect in 30-second intervals:
23:13:22: action_a() attempting to connect peer 172.20.100.1(2065)23:13:22: DLSw: CONN: peer 172.20.100.1 open failed, rejected [9]23:13:22: action_a() retries: 8 next conn time: 86123250423:13:52: action_a() attempting to connect peer 172.20.100.1(2065)23:13:52: DLSw: CONN: peer 172.20.100.1 open failed, rejected [9]23:13:52: action_a() retries: 9 next conn time: 861292536
The following peer debug messages that indicates a remote peer statement is missing on the router (address 172.20.100.1) to which the connection attempt is sent:
23:14:52: action_a() attempting to connect peer 172.20.100.1(2065)23:14:52: DLSw: action_a(): Write pipe opened for peer 172.20.100.1(2065)23:14:52: DLSw: peer 172.20.100.1(2065), old state DISCONN, new state WAIT_RD23:14:52: DLSw: dlsw_tcpd_fini() closing connection for peer 172.20.100.123:14:52: DLSw: action_d(): for peer 172.20.100.1(2065)23:14:52: DLSw: aborting tcp connection for peer 172.20.100.1(2065)23:14:52: DLSw: peer 172.20.100.1(2065), old state WAIT_RD, new state DISCONN
The following messages show a peer connection opening with no errors or abnormal events:
23:16:37: action_a() attempting to connect peer 172.20.100.1(2065)23:16:37: DLSw: action_a(): Write pipe opened for peer 172.20.100.1(2065)23:16:37: DLSw: peer 172.20.100.1(2065), old state DISCONN, new state WAIT_RD23:16:37: DLSW: passive open 172.20.100.1(17762) -> 206523:16:37: DLSw: action_c(): for peer 172.20.100.1(2065)23:16:37: DLSw: peer 172.20.100.1(2065), old state WAIT_RD, new state CAP_EXG23:16:37: DLSw: peer 172.20.100.1(2065) conn_start_time set to 86139778423:16:37: DLSw: CapExId Msg sent to peer 172.20.100.1(2065)23:16:37: DLSw: Recv CapExId Msg from peer 172.20.100.1(2065)23:16:37: DLSw: Pos CapExResp sent to peer 172.20.100.1(2065)

Debug Commandsdebug dlsw
278Cisco IOS Debug Command Reference
23:16:37: DLSw: action_e(): for peer 172.20.100.1(2065)23:16:37: DLSw: Recv CapExPosRsp Msg from peer 172.20.100.1(2065)23:16:37: DLSw: action_e(): for peer 172.20.100.1(2065)23:16:37: DLSw: peer 172.20.100.1(2065), old state CAP_EXG, new state CONNECT23:16:37: DLSw: dlsw_tcpd_fini() closing write pipe for peer 172.20.100.123:16:37: DLSw: action_g(): for peer 172.20.100.1(2065)23:16:37: DLSw: closing write pipe tcp connection for peer 172.20.100.1(2065)23:16:38: DLSw: peer_act_on_capabilities() for peer 172.20.100.1(2065)
The following two messages show that an information frame is passing through the router:
DLSw: dlsw_tr2fct() lmac:c000.a400.0000 rmac:0800.5a29.75fe ls:5 rs:4 i:34DLSw: dlsw_tr2fct() lmac:c000.a400.0000 rmac:0800.5a29.75fe ls:4 rs:4 i:34
Sample Debug DLSw Reachability Messages
The messages in this section are based on the following criteria:
• Reachability is stored in cache. DLSw+ maintains two reachability caches: one for MAC addresses and one for NetBIOS names. Depending on how long entries have been in the cache, they are either fresh or stale.
• If a router has a fresh entry in the cache for a certain resource, it answers a locate request for that resource without verifying that it is still available. A locate request is typically a TEST frame for MAC addresses or a FIND_NAME_QUERY for NetBIOS.
• If a router has a stale entry in the cache for a certain resource, it verifies that the entry is still valid before answering a locate request for the resource by sending a frame to the last known location of the resource and waits for a resource. If the entry is a REMOTE entry, the router sends a CUR_ex frame to the remote peer to verify. If the entry is a LOCAL entry, it sends either a TEST frame or a NetBIOS FIND_NAME_QUERY on the appropriate local port.
• By default, all reachability cache entries remain fresh for 4 minutes after they are learned. For MAC addresses, you can change this time with the dlsw timer sna-verify-interval command. For NetBIOS names, you can change this time with the dlsw timer netbios-verify-interval command.
• By default, all reachability cache entries age out of the cache 16 minutes after they are learned. For MAC addresses, you can change this time with the dlsw timer sna-cache-timeout command. For NetBIOS names, you can change the time with the dlsw timer netbios-cache-timeout command.
Table 41 describes the debug output indicating that the DLSW router received an SSP message that is flow controlled and should be counted against the window of the sender.
Dec 6 11:26:49: CSM: Received SSP CUR csex flags = 80, mac 4000.90b1.26cf,The csex flags = 80 means that this is an CUR_ex (explorer).Dec 5 10:48:33: DLSw: 1620175180 decr r - s:27 so:0 r:27 ro:0
Table 41 Debug Output Command Descriptions
Field Description
decr r Decrement received count.
s This DLSW router’s granted units for the circuit.
so 0=This DLSW router does not owe a flow control acknowledgment.
1=This router owes a flow control acknowledgment.
r Partner’s number of granted units for the circuit.
ro Indicates whether the partner owes flow control acknowledgment.

Debug Commandsdebug dlsw
279Cisco IOS Debug Command Reference
The following message shows that DLSw is sending an I frame to a LAN:
Dec 5 10:48:33: DISP Sent : CLSI Msg : DATA.Req dlen: 1086
The following message shows that DLSw received the I frame from the LAN:
Dec 5 10:48:35: DLSW Received-disp : CLSI Msg : DATA.Ind dlen: 4
The following messages show that the reachability cache is cleared:
Router# clear dlsw rea
23:44:11: CSM: Clearing CSM cache23:44:11: CSM: delete local mac cache for port 023:44:11: CSM: delete local name cache for port 023:44:11: CSM: delete remote mac cache for peer 023:44:11: CSM: delete remote name cash dlsw rea
The next group of messages show that the DLSw reachability cache is added, and that a name query is perform from the router Marian:
23:45:11: CSM: core_to_csm CLSI_MSG_PROC - port_id 5EFBB423:45:11: CSM: 0800.5a30.7a9b passes local mac excl. filter23:45:11: CSM: update local cache for mac 0800.5a30.7a9b, port 5EFBB423:45:11: CSM: update local cache for name MARIAN , port 5EFBB423:45:11: CSM: Received CLS_UDATA_STN from Core23:45:11: CSM: Received netbios frame type A23:45:11: CSM: Processing Name Query23:45:11: CSM: Netbios Name Query: ws_status = 623:45:11: CSM: Write to peer 0 ok.23:45:11: CSM: Freeing clsi message23:45:11: CSM: core_to_csm CLSI_MSG_PROC - port_id 658AB423:45:11: CSM: 0800.5a30.7a9b passes local mac excl. filter23:45:11: CSM: update local cache for mac 0800.5a30.7a9b, port 658AB423:45:11: CSM: update local cache for name MARIAN , port 658AB423:45:11: CSM: Received CLS_UDATA_STN from Core23:45:11: CSM: Received netbios frame type A23:45:11: CSM: Processing Name Query23:45:11: CSM: Netbios Name Query: ws_status = 523:45:11: CSM: DLXNR_PEND match found.... drop name query23:45:11: CSM: Freeing clsi message23:45:12: CSM: core_to_csm CLSI_MSG_PROC - port_id 5EFBB423:45:12: CSM: 0800.5a30.7a9b passes local mac excl. filter23:45:12: CSM: update local cache for mac 0800.5a30.7a9b, port 5EFBB423:45:12: CSM: update local cache for name MARIAN , port 5EFBB423:45:12: CSM: Received CLS_UDATA_STN from Core23:45:12: CSM: Received netbios frame type A23:45:12: CSM: Processing Name Query23:45:12: CSM: Netbios Name Query: ws_status = 523:45:12: CSM: DLXNR_PEND match found.... drop name query23:45:12: CSM: Freeing clsi message23:45:12: CSM: core_to_csm CLSI_MSG_PROC - port_id 658AB423:45:12: CSM: 0800.5a30.7a9b passes local mac excl. filter23:45:12: CSM: update local cache for mac 0800.5a30.7a9b, port 658AB423:45:12: CSM: update local cache for name MARIAN , port 658AB423:45:12: CSM: Received CLS_UDATA_STN from Core23:45:12: CSM: Received netbios frame type A23:45:12: CSM: Processing Name Query23:45:12: CSM: Netbios Name Query: ws_status = 523:45:12: CSM: DLXNR_PEND match found.... drop name query23:45:12: CSM: Freeing clsi message23:45:12: CSM: core_to_csm CLSI_MSG_PROC - port_id 5EFBB423:45:12: CSM: 0800.5a30.7a9b passes local mac excl. filter23:45:12: CSM: update local cache for mac 0800.5a30.7a9b, port 5EFBB423:45:12: CSM: update local cache for name MARIAN , port 5EFBB4

Debug Commandsdebug dlsw
280Cisco IOS Debug Command Reference
23:45:12: CSM: Received CLS_UDATA_STN from Core23:45:12: CSM: Received netbios frame type A23:45:12: CSM: Processing Name Query23:45:12: CSM: Netbios Name Query: ws_status = 523:45:12: CSM: DLXNR_PEND match found.... drop name query23:45:12: CSM: Freeing clsi message23:45:12: CSM: core_to_csm CLSI_MSG_PROC - port_id 658AB423:45:12: CSM: 0800.5a30.7a9b passes local mac excl. filter23:45:12: CSM: update local cache for mac 0800.5a30.7a9b, port 658AB423:45:12: CSM: update local cache for name MARIAN , port 658AB423:45:12: CSM: Received CLS_UDATA_STN from Core23:45:12: CSM: Received netbios frame type A23:45:12: CSM: Processing Name Query23:45:12: CSM: Netbios Name Query: ws_status = 523:45:12: CSM: DLXNR_PEND match found.... drop name query23:45:12: CSM: Freeing clsi message23:45:18: CSM: Deleting Reachability cache23:45:18: CSM: Deleting DLX NR pending record....23:45:38: CSM: core_to_csm CLSI_MSG_PROC - port_id 5EFBB423:45:38: CSM: 0800.5a30.7a9b passes local mac excl. filter23:45:38: CSM: update local cache for mac 0800.5a30.7a9b, port 5EFBB423:45:38: CSM: update local cache for name MARIAN , port 5EFBB423:45:38: CSM: Received CLS_UDATA_STN from Core23:45:38: CSM: Received netbios frame type 823:45:38: CSM: Write to peer 0 ok.23:45:38: CSM: Freeing clsi message23:45:38: CSM: core_to_csm CLSI_MSG_PROC - port_id 658AB423:45:38: CSM: 0800.5a30.7a9b passes local mac excl. filter23:45:38: CSM: update local cache for mac 0800.5a30.7a9b, port 658AB423:45:38: CSM: update local cache for name MARIAN , port 658AB423:45:38: CSM: Received CLS_UDATA_STN from Core23:45:38: CSM: Received netbios frame type 823:45:38: CSM: Write to peer 0 ok.23:45:38: CSM: Freeing clsi message
The following messages show that the router named Marian is added to the network:
23:45:38: CSM: core_to_csm CLSI_MSG_PROC - port_id 5EFBB423:45:38: CSM: 0800.5a30.7a9b passes local mac excl. filter23:45:38: CSM: update local cache for mac 0800.5a30.7a9b, port 5EFBB423:45:38: CSM: update local cache for name MARIAN , port 5EFBB423:45:38: CSM: Received CLS_UDATA_STN from Core23:45:38: CSM: Received netbios frame type 823:45:38: CSM: Write to peer 0 ok.23:45:38: CSM: Freeing clsi message23:45:38: CSM: core_to_csm CLSI_MSG_PROC - port_id 658AB423:45:38: CSM: 0800.5a30.7a9b passes local mac excl. filter23:45:38: CSM: update local cache for mac 0800.5a30.7a9b, port 658AB423:45:38: CSM: update local cache for name MARIAN , port 658AB423:45:38: CSM: Received CLS_UDATA_STN from Core23:45:38: CSM: Received netbios frame type 823:45:38: CSM: Write to peer 0 ok.23:45:38: CSM: Freeing clsi message
In the next group of messages, an attempt is made to add the router named Ginger on the Ethernet interface:
0:07:44: CSM: core_to_csm CLSI_MSG_PROC - port_id 658AB40:07:44: CSM: 0004.f545.24e6 passes local mac excl. filter0:07:44: CSM: update local cache for mac 0004.f545.24e6, port 658AB40:07:44: CSM: update local cache for name GINGER , port 658AB40:07:44: CSM: Received CLS_UDATA_STN from Core0:07:44: CSM: Received netbios frame type 80:07:44: CSM: Write to peer 0 ok.

Debug Commandsdebug dlsw
281Cisco IOS Debug Command Reference
In the following example, the output from the show dlsw reachability command indicates that Ginger is on the Ethernet interface and Marian is on the Token Ring interface:
Router# show dlsw reachability
DLSw MAC address reachability cache listMac Addr status Loc. peer/port rif0004.f545.24e6 FOUND LOCAL P007-S000 --no rif--0800.5a30.7a9b FOUND LOCAL P000-S000 06C0.0621.7D00 P007-S000 F0F8.0006.A6FC.005F.F100.0000.0000.0000
DLSw NetBIOS Name reachability cache listNetBIOS Name status Loc. peer/port rifGINGER FOUND LOCAL P007-S000 --no rif--MARIAN FOUND LOCAL P000-S000 06C0.0621.7D00 P007-S000 --no rif--

Debug Commandsdebug dmsp doc-to-fax
282Cisco IOS Debug Command Reference
debug dmsp doc-to-faxTo display debug messages for the doc Media Service Provider TIFF or text2Fax engine, use the debug dmsp doc-to-fax EXEC command. To disable the debug messages, use the no form of this command.
debug dmsp doc-to-fax [text-to-fax | tiff-reader]
no debug dmsp doc-to-fax [text-to-fax | tiff-reader]
Syntax Description
Defaults No default behavior or values.
Command History
Examples The following example displays output from the debug dmsp doc-to-fax command.
Router# debug dmsp doc-to-fax
Jan 1 04:58:39.898: docmsp_call_setup_request: callid=18 Jan 1 04:58:39.902: docmsp_call_setup_request(): ramp data dir=OFFRAMP, conf dir=SRCJan 1 04:58:39.902: docmsp_caps_ind: call id=18, src=17Jan 1 04:58:39.902: docmsp_bridge cfid=5, srccid=18, dstcid=17
Jan 1 04:58:39.902: docmsp_bridge(): ramp data dir=OFFRAMP, conf dir=SRC, encode out=2Jan 1 04:58:39.902: docmsp_rcv_msp_ev: call id =18, evID = 42 Jan 1 04:58:39.902: docmsp_bridge cfid=6, srccid=18, dstcid=15
Jan 1 04:58:39.902: docmsp_bridge(): ramp data dir=OFFRAMP, conf dir=DEST, encode out=2Jan 1 04:58:39.902: docmsp_process_rcv_data: call id src=0, dst=18 Jan 1 04:58:39.902: docmsp_generate_page: Jan 1 04:58:39.902: docmsp_generate_page: new context for Call 18Jan 1 04:58:39.922: docmsp_get_msp_event_buffer: Jan 1 04:58:42.082: docmsp_xmit: call id src=15, dst=18Jan 1 04:58:42.082: docmsp_process_rcv_data: call id src=15, dst=18 Jan 1 04:58:42.082: offramp_data_process: Jan 1 04:58:42.102: docmsp_xmit: call id src=15, dst=18Jan 1 04:58:42.106: docmsp_process_rcv_data: call id src=15, dst=18 Jan 1 04:58:42.106: offramp_data_process: Jan 1 04:58:42.122: docmsp_xmit: call id src=15, dst=18Jan 1 04:58:42.126: docmsp_process_rcv_data: call id src=15, dst=18 Jan 1 04:58:42.126: offramp_data_process: Jan 1 04:58:42.142: docmsp_xmit: call id src=15, dst=18Jan 1 04:58:42.146: docmsp_xmit: call id src=15, dst=18
text-to-fax (Optional) Displays debug messages that occur while the DocMSP Component is receiving text packets and producing T4 fax data.
tiff-reader (Optional) Displays debug messages that occur while the DocMSP Component is receiving TIFF packets and producing T4 fax data.
Release Modification
12.1(3)XI This command was introduced on the Cisco AS5300 access server.

Debug Commandsdebug dmsp doc-to-fax
283Cisco IOS Debug Command Reference
Related Commands Command Description
debug dmsp fax-to-doc Displays debug messages for the doc Media Service Provider fax-to-doc TIFF engine.

Debug Commandsdebug dmsp doc-to-fax
284Cisco IOS Debug Command Reference