debugger and profiler 1 for tizen - … · • development of testing and debugging tools for...
TRANSCRIPT
1
Copyright © 2017 Samsung. All Rights Reserved.
Debugger and Profiler for Tizen .NET Igor Kulaychuk [email protected]
2
Igor Kulaychuk • Leading Software Engineer at Samsung R&D Institute Russia • Part of Tizen .NET team • Responsible for development of Debugger for Tizen .NET Experience: • Development of testing and debugging tools for Android/Tizen • C/C++/Linux/ptrace
About me
3
Visual Studio Tools for Tizen .NET Debugger / Profiler
– overview – demo
Outline
4
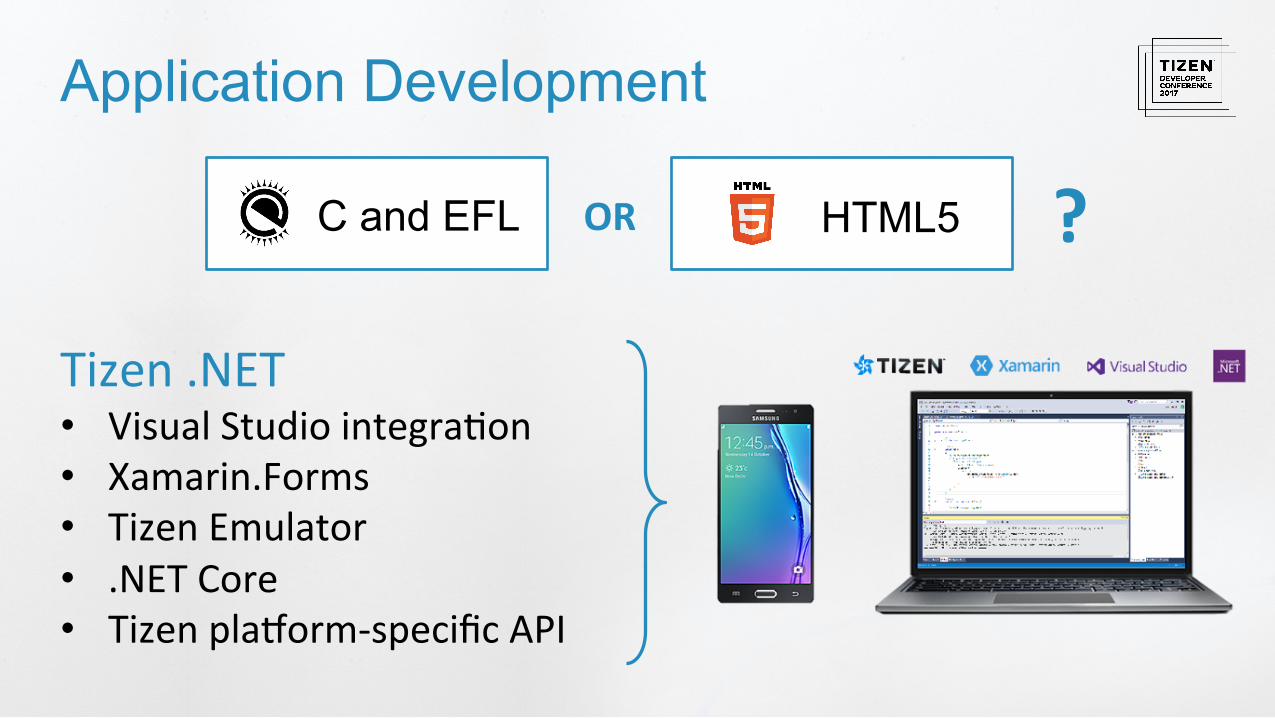
Application Development
Tizen .NET • Visual Studio integra5on • Xamarin.Forms • Tizen Emulator • .NET Core • Tizen pla;orm-‐specific API
C and EFL HTML5 OR ?
5
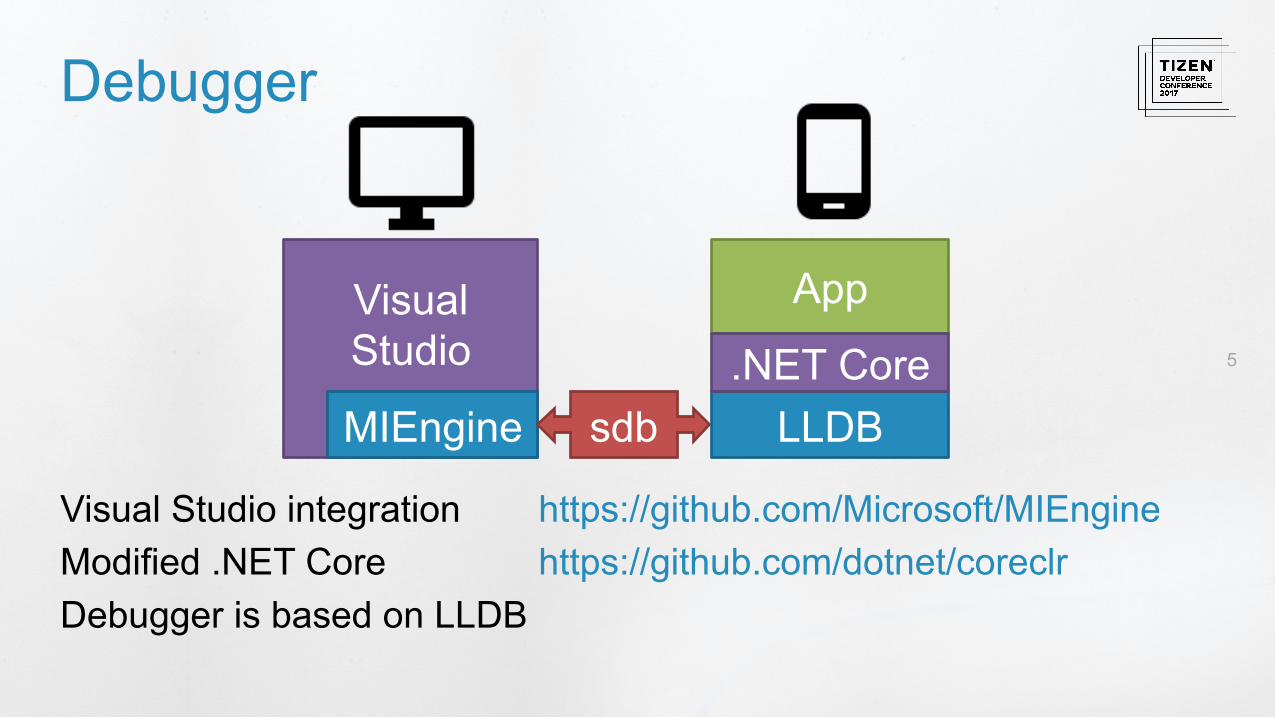
Visual Studio integration https://github.com/Microsoft/MIEngine Modified .NET Core https://github.com/dotnet/coreclr Debugger is based on LLDB
Debugger
Visual Studio
MIEngine sdb LLDB
App
.NET Core

6
• Application: – FizzBuzz (bug: prints “Buzz” on 15)
• Debugging scenario:
– Put breakpoint at the start of new list item generation code – Add condition currentNumber == 15 – Step through code and find where the bug occurs
Debugger Demo
1 2 Fizz 4 Buzz … 14 FizzBuzz 16
7
DEMO Debugger demo
8
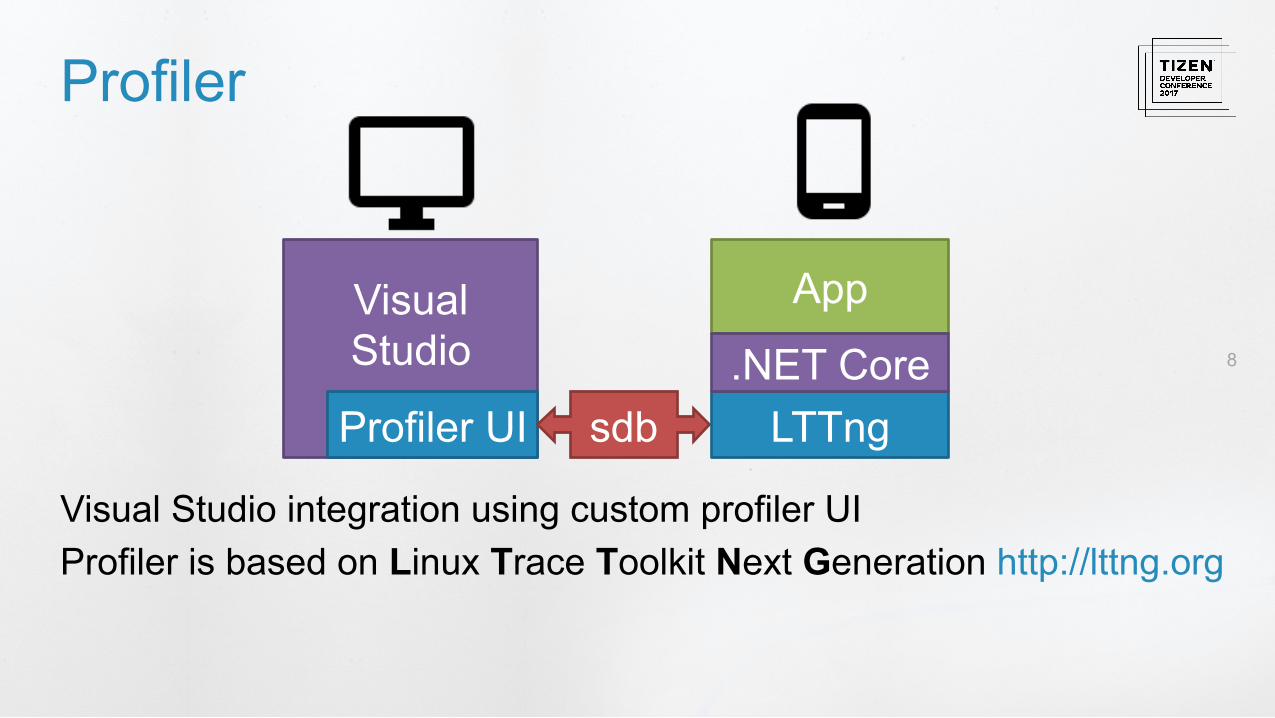
Profiler
Visual Studio integration using custom profiler UI Profiler is based on Linux Trace Toolkit Next Generation http://lttng.org
Visual Studio
Profiler UI sdb LTTng
App
.NET Core
9
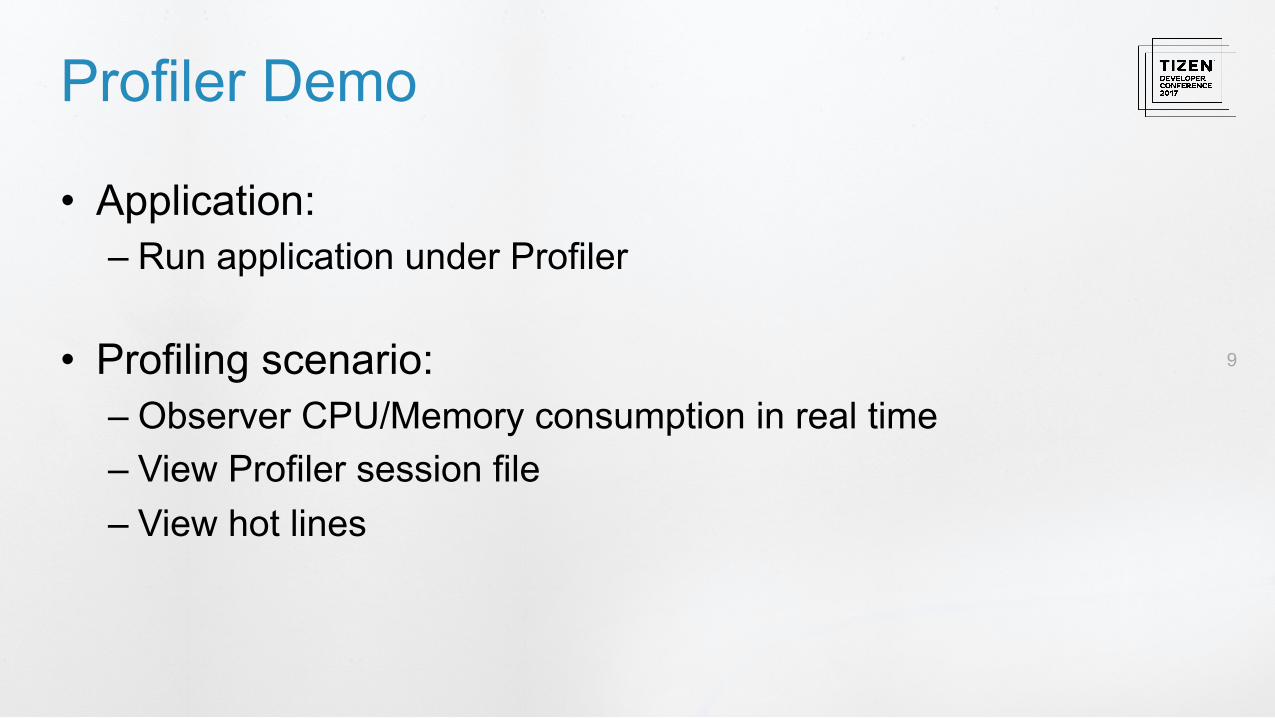
• Application: – Run application under Profiler
• Profiling scenario:
– Observer CPU/Memory consumption in real time – View Profiler session file – View hot lines
Profiler Demo
10
DEMO Profiler demo

11
12
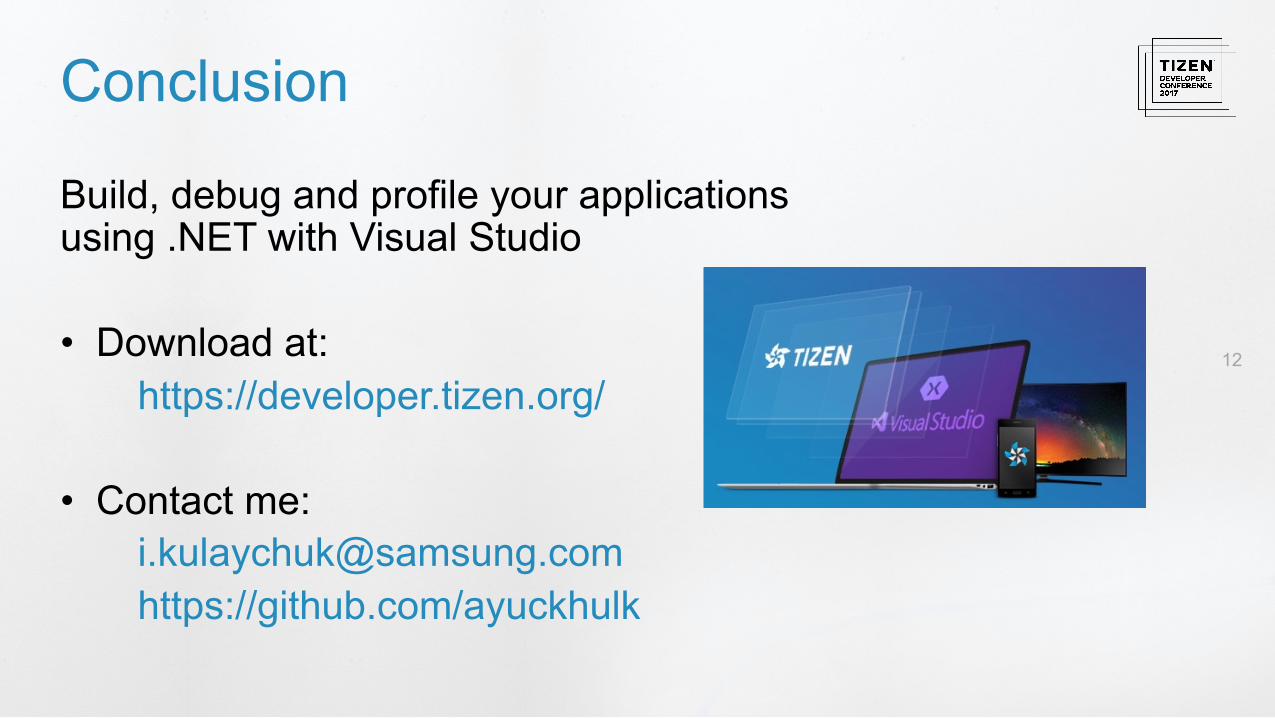
Build, debug and profile your applications using .NET with Visual Studio • Download at: https://developer.tizen.org/ • Contact me: [email protected] https://github.com/ayuckhulk
Conclusion

13
Thank you!
14
Implementation details

15
App
• GDB/MI – line based text interface to debugger • MIEngine – open source Visual Studio MI Debug engine
(by Microsoft) – works with gdb, lldb, clrdbg
• GDB JIT – provides the debugger info for code generated at runtime
Implementation details
Visual Studio MIEngine sdb lldb-mi .NET
Core GDB JIT
Modify
16
• Generate ELF in memory with DWARF debug info – Line numbers – Local variables with scopes – Method arguments – Types
.NET Core modifications - DWARF
17
• On method compilation – Generate ELF in memory – Trigger __jit_debug_register_code function – debugger consumes generated ELF from
__jit_debug_descriptor variable
.NET Core modifications - GDBJIT
18
• License • Relatively easy to add a new language • Supports different architectures • Has GDB/MI implementation • .NET Core has a plugin for inspecting runtime internals
LLDB – Why?
19
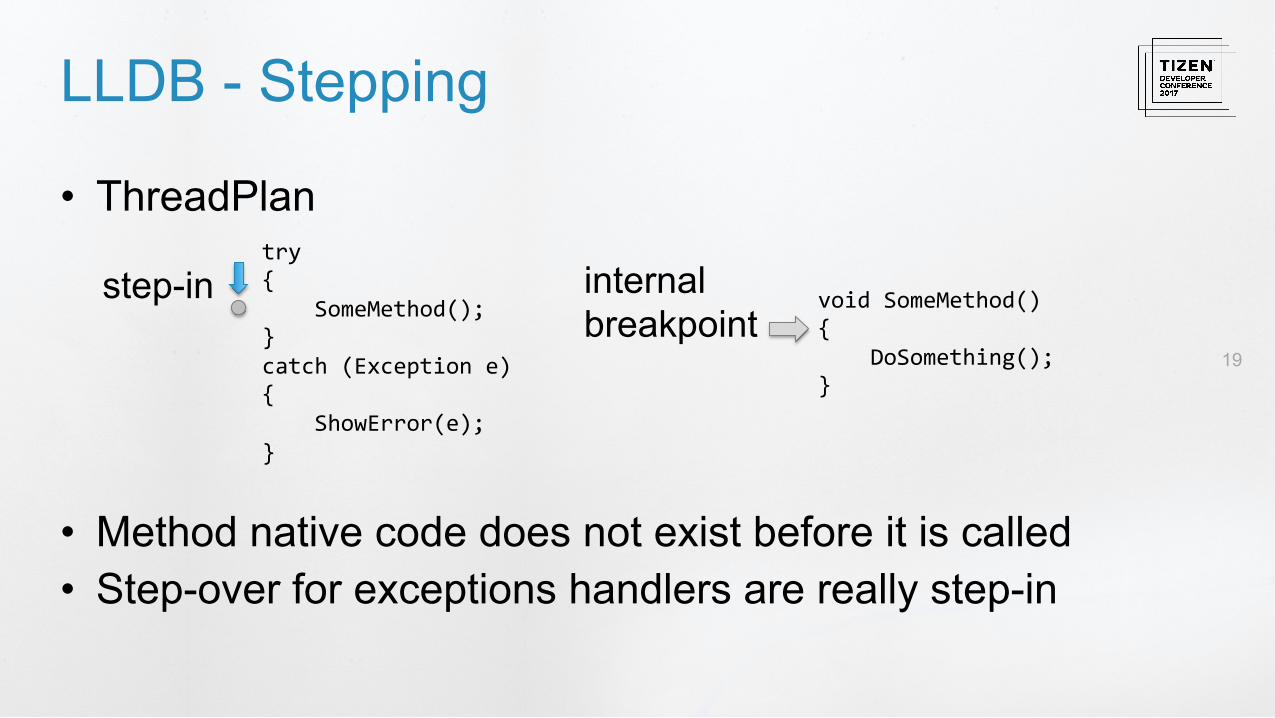
• ThreadPlan • Method native code does not exist before it is called • Step-over for exceptions handlers are really step-in
LLDB - Stepping
try { SomeMethod(); } catch (Exception e) { ShowError(e); }
void SomeMethod() { DoSomething(); }
step-in internal breakpoint
20
• Formatters – Decimals, strings etc. – Display {MyClass} instead of 0x0000FFFFF730966A etc.
• Synthetics – Hide internal class variables (like _count for arrays) – Show inherited fields like CLRDBG
LLDB – Data visualization

21
Thank you!