debugging cocoa with dtrace - reverse engineering mac os x
TRANSCRIPT

Debugging Cocoa with DTrace on Mac OS X
by Colin Wheeler
Version 1.0 Published Wednesday, January 21, 2009

Thanks to
Brian Cantrill, Mike Shapiro, Adam Leventhal and Sun Microsystems for creating DTrace for fostering itʼs development, documentation and support.
Apple for deciding that DTrace was worth it to include into Mac OS X and for Developing the great application Instruments which has yet to be matched by any comparable app on any OS, including Solaris where DTrace started. Also for developing this platform called Mac OS X and framework called Cocoa that I love to use.
Aaron Hillegass, Scott Stevenson, Steve Scott (Scotty), Marcus Zarra and everybody in the Mac Development community who has either directly contributed to my knowledge of Cocoa or who has graciously constructed a platform which Mac Developers can share their knowledge with one another.
People like Richard Dawkins, Sam Harris, Adam Savage, Neil deGrasse Tyson, James Randi, Paul Zachary "PZ" Myers, Carl Sagan, Stephen Jay Gould, Albert Einstein, Stephen Hawking, Donald Knuth, Alan Kay, Jack Horner, Robert T. Bakker and anybody else who encourages critical thinking, or blew my perception of reality, or fostered my intellectual development at some point in my life.
Last but not least to the people who graciously agreed to review this work & provide me with feedback
Danny Greg - Realmac SoftwareMartin Pilkington - M Cubed Software
Paul RobinsonDavid L. Kinney
Tools used to create this Document:Pages ʼ08 v3.0.2
Numbers ʼ08 v1.0.2LittleSnapper v1.0.1

Introduction 4
Chapter 1 Reintroducing DTrace 5
DTrace Implementation in Mac OS X 6
Chapter 2 DTrace & the Objective-C Provider 9
Example Timing in Code vs DTrace 12
Example Timing GC Quartz vs non GC Quartz Drawing 14
Chapter 3 DTrace in Instruments 18
The DTrace based Instruments 18
The Core Data Instruments 18
The Garbage Collection Instruments 23
Chapter 4 Creating Userland Static Probes for your Xcode Project 26
Creating the DTrace Provider file 27
Utilizing the Userland Static Probes in your App 31
Recording Data from the Userland Static Probes 34
Tracing Strategy Terminal or Instruments? 36
Chapter 5 General DTrace Tips 37
Tracing calls to Nil 37
Objective-C Visual Flow Indentation from Terminal 40
A note on objc_msgSend 41
Reference and Trace 42
A quick note about tracing dynamic loading & DTrace 43
Thanks 43

IntroductionAt first when I was introduced to DTrace at WWDC in 2006, I honestly didnʼt know what to make of it. Apple mainly showed it off as a Kernel Debugging facility which DTrace definitely excels at, but it took a couple of people and articles before I started to get the idea in my head that DTrace could be much more than for low level OS and kernel debugging. Once I started to get interested in DTrace I started looking for anything about how I could use it with my Cocoa apps. Once you really get used to DTrace there is really no excuse to not know what is happening in your system anymore. Take as an example one day I was at work browsing random sites and for some reason I had to load one in Firefox 3, well I did so and then went on my merry little way. A while later I came back and found my CPU was being eaten up by something, after looking at activity monitor I found the problem was Firefox. What was it doing? Well I knew DTrace so I was like “Iʼll use DTrace to figure out what it was doing!” After just a little work I immediately figured out that Firefox 3 was spawning and killing 20 pthreads a second! I could have investigated further, but at that point I just decided to kill Firefox and resume my normal Safari usage. What amazed me about this was that I didnʼt have to dig into the debugger, I didnʼt have to use sampler and I got short & concise information that was specific to the question I was asking.
Whatʼs presented here in this paper is the accumulation of a lot of my research into what DTrace excels at and itʼs weaknesses with regard to debugging Cocoa applications. My only warning is a couple of points (1) I assume you know basic DTrace. Learning basic DTrace is really beyond the scope of this paper as I have already done a basic 35 minute video on cocoasamurai.com1 which shows the basics of DTrace. And (2) I assume you have some familiarity with Operating System design, knowing so will help you understand some examples I show you and help you understand what DTrace is and how it works exactly.
For this paper I am using the following hardware & software
MacBook ProCore 2 Duo @ 2.33 GHzATi Radeon X1600 w 256 MB VRAM2 GB RAMMac OS X 10.5.6Darwin Kernel 9.6.0DTrace API Version: Sun D 1.2.2
If you donʼt know DTrace that well I would suggest looking at the following docs/pdfʼshttp://docs.sun.com/app/docs/doc/819-5488 http://docs.sun.com/app/docs/doc/817-6223
1 DTrace for Cocoa Developers http://cocoasamurai.blogspot.com/2008/05/dtrace-for-cocoa-developers.html

Chapter 1 Reintroducing DTraceWhenever I even speak of DTrace at a Cocoaheads meeting I feel compelled to give a few brief points each time. For this I only give this brief DTrace introduction only to reacquaint you with DTrace and build on this foundation for information presented on later on in this paper.
DTrace was developed at Sun Microsystems by Brian Cantrill, Mike Shapiro & Adam Leventhal. It is referred to on Wikipedia2 as “a comprehensive dynamic tracing framework created by Sun Microsystems for troubleshooting kernel and application problems on production systems in real time.” In essence this essentially means that you can examine virtually anything about any aspect of your operating system or application running on the operating system as it happens. The only exception to this really is when DTrace is throwing so much information at you that the Terminal or Instruments really has to work at keeping up with the output.
Apple first publicly announced that they were integrating DTrace into Mac OS X at the WWDC 2006 conference when they announced it would be integrated into Mac OS X 10.5 Leopard and people from Sunʼs and Apples DTrace teams met for the first time3. Since then DTrace has been featured on the UNIX Technology page for Mac OS X and has become a means of achieving custom Instruments in Instruments4.
DTrace has many strengths that make it a must have technology to be integrated into your operating systems kernel and has very few weaknesses. It can remove a lot of logging like “[yourClassName:] Reached x function” etc and can give you a lot of information about what code your application is triggering all the way up & down the operating system stack. DTrace Instruments can be used almost like Unit Testing for your whole app, it doesnʼt take much to write a good D Script that measures something in your app and then to remeasure it periodically. I can go on praising DTrace for a while, but I think this quote speaks volumes:
“I just wanted to let you know that I spent 24 hours trying to find a bug and after learning DTrace I found the bug in 5 minutes” - Unknown at WWDC 2008 Comments
Someone in the comments section of the DTrace session had just seen basic DTrace samples and figured out how to find a bug in 5 minutes that they had been chasing for 24 hours, you canʼt get much better than that for a good success story. Now with all of this behind us lets examine DTrace in relation to itʼs place in Mac OS X.
2 http://en.wikipedia.org/wiki/DTrace
3 http://blogs.sun.com/ahl/entry/dtrace_on_mac_os_x
4 Apple really should rename this, having a component in an Application & having the Application be virtually the same name is really confusing & trips me up in DTrace talks every so often.

DTrace Implementation in Mac OS X
DTrace requires a close integration with the operating system Kernel in order to achieve itʼs desired effect, which is how itʼs been integrated into Mac OS X. On Mac OS X you have 2 primary interfaces to DTrace: The Terminal and Instruments...
Regardless of how you interface with DTrace you need to be root or have root privileges (sudo) in order to invoke DTrace because it is running at the kernel level. Obviously there are more than 5 dtrace providers, but I only list a few here for brevityʼs sake. The major components here regardless of your interface is libdtrace.dylib and the DTrace interpreter in the kernel along with the DTrace providers.
Script.dCustom Instrument
/usr/sbin/dtrace
libdtrace.dylib
User Space
Kernel Space
DTrace Interpreter
DTrace Providers
vminfo fbt plockstat syscall pid

When you write a DTrace script and invoke DTrace your script is essentially compiled into a safe intermediate form by libdtrace.dylib and then sent to the kernel to be invoked later on. Then the probes that your script is querying are enabled and the provider does whatever is appropriate in activating them.
Specifically when you inspect dtrace/libdtrace/dt_cc.c in the dtrace source code you see
/* * DTrace D Language Compiler * * The code in this source file implements the main engine for the D language * compiler. The driver routine for the compiler is dt_compile(), below. The * compiler operates on either stdio FILEs or in-memory strings as its input * and can produce either dtrace_prog_t structures from a D program or a single * dtrace_difo_t structure from a D expression. Multiple entry points are * provided as wrappers around dt_compile() for the various input/output pairs. * The compiler itself is implemented across the following source files: * * dt_lex.l - lex scanner * dt_grammar.y - yacc grammar * dt_parser.c - parse tree creation and semantic checking * dt_decl.c - declaration stack processing * dt_xlator.c - D translator lookup and creation * dt_ident.c - identifier and symbol table routines * dt_pragma.c - #pragma processing and D pragmas * dt_printf.c - D printf() and printa() argument checking and processing * dt_cc.c - compiler driver and dtrace_prog_t construction * dt_cg.c - DIF code generator * dt_as.c - DIF assembler * dt_dof.c - dtrace_prog_t -> DOF conversion * * Several other source files provide collections of utility routines used by * these major files. The compiler itself is implemented in multiple passes: * * (1) The input program is scanned and parsed by dt_lex.l and dt_grammar.y * and parse tree nodes are constructed using the routines in dt_parser.c. * This node construction pass is described further in dt_parser.c. * * (2) The parse tree is "cooked" by assigning each clause a context (see the * routine dt_setcontext(), below) based on its probe description and then * recursively descending the tree performing semantic checking. The cook * routines are also implemented in dt_parser.c and described there. * * (3) For actions that are DIF expression statements, the DIF code generator * and assembler are invoked to create a finished DIFO for the statement.

So in other words the /usr/sbin/dtrace command line tool is merely a shell for invoking libdtrace.dylib which handles the language semantics and dtrace program compilation which you can definitively see in /dtrace/cmd/dtrace_1.c.
Or as the Solaris Dynamic Tracing Guide states:“The dtrace(1M) command is a generic front-end to the DTrace facility. The command implements a simple interface to invoke the D language compiler, the ability to retrieve buffered trace data from the DTrace kernel facility, and a set of basic routines to format and print traced data.”
* (4) The dtrace_prog_t data structures for the program clauses and actions * are built, containing pointers to any DIFOs created in step (3). * * (5) The caller invokes a routine in dt_dof.c to convert the finished program * into DOF format for use in anonymous tracing or enabling in the kernel. * * In the implementation, steps 2-4 are intertwined in that they are performed * in order for each clause as part of a loop that executes over the clauses. * * The D compiler currently implements nearly no optimization. The compiler * implements integer constant folding as part of pass (1), and a set of very * simple peephole optimizations as part of pass (3). As with any C compiler, * a large number of optimizations are possible on both the intermediate data * structures and the generated DIF code. These possibilities should be * investigated in the context of whether they will have any substantive effect * on the overall DTrace probe effect before they are undertaken. */
/* * Open libdtrace. If we are not actually going to be enabling any * instrumentation attempt to reopen libdtrace using DTRACE_O_NODEV. */while ((g_dtp = dtrace_open(DTRACE_VERSION, g_oflags, &err)) == NULL) { if (!(g_oflags & DTRACE_O_NODEV) && !g_exec && !g_grabanon) { g_oflags |= DTRACE_O_NODEV; continue; }
fatal("failed to initialize dtrace: %s\n", dtrace_errmsg(NULL, err));}

Chapter 2 DTrace & the Objective-C ProviderApple has kindly implemented a Objective-C Provider for use with Cocoa Apps and it works very simply like so. Lets Assume we have an instance method -(void)doSomething:(id)sender; in a Class called AppController so in other words:
[appController doSomething:self];
creating an instance of that class AppController with an instance appController would look like this in DTrace
objc<pid> : AppController : -doSomething? : entry
as you can see above for the Objective-C Provider we require the process id of the app to be appended to objc so DTrace knows specifically which Objective-C App you are referencing. Also you may notice that we reference the doSomething:self instance method in DTrace as -doSomething:?. We already use colons in separating the DTrace sections (provider,module,method,name) so we canʼt use the colon again to indicate a objective-c method argument. As you can also see we donʼt care so much in DTrace what object you are calling a method on as we do what type of method it is and what arguments it takes. I should caution you to pay attention to the arguments, take as an example
objc<pid> : NSView : -drawRect : entry
is not the same as
objc<pid> : NSView : -drawRect? : entry
which in the first case you will not find that DTrace will match any probes becase it will look for an instance method -drawRect that accepts no arguments, which we know that drawRect does accept an argument. So the second example indicates a drawRect instance method that does accept an argument.
For Cocoa Developers coming to DTrace that is the biggest thing to remember. Beyond this to indicate interest in specific Objective-C points is fairly easy by going to the dtrace man page5 or “man DTrace” in the terminal. Iʼve listed off the Objective-C Provider text below
5 http://developer.apple.com/documentation/Darwin/Reference/ManPages/man1/dtrace.1.html

OBJECTIVE C PROVIDER EXAMPLESobjc123:NSString:-*:entryEvery instance method of class NSString in process 123.
objc123:NSString(*)::entryEvery method on every category of class NSString in process 123.
objc123:NSString(foo):+*:entryEvery class method in NSString's foo category in process 123.
objc123::-*:entryEvery instance method in every class and category in process 123.
objc123:NSString(foo):-dealloc:entryThe dealloc method in the foo category of class NSString in process 123.
objc123::method?with?many?colons:entryThe method method:with:many:colons in every class in process 123. (A ? wildcard must be used to match colon characters inside of Objective C method names, as they would otherwise be parsed as the provider field separators.)
Now that was very easy, you can now very easily specify interest in any Objective-C area you want to know more about. Go ahead and do a “dtrace -l” as sudo or root and explore all the Objective-C Probe points available

However I would recommend exploring the Objective-C probe points for your apps first because your familiar with your own code. Filter down by the PID. Here Iʼve taken a listing of some of Mail.apps probe points as a quick example
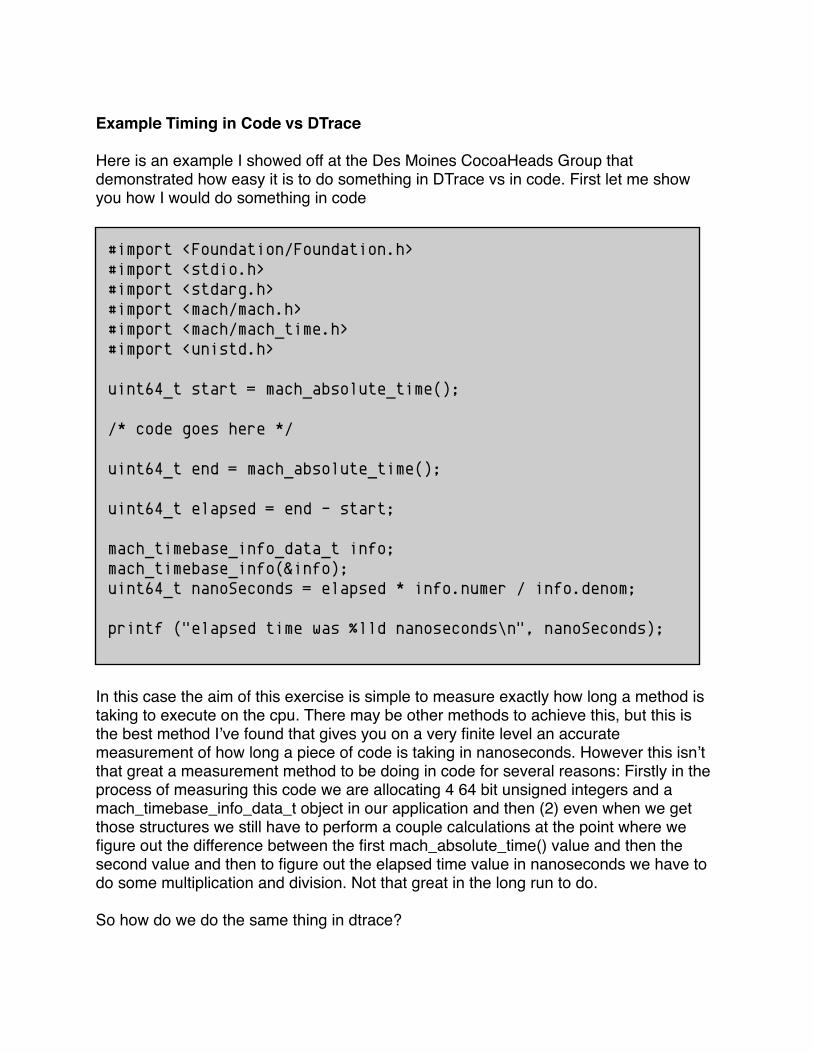
Example Timing in Code vs DTrace
Here is an example I showed off at the Des Moines CocoaHeads Group that demonstrated how easy it is to do something in DTrace vs in code. First let me show you how I would do something in code
#import <Foundation/Foundation.h>#import <stdio.h>#import <stdarg.h>#import <mach/mach.h>#import <mach/mach_time.h>#import <unistd.h>
uint64_t start = mach_absolute_time();
/* code goes here */
uint64_t end = mach_absolute_time(); uint64_t elapsed = end - start; mach_timebase_info_data_t info;mach_timebase_info(&info);uint64_t nanoSeconds = elapsed * info.numer / info.denom;
printf ("elapsed time was %lld nanoseconds\n", nanoSeconds);
In this case the aim of this exercise is simple to measure exactly how long a method is taking to execute on the cpu. There may be other methods to achieve this, but this is the best method Iʼve found that gives you on a very finite level an accurate measurement of how long a piece of code is taking in nanoseconds. However this isnʼt that great a measurement method to be doing in code for several reasons: Firstly in the process of measuring this code we are allocating 4 64 bit unsigned integers and a mach_timebase_info_data_t object in our application and then (2) even when we get those structures we still have to perform a couple calculations at the point where we figure out the difference between the first mach_absolute_time() value and then the second value and then to figure out the elapsed time value in nanoseconds we have to do some multiplication and division. Not that great in the long run to do.
So how do we do the same thing in dtrace?

objc$target:NSOperation:-start:entry{ self->start = vtimestamp;}
objc$target:NSOperation:-start:return{ printf(“%u nanosecs”,vtimestamp - self->start); self->start = 0;}
Not only is this less lines of code, it also happens outside of the application itself so the apps memory isnʼt being increased and we are only performing 1 explicit calculation and only creating 1 thread local variable. In this case I chose vtimestamp to measure this because if we are going for the most accurate measurement for how long a block of code is taking to execute we shouldnʼt be factoring in the DTrace overhead. Specifically the Solaris Dynamic Tracing Guide6 says about the vtimestamp dtrace variable
“The current value of a nanosecond timestamp counter that is virtualized to the amount of time that the current thread has been running on a CPU, minus the time spent in DTrace predicates and actions. This counter increments from an arbitrary point in the past and should only be used for relative time computations.”
which is fine and exactly what we are using it for in this example. If we run this example weʼll get something like this:
6 http://docs.sun.com/app/docs/doc/817-6223/chp-variables-5?a=view

So here in this particular instance this NSOperation executed on my 2nd core and took about 0.008 seconds to execute. Iʼve done other examples like this where I merely prove that things like CFArray is faster at iterating over a similar array than NSArray.
Example Timing GC Quartz vs non GC Quartz Drawing
So this is great we now know how to get simple information like this, but I wanted to do something more meaningful with a timing example like this. So one topic that came up at a Cocoaheads meeting is wether this topic that came up right when Leopard came out was really true or not, and that topic was the claim that Garbage Collected Quartz drawing was about 25% slower at drawing than non Garbage Collected Quartz Drawing. So here we are at 10.5.6 and itʼs a little late to really test 10.5 as I have no interest in reformatting my drive to test that build specifically, but I wanted to test 10.5.6 to see if GC Quartz really is still 25% slower if it really was at all.
Now for this I could have written a grand suite of actions to test it and see what all I could do to perform some sort of intense drawing, but in the end my time is precious and I just didnʼt have the time to do something like that outside of my normal range of projects I am already working on so I decided to test 2 Apple provided developer examples PathDemo and Worm.
In PathDemo I simply tested the Bezier Paths because I believed it was the most random & hardest drawing I could get out of Quartz in that example because itʼs calculating arcs and doing non standard shapes

So in this example The drawing is all being done in a NSView subclass called DemoView so in DTrace weʼd need to write the script like so
objc$target:DemoView:-drawRect?:entry{ self->start = vtimestamp;}
objc$target:DemoView:-drawRect?:return{ printf("-drawRect took %u nanoseconds to complete", (vtimestamp - self->start)); self->start = 0;}
So I ran this several times on non garbage collected and then flipped the garbage collection switch and cleaned and recompiled and ran it again and then compared the times and got
sh-3.2# dtrace -s drawtime.d -p 44697dtrace: script 'drawtime.d' matched 2 probesCPU ID FUNCTION:NAME 0 24606 -drawRect::return -drawRect took 12380896 nanoseconds to complete 0 24606 -drawRect::return -drawRect took 12467565 nanoseconds to complete 1 24606 -drawRect::return -drawRect took 13540899 nanoseconds to complete 0 24606 -drawRect::return -drawRect took 17036579 nanoseconds to complete 0 24606 -drawRect::return -drawRect took 12271642 nanoseconds to complete 0 24606 -drawRect::return -drawRect took 12382659 nanoseconds to complete 1 24606 -drawRect::return -drawRect took 12682816 nanoseconds to completedtrace: pid 44697 has exited
sh-3.2# dtrace -s drawtime.d -p 44807dtrace: script 'drawtime.d' matched 2 probesCPU ID FUNCTION:NAME 1 20688 -drawRect::return -drawRect took 18147876 nanoseconds to complete 1 20688 -drawRect::return -drawRect took 13893054 nanoseconds to complete 0 20688 -drawRect::return -drawRect took 13108404 nanoseconds to complete 0 20688 -drawRect::return -drawRect took 14469090 nanoseconds to complete 0 20688 -drawRect::return -drawRect took 13468790 nanoseconds to complete 0 20688 -drawRect::return -drawRect took 13429747 nanoseconds to complete 1 20688 -drawRect::return -drawRect took 11028140 nanoseconds to completedtrace: pid 44807 has exited
In this instance I got a non Garbage collected average of 13251865 ns (top batch of results) or 0.0132518 seconds and Garbage Collection took 13935014 ns or 0.0139350 seconds (2nd batch of results) so I got about a roughly 5% difference between the two and really when you run these tests over and over you can see there is a definite range

and both tests GC and non GC all have an outlier every so often and you could argue that the outlier is responsible for most of the 5% difference in the test. As always depending on what system you are running this on and what you have running your mileage may vary.
So this is great but in the PathDemo example we arenʼt doing that much. I hit the button and it does some random drawing once and then stops so I thought I should be fair and do an example that does more explicit allocations of memory and does constant drawing and found worm in the Developer Examples.
This does more constant drawing and explicit allocations of memory as itʼs drawing the view so I wanted to see if the drawRect method times would hold true. This app runs constantly when you tell it to go so I think itʼd only be fair to run the app GC on one run and non GC on another run with both runs running in the same mode and collecting the first n amount of samples on both runs.

When I go about that for this example I get the following:
So using dtrace we can see both Garbage Collected Code and non Garbage Collected code appear to roughly run about the same most of the time. In all tests I run I occasionally get an outlier value in both the garbage collected code and non garbage collected code. In one run I got some spikes in the garbage collected code making me wonder if the garbage collector was running at the time of those spikes. Clearly this merits a deeper investigation, however at the time of this writing I simply donʼt have the time to give this the attention it needs so for now this question will have to remain unanswered. So far Iʼve just tried having dtrace also trace when auto_trace_phase_begin begins and havenʼt found a correlation between the function beginning and increase in method execution times. As always your mileage may vary.
0
500000
1000000
1500000
2000000
GC vs Non GC Quartz Draw Times (-drawRect) in nanoseconds
GC Non GC

Chapter 3 DTrace in Instruments
Instruments is one of the big reasons Iʼve fallen in love with the Mac platform, before Apple introduced Instruments (formerly Xray) there was no easy way to make your own tools to measure app specific metrics. You pretty much had to know your code well and attempt to measure speculatively with the tools available to you at the time. Since then Apple has solved that problem and one other one with instruments (the other problem being that there was no easy way of getting several tools data side by side for getting a comprehensive overview of the session run.) Instruments makes the custom instrument process look deceptively simple and mostly it is, but you still need to know DTrace and how it works to make the most out of the experience and obtain the most accurate data on the behavior of your apps.
The DTrace based Instruments16 of the 28 Prebuilt Instruments are DTrace based which I will list here and go into
detail the ones most relevant to Cocoa Developers:
The Core Data Instruments All the Core Data Instruments are DTrace based. Apple has graciously created a custom provider for the Core Data framework that latches on to key

points in all Cocoa Apps that link against the Core Data framework, which is both good and bad. By default in Xcode if you create a plain vanilla Cocoa app project (not Core Data app) it will include the Core Data framework and link against Core Data. Thus when you do dtrace -l in the terminal and look around at the PID IDʼs itʼs possible to get false positives. In fact it appears that the CoreData provider latches onto any Cocoa app period. However as the project has no Core Data data model nor should be calling any Core Data classes itʼs safe to assume that none of the Core Data probes should ever fire on such a project.
If you do DTrace -l in terminal and extract just the Core Data probes for 1 project you should get
This is obviously cleaned up for the purposes of showing you the information you care about. Looking through the probes itʼ obvious we get several layers of Core Data that we are able to peer into.
Core Data Saves : Core Data Saves displays information about your saves during a run of your application or all Core Data apps running on your system at a given time. It
BEGIN PROBES
-[NSAtomicStore(_NSInternalMethods) retainedDataForObjectID:withContext:] BeginFault-[NSSQLCore retainedDataForObjectID:withContext:] BeginFault-[NSMappedObjectStore retainedDataForObjectID:withContext:] BeginFault _PFReportFaultStart BeginFault-[NSSQLCore fetchRowForObjectID:] BeginFaultCacheMiss _PFReportCacheMissStart BeginFaultCacheMiss-[NSPersistentStoreCoordinator(_NSInternalMethods) executeRequest:withContext:] BeginFetch-[NSSQLCore newFetchedPKsForSourceID:andRelationship:] BeginRelationshipCacheMiss_PFReportRelationshipCacheMissStart BeginRelationshipCacheMiss-[NSAtomicStore(_NSInternalMethods) retainedRelationshipDataWithSourceID:forRelationship: withContext:] BeginRelationshipFault-[NSSQLCore retainedRelationshipDataWithSourceID:forRelationship:withContext:] BeginRelationshipFault-[NSMappedObjectStore retainedRelationshipDataWithSourceID:forRelationship:withContext:] BeginRelationshipFault _PFReportRelationshipFaultStart BeginRelationshipFault-[NSPersistentStoreCoordinator(_NSInternalMethods) executeRequest:withContext:] BeginSave
END PROBES
-[NSAtomicStore(_NSInternalMethods) retainedDataForObjectID:withContext:] EndFault -[NSSQLCore retainedDataForObjectID:withContext:] EndFault -[NSMappedObjectStore retainedDataForObjectID:withContext:] EndFault -[NSSQLCore fetchRowForObjectID:] EndFaultCacheMiss -[NSPersistentStoreCoordinator(_NSInternalMethods) executeRequest:withContext:] EndFetch -[NSSQLCore newFetchedPKsForSourceID:andRelationship:] EndRelationshipCacheMiss -[NSAtomicStore(_NSInternalMethods) retainedRelationshipDataWithSourceID:forRelationship: withContext:] EndRelationshipFault -[NSSQLCore retainedRelationshipDataWithSourceID:forRelationship:withContext:] EndRelationshipFault -[NSMappedObjectStore retainedRelationshipDataWithSourceID:forRelationship:withContext:] EndRelationshipFault -[NSPersistentStoreCoordinator(_NSInternalMethods) executeRequest:withContext:] EndSave
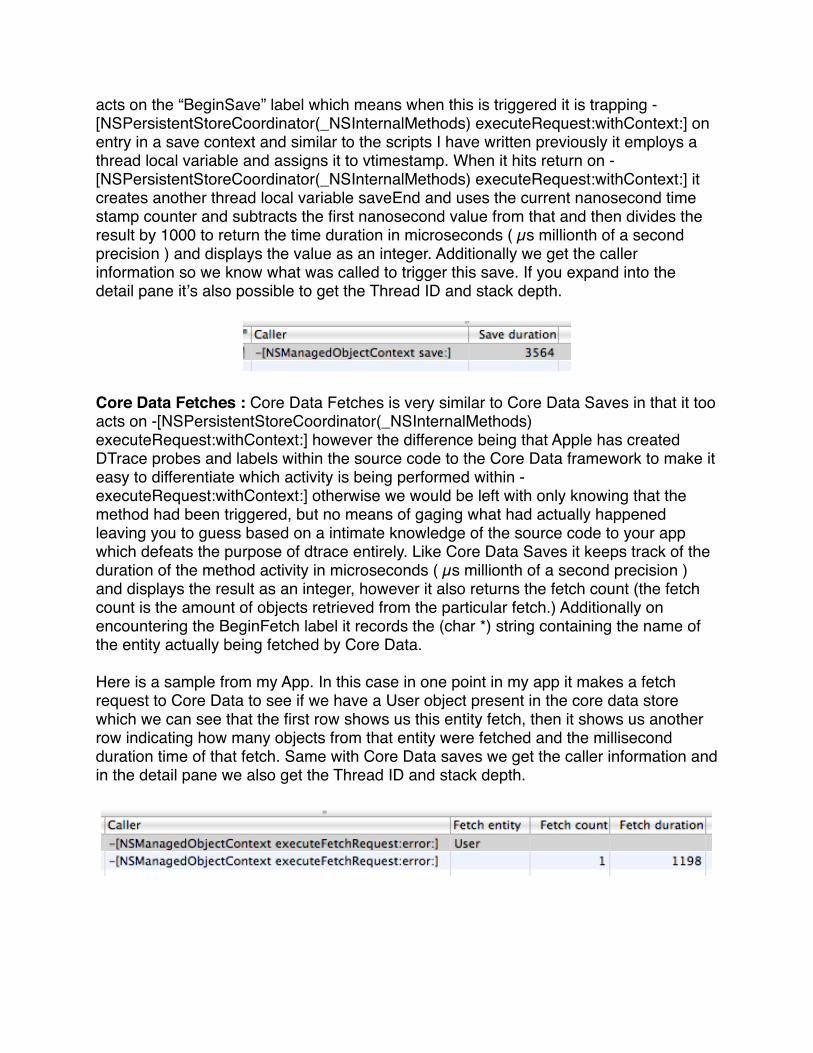
acts on the “BeginSave” label which means when this is triggered it is trapping -[NSPersistentStoreCoordinator(_NSInternalMethods) executeRequest:withContext:] on entry in a save context and similar to the scripts I have written previously it employs a thread local variable and assigns it to vtimestamp. When it hits return on -[NSPersistentStoreCoordinator(_NSInternalMethods) executeRequest:withContext:] it creates another thread local variable saveEnd and uses the current nanosecond time stamp counter and subtracts the first nanosecond value from that and then divides the result by 1000 to return the time duration in microseconds ( µs millionth of a second precision ) and displays the value as an integer. Additionally we get the caller information so we know what was called to trigger this save. If you expand into the detail pane itʼs also possible to get the Thread ID and stack depth.
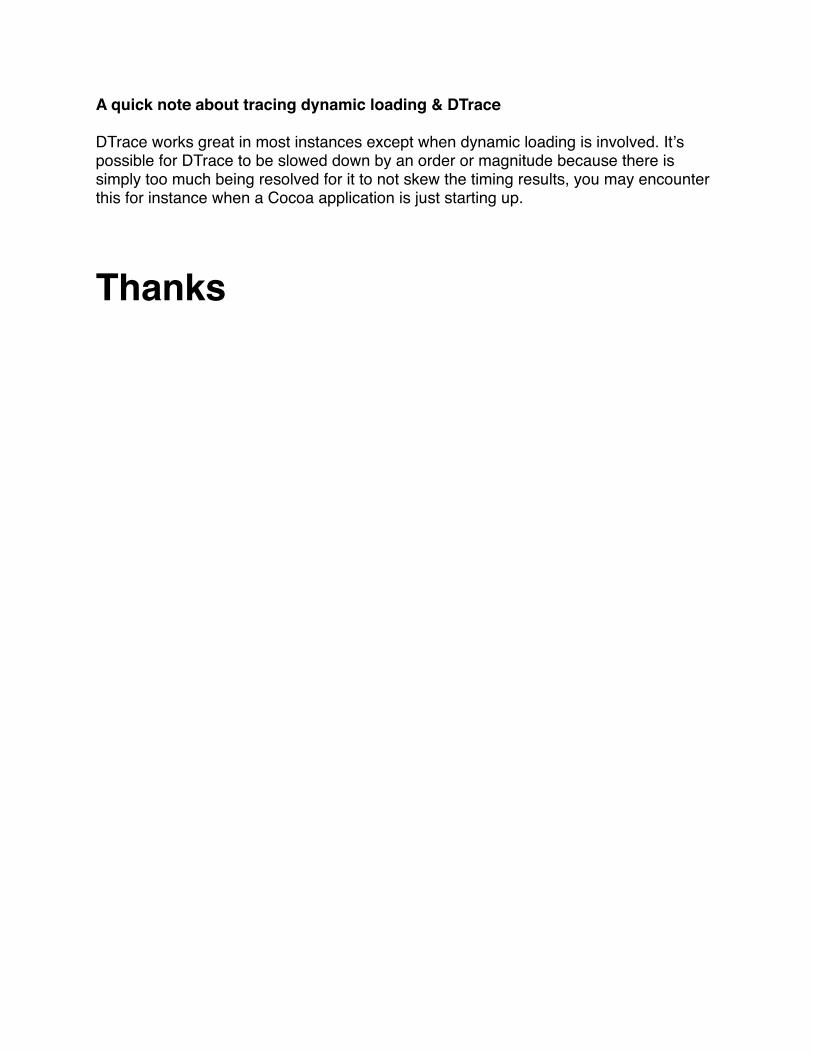
Core Data Fetches : Core Data Fetches is very similar to Core Data Saves in that it too acts on -[NSPersistentStoreCoordinator(_NSInternalMethods) executeRequest:withContext:] however the difference being that Apple has created DTrace probes and labels within the source code to the Core Data framework to make it easy to differentiate which activity is being performed within -executeRequest:withContext:] otherwise we would be left with only knowing that the method had been triggered, but no means of gaging what had actually happened leaving you to guess based on a intimate knowledge of the source code to your app which defeats the purpose of dtrace entirely. Like Core Data Saves it keeps track of the duration of the method activity in microseconds ( µs millionth of a second precision ) and displays the result as an integer, however it also returns the fetch count (the fetch count is the amount of objects retrieved from the particular fetch.) Additionally on encountering the BeginFetch label it records the (char *) string containing the name of the entity actually being fetched by Core Data.
Here is a sample from my App. In this case in one point in my app it makes a fetch request to Core Data to see if we have a User object present in the core data store which we can see that the first row shows us this entity fetch, then it shows us another row indicating how many objects from that entity were fetched and the millisecond duration time of that fetch. Same with Core Data saves we get the caller information and in the detail pane we also get the Thread ID and stack depth.

Core Data Faults : Core Data Faults gives you a good amount of information relevant to faulting in your Core Data Application and uses 4 probes to show you what is faulting and what triggered the fault. If you donʼt know what Core Data faulting is I really canʼt take the time or space to dedicate to this topic here, I would suggest reading Apples Documentation for more information on the matter7 . The instrument first acts on the “BeginFault” label in the CoreData provider. When it hits this it creates a thread local variable faultStart and assigns it to the vtimestamp nanosecond counter, additionally it traces arg0 containing a (char *) string telling you the Core Data ID (in the form of something like x-coredata://2889E1B3-0F22-41E4-B211-6BEFA68F258E/User/p102 ) of the object causing the fault (Fault object.)
When it hits the “EndFault” label it creates another thread local variable “faultEnd” and subtracts the current vtimestamp counter from the faultStart variable and divides by 1000 giving us the duration in microseconds ( µs millionth of a second precision ) and displays the result as an integer. Then we proceed to the “BeginRelationshipFault” probe, here we get more information about what is actually causing the fault like the previous core data probes it also keeps track of the vtimestamp and displaying for each relationship fault the duration in microseconds ( µs millionth of a second precision .) Whatʼs unique to this probe is that it keeps track of the “Relationship fault source” ((char *) arg0) which would the the object causing the fault and the “Relationship” ((char *) arg1) in the Core Data data model that we are faulting on. Upon entry to “EndRelationshipFault” the probe acquires the vtimestamp and calculates the duration of the relationship fault displaying the result in microseconds.
This instrument acts on the following Core Data methods Label: BeginFault / EndFault-[NSAtomicStore(_NSInternalMethods) retainedDataForObjectID:withContext:]
-[NSSQLCore retainedDataForObjectID:withContext:]
-[NSMappedObjectStore retainedDataForObjectID:withContext:]
Label: BeginFault_PFReportFaultStart
Label: BeginRelationshipFault / EndRelationshipFault-[NSAtomicStore(_NSInternalMethods) retainedRelationshipDataWithSourceID:forRelationship: withContext:]-[NSSQLCore retainedRelationshipDataWithSourceID:forRelationship:withContext:]-[NSMappedObjectStore retainedRelationshipDataWithSourceID: forRelationship: withContext:]
Label: BeginRelationshipFault _PFReportRelationshipFaultStart
7 http://developer.apple.com/DOCUMENTATION/Cocoa/Conceptual/CoreData/Articles/cdFaultingUniquing.html

Here is an example of what a run with the Core Data Faults Instrument looks like.
Again like the other probes we also get the stack depth and Thread ID in the extended detail view pane.
Core Data Cache Misses:
Core Data Cache Misses displays information very similar to Core Data faults but it directed at another area of Core Data operations/performance. Core Data Cache Misses are pretty much what it sounds like, but again I donʼt have the time to spend on it here and itʼs really out of scope for this paper, see Apples Core Data Guide8 for more information on the topic. Again this probe not only measures the whole cache miss but also gives us more finite information on the duration of specific cache misses for each relationship and again requires the use of 4 probes to gain this information.
The first probe triggers on encountering the label “BeginFaultCacheMiss” and declares a thread local var “cacheMissStart” for getting the overall duration of the cache miss. It also records ((char *) arg0) The Core Data ID of the object causing the cache miss. The second probe triggers on “EndFaultCacheMiss” and predicably declares a thread local var “cacheMissEnd” and diffs the 2 vtimestamps and divides by 1000 to get the microseconds ( µs millionth of a second precision ) for the duration of the cache miss (CM duration.)
8 http://developer.apple.com/DOCUMENTATION/Cocoa/Conceptual/CoreData/cdProgrammingGuide.html#//apple_ref/doc/uid/TP30001200

Now we move onto the Relationship Cache Misses, the third probe triggers on “BeginRelationshipCacheMiss” and predicably declares a thread local var “relationshipCacheMissStart” and assigns it to vtimestamp. During this time the instrument also records ((char *) arg0) “RCM source” which is the Core Data ID of the object causing the relationship cache miss, and ((char *) arg1) “RCM relationship” which shows the relationship that is triggering the relationship cache miss. The fourth probe doesnʼt do much after this other than declaring the thread local var “relationshipCacheMissEnd” and subtracting the current vtimestamp value from it and then dividing the resulting value to get the duration (RCM duration) in Microseconds.
The Garbage Collection Instruments
The Mac OS X Garbage Collector known as AutoZone ( libauto.dylib ) is another neat new feature in Mac OS X 10.5 Leopard. As we now have garbage collection in Cocoa/Objective-C itʼs often helpful to know how much memory has been reclaimed and when itʼs been collected. As such Apple has 2 DTrace based Instruments. As AutoZone is not Cocoa/Objective-C based it
does not use the Objective-C provider or any custom Objecitve-C provider, but rather uses the pid providers which specializes in tracing the entries and returns into any function in a user process.
GC Total : The GC Total is a simple 1 probe instrument, it traces the entry of the function “auto_trace_collection_end” and records the following information (int)arg2 Objects Reclaimed, (int)arg4 Bytes in Use, (int)arg5 Total (bytes reclaimed and still in use), (int)arg3 Bytes Reclaimed. Additionally it records the function that started the reclamation of objects and in the extended detail pane we also get the stack depth and stack trace information as well as the thread id.
Garbage Collection : The originally named Garbage Collection Instrument is designed to show you the relevant information about what is being collected during AutoZones scavenge phase. The instrument uses the pid provider to trace entry into the function “auto_trace_phase_begin” function.

This probe has a predicate checking for arg2 to equal 3 which is a reference to a auto_collection_phase_t type which if you look through the source code is a enum which in this context means itʼs essentially trying to check for the garbage collection to be in the AUTO_TRACE_SCAVENGING_PHASE mode. It also checks for arg1 to be 0 which if we look at the source code declaration
void auto_trace_phase_begin(auto_zone_t *zone, boolean_t generational, auto_collection_phase_t phase)
means itʼs checking for the generational to be 0 . Upon passing the predicates and entering to the probe it declares a thread local var “starttime” and divides by 1000 to get the microsecond timestamp and does nothing else. The next probe traces the function “auto_trace_phase_end” and has the exact same predicates as the first probe. It records (int)arg3 (Objects Reclaimed), arg0 (Zone), (int)arg4 ( Bytes Reclaimed ), the duration in microseconds and arg1 ( Is Generational .) Additionally we can see the caller , stack depth and call stack.
Cocoa Events : This DTrace instrument monitors calls to NSApplication -sendEvent*. What this instrument does is uses the Objective-C provider and copies in the necessary information to present to you what is
happening in your application both the NSEventType9 and a string that is much more relevant to you the Cocoa Developer. It does this by copying in
the bytes from arg2 which in the Objective-C context is the first argument to a selector because in this context we are really matching the arguments to objc_msgSend()10. From there these bits are assigned to evtPointer and then we further copy in 4 bytes to get the event code. From there the rest of the probe is pretty much just figuring out what that event is and getting you a string that is much more relevant. Here is the code:
9 http://developer.apple.com/documentation/Cocoa/Reference/ApplicationKit/Classes/NSEvent_Class/Reference/Reference.html#//apple_ref/doc/uid/20000016-SW1
10 http://developer.apple.com/DOCUMENTATION/Cocoa/Conceptual/ObjCRuntimeGuide/Articles/chapter_4_section_3.html
typedef enum { AUTO_TRACE_SCANNING_PHASE = 0, AUTO_TRACE_WEAK_REFERENCE_PHASE, AUTO_TRACE_FINALIZING_PHASE, AUTO_TRACE_SCAVENGING_PHASE} auto_collection_phase_t;

Beyond the awkward (but necessary) way we copy this information in the rest of the probe is very easy and straightforward. It displays a Clause Local variable ( this->eventStr ) in the form of a String which will display something like “Left Mouse Down”, etc. and the Event code (self->theEvent) in the form of an Integer.
The Rest of the Instruments
The rest of the instruments are great tools to use in your debugging and tuning of your application and itʼs various interactions, however right now I simply donʼt have the time needed to really dig into these and explain them in the detail I have given to the other great instruments. To go over these and sort of gloss over them in lesser detail would be disrespectful on my part so I have chosen to not do them now and keep to the most common Cocoa Developer centric tools. Perhaps I can expand on these over time in the future, but for now I feel itʼs my job to get this information to you and allow you to explore these instruments as they apply to you the reader.
self->evtPointer = (user_addr_t)arg2;self->theEvent = (unsigned int)*(uint32_t*)copyin(self->evtPointer + 4, 4);
this->eventStr = self->theEvent == 1 ? "Left Mouse Down" : self->theEvent == 2 ? "Left Mouse Up" : self->theEvent == 3 ? "Right Mouse Down" : self->theEvent == 4 ? "Right Mouse Up" : self->theEvent == 5 ? "Mouse Moved" : self->theEvent == 6 ? "Left Mouse Dragged" : self->theEvent == 7 ? "Right Mouse Dragged" : self->theEvent == 8 ? "Mouse Entered" : self->theEvent == 9 ? "Mouse Exited" : self->theEvent == 10 ? "Key Down" : self->theEvent == 11 ? "Key Up" : self->theEvent == 12 ? "Flags Changed" : self->theEvent == 13 ? "AppKit Defined" : self->theEvent == 14 ? "System Defined" : self->theEvent == 15 ? "Application Defined" : self->theEvent == 16 ? "Periodic" : self->theEvent == 17 ? "Cursor Update" : self->theEvent == 22 ? "Scroll Wheel" : self->theEvent == 23 ? "Tablet Point" : self->theEvent == 24 ? "Tablet Proximit" : self->theEvent == 25 ? "Other Mouse Down" : self->theEvent == 26 ? "Other Mouse Up" : self->theEvent == 27 ? "Other Mouse Dragged" : "Unknown";

Chapter 4 Creating Userland Static Probes for your Xcode ProjectDTrace can add a lot of value to our debugging cycles and give us valuable insight into the behavior of our applications, however there are 2 major weaknesses that DTrace has with regards to Objective-C and our Application logic. The first being that while dtrace can trace through Objective-C method calls it isnʼt aware of events in our application, by this I mean the specific logic that happens when the user clicks on that do action button. DTrace can see it triggered the method -doSomething: then -calculateTotals: and so on and so on. In other words if we want to trace a specific critical event in our application the burden is on the Cocoa Developer to know all the methods and use that knowledge in tracing the app. The other major weakness is that DTrace cannot do true Objective-C object introspection. When we are tracing around Objective-C functions in the pid or Objective-C provider we are really seeing the functions in the form of a string like “-[NSString isEqual:]” in the function section so really
pid<pid> Foundation -[NSString isEqual:] entry
is like an alias to
objc<pid> NSString -isEqual? entry
which is why we know what Objective-C class and method we are in. However this does not translate to Objective-C objects. DTrace doesnʼt even know the structure of a basic Objective-C object, I am not talking about NSObject, I mean literally bare bones Objecitve-C without Foundation. DTrace does do pointer dereferencing so theoretically we could construct something to inspect some aspects of Objective-C however this increased complexity quickly starts to negate the benefits DTrace gave to us and really makes debugging with GDB more of an option in that case.
However the DTrace inventors foresaw this type of situation. They quickly realized that with DTrace no matter what information they predefined and made available to you that you will always want more and so they created USDT Probes or Userland Statically Defined Tracing Probes, Apple & I refer to these as Userland Static Probes. These probes give you an opportunity to embed critical debug information inside your application that has 0 cost when not in use and when it is in use has only the most minimal of performance impact (mainly to the extent that is costs you to access and pass to dtrace the information that you want shown in a probe.)
The DTrace man page11 does list this process, but I really want to show you how easy this is with Xcode and what you need to know about the process along with what could initially trip you up in learning how to use the userland static probes.
11 http://developer.apple.com/documentation/Darwin/Reference/ManPages/man1/dtrace.1.html

Creating the DTrace Provider file
The very first thing we start out with when creating Userland Static probes is a DTrace Provider file which has very simple syntax.
In this example I am going to provide DTrace information about an event and I want to track the progress of this event. To start out with I have a probe called action_start() which accepts no arguments, this is merely a indicator to me in DTrace that tracking for a particular chain of events around an application has begun. Also the action_* naming of methods allows for me to have many actions in a particular provider if I want to do so and to be able to filter down by that if I want to do so. Then when I am done with this editing I save this to a file called MyAppProvider.d in my project directory.
Once you are back in Xcode I would go to Project->Add to Project… and add the MyAppProvider.d file into the Xcode project.
provider MyApp { probe action_start(); probe action_phase(int,char *); probe action_end();};
MyAppProvider.d

And you should now have the MyAppProvider.d file in your Xcode Project
Now we need to generate the header file. Now you can go about this several ways in this case DTrace has a predictable method generation pattern in this case the probe “action_start()” will get translated into “MYAPP_ACTION_START()” and will also generate “MYAPP_ACTION_START_ENABLED()” which I will get into later. Really if you are comfortable typing in those names by hand you donʼt need to do anything other than import the header file (that will eventually exist) into your project, this header file in this case will be “MyAppProvider.h” which is the exact same name as the .d file except with a .h. When you compile your project Xcode will notice that there is no header file by that name, but will notice that there is a .d file by that name and will automatically compile the .d file into a .h file and allow your project to build successfully. However I am a autocomplete junkie (is that even a phrase?) sometimes and so if you want autocomplete in your project right now all you need to do is right click on the .d file and select Compile from the contextual menu…

Assuming that you donʼt have any compiler errors from DTrace you will be golden. But wait… where is the .h file? Well this is something that trips some people up it both exists and yet doesnʼt. By this I mean the MyAppProvider.h file IS in your xcode project, but itʼs buried deep in your Build folder. In this case the actual header file is at ( /Users/colinw/Desktop/MyApp/build/MyApp.build/Debug/MyApp.build/DerivedSources/MyAppProvider.h )

The resulting header file can actually be copied into your project if you really want, but really from this point on we donʼt need to worry about having the actual header in our project. What gets generated in the header file you can actually look at, but really it is not meant to be the most human readable thing in the world. In this case this is what is generated
/* * Generated by dtrace(1M). */
#ifndef _MYAPPPROVIDER_H#define _MYAPPPROVIDER_H
#include <unistd.h>
#ifdef __cplusplusextern "C" {#endif
#define MYAPP_STABILITY "___dtrace_stability$MyApp$v1$1_1_0_1_1_0_1_1_0_1_1_0_1_1_0"
#define MYAPP_TYPEDEFS "___dtrace_typedefs$MyApp$v1"
#define MYAPP_ACTION_END() \{ \ __asm__ volatile(".reference " MYAPP_TYPEDEFS); \ __dtrace_probe$MyApp$action_end$v1(); \ __asm__ volatile(".reference " MYAPP_STABILITY); \} #define MYAPP_ACTION_END_ENABLED() \ __dtrace_isenabled$MyApp$action_end$v1()#define MYAPP_ACTION_PHASE(arg0, arg1) \{ \ __asm__ volatile(".reference " MYAPP_TYPEDEFS); \ __dtrace_probe$MyApp$action_phase$v1$696e74$63686172202a(arg0, arg1); \ __asm__ volatile(".reference " MYAPP_STABILITY); \} #define MYAPP_ACTION_PHASE_ENABLED() \ __dtrace_isenabled$MyApp$action_phase$v1()#define MYAPP_ACTION_START() \{ \ __asm__ volatile(".reference " MYAPP_TYPEDEFS); \ __dtrace_probe$MyApp$action_start$v1(); \ __asm__ volatile(".reference " MYAPP_STABILITY); \} #define MYAPP_ACTION_START_ENABLED() \ __dtrace_isenabled$MyApp$action_start$v1()
extern void __dtrace_probe$MyApp$action_end$v1(void);extern int __dtrace_isenabled$MyApp$action_end$v1(void);extern void __dtrace_probe$MyApp$action_phase$v1$696e74$63686172202a(int, char *);extern int __dtrace_isenabled$MyApp$action_phase$v1(void);extern void __dtrace_probe$MyApp$action_start$v1(void);extern int __dtrace_isenabled$MyApp$action_start$v1(void);
#ifdef __cplusplus}#endif
#endif /* _MYAPPPROVIDER_H */

However from this point on the header file source isnʼt really relevant except for our using the DTrace USDT probes in our application.
Utilizing the Userland Static Probes in your App
Now that weʼve got the header file generated or actually copied into our project the initial hurdle of getting DTrace into our Xcode project is over. Now we actually need to use the generated methods. In terms of the dtrace probes I mentioned earlier that for each probe we specified another probe got generated with the same name but with an added “_ENABLED()” at the end. This essentially protects our app from suffering a performance hit when DTrace is not in use. In terms of actually using the methods we really only need to be concerned with the action_phase(int, char*) probe because it will (1) actually require memory to be allocated (2) cause serious calculations to be performed and (3) data to be passed into DTrace. To protect a method like this you would need to use the enabled method like so
Now in this case the Application I am demoing is really simple and the emphasis is more on showing usage of of the probes. The first thing we do is protect the ACTION_PHASE() probe with the enabled probe. The reason we do this is because we are creating objects, allocʼing memory,etc. and we donʼt want this to happen regardless of weather we are running DTrace or not. Now this example isnʼt the greatest because we really want to pass information about Objective-C objects in our apps, so how do we do this?
#import "AppController.h"#import "MyAppProvider.h"
@implementation AppController
-(id)init{ return self;}
-(IBAction)doSomething:(id)sender{ if(MYAPP_ACTION_PHASE_ENABLED()){ int aNum = 4; char *msg = (char *)"a String"; MYAPP_ACTION_PHASE(aNum,msg); }}
@end

Notice a couple things (1) I changed aNum to being a NSInteger which means I also have to make sure itʼs really an int because under 64 bit mode this changes to a long. Also I now have a NSString that we are trying to pass into DTrace, for Objective-C objects the quickest way to pass information about them is to call -description on them which generates a NSString that provides information about the object and itʼs contents, for a NSString it simply contains the plain string which we then call -UTF8String on to turn into a null terminated C String which DTrace does understand and can use. For this probe the phase number is arg0 and the c string is arg1. If we just wanted to check that this probe is firing we could check like so in the terminal
Really my printf in the probe action is unnecessary here, but we now know that the probe is firing in our application. So now all we need to do is modify our script to give us the information that we really want to know about in the probe.
#import "AppController.h"#import "MyAppProvider.h"
@implementation AppController
-(id)init{ return self;}
-(IBAction)doSomething:(id)sender{ if(MYAPP_ACTION_PHASE_ENABLED()){ NSInteger aNum = (int)4; NSString *myString = [[NSString alloc] initWithString:@"CRITICAL DEBUG INFO!"]; char *msg = (char *)[[myString description] UTF8String]; MYAPP_ACTION_PHASE(aNum,msg); }}
@end

dtrace -n ‘:MyApp::{printf(“Phase %i Message: %s”,arg0,copyinstr(arg1));}’
Here I am just using printf which is very similar to trace() but it allows us to control the formatting of the output we are interested in. In this case our probe fires with “Phase 4 Message: CRITICAL DEBUG INFO!” This fires whenever the -doSomething method is triggered on the AppController class and DTrace is actively tracing that probe. If we want to account for all the probes weʼll need to add the start and end probes in as well first.
In this case the probes with no arguments we really donʼt need to guard because what happens is that they get translated into NOPS12.
12 http://en.wikipedia.org/wiki/NOP
#import "AppController.h"#import "MyAppProvider.h"
@implementation AppController
-(id)init{ return self;}
-(IBAction)doSomething:(id)sender{ MYAPP_ACTION_START(); if(MYAPP_ACTION_PHASE_ENABLED()){ NSInteger aNum = (int)4; NSString *myString = [[NSString alloc] initWithString:@"CRITICAL DEBUG INFO!"]; char *msg = (char *)[[myString description] UTF8String]; MYAPP_ACTION_PHASE(aNum,msg); } MYAPP_ACTION_END();}
@end

Recording Data from the Userland Static Probes
Now when we search for our Appʼs Providers with dtrace we see all 3 probes available and the Objective-C method that they are being fired in. To use this I created this quick script
And then made it executable and ran it and got the following
Here, with very little effort we can easily see (1) what CPU core the code is executing on (2) What Objective-C method the probe is in and (3) the debug information that we wanted to make available to DTrace. If we want to translate this into a custom Instruments Instrument we just need to create it like so
#!/usr/sbin/dtrace -s
:MyApp::action_start { }
:MyApp::action_phase{ printf("Phase %i Message: %s",arg0,copyinstr(arg1));}
:MyApp::action_end { }

action_start probe
I opted to use the custom provider and to just look for the MyApp Module and the action_start label. By default Instruments wonʼt show the event so you have to record the name which will show “action_start.” When in these instruments custom probes we actually canʼt write trace() or printf, etc so we have to place that into options under “Record the following data:”
action_phase probe
Here again I am using a custom provider and looking for the MyApp module and then the action_phase label. Again it wonʼt record the name (action_phase) by default so we include that in the instrument. On this probe through itʼs important we record the message string and the phase number so the message is arg1 and the phase number is arg0 and we just need to tell instruments to record them and what they are (i.e. String, Integer.)

action_end Probe
This is exactly the same as the action_start probe with the only difference is that we are tracing for a different name and recording the label name. When we run this custom Instrument it will show us the following information for this even happening 1 time
Instruments also gives us extra information automatically like the user stack trace and the thread id in the extended detail pane as well.
Tracing Strategy Terminal or Instruments?
So you have seen that with instruments we get some extra benefits that in some situations it can be nice to have such information, on the other hand it can be much quicker sometimes to write scripts and invoke them from the terminal. The answer is that there really is no right answer here, it partially depends which style you favor and if you are asking a quick question or digging into a long debug session.
Typically I find that if I am asking quick questions and trying to prove/disprove something itʼs much faster to use dtrace -n in the terminal or write a script file and make it executable. Typically I use Instruments more for storing custom instruments that i know Iʼll need to periodically remeasure. Additionally unless you are good at organizing script files on disk Instruments provides a convenient organizing facility for your Instruments and you can group them by Application they are for etc. The only thing I really wish Instruments allowed was to let me set custom Iconʼs for the instruments. The Instruments files so have a iconURL key, but so far I havenʼt been successful in making it work, but then again I havenʼt tried spectacularly hard yet.

Chapter 5 General DTrace TipsTracing calls to Nil
This tip comes not from me, but from Bill Bumgarner13 and operates on essentially tracing objc_msgSend again, but checking that the object we are referencing is 0 or nil. I should note what he put in this post
“There are [at least] two different Objective-C messagers. objc_msgSend() and objc_msgSend_stret(). All of what is written here applies to both however objc_msgSend_stret() is the problematic one when it comes to messages to nil; it is the one used to return structures and, thus, the one that does not necessarily guarantee a zero return.”
The rest of his article follows: In my last post on the subject, Adrian Milliner posted a short dtrace script that would log the backtrace for all invocations of objc_msgSend where the first paramater — the target — was nil.
The script is as follows:
pid$1::objc_msgSend:entry/arg0==0/{ ustack();}
Once saved to a file (in this case objc-nil-trace.d, the trace can be applied to any running Cocoa process via:
sudo dtrace -s objc-nil-trace.d <pid>
The <pid> argument should, obviously, be the process ID of the process to be traced.
It works well enough and is certainly faster than a conditional breakpoint in GDB (likely, orders of magnitude faster), but it is far from a complete solution.
The output will be a series of backtraces dumped upon entry into an objc_msgSend() call where the first argument is nil. Something like:
0 18968 objc_msgSend:entry libobjc.A.dylib`objc_msgSend AppKit`-[NSApplication _doOpenUntitled]+0x11f AppKit`-[NSApplication(NSAppleEventHandling) _handleCoreEvent:withReplyEvent:]+0x62
13 http://www.friday.com/bbum/2008/01/03/objective-c-using-dtrace-to-trace-messages-to-nil/

Foundation`-[NSAppleEventManager dispatchRawAppleEvent:withRawReply:handlerRefCon:]+0x28f Foundation`_NSAppleEventManagerGenericHandler+0xdf AE`aeDispatchAppleEvent(AEDesc const*, AEDesc*, unsigned long, unsigned char*)+0x90 AE`dispatchEventAndSendReply(AEDesc const*, AEDesc*)+0x2c AE`aeProcessAppleEvent+0xb1 HIToolbox`AEProcessAppleEvent+0x26....
The first issue is that the backtrace does not dump the selector that was being messaged when the trace was triggered. In some cases, the line number of the original code may not be recoverable or, even if recoverable, you may not have the source available.
Now, the dtrace scripting language is misleadingly simple. It looks kinda like a subset of C with a bit of qualification sugar available upon function invocation.
However, the runtime is considerable more complex. When a dtrace script runs, it is actually running within the kernel. While introspection of the inferior is possible, it requires diddling the inferior from afar, using the various dtrace commands to copy over bits of data, as needed. Actually executing code in the client — often required to introspect higher level constructs — is pretty much out of the question. Given that said execution would happen in a quite thoroughly unexpected thread, doing so is likely to be highly destructive.
So, to grab the actual selector being invoked, we need to copy the selector name from the inferior into the dtrace interpreter within the kernel.
Specifically, taking the script and changing it to the following will dump the actual selector that was sent to objc_msgSend(). It treats the SEL argument as a pointer to a standard C string. It is, but only by coincidence (and a coincidence that is unlikely to change any time soon). However, predictable coincidence is just fine for debugging purposes.
pid$1::objc_msgSend:entry/arg0==0/{ printf("[<nil> %s]", copyinstr(arg1)); ustack();}
Well, almost.
Dtrace scripts — running in kernel land — have some serious limitations on the memory in the inferior they can access. In particular, a dtrace script cannot access data on pages of memory that are not currently active within the process at the time the script executes.

Which presents a problem. The actual selectorʼs name — the C string pointed to by arg1, the selector passed to objc_msgSend — is located on pages of memory in the dyld shared region. And this trips up dtrace in that the memory appears to almost never be resident. I say almost never because I had the rather head scratching moment where it was resident for about ten minutes. That was fun. Not.
However, setting the environment variable DYLD_SHARED_REGION to avoid causes the process to not use the shared cache. This, in turns, causes the pages that contain the selectors to remain in process and, thus, allows this rather seemingly simple dtrace script to dump the messages to nil. (Thank you, Greg!)
While this particular script does rather verbosely dump every single nil targeted invocation, it also dumps the stack trace at the time of invocation. Very useful.
Aside: objc_msgSend()ʼs return cannot be traced via dtrace at this time. Not surprising given that the function doesnʼt actually return — as far as dtrace is concerned, it is nothing but preamble. [/EndArticle]
Whatʼs even better than all of this is that someone in his comments offered up a great script that collects a lot more information and displays aggregated information on what is messaging nil
#pragma D option quiet
BEGIN{ globalNilMsgIndex = 0; globalVtime = vtimestamp; globalWtime = walltimestamp;}
pid$target::objc_msgSend:entry/ arg0 == 0 /{ this->mIndex = ++globalNilMsgIndex;
printf("%7d: [nil %s] (thread: %08x)\n", this->mIndex, copyinstr(arg1), tid); @nilAgg[ustack()] = count(); @selCounter[copyinstr(arg1)] = count();}
END{ printf("Nil-calling sites:\n"); printa(@nilAgg);
printf("Selectors frequently sent to nil:\n"); printa(@selCounter);}

What this script is doing is declaring 3 global vars globalNilMsgIndex, globalVtime and global wtime. When it hits the pid provider of your app target it traces objc_msgSend with the predicate that arg0 (the object being sent a message) is 0 or nil. When we have the right method and predicate it increments the globalNilMsgIndex counter and prints the message index and what message was sent to nil in addition to the thread id (tid) that this is being executed on. Then it aggregates the userland stack trace and the message that was sent to nil. When this script reaches the end it prints out all the stack traces of what lead to a nil message call and then shows what was most frequently sent to nil.
Here is a sample run of what I get when I ran it on Keynote for a little bit.
Objective-C Visual Flow Indentation from Terminal
#!/usr/sbin/dtrace -s
#pragma D option flowindent
objc$target:::entry,objc$target:::return{ trace(probemod);}

This is a really simple script Iʼve used to show how you can get Objective-C visual flow indentation inside the terminal. If you use the -F option or put “#pragma D option flowindent” in your script when invoking DTrace it will try & provide you with visual information of how functions are being entered and exited giving you much more powerful information than “function : entry” and “function : return.” When you run it on an objective-c target you should see something like
This technique is really a quick and dirty way to see this information if you need to. It could also be used with my next technique what I call “reference and traceʼ that it you could express interest in a specific spot in code and when you hit it set a variable to equal one then use the code above and add a predicate in that the variable equal in and you have a very quick way of seeing what was triggered by a method.
A note on objc_msgSend
Thanks to a reviewer I should note that we never really directly trace objc_msgSend return, this is because “There is no ʻexitʼ on objc_msgSend() is tail call optimized; it figures out the IMP and JMPs to it, never returning.” If you want to track returns on Objective-C method calls you must use the Objective-C provider for this. To prove this I wrote the following script in the terminal to make sure of this.

Reference and Trace
When I saw Bryan Cantrillʼs Google Tech Talk one technique of his that I saw what something I call Reference and Trace, by that i mean we pick a point of Interest (typically itʼs something we donʼt expect to run and we want to know why) and maybe we want to see what happened as a result of this in the same provider or maybe what happens as a result of an action in the kernel or any other provider.
This is a quick example of this methodology in practice that I wrote in a minute. In essence what this script does is it tells DTrace to visually show what is going on as it gets indicators that it is entering into and exiting out of Objective-C functions in the Cocoa Framework. When the script is initiated it creates a thread local variable enabled and sets it to 0. As soon as it hits the first NSMutableArray method it sets enabled to 1 and from there on out it traces the entering into and exiting out of Cocoa methods. I would use this with key points in your code that you want to quickly measure and see what happens afterwards. You can very easily change this to show Kernel functions, Core Foundation Functions, etc you just need to add the probe points for entry and return from those functions that you want to trace.
#!/usr/sbin/dtrace -s
#pragma D option flowindent
BEGIN{ self->enabled = 0;}
objc$target:NSMutableArray::entry{ self->enabled = 1;}
objc$target:::entry,objc$target:::return/self->enabled == 1/{ trace(probemod);}
END{ self->enabled = 0;}
A quick note about tracing dynamic loading & DTrace
DTrace works great in most instances except when dynamic loading is involved. Itʼs possible for DTrace to be slowed down by an order or magnitude because there is simply too much being resolved for it to not skew the timing results, you may encounter this for instance when a Cocoa application is just starting up.
Thanks