debugging with gdb - the gnu source-level debugger
TRANSCRIPT

8/14/2019 Debugging With GDB - The GNU Source-Level Debugger
http://slidepdf.com/reader/full/debugging-with-gdb-the-gnu-source-level-debugger 1/328
8/14/2019 Debugging With GDB - The GNU Source-Level Debugger
http://slidepdf.com/reader/full/debugging-with-gdb-the-gnu-source-level-debugger 2/328
Debugging with GDBThe gnu Source-Level Debugger
Ninth Edition, for GDB version 5.1.1January 2002
Richard Stallman, Roland Pesch, Stan Shebs, et al.
8/14/2019 Debugging With GDB - The GNU Source-Level Debugger
http://slidepdf.com/reader/full/debugging-with-gdb-the-gnu-source-level-debugger 3/328
Copyright c 1988, 1989, 1990, 1991, 1992, 1993, 1994, 1995, 1996, 1998, 1999, 2000, 2001,2002 Free Software Foundation, Inc.
Published by the Free Software Foundation59 Temple Place - Suite 330,Boston, MA 02111-1307 USAISBN 1-882114-88-4
Permission is granted to copy, distribute and/or modify this document under the termsof the GNU Free Documentation License, Version 1.1 or any later version published bythe Free Software Foundation; with the Invariant Sections being “Free Software” and “Free
Software Needs Free Documentation”, with the Front-Cover Texts being “A GNU Manual,”and with the Back-Cover Texts as in (a) below.
(a) The Free Software Foundation’s Back-Cover Text is: “You have freedom to copy andmodify this GNU Manual, like GNU software. Copies published by the Free SoftwareFoundation raise funds for GNU development.”
8/14/2019 Debugging With GDB - The GNU Source-Level Debugger
http://slidepdf.com/reader/full/debugging-with-gdb-the-gnu-source-level-debugger 4/328
i
Table of Contents
Summary of GDB. . . . . . . . . . . . . . . . . . . . . . . . . . . . .
1Free software . . . . . . . . . . . . . . . . . . . . . . . . . . . . . . . . . . . . . . . . . . . . . . . . 1Free Software Needs Free Documentation . . . . . . . . . . . . . . . . . . . . . . 1Contributors to GDB . . . . . . . . . . . . . . . . . . . . . . . . . . . . . . . . . . . . . . . . . 3
1 A Sample GDB Session . . . . . . . . . . . . . . . . . . . . 7
2 Getting In and Out of GDB . . . . . . . . . . . . . . . 112.1 Invoking GDB . . . . . . . . . . . . . . . . . . . . . . . . . . . . . . . . . . . . . . . . . 11
2.1.1 Choosing files . . . . . . . . . . . . . . . . . . . . . . . . . . . . . . . . . 122.1.2 Choosing modes . . . . . . . . . . . . . . . . . . . . . . . . . . . . . . . 13
2.2 Quitting GDB . . . . . . . . . . . . . . . . . . . . . . . . . . . . . . . . . . . . . . . . . 152.3 Shell commands . . . . . . . . . . . . . . . . . . . . . . . . . . . . . . . . . . . . . . . . 15
3 GDB Commands . . . . . . . . . . . . . . . . . . . . . . . . . 173.1 Command syntax . . . . . . . . . . . . . . . . . . . . . . . . . . . . . . . . . . . . . . 173.2 Command completion . . . . . . . . . . . . . . . . . . . . . . . . . . . . . . . . . . 173.3 Getting help . . . . . . . . . . . . . . . . . . . . . . . . . . . . . . . . . . . . . . . . . . . 19
4 Running Programs Under GDB . . . . . . . . . . . 234.1 Compiling for debugging . . . . . . . . . . . . . . . . . . . . . . . . . . . . . . . . 234.2 Starting your program . . . . . . . . . . . . . . . . . . . . . . . . . . . . . . . . . . 234.3 Your program’s arguments . . . . . . . . . . . . . . . . . . . . . . . . . . . . . . 244.4 Your program’s environment . . . . . . . . . . . . . . . . . . . . . . . . . . . . 254.5 Your program’s working directory . . . . . . . . . . . . . . . . . . . . . . . 264.6 Your program’s input and output. . . . . . . . . . . . . . . . . . . . . . . . 264.7 Debugging an already-running process . . . . . . . . . . . . . . . . . . . 27
4.8 Killing the child process . . . . . . . . . . . . . . . . . . . . . . . . . . . . . . . . 284.9 Debugging programs with multiple threads . . . . . . . . . . . . . . . 284.10 Debugging programs with multiple processes . . . . . . . . . . . . 30
5 Stopping and Continuing . . . . . . . . . . . . . . . . . . 335.1 Breakpoints, watchpoints, and catchpoints . . . . . . . . . . . . . . . 33
5.1.1 Setting breakpoints . . . . . . . . . . . . . . . . . . . . . . . . . . . . 345.1.2 Setting watchpoints . . . . . . . . . . . . . . . . . . . . . . . . . . . . 375.1.3 Setting catchpoints . . . . . . . . . . . . . . . . . . . . . . . . . . . . 39
5.1.4 Deleting breakpoints . . . . . . . . . . . . . . . . . . . . . . . . . . . 405.1.5 Disabling breakpoints . . . . . . . . . . . . . . . . . . . . . . . . . . 415.1.6 Break conditions. . . . . . . . . . . . . . . . . . . . . . . . . . . . . . . 425.1.7 Breakpoint command lists . . . . . . . . . . . . . . . . . . . . . . 435.1.8 Breakpoint menus . . . . . . . . . . . . . . . . . . . . . . . . . . . . . 44
8/14/2019 Debugging With GDB - The GNU Source-Level Debugger
http://slidepdf.com/reader/full/debugging-with-gdb-the-gnu-source-level-debugger 5/328
ii Debugging with GDB
5.1.9 “Cannot insert breakpoints” . . . . . . . . . . . . . . . . . . . . 455.2 Continuing and stepping . . . . . . . . . . . . . . . . . . . . . . . . . . . . . . . . 455.3 Signals . . . . . . . . . . . . . . . . . . . . . . . . . . . . . . . . . . . . . . . . . . . . . . . . 485.4 Stopping and starting multi-thread programs . . . . . . . . . . . . . 50
6 Examining the Stack. . . . . . . . . . . . . . . . . . . . . .
536.1 Stack frames . . . . . . . . . . . . . . . . . . . . . . . . . . . . . . . . . . . . . . . . . . . 536.2 Backtraces . . . . . . . . . . . . . . . . . . . . . . . . . . . . . . . . . . . . . . . . . . . . . 546.3 Selecting a frame . . . . . . . . . . . . . . . . . . . . . . . . . . . . . . . . . . . . . . . 556.4 Information about a frame . . . . . . . . . . . . . . . . . . . . . . . . . . . . . . 56
7 Examining Source Files . . . . . . . . . . . . . . . . . . . 577.1 Printing source lines . . . . . . . . . . . . . . . . . . . . . . . . . . . . . . . . . . . . 577.2 Searching source files . . . . . . . . . . . . . . . . . . . . . . . . . . . . . . . . . . . 58
7.3 Specifying source directories . . . . . . . . . . . . . . . . . . . . . . . . . . . . 597.4 Source and machine code . . . . . . . . . . . . . . . . . . . . . . . . . . . . . . . 59
8 Examining Data . . . . . . . . . . . . . . . . . . . . . . . . . . 638.1 Expressions . . . . . . . . . . . . . . . . . . . . . . . . . . . . . . . . . . . . . . . . . . . . 638.2 Program variables . . . . . . . . . . . . . . . . . . . . . . . . . . . . . . . . . . . . . . 648.3 Artificial arrays . . . . . . . . . . . . . . . . . . . . . . . . . . . . . . . . . . . . . . . . 658.4 Output formats . . . . . . . . . . . . . . . . . . . . . . . . . . . . . . . . . . . . . . . . 668.5 Examining memory. . . . . . . . . . . . . . . . . . . . . . . . . . . . . . . . . . . . . 678.6 Automatic display . . . . . . . . . . . . . . . . . . . . . . . . . . . . . . . . . . . . . . 688.7 Print settings . . . . . . . . . . . . . . . . . . . . . . . . . . . . . . . . . . . . . . . . . . 708.8 Value history . . . . . . . . . . . . . . . . . . . . . . . . . . . . . . . . . . . . . . . . . . 758.9 Convenience variables . . . . . . . . . . . . . . . . . . . . . . . . . . . . . . . . . . 768.10 Registers . . . . . . . . . . . . . . . . . . . . . . . . . . . . . . . . . . . . . . . . . . . . . 778.11 Floating point hardware . . . . . . . . . . . . . . . . . . . . . . . . . . . . . . . 788.12 Memory Region Attributes. . . . . . . . . . . . . . . . . . . . . . . . . . . . . 78
8.12.1 Attributes . . . . . . . . . . . . . . . . . . . . . . . . . . . . . . . . . . . 798.12.1.1 Memory Access Mode . . . . . . . . . . . . . . . . 798.12.1.2 Memory Access Size . . . . . . . . . . . . . . . . . . 79
8.12.1.3 Data Cache . . . . . . . . . . . . . . . . . . . . . . . . . . 80
9 Tracepoints. . . . . . . . . . . . . . . . . . . . . . . . . . . . . . . 819.1 Commands to Set Tracepoints. . . . . . . . . . . . . . . . . . . . . . . . . . . 81
9.1.1 Create and Delete Tracepoints . . . . . . . . . . . . . . . . . . 819.1.2 Enable and Disable Tracepoints. . . . . . . . . . . . . . . . . 829.1.3 Tracepoint Passcounts . . . . . . . . . . . . . . . . . . . . . . . . . 829.1.4 Tracepoint Action Lists . . . . . . . . . . . . . . . . . . . . . . . . 839.1.5 Listing Tracepoints . . . . . . . . . . . . . . . . . . . . . . . . . . . . 849.1.6 Starting and Stopping Trace Experiment . . . . . . . . 85
9.2 Using the collected data . . . . . . . . . . . . . . . . . . . . . . . . . . . . . . . . 859.2.1 tfind n . . . . . . . . . . . . . . . . . . . . . . . . . . . . . . . . . . . . . . . 859.2.2 tdump. . . . . . . . . . . . . . . . . . . . . . . . . . . . . . . . . . . . . . . . . 879.2.3 save-tracepoints filename . . . . . . . . . . . . . . . . . . . . 88
9.3 Convenience Variables for Tracepoints . . . . . . . . . . . . . . . . . . . 88
8/14/2019 Debugging With GDB - The GNU Source-Level Debugger
http://slidepdf.com/reader/full/debugging-with-gdb-the-gnu-source-level-debugger 6/328
iii
10 Debugging Programs That Use Overlays . . 9110.1 How Overlays Work . . . . . . . . . . . . . . . . . . . . . . . . . . . . . . . . . . . 9110.2 Overlay Commands . . . . . . . . . . . . . . . . . . . . . . . . . . . . . . . . . . . 9210.3 Automatic Overlay Debugging . . . . . . . . . . . . . . . . . . . . . . . . . 9410.4 Overlay Sample Program . . . . . . . . . . . . . . . . . . . . . . . . . . . . . . 95
11 Using GDB with Different Languages . . . . . 9711.1 Switching between source languages . . . . . . . . . . . . . . . . . . . . 97
11.1.1 List of filename extensions and languages . . . . . . . 9711.1.2 Setting the working language . . . . . . . . . . . . . . . . . . 9811.1.3 Having GDB infer the source language . . . . . . . . . 98
11.2 Displaying the language . . . . . . . . . . . . . . . . . . . . . . . . . . . . . . . 9811.3 Type and range checking . . . . . . . . . . . . . . . . . . . . . . . . . . . . . . 99
11.3.1 An overview of type checking . . . . . . . . . . . . . . . . . . 99
11.3.2 An overview of range checking . . . . . . . . . . . . . . . . 10011.4 Supported languages . . . . . . . . . . . . . . . . . . . . . . . . . . . . . . . . . 101
11.4.1 C and C++ . . . . . . . . . . . . . . . . . . . . . . . . . . . . . . . . . . 10211.4.1.1 C and C++ operators . . . . . . . . . . . . . . . . 10211.4.1.2 C and C++ constants . . . . . . . . . . . . . . . . 10411.4.1.3 C++ expressions . . . . . . . . . . . . . . . . . . . . . 10411.4.1.4 C and C++ defaults . . . . . . . . . . . . . . . . . 10511.4.1.5 C and C++ type and range checks . . . . 10511.4.1.6 GDB and C . . . . . . . . . . . . . . . . . . . . . . . . 10611.4.1.7 GDB features for C++ . . . . . . . . . . . . . . . 106
11.4.2 Modula-2 . . . . . . . . . . . . . . . . . . . . . . . . . . . . . . . . . . . 10711.4.2.1 Operators . . . . . . . . . . . . . . . . . . . . . . . . . . 10711.4.2.2 Built-in functions and procedures . . . . 10911.4.2.3 Constants . . . . . . . . . . . . . . . . . . . . . . . . . . 11011.4.2.4 Modula-2 defaults. . . . . . . . . . . . . . . . . . . 11011.4.2.5 Deviations from standard Modula-2 . . 11011.4.2.6 Modula-2 type and range checks . . . . . 11111.4.2.7 The scope operators :: and . . . . . . . . . 11111.4.2.8 GDB and Modula-2 . . . . . . . . . . . . . . . . . 111
11.4.3 Chill . . . . . . . . . . . . . . . . . . . . . . . . . . . . . . . . . . . . . . . 11211.4.3.1 How modes are displayed . . . . . . . . . . . . 11211.4.3.2 Locations and their accesses . . . . . . . . . 11411.4.3.3 Values and their Operations . . . . . . . . . 11411.4.3.4 Chill type and range checks . . . . . . . . . . 11611.4.3.5 Chill defaults . . . . . . . . . . . . . . . . . . . . . . . 117
12 Examining the Symbol Table . . . . . . . . . . . . 119

8/14/2019 Debugging With GDB - The GNU Source-Level Debugger
http://slidepdf.com/reader/full/debugging-with-gdb-the-gnu-source-level-debugger 7/328
iv Debugging with GDB
13 Altering Execution . . . . . . . . . . . . . . . . . . . . . 12313.1 Assignment to variables . . . . . . . . . . . . . . . . . . . . . . . . . . . . . . 12313.2 Continuing at a different address . . . . . . . . . . . . . . . . . . . . . . 12413.3 Giving your program a signal . . . . . . . . . . . . . . . . . . . . . . . . . 12513.4 Returning from a function . . . . . . . . . . . . . . . . . . . . . . . . . . . . 125
13.5 Calling program functions . . . . . . . . . . . . . . . . . . . . . . . . . . . . 12613.6 Patching programs . . . . . . . . . . . . . . . . . . . . . . . . . . . . . . . . . . . 126
14 GDB Files . . . . . . . . . . . . . . . . . . . . . . . . . . . . . 12714.1 Commands to specify files . . . . . . . . . . . . . . . . . . . . . . . . . . . . 12714.2 Errors reading symbol files . . . . . . . . . . . . . . . . . . . . . . . . . . . . 132
15 Specifying a Debugging Target . . . . . . . . . . 13515.1 Active targets . . . . . . . . . . . . . . . . . . . . . . . . . . . . . . . . . . . . . . . . 13515.2 Commands for managing targets . . . . . . . . . . . . . . . . . . . . . . 13515.3 Choosing target byte order. . . . . . . . . . . . . . . . . . . . . . . . . . . . 13715.4 Remote debugging . . . . . . . . . . . . . . . . . . . . . . . . . . . . . . . . . . . 13715.5 Kernel Object Display . . . . . . . . . . . . . . . . . . . . . . . . . . . . . . . . 138
16 Debugging remote programs . . . . . . . . . . . . 13916.1 Using the gdbserver program . . . . . . . . . . . . . . . . . . . . . . . . . 13916.2 Using the gdbserve.nlm program . . . . . . . . . . . . . . . . . . . . . 14016.3 Implementing a remote stub . . . . . . . . . . . . . . . . . . . . . . . . . . 141
16.3.1 What the stub can do for you . . . . . . . . . . . . . . . . 14216.3.2 What you must do for the stub . . . . . . . . . . . . . . . 14216.3.3 Putting it all together . . . . . . . . . . . . . . . . . . . . . . . 144
17 Configuration-Specific Information . . . . . . . 14717.1 Native . . . . . . . . . . . . . . . . . . . . . . . . . . . . . . . . . . . . . . . . . . . . . . 147
17.1.1 HP-UX . . . . . . . . . . . . . . . . . . . . . . . . . . . . . . . . . . . . . 14717.1.2 SVR4 process information . . . . . . . . . . . . . . . . . . . . 14717.1.3 Features for Debugging djgpp Programs . . . . . . 147
17.1.4 Features for Debugging MS Windows PEexecutables . . . . . . . . . . . . . . . . . . . . . . . . . . . . . . . . . . . . . 149
17.2 Embedded Operating Systems. . . . . . . . . . . . . . . . . . . . . . . . . 15017.2.1 Using GDB with VxWorks . . . . . . . . . . . . . . . . . . . 150
17.2.1.1 Connecting to VxWorks . . . . . . . . . . . . . 15117.2.1.2 VxWorks download . . . . . . . . . . . . . . . . . 15117.2.1.3 Running tasks . . . . . . . . . . . . . . . . . . . . . . 152
17.3 Embedded Processors . . . . . . . . . . . . . . . . . . . . . . . . . . . . . . . . 15217.3.1 ARM . . . . . . . . . . . . . . . . . . . . . . . . . . . . . . . . . . . . . . . 15217.3.2 Hitachi H8/300 . . . . . . . . . . . . . . . . . . . . . . . . . . . . . . 152
17.3.2.1 Connecting to Hitachi boards . . . . . . . . 15317.3.2.2 Using the E7000 in-circuit emulator . . 15417.3.2.3 Special GDB commands for Hitachi micros
. . . . . . . . . . . . . . . . . . . . . . . . . . . . . . . . . . . . . . . . 15517.3.3 H8/500 . . . . . . . . . . . . . . . . . . . . . . . . . . . . . . . . . . . . . 155

8/14/2019 Debugging With GDB - The GNU Source-Level Debugger
http://slidepdf.com/reader/full/debugging-with-gdb-the-gnu-source-level-debugger 8/328
v
17.3.4 Intel i960 . . . . . . . . . . . . . . . . . . . . . . . . . . . . . . . . . . . 15517.3.4.1 Startup with Nindy . . . . . . . . . . . . . . . . . 15617.3.4.2 Options for Nindy . . . . . . . . . . . . . . . . . . 15617.3.4.3 Nindy reset command . . . . . . . . . . . . . . . 156
17.3.5 Mitsubishi M32R/D . . . . . . . . . . . . . . . . . . . . . . . . . 156
17.3.6 M68k . . . . . . . . . . . . . . . . . . . . . . . . . . . . . . . . . . . . . . . 15717.3.7 M88K . . . . . . . . . . . . . . . . . . . . . . . . . . . . . . . . . . . . . . 15717.3.8 MIPS Embedded . . . . . . . . . . . . . . . . . . . . . . . . . . . . 15717.3.9 PowerPC . . . . . . . . . . . . . . . . . . . . . . . . . . . . . . . . . . . 15917.3.10 HP PA Embedded . . . . . . . . . . . . . . . . . . . . . . . . . . 15917.3.11 Hitachi SH . . . . . . . . . . . . . . . . . . . . . . . . . . . . . . . . . 15917.3.12 Tsqware Sparclet . . . . . . . . . . . . . . . . . . . . . . . . . . . 160
17.3.12.1 Setting file to debug. . . . . . . . . . . . . . . . 16017.3.12.2 Connecting to Sparclet . . . . . . . . . . . . . 16017.3.12.3 Sparclet download . . . . . . . . . . . . . . . . . 161
17.3.12.4 Running and debugging . . . . . . . . . . . . 16117.3.13 Fujitsu Sparclite. . . . . . . . . . . . . . . . . . . . . . . . . . . . 16117.3.14 Tandem ST2000 . . . . . . . . . . . . . . . . . . . . . . . . . . . . 16117.3.15 Zilog Z8000 . . . . . . . . . . . . . . . . . . . . . . . . . . . . . . . . 162
17.4 Architectures . . . . . . . . . . . . . . . . . . . . . . . . . . . . . . . . . . . . . . . . 16317.4.1 A29K. . . . . . . . . . . . . . . . . . . . . . . . . . . . . . . . . . . . . . . 16317.4.2 Alpha . . . . . . . . . . . . . . . . . . . . . . . . . . . . . . . . . . . . . . 16317.4.3 MIPS. . . . . . . . . . . . . . . . . . . . . . . . . . . . . . . . . . . . . . . 163
18 Controlling GDB. . . . . . . . . . . . . . . . . . . . . . .
16518.1 Prompt . . . . . . . . . . . . . . . . . . . . . . . . . . . . . . . . . . . . . . . . . . . . . 16518.2 Command editing . . . . . . . . . . . . . . . . . . . . . . . . . . . . . . . . . . . . 16518.3 Command history . . . . . . . . . . . . . . . . . . . . . . . . . . . . . . . . . . . . 16518.4 Screen size. . . . . . . . . . . . . . . . . . . . . . . . . . . . . . . . . . . . . . . . . . . 16718.5 Numbers . . . . . . . . . . . . . . . . . . . . . . . . . . . . . . . . . . . . . . . . . . . . 16718.6 Optional warnings and messages . . . . . . . . . . . . . . . . . . . . . . 16818.7 Optional messages about internal happenings. . . . . . . . . . . 169
19 Canned Sequences of Commands. . . . . . . .
17119.1 User-defined commands. . . . . . . . . . . . . . . . . . . . . . . . . . . . . . . 17119.2 User-defined command hooks . . . . . . . . . . . . . . . . . . . . . . . . . 17219.3 Command files . . . . . . . . . . . . . . . . . . . . . . . . . . . . . . . . . . . . . . . 17319.4 Commands for controlled output . . . . . . . . . . . . . . . . . . . . . . 174
20 GDB Text User Interface . . . . . . . . . . . . . . . 17720.1 TUI overview . . . . . . . . . . . . . . . . . . . . . . . . . . . . . . . . . . . . . . . . 17720.2 TUI Key Bindings . . . . . . . . . . . . . . . . . . . . . . . . . . . . . . . . . . . 177
20.3 TUI specific commands . . . . . . . . . . . . . . . . . . . . . . . . . . . . . . . 17820.4 TUI configuration variables . . . . . . . . . . . . . . . . . . . . . . . . . . . 179
21 Using GDB under gnu Emacs . . . . . . . . . . . 181

8/14/2019 Debugging With GDB - The GNU Source-Level Debugger
http://slidepdf.com/reader/full/debugging-with-gdb-the-gnu-source-level-debugger 9/328
vi Debugging with GDB
22 GDB Annotations . . . . . . . . . . . . . . . . . . . . . . 18322.1 What is an Annotation? . . . . . . . . . . . . . . . . . . . . . . . . . . . . . . 18322.2 The Server Prefix . . . . . . . . . . . . . . . . . . . . . . . . . . . . . . . . . . . . 18322.3 Values . . . . . . . . . . . . . . . . . . . . . . . . . . . . . . . . . . . . . . . . . . . . . . . 18422.4 Frames . . . . . . . . . . . . . . . . . . . . . . . . . . . . . . . . . . . . . . . . . . . . . . 185
22.5 Displays . . . . . . . . . . . . . . . . . . . . . . . . . . . . . . . . . . . . . . . . . . . . . 18722.6 Annotation for GDB Input. . . . . . . . . . . . . . . . . . . . . . . . . . . . 18722.7 Errors. . . . . . . . . . . . . . . . . . . . . . . . . . . . . . . . . . . . . . . . . . . . . . . 18822.8 Information on Breakpoints . . . . . . . . . . . . . . . . . . . . . . . . . . . 18822.9 Invalidation Notices . . . . . . . . . . . . . . . . . . . . . . . . . . . . . . . . . . 18922.10 Running the Program . . . . . . . . . . . . . . . . . . . . . . . . . . . . . . . 18922.11 Displaying Source . . . . . . . . . . . . . . . . . . . . . . . . . . . . . . . . . . . 19022.12 Annotations We Might Want in the Future. . . . . . . . . . . . 190
23 The gdb/mi Interface. . . . . . . . . . . . . . . . . . .
191Function and Purpose . . . . . . . . . . . . . . . . . . . . . . . . . . . . . . . . . . . . . . 191Notation and Terminology . . . . . . . . . . . . . . . . . . . . . . . . . . . . . . . . . . 19123.1 gdb/mi Command Syntax . . . . . . . . . . . . . . . . . . . . . . . . . . . . 191
23.1.1 gdb/mi Input Syntax . . . . . . . . . . . . . . . . . . . . . . . . 19123.1.2 gdb/mi Output Syntax . . . . . . . . . . . . . . . . . . . . . . 19223.1.3 Simple Examples of gdb/mi Interaction . . . . . . . 194
23.2 gdb/mi Compatibility with CLI . . . . . . . . . . . . . . . . . . . . . . . 19523.3 gdb/mi Output Records . . . . . . . . . . . . . . . . . . . . . . . . . . . . . . 195
23.3.1 gdb/mi Result Records . . . . . . . . . . . . . . . . . . . . . . 19523.3.2 gdb/mi Stream Records . . . . . . . . . . . . . . . . . . . . . 19523.3.3 gdb/mi Out-of-band Records . . . . . . . . . . . . . . . . . 196
23.4 gdb/mi Command Description Format . . . . . . . . . . . . . . . . 19623.5 gdb/mi Breakpoint table commands . . . . . . . . . . . . . . . . . . . 19723.6 gdb/mi Data Manipulation . . . . . . . . . . . . . . . . . . . . . . . . . . . 20523.7 gdb/mi Program control . . . . . . . . . . . . . . . . . . . . . . . . . . . . . 21523.8 Miscellaneous GDB commands in gdb/mi. . . . . . . . . . . . . . 22523.9 gdb/mi Stack Manipulation Commands . . . . . . . . . . . . . . . 22723.10 gdb/mi Symbol Query Commands . . . . . . . . . . . . . . . . . . . 232
23.11 gdb/mi Target Manipulation Commands . . . . . . . . . . . . . 23523.12 gdb/mi Thread Commands . . . . . . . . . . . . . . . . . . . . . . . . . . 24023.13 gdb/mi Tracepoint Commands. . . . . . . . . . . . . . . . . . . . . . . 24223.14 gdb/mi Variable Objects . . . . . . . . . . . . . . . . . . . . . . . . . . . . 242
24 Reporting Bugs in GDB . . . . . . . . . . . . . . . . 24724.1 Have you found a bug? . . . . . . . . . . . . . . . . . . . . . . . . . . . . . . . 24724.2 How to report bugs . . . . . . . . . . . . . . . . . . . . . . . . . . . . . . . . . . 247
8/14/2019 Debugging With GDB - The GNU Source-Level Debugger
http://slidepdf.com/reader/full/debugging-with-gdb-the-gnu-source-level-debugger 10/328

8/14/2019 Debugging With GDB - The GNU Source-Level Debugger
http://slidepdf.com/reader/full/debugging-with-gdb-the-gnu-source-level-debugger 11/328

8/14/2019 Debugging With GDB - The GNU Source-Level Debugger
http://slidepdf.com/reader/full/debugging-with-gdb-the-gnu-source-level-debugger 12/328
Summary of GDB 1
Summary of GDB
The purpose of a debugger such as GDB is to allow you to see what is going on “inside”
another program while it executes—or what another program was doing at the moment itcrashed.
GDB can do four main kinds of things (plus other things in support of these) to helpyou catch bugs in the act:
• Start your program, specifying anything that might affect its behavior.
• Make your program stop on specified conditions.
• Examine what has happened, when your program has stopped.
• Change things in your program, so you can experiment with correcting the effects of
one bug and go on to learn about another.
You can use GDB to debug programs written in C and C++. For more information, seeSection 11.4 [Supported languages], page 101. For more information, see Section 11.4.1 [Cand C++], page 102.
Support for Modula-2 and Chill is partial. For information on Modula-2, see Sec-tion 11.4.2 [Modula-2], page 107. For information on Chill, see Section 11.4.3 [Chill],page 112.
Debugging Pascal programs which use sets, subranges, file variables, or nested functionsdoes not currently work. GDB does not support entering expressions, printing values, orsimilar features using Pascal syntax.
GDB can be used to debug programs written in Fortran, although it may be necessaryto refer to some variables with a trailing underscore.
Free software
GDB is free software , protected by the gnu General Public License (GPL). The GPLgives you the freedom to copy or adapt a licensed program—but every person getting acopy also gets with it the freedom to modify that copy (which means that they must getaccess to the source code), and the freedom to distribute further copies. Typical softwarecompanies use copyrights to limit your freedoms; the Free Software Foundation uses theGPL to preserve these freedoms.
Fundamentally, the General Public License is a license which says that you have thesefreedoms and that you cannot take these freedoms away from anyone else.
Free Software Needs Free Documentation
The biggest deficiency in the free software community today is not in the software—it is
the lack of good free documentation that we can include with the free software. Many of ourmost important programs do not come with free reference manuals and free introductorytexts. Documentation is an essential part of any software package; when an important freesoftware package does not come with a free manual and a free tutorial, that is a major gap.We have many such gaps today.
8/14/2019 Debugging With GDB - The GNU Source-Level Debugger
http://slidepdf.com/reader/full/debugging-with-gdb-the-gnu-source-level-debugger 13/328
2 Debugging with GDB
Consider Perl, for instance. The tutorial manuals that people normally use are non-free.How did this come about? Because the authors of those manuals published them withrestrictive terms—no copying, no modification, source files not available—which exclude
them from the free software world.That wasn’t the first time this sort of thing happened, and it was far from the last.
Many times we have heard a GNU user eagerly describe a manual that he is writing, hisintended contribution to the community, only to learn that he had ruined everything bysigning a publication contract to make it non-free.
Free documentation, like free software, is a matter of freedom, not price. The problemwith the non-free manual is not that publishers charge a price for printed copies—that initself is fine. (The Free Software Foundation sells printed copies of manuals, too.) Theproblem is the restrictions on the use of the manual. Free manuals are available in source
code form, and give you permission to copy and modify. Non-free manuals do not allowthis.
The criteria of freedom for a free manual are roughly the same as for free software.Redistribution (including the normal kinds of commercial redistribution) must be permitted,so that the manual can accompany every copy of the program, both on-line and on paper.
Permission for modification of the technical content is crucial too. When people mod-ify the software, adding or changing features, if they are conscientious they will changethe manual too—so they can provide accurate and clear documentation for the modifiedprogram. A manual that leaves you no choice but to write a new manual to document a
changed version of the program is not really available to our community.Some kinds of limits on the way modification is handled are acceptable. For example,
requirements to preserve the original author’s copyright notice, the distribution terms, orthe list of authors, are ok. It is also no problem to require modified versions to includenotice that they were modified. Even entire sections that may not be deleted or changedare acceptable, as long as they deal with nontechnical topics (like this one). These kinds of restrictions are acceptable because they don’t obstruct the community’s normal use of themanual.
However, it must be possible to modify all the technical content of the manual, and thendistribute the result in all the usual media, through all the usual channels. Otherwise, therestrictions obstruct the use of the manual, it is not free, and we need another manual toreplace it.
Please spread the word about this issue. Our community continues to lose manualsto proprietary publishing. If we spread the word that free software needs free referencemanuals and free tutorials, perhaps the next person who wants to contribute by writingdocumentation will realize, before it is too late, that only free manuals contribute to thefree software community.
If you are writing documentation, please insist on publishing it under the GNU FreeDocumentation License or another free documentation license. Remember that this deci-
sion requires your approval—you don’t have to let the publisher decide. Some commercialpublishers will use a free license if you insist, but they will not propose the option; it is upto you to raise the issue and say firmly that this is what you want. If the publisher youare dealing with refuses, please try other publishers. If you’re not sure whether a proposedlicense is free, write to [email protected].

8/14/2019 Debugging With GDB - The GNU Source-Level Debugger
http://slidepdf.com/reader/full/debugging-with-gdb-the-gnu-source-level-debugger 14/328
Summary of GDB 3
You can encourage commercial publishers to sell more free, copylefted manuals andtutorials by buying them, and particularly by buying copies from the publishers that paidfor their writing or for major improvements. Meanwhile, try to avoid buying non-free
documentation at all. Check the distribution terms of a manual before you buy it, andinsist that whoever seeks your business must respect your freedom. Check the history of the book, and try to reward the publishers that have paid or pay the authors to work on it.
The Free Software Foundation maintains a list of free documentation published by otherpublishers, at http://www.fsf.org/doc/other-free-books.html.
Contributors to GDB
Richard Stallman was the original author of GDB, and of many other gnu programs.Many others have contributed to its development. This section attempts to credit majorcontributors. One of the virtues of free software is that everyone is free to contribute toit; with regret, we cannot actually acknowledge everyone here. The file ‘ChangeLog’ in theGDB distribution approximates a blow-by-blow account.
Changes much prior to version 2.0 are lost in the mists of time.
Plea: Additions to this section are particularly welcome. If you or your friends(or enemies, to be evenhanded) have been unfairly omitted from this list, wewould like to add your names!
So that they may not regard their many labors as thankless, we particularly thankthose who shepherded GDB through major releases: Andrew Cagney (releases 5.0 and 5.1);
Jim Blandy (release 4.18); Jason Molenda (release 4.17); Stan Shebs (release 4.14); FredFish (releases 4.16, 4.15, 4.13, 4.12, 4.11, 4.10, and 4.9); Stu Grossman and John Gilmore(releases 4.8, 4.7, 4.6, 4.5, and 4.4); John Gilmore (releases 4.3, 4.2, 4.1, 4.0, and 3.9); JimKingdon (releases 3.5, 3.4, and 3.3); and Randy Smith (releases 3.2, 3.1, and 3.0).
Richard Stallman, assisted at various times by Peter TerMaat, Chris Hanson, andRichard Mlynarik, handled releases through 2.8.
Michael Tiemann is the author of most of the gnu C++ support in GDB, with significantadditional contributions from Per Bothner and Daniel Berlin. James Clark wrote the gnuC++ demangler. Early work on C++ was by Peter TerMaat (who also did much general
update work leading to release 3.0).GDB uses the BFD subroutine library to examine multiple object-file formats; BFD
was a joint project of David V. Henkel-Wallace, Rich Pixley, Steve Chamberlain, and JohnGilmore.
David Johnson wrote the original COFF support; Pace Willison did the original supportfor encapsulated COFF.
Brent Benson of Harris Computer Systems contributed DWARF2 support.
Adam de Boor and Bradley Davis contributed the ISI Optimum V support. Per Bothner,Noboyuki Hikichi, and Alessandro Forin contributed MIPS support. Jean-Daniel Fekete
contributed Sun 386i support. Chris Hanson improved the HP9000 support. NoboyukiHikichi and Tomoyuki Hasei contributed Sony/News OS 3 support. David Johnson con-tributed Encore Umax support. Jyrki Kuoppala contributed Altos 3068 support. Jeff Law contributed HP PA and SOM support. Keith Packard contributed NS32K support.Doug Rabson contributed Acorn Risc Machine support. Bob Rusk contributed Harris

8/14/2019 Debugging With GDB - The GNU Source-Level Debugger
http://slidepdf.com/reader/full/debugging-with-gdb-the-gnu-source-level-debugger 15/328
4 Debugging with GDB
Nighthawk CX-UX support. Chris Smith contributed Convex support (and Fortran de-bugging). Jonathan Stone contributed Pyramid support. Michael Tiemann contributedSPARC support. Tim Tucker contributed support for the Gould NP1 and Gould Powern-
ode. Pace Willison contributed Intel 386 support. Jay Vosburgh contributed Symmetrysupport.
Andreas Schwab contributed M68K Linux support.
Rich Schaefer and Peter Schauer helped with support of SunOS shared libraries.
Jay Fenlason and Roland McGrath ensured that GDB and GAS agree about severalmachine instruction sets.
Patrick Duval, Ted Goldstein, Vikram Koka and Glenn Engel helped develop remotedebugging. Intel Corporation, Wind River Systems, AMD, and ARM contributed remotedebugging modules for the i960, VxWorks, A29K UDI, and RDI targets, respectively.
Brian Fox is the author of the readline libraries providing command-line editing andcommand history.
Andrew Beers of SUNY Buffalo wrote the language-switching code, the Modula-2 sup-port, and contributed the Languages chapter of this manual.
Fred Fish wrote most of the support for Unix System Vr4. He also enhanced thecommand-completion support to cover C++ overloaded symbols.
Hitachi America, Ltd. sponsored the support for H8/300, H8/500, and Super-H proces-sors.
NEC sponsored the support for the v850, Vr4xxx, and Vr5xxx processors.Mitsubishi sponsored the support for D10V, D30V, and M32R/D processors.
Toshiba sponsored the support for the TX39 Mips processor.
Matsushita sponsored the support for the MN10200 and MN10300 processors.
Fujitsu sponsored the support for SPARClite and FR30 processors.
Kung Hsu, Jeff Law, and Rick Sladkey added support for hardware watchpoints.
Michael Snyder added support for tracepoints.
Stu Grossman wrote gdbserver.
Jim Kingdon, Peter Schauer, Ian Taylor, and Stu Grossman made nearly innumerablebug fixes and cleanups throughout GDB.
The following people at the Hewlett-Packard Company contributed support for the PA-RISC 2.0 architecture, HP-UX 10.20, 10.30, and 11.0 (narrow mode), HP’s implementationof kernel threads, HP’s aC++ compiler, and the terminal user interface: Ben Krepp, RichardTitle, John Bishop, Susan Macchia, Kathy Mann, Satish Pai, India Paul, Steve Rehrauer,and Elena Zannoni. Kim Haase provided HP-specific information in this manual.
DJ Delorie ported GDB to MS-DOS, for the DJGPP project. Robert Hoehne madesignificant contributions to the DJGPP port.
Cygnus Solutions has sponsored GDB maintenance and much of its development since1991. Cygnus engineers who have worked on GDB fulltime include Mark Alexander, JimBlandy, Per Bothner, Kevin Buettner, Edith Epstein, Chris Faylor, Fred Fish, MartinHunt, Jim Ingham, John Gilmore, Stu Grossman, Kung Hsu, Jim Kingdon, John Metzler,Fernando Nasser, Geoffrey Noer, Dawn Perchik, Rich Pixley, Zdenek Radouch, Keith Seitz,

8/14/2019 Debugging With GDB - The GNU Source-Level Debugger
http://slidepdf.com/reader/full/debugging-with-gdb-the-gnu-source-level-debugger 16/328
Summary of GDB 5
Stan Shebs, David Taylor, and Elena Zannoni. In addition, Dave Brolley, Ian Carmichael,Steve Chamberlain, Nick Clifton, JT Conklin, Stan Cox, DJ Delorie, Ulrich Drepper, FrankEigler, Doug Evans, Sean Fagan, David Henkel-Wallace, Richard Henderson, Jeff Holcomb,
Jeff Law, Jim Lemke, Tom Lord, Bob Manson, Michael Meissner, Jason Merrill, CatherineMoore, Drew Moseley, Ken Raeburn, Gavin Romig-Koch, Rob Savoye, Jamie Smith, MikeStump, Ian Taylor, Angela Thomas, Michael Tiemann, Tom Tromey, Ron Unrau, JimWilson, and David Zuhn have made contributions both large and small.

8/14/2019 Debugging With GDB - The GNU Source-Level Debugger
http://slidepdf.com/reader/full/debugging-with-gdb-the-gnu-source-level-debugger 17/328
6 Debugging with GDB

8/14/2019 Debugging With GDB - The GNU Source-Level Debugger
http://slidepdf.com/reader/full/debugging-with-gdb-the-gnu-source-level-debugger 18/328
Chapter 1: A Sample GDB Session 7
1 A Sample GDB Session
You can use this manual at your leisure to read all about GDB. However, a handful
of commands are enough to get started using the debugger. This chapter illustrates thosecommands.
In this sample session, we emphasize user input like this: input, to make it easier to pickout from the surrounding output.
One of the preliminary versions of gnu m4 (a generic macro processor) exhibits thefollowing bug: sometimes, when we change its quote strings from the default, the commandsused to capture one macro definition within another stop working. In the following short m4
session, we define a macro foo which expands to 0000; we then use the m4 built-in defn todefine bar as the same thing. However, when we change the open quote string to <QUOTE>
and the close quote string to <UNQUOTE>, the same procedure fails to define a new synonymbaz:
$ cd gnu/m4$ ./m4define(foo,0000)
foo0000define(bar,defn(‘foo’))
bar0000changequote(<QUOTE>,<UNQUOTE>)
define(baz,defn(<QUOTE>foo<UNQUOTE>))bazC-d m4: End of input: 0: fatal error: EOF in string
Let us use GDB to try to see what is going on.
$ gdb m4
GDB is free software and you are welcome to distribute copiesof it under certain conditions; type "show copying" to seethe conditions.
There is absolutely no warranty for GDB; type "show warranty"for details.
GDB 5.2.1, Copyright 1999 Free Software Foundation, Inc...(gdb)
GDB reads only enough symbol data to know where to find the rest when needed; as aresult, the first prompt comes up very quickly. We now tell GDB to use a narrower display
width than usual, so that examples fit in this manual.(gdb) set width 70
We need to see how the m4 built-in changequote works. Having looked at the source, weknow the relevant subroutine is m4_changequote, so we set a breakpoint there with theGDB break command.
8/14/2019 Debugging With GDB - The GNU Source-Level Debugger
http://slidepdf.com/reader/full/debugging-with-gdb-the-gnu-source-level-debugger 19/328
8 Debugging with GDB
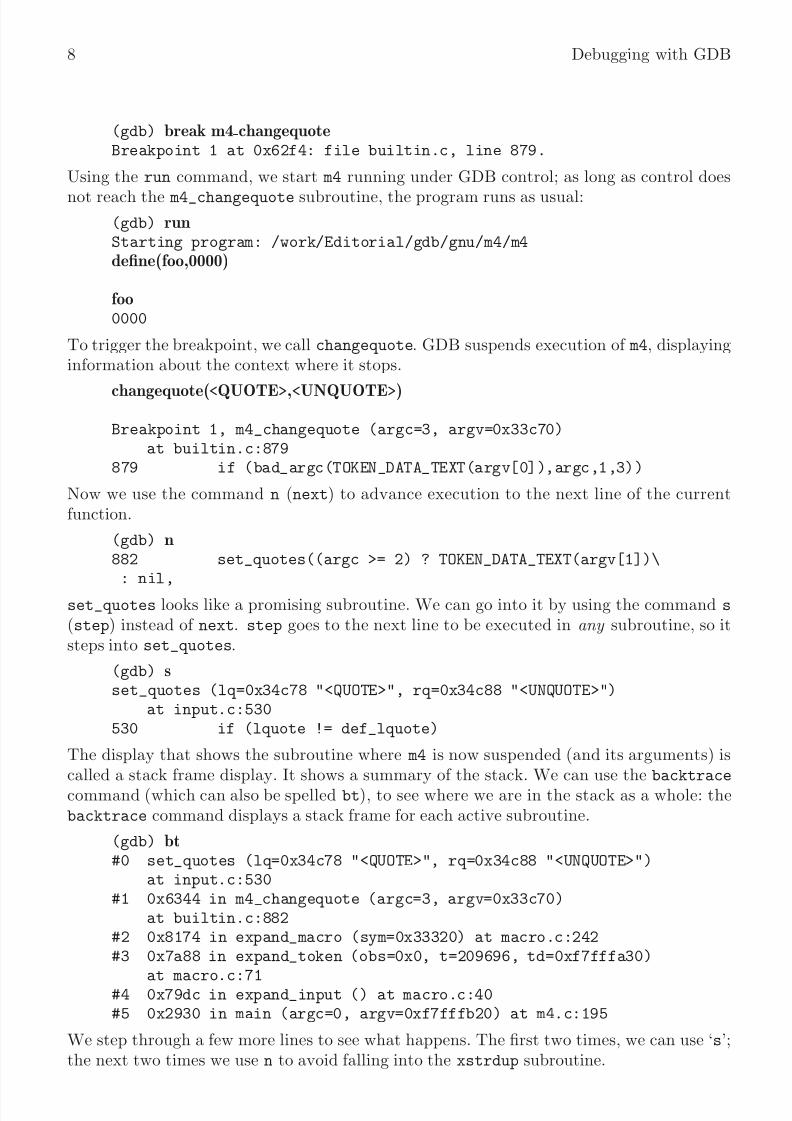
(gdb) break m4 changequoteBreakpoint 1 at 0x62f4: file builtin.c, line 879.
Using the run command, we start m4 running under GDB control; as long as control does
not reach the m4_changequote subroutine, the program runs as usual:(gdb) runStarting program: /work/Editorial/gdb/gnu/m4/m4define(foo,0000)
foo0000
To trigger the breakpoint, we call changequote. GDB suspends execution of m4, displayinginformation about the context where it stops.
changequote(<QUOTE>,<UNQUOTE>)
Breakpoint 1, m4_changequote (argc=3, argv=0x33c70)at builtin.c:879
879 if (bad_argc(TOKEN_DATA_TEXT(argv[0]),argc,1,3))
Now we use the command n (next) to advance execution to the next line of the currentfunction.
(gdb) n882 set_quotes((argc >= 2) ? TOKEN_DATA_TEXT(argv[1])\
: nil,set_quotes looks like a promising subroutine. We can go into it by using the command s
(step) instead of next. step goes to the next line to be executed in any subroutine, so itsteps into set_quotes.
(gdb) sset_quotes (lq=0x34c78 "<QUOTE>", rq=0x34c88 "<UNQUOTE>")
at input.c:530530 if (lquote != def_lquote)
The display that shows the subroutine where m4 is now suspended (and its arguments) is
called a stack frame display. It shows a summary of the stack. We can use the backtracecommand (which can also be spelled bt), to see where we are in the stack as a whole: thebacktrace command displays a stack frame for each active subroutine.
(gdb) bt#0 set_quotes (lq=0x34c78 "<QUOTE>", rq=0x34c88 "<UNQUOTE>")
at input.c:530#1 0x6344 in m4_changequote (argc=3, argv=0x33c70)
at builtin.c:882#2 0x8174 in expand_macro (sym=0x33320) at macro.c:242#3 0x7a88 in expand_token (obs=0x0, t=209696, td=0xf7fffa30)
at macro.c:71#4 0x79dc in expand_input () at macro.c:40#5 0x2930 in main (argc=0, argv=0xf7fffb20) at m4.c:195
We step through a few more lines to see what happens. The first two times, we can use ‘s’;the next two times we use n to avoid falling into the xstrdup subroutine.

8/14/2019 Debugging With GDB - The GNU Source-Level Debugger
http://slidepdf.com/reader/full/debugging-with-gdb-the-gnu-source-level-debugger 20/328
Chapter 1: A Sample GDB Session 9
(gdb) s0x3b5c 532 if (rquote != def_rquote)(gdb) s
0x3b80 535 lquote = (lq == nil || *lq == ’\0’) ? \def_lquote : xstrdup(lq);(gdb) n536 rquote = (rq == nil || *rq == ’\0’) ? def_rquote\
: xstrdup(rq);(gdb) n538 len_lquote = strlen(rquote);
The last line displayed looks a little odd; we can examine the variables lquote and rquote
to see if they are in fact the new left and right quotes we specified. We use the commandp (print) to see their values.
(gdb) p lquote$1 = 0x35d40 "<QUOTE>"(gdb) p rquote$2 = 0x35d50 "<UNQUOTE>"
lquote and rquote are indeed the new left and right quotes. To look at some context, wecan display ten lines of source surrounding the current line with the l (list) command.
(gdb) l533 xfree(rquote);534
535 lquote = (lq == nil || *lq == ’\0’) ? def_lquote\: xstrdup (lq);536 rquote = (rq == nil || *rq == ’\0’) ? def_rquote\
: xstrdup (rq);537538 len_lquote = strlen(rquote);539 len_rquote = strlen(lquote);540 }541542 void
Let us step past the two lines that set len_lquote and len_rquote, and then examine thevalues of those variables.
(gdb) n539 len_rquote = strlen(lquote);(gdb) n540 }(gdb) p len lquote$ 3 = 9(gdb) p len rquote$ 4 = 7
That certainly looks wrong, assuming len_lquote and len_rquote are meant to be thelengths of lquote and rquote respectively. We can set them to better values using the p
command, since it can print the value of any expression—and that expression can includesubroutine calls and assignments.
(gdb) p len lquote=strlen(lquote)

8/14/2019 Debugging With GDB - The GNU Source-Level Debugger
http://slidepdf.com/reader/full/debugging-with-gdb-the-gnu-source-level-debugger 21/328
10 Debugging with GDB
$ 5 = 7(gdb) p len rquote=strlen(rquote)$ 6 = 9
Is that enough to fix the problem of using the new quotes with the m4 built-in defn? We canallow m4 to continue executing with the c (continue) command, and then try the examplethat caused trouble initially:
(gdb) cContinuing.
define(baz,defn(<QUOTE>foo<UNQUOTE>))
baz0000
Success! The new quotes now work just as well as the default ones. The problem seems tohave been just the two typos defining the wrong lengths. We allow m4 exit by giving it anEOF as input:
C-dProgram exited normally.
The message ‘Program exited normally.’ is from GDB; it indicates m4 has finished exe-cuting. We can end our GDB session with the GDB quit command.
(gdb) quit
8/14/2019 Debugging With GDB - The GNU Source-Level Debugger
http://slidepdf.com/reader/full/debugging-with-gdb-the-gnu-source-level-debugger 22/328
Chapter 2: Getting In and Out of GDB 11
2 Getting In and Out of GDB
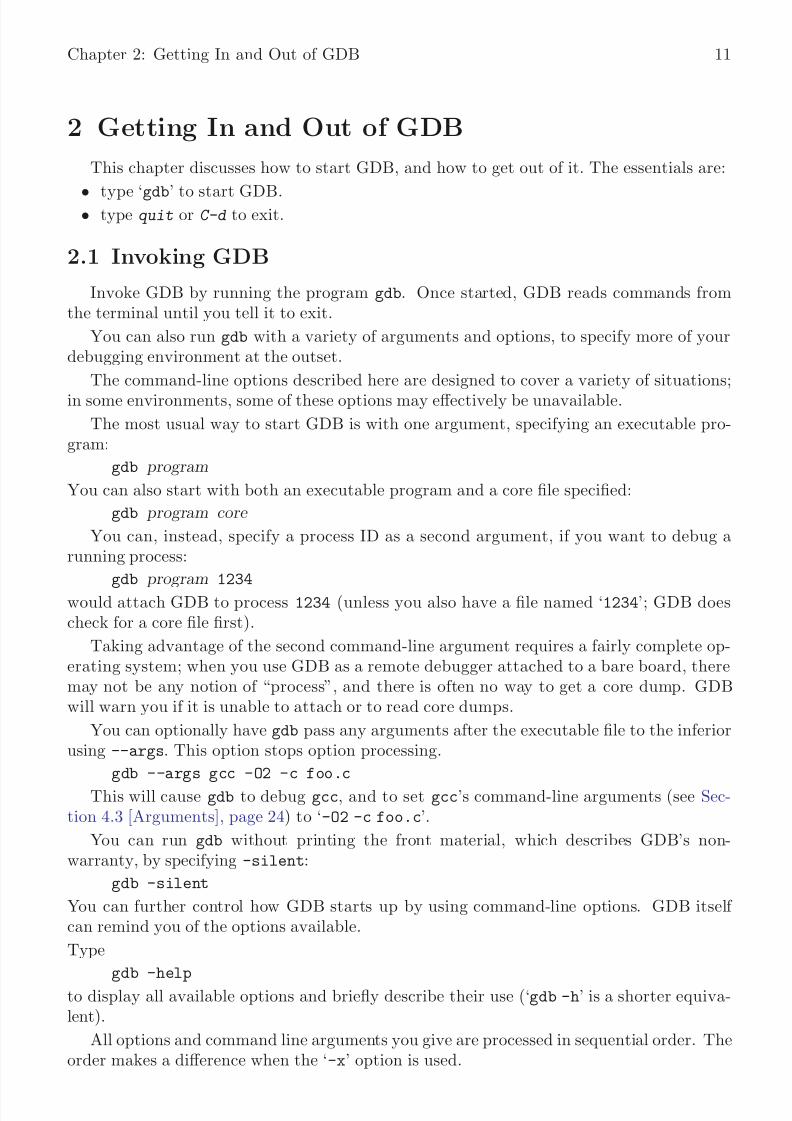
This chapter discusses how to start GDB, and how to get out of it. The essentials are:
• type ‘gdb’ to start GDB.• type quit or C-d to exit.
2.1 Invoking GDB
Invoke GDB by running the program gdb. Once started, GDB reads commands fromthe terminal until you tell it to exit.
You can also run gdb with a variety of arguments and options, to specify more of yourdebugging environment at the outset.
The command-line options described here are designed to cover a variety of situations;in some environments, some of these options may effectively be unavailable.
The most usual way to start GDB is with one argument, specifying an executable pro-gram:
gdb program
You can also start with both an executable program and a core file specified:
gdb program core
You can, instead, specify a process ID as a second argument, if you want to debug arunning process:
gdb program 1234would attach GDB to process 1234 (unless you also have a file named ‘1234’; GDB doescheck for a core file first).
Taking advantage of the second command-line argument requires a fairly complete op-erating system; when you use GDB as a remote debugger attached to a bare board, theremay not be any notion of “process”, and there is often no way to get a core dump. GDBwill warn you if it is unable to attach or to read core dumps.
You can optionally have gdb pass any arguments after the executable file to the inferiorusing --args. This option stops option processing.
gdb --args gcc -O2 -c foo.cThis will cause gdb to debug gcc, and to set gcc’s command-line arguments (see Sec-
tion 4.3 [Arguments], page 24) to ‘-O2 -c foo.c’.
You can run gdb without printing the front material, which describes GDB’s non-warranty, by specifying -silent:
gdb -silent
You can further control how GDB starts up by using command-line options. GDB itself can remind you of the options available.
Type
gdb -helpto display all available options and briefly describe their use (‘gdb -h’ is a shorter equiva-lent).
All options and command line arguments you give are processed in sequential order. Theorder makes a difference when the ‘-x’ option is used.

8/14/2019 Debugging With GDB - The GNU Source-Level Debugger
http://slidepdf.com/reader/full/debugging-with-gdb-the-gnu-source-level-debugger 23/328
12 Debugging with GDB
2.1.1 Choosing files
When GDB starts, it reads any arguments other than options as specifying an executable
file and core file (or process ID). This is the same as if the arguments were specified by the‘-se’ and ‘-c’ (or ‘-p’ options respectively. (GDB reads the first argument that does nothave an associated option flag as equivalent to the ‘-se’ option followed by that argument;and the second argument that does not have an associated option flag, if any, as equivalentto the ‘-c’/‘-p’ option followed by that argument.) If the second argument begins with adecimal digit, GDB will first attempt to attach to it as a process, and if that fails, attemptto open it as a corefile. If you have a corefile whose name begins with a digit, you canprevent GDB from treating it as a pid by prefixing it with ‘ ./’, eg. ‘./12345’.
If GDB has not been configured to included core file support, such as for most embeddedtargets, then it will complain about a second argument and ignore it.
Many options have both long and short forms; both are shown in the following list.GDB also recognizes the long forms if you truncate them, so long as enough of the option ispresent to be unambiguous. (If you prefer, you can flag option arguments with ‘--’ ratherthan ‘-’, though we illustrate the more usual convention.)
-symbols file -s file Read symbol table from file file .
-exec file -e file Use file file as the executable file to execute when appropriate, and for examining
pure data in conjunction with a core dump.-se file Read symbol table from file file and use it as the executable file.
-core file -c file Use file file as a core dump to examine.
-c number -pid number -p number
Connect to process ID number , as with the attach command. If there is no
such process, GDB will attempt to open a core file named number .-command file -x file Execute GDB commands from file file . See Section 19.3 [Command files],
page 173.
-directory directory -d directory
Add directory to the path to search for source files.
-m
-mapped Warning: this option depends on operating system facilities that are not sup-
ported on all systems.If memory-mapped files are available on your system through the mmap systemcall, you can use this option to have GDB write the symbols from your programinto a reusable file in the current directory. If the program you are debuggingis called ‘/tmp/fred’, the mapped symbol file is ‘/tmp/fred.syms’. Future

8/14/2019 Debugging With GDB - The GNU Source-Level Debugger
http://slidepdf.com/reader/full/debugging-with-gdb-the-gnu-source-level-debugger 24/328
Chapter 2: Getting In and Out of GDB 13
GDB debugging sessions notice the presence of this file, and can quickly mapin symbol information from it, rather than reading the symbol table from theexecutable program.
The ‘.syms’ file is specific to the host machine where GDB is run. It holdsan exact image of the internal GDB symbol table. It cannot be shared acrossmultiple host platforms.
-r
-readnow Read each symbol file’s entire symbol table immediately, rather than the default,which is to read it incrementally as it is needed. This makes startup slower,but makes future operations faster.
You typically combine the -mapped and -readnow options in order to build a ‘.syms’file that contains complete symbol information. (See Section 14.1 [Commands to specify
files], page 127, for information on ‘.syms’ files.) A simple GDB invocation to do nothingbut build a ‘.syms’ file for future use is:
gdb -batch -nx -mapped -readnow programname
2.1.2 Choosing modes
You can run GDB in various alternative modes—for example, in batch mode or quietmode.
-nx
-n Do not execute commands found in any initialization files. Normally, GDB exe-cutes the commands in these files after all the command options and argumentshave been processed. See Section 19.3 [Command files], page 173.
-quiet
-silent
-q “Quiet”. Do not print the introductory and copyright messages. These mes-sages are also suppressed in batch mode.
-batch Run in batch mode. Exit with status 0 after processing all the command filesspecified with ‘-x’ (and all commands from initialization files, if not inhibited
with ‘-n’). Exit with nonzero status if an error occurs in executing the GDBcommands in the command files.
Batch mode may be useful for running GDB as a filter, for example to downloadand run a program on another computer; in order to make this more useful, themessage
Program exited normally.
(which is ordinarily issued whenever a program running under GDB controlterminates) is not issued when running in batch mode.
-nowindows
-nw “No windows”. If GDB comes with a graphical user interface (GUI) built in,then this option tells GDB to only use the command-line interface. If no GUIis available, this option has no effect.
-windows
-w If GDB includes a GUI, then this option requires it to be used if possible.
8/14/2019 Debugging With GDB - The GNU Source-Level Debugger
http://slidepdf.com/reader/full/debugging-with-gdb-the-gnu-source-level-debugger 25/328
8/14/2019 Debugging With GDB - The GNU Source-Level Debugger
http://slidepdf.com/reader/full/debugging-with-gdb-the-gnu-source-level-debugger 26/328
Chapter 2: Getting In and Out of GDB 15
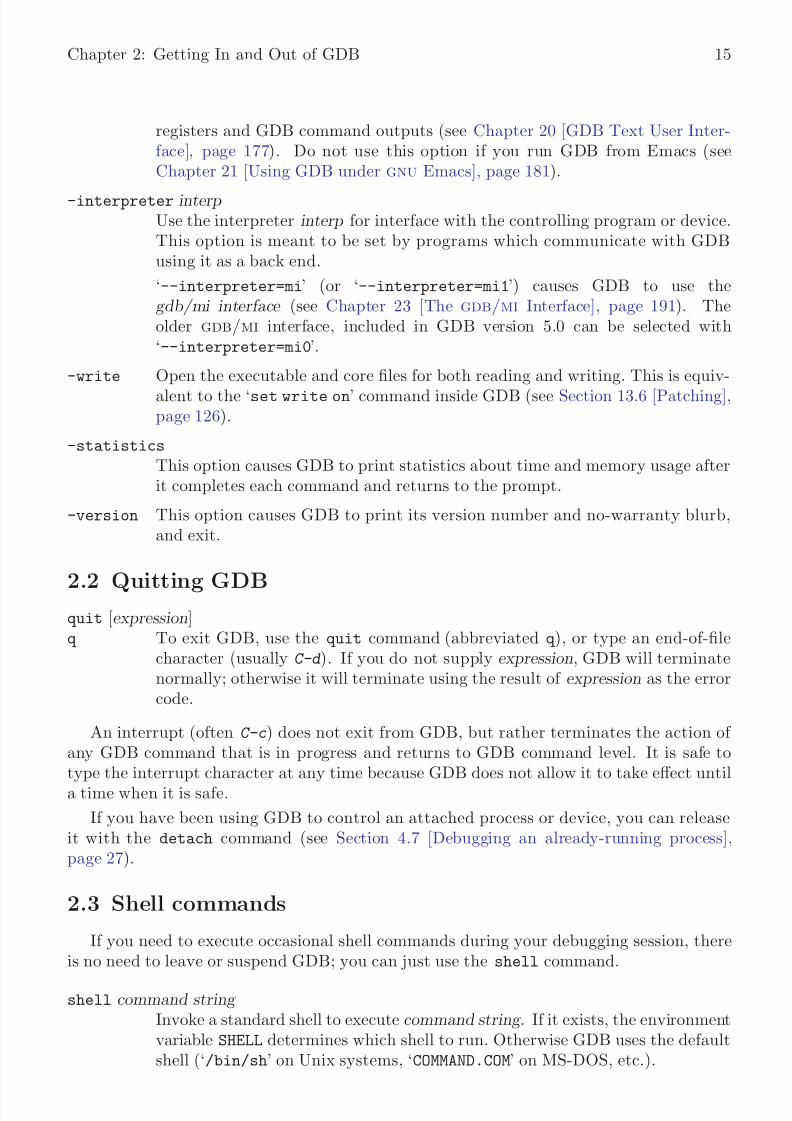
registers and GDB command outputs (see Chapter 20 [GDB Text User Inter-face], page 177). Do not use this option if you run GDB from Emacs (seeChapter 21 [Using GDB under gnu Emacs], page 181).
-interpreter interpUse the interpreter interp for interface with the controlling program or device.This option is meant to be set by programs which communicate with GDBusing it as a back end.
‘--interpreter=mi’ (or ‘--interpreter=mi1’) causes GDB to use thegdb/mi interface (see Chapter 23 [The gdb/mi Interface], page 191). Theolder gdb/mi interface, included in GDB version 5.0 can be selected with‘--interpreter=mi0’.
-write Open the executable and core files for both reading and writing. This is equiv-alent to the ‘set write on’ command inside GDB (see Section 13.6 [Patching],page 126).
-statistics
This option causes GDB to print statistics about time and memory usage afterit completes each command and returns to the prompt.
-version This option causes GDB to print its version number and no-warranty blurb,and exit.
2.2 Quitting GDBquit [expression]q To exit GDB, use the quit command (abbreviated q ), or type an end-of-file
character (usually C-d). If you do not supply expression, GDB will terminatenormally; otherwise it will terminate using the result of expression as the errorcode.
An interrupt (often C-c) does not exit from GDB, but rather terminates the action of any GDB command that is in progress and returns to GDB command level. It is safe to
type the interrupt character at any time because GDB does not allow it to take effect untila time when it is safe.
If you have been using GDB to control an attached process or device, you can releaseit with the detach command (see Section 4.7 [Debugging an already-running process],page 27).
2.3 Shell commands
If you need to execute occasional shell commands during your debugging session, thereis no need to leave or suspend GDB; you can just use the shell command.
shell command string Invoke a standard shell to execute command string . If it exists, the environmentvariable SHELL determines which shell to run. Otherwise GDB uses the defaultshell (‘/bin/sh’ on Unix systems, ‘COMMAND.COM’ on MS-DOS, etc.).
8/14/2019 Debugging With GDB - The GNU Source-Level Debugger
http://slidepdf.com/reader/full/debugging-with-gdb-the-gnu-source-level-debugger 27/328
16 Debugging with GDB
The utility make is often needed in development environments. You do not have to usethe shell command for this purpose in GDB:
make make-args Execute the make program with the specified arguments. This is equivalent to‘shell make make-args ’.

8/14/2019 Debugging With GDB - The GNU Source-Level Debugger
http://slidepdf.com/reader/full/debugging-with-gdb-the-gnu-source-level-debugger 28/328
Chapter 3: GDB Commands 17
3 GDB Commands
You can abbreviate a GDB command to the first few letters of the command name, if
that abbreviation is unambiguous; and you can repeat certain GDB commands by typing just RET. You can also use the TAB key to get GDB to fill out the rest of a word in acommand (or to show you the alternatives available, if there is more than one possibility).
3.1 Command syntax
A GDB command is a single line of input. There is no limit on how long it can be.It starts with a command name, which is followed by arguments whose meaning dependson the command name. For example, the command step accepts an argument which isthe number of times to step, as in ‘step 5’. You can also use the step command with no
arguments. Some commands do not allow any arguments.GDB command names may always be truncated if that abbreviation is unambiguous.
Other possible command abbreviations are listed in the documentation for individual com-mands. In some cases, even ambiguous abbreviations are allowed; for example, s is speciallydefined as equivalent to step even though there are other commands whose names startwith s. You can test abbreviations by using them as arguments to the help command.
A blank line as input to GDB (typing just RET) means to repeat the previous command.Certain commands (for example, run) will not repeat this way; these are commands whoseunintentional repetition might cause trouble and which you are unlikely to want to repeat.
The list and x commands, when you repeat them with RET, construct new argumentsrather than repeating exactly as typed. This permits easy scanning of source or memory.
GDB can also use RET in another way: to partition lengthy output, in a way similar tothe common utility more (see Section 18.4 [Screen size], page 167). Since it is easy to pressone RET too many in this situation, GDB disables command repetition after any commandthat generates this sort of display.
Any text from a # to the end of the line is a comment; it does nothing. This is usefulmainly in command files (see Section 19.3 [Command files], page 173).
The C-o binding is useful for repeating a complex sequence of commands. This command
accepts the current line, like RET , and then fetches the next line relative to the current linefrom the history for editing.
3.2 Command completion
GDB can fill in the rest of a word in a command for you, if there is only one possibility;it can also show you what the valid possibilities are for the next word in a command, atany time. This works for GDB commands, GDB subcommands, and the names of symbolsin your program.
Press the TAB key whenever you want GDB to fill out the rest of a word. If there is
only one possibility, GDB fills in the word, and waits for you to finish the command (orpress RET to enter it). For example, if you type
(gdb) info bre TAB
GDB fills in the rest of the word ‘breakpoints’, since that is the only info subcommandbeginning with ‘bre’:

8/14/2019 Debugging With GDB - The GNU Source-Level Debugger
http://slidepdf.com/reader/full/debugging-with-gdb-the-gnu-source-level-debugger 29/328
18 Debugging with GDB
(gdb) info breakpoints
You can either press RET at this point, to run the info breakpoints command, orbackspace and enter something else, if ‘breakpoints’ does not look like the command you
expected. (If you were sure you wanted info breakpoints in the first place, you might aswell just type RET immediately after ‘info bre’, to exploit command abbreviations ratherthan command completion).
If there is more than one possibility for the next word when you press TAB, GDB soundsa bell. You can either supply more characters and try again, or just press TAB a secondtime; GDB displays all the possible completions for that word. For example, you mightwant to set a breakpoint on a subroutine whose name begins with ‘ make_’, but when youtype b make_TAB GDB just sounds the bell. Typing TAB again displays all the functionnames in your program that begin with those characters, for example:
(gdb) b make_ TABGDB sounds bell; press TAB again, to see:
make_a_section_from_file make_environ make_abs_section make_function_type make_blockvector make_pointer_type make_cleanup make_reference_type make_command make_symbol_completion_list(gdb) b make_
After displaying the available possibilities, GDB copies your partial input (‘b make_’ in theexample) so you can finish the command.
If you just want to see the list of alternatives in the first place, you can press M-? ratherthan pressing TAB twice. M-? means META ? . You can type this either by holding downa key designated as the META shift on your keyboard (if there is one) while typing ? , or asESC followed by ? .
Sometimes the string you need, while logically a “word”, may contain parentheses orother characters that GDB normally excludes from its notion of a word. To permit wordcompletion to work in this situation, you may enclose words in ’ (single quote marks) inGDB commands.
The most likely situation where you might need this is in typing the name of a C++
function. This is because C++ allows function overloading (multiple definitions of the samefunction, distinguished by argument type). For example, when you want to set a breakpointyou may need to distinguish whether you mean the version of name that takes an int
parameter, name(int), or the version that takes a float parameter, name(float). To usethe word-completion facilities in this situation, type a single quote ’ at the beginning of the function name. This alerts GDB that it may need to consider more information thanusual when you press TAB or M-? to request word completion:
(gdb) b ’bubble( M-? bubble(double,double) bubble(int,int)
(gdb) b ’bubble(In some cases, GDB can tell that completing a name requires using quotes. When this
happens, GDB inserts the quote for you (while completing as much as it can) if you do nottype the quote in the first place:
(gdb) b bub TAB

8/14/2019 Debugging With GDB - The GNU Source-Level Debugger
http://slidepdf.com/reader/full/debugging-with-gdb-the-gnu-source-level-debugger 30/328
Chapter 3: GDB Commands 19
GDB alters your input line to the following, and rings a bell:(gdb) b ’bubble(
In general, GDB can tell that a quote is needed (and inserts it) if you have not yet started
typing the argument list when you ask for completion on an overloaded symbol.For more information about overloaded functions, see Section 11.4.1.3 [C++ expressions],
page 104. You can use the command set overload-resolution off to disable overloadresolution; see Section 11.4.1.7 [GDB features for C++], page 106.
3.3 Getting help
You can always ask GDB itself for information on its commands, using the commandhelp.
help
h You can use help (abbreviated h) with no arguments to display a short list of named classes of commands:
(gdb) helpList of classes of commands:
aliases -- Aliases of other commandsbreakpoints -- Making program stop at certain pointsdata -- Examining data
files -- Specifying and examining filesinternals -- Maintenance commandsobscure -- Obscure featuresrunning -- Running the programstack -- Examining the stackstatus -- Status inquiriessupport -- Support facilitiestracepoints -- Tracing of program execution without
stopping the program
user-defined -- User-defined commands
Type "help" followed by a class name for a list ofcommands in that class.Type "help" followed by command name for fulldocumentation.Command name abbreviations are allowed if unambiguous.(gdb)
help class Using one of the general help classes as an argument, you can get a list of theindividual commands in that class. For example, here is the help display for
the class status:
(gdb) help statusStatus inquiries.
List of commands:

8/14/2019 Debugging With GDB - The GNU Source-Level Debugger
http://slidepdf.com/reader/full/debugging-with-gdb-the-gnu-source-level-debugger 31/328
20 Debugging with GDB
info -- Generic command for showing thingsabout the program being debugged
show -- Generic command for showing thingsabout the debugger
Type "help" followed by command name for fulldocumentation.Command name abbreviations are allowed if unambiguous.(gdb)
help command With a command name as help argument, GDB displays a short paragraph onhow to use that command.
apropos args The apropos args command searches through all of the GDB commands, andtheir documentation, for the regular expression specified in args . It prints outall matches found. For example:
apropos reload
results in:
set symbol-reloading -- Set dynamic symbol table reloading multiple times in one run
show symbol-reloading -- Show dynamic symbol table reloading multiple times in one run
complete args The complete args command lists all the possible completions for the beginningof a command. Use args to specify the beginning of the command you wantcompleted. For example:
complete i
results in:
if
ignoreinfoinspect
This is intended for use by gnu Emacs.
In addition to help, you can use the GDB commands info and show to inquire about thestate of your program, or the state of GDB itself. Each command supports many topics of inquiry; this manual introduces each of them in the appropriate context. The listings underinfo and under show in the Index point to all the sub-commands. See [Index], page 307.
info This command (abbreviated i) is for describing the state of your program. Forexample, you can list the arguments given to your program with info args,list the registers currently in use with info registers, or list the breakpointsyou have set with info breakpoints. You can get a complete list of the info
sub-commands with help info.

8/14/2019 Debugging With GDB - The GNU Source-Level Debugger
http://slidepdf.com/reader/full/debugging-with-gdb-the-gnu-source-level-debugger 32/328
Chapter 3: GDB Commands 21
set You can assign the result of an expression to an environment variable with set.For example, you can set the GDB prompt to a $-sign with set prompt $.
show In contrast to info, show is for describing the state of GDB itself. You can
change most of the things you can show, by using the related command set;for example, you can control what number system is used for displays with set
radix, or simply inquire which is currently in use with show radix.
To display all the settable parameters and their current values, you can useshow with no arguments; you may also use info set. Both commands producethe same display.
Here are three miscellaneous show subcommands, all of which are exceptional in lackingcorresponding set commands:
show versionShow what version of GDB is running. You should include this information inGDB bug-reports. If multiple versions of GDB are in use at your site, you mayneed to determine which version of GDB you are running; as GDB evolves, newcommands are introduced, and old ones may wither away. Also, many systemvendors ship variant versions of GDB, and there are variant versions of GDBin gnu/Linux distributions as well. The version number is the same as the oneannounced when you start GDB.
show copying
Display information about permission for copying GDB.
show warranty
Display the gnu “NO WARRANTY” statement, or a warranty, if your versionof GDB comes with one.

8/14/2019 Debugging With GDB - The GNU Source-Level Debugger
http://slidepdf.com/reader/full/debugging-with-gdb-the-gnu-source-level-debugger 33/328
22 Debugging with GDB
8/14/2019 Debugging With GDB - The GNU Source-Level Debugger
http://slidepdf.com/reader/full/debugging-with-gdb-the-gnu-source-level-debugger 34/328
Chapter 4: Running Programs Under GDB 23
4 Running Programs Under GDB
When you run a program under GDB, you must first generate debugging information
when you compile it.You may start GDB with its arguments, if any, in an environment of your choice. If you
are doing native debugging, you may redirect your program’s input and output, debug analready running process, or kill a child process.
4.1 Compiling for debugging
In order to debug a program effectively, you need to generate debugging informationwhen you compile it. This debugging information is stored in the object file; it describesthe data type of each variable or function and the correspondence between source linenumbers and addresses in the executable code.
To request debugging information, specify the ‘-g’ option when you run the compiler.
Many C compilers are unable to handle the ‘-g’ and ‘-O’ options together. Using thosecompilers, you cannot generate optimized executables containing debugging information.
GCC, the gnu C compiler, supports ‘-g’ with or without ‘-O’, making it possible todebug optimized code. We recommend that you always use ‘-g’ whenever you compile aprogram. You may think your program is correct, but there is no sense in pushing yourluck.
When you debug a program compiled with ‘-g -O’, remember that the optimizer isrearranging your code; the debugger shows you what is really there. Do not be too surprisedwhen the execution path does not exactly match your source file! An extreme example: if you define a variable, but never use it, GDB never sees that variable—because the compileroptimizes it out of existence.
Some things do not work as well with ‘-g -O’ as with just ‘-g’, particularly on machineswith instruction scheduling. If in doubt, recompile with ‘-g’ alone, and if this fixes theproblem, please report it to us as a bug (including a test case!).
Older versions of the gnu C compiler permitted a variant option ‘-gg’ for debugginginformation. GDB no longer supports this format; if your gnu C compiler has this option,do not use it.
4.2 Starting your program
run
r Use the run command to start your program under GDB. You must first spec-ify the program name (except on VxWorks) with an argument to GDB (seeChapter 2 [Getting In and Out of GDB], page 11), or by using the file orexec-file command (see Section 14.1 [Commands to specify files], page 127).
If you are running your program in an execution environment that supports processes,run creates an inferior process and makes that process run your program. (In environmentswithout processes, run jumps to the start of your program.)
The execution of a program is affected by certain information it receives from its superior.GDB provides ways to specify this information, which you must do before starting your
8/14/2019 Debugging With GDB - The GNU Source-Level Debugger
http://slidepdf.com/reader/full/debugging-with-gdb-the-gnu-source-level-debugger 35/328
24 Debugging with GDB
program. (You can change it after starting your program, but such changes only affect yourprogram the next time you start it.) This information may be divided into four categories:
The arguments.
Specify the arguments to give your program as the arguments of the run com-mand. If a shell is available on your target, the shell is used to pass the argu-ments, so that you may use normal conventions (such as wildcard expansion orvariable substitution) in describing the arguments. In Unix systems, you cancontrol which shell is used with the SHELL environment variable. See Section 4.3[Your program’s arguments], page 24.
The environment.Your program normally inherits its environment from GDB, but you can use theGDB commands set environment and unset environment to change parts of
the environment that affect your program. See Section 4.4 [Your program’senvironment], page 25.
The working directory.Your program inherits its working directory from GDB. You can set the GDBworking directory with the cd command in GDB. See Section 4.5 [Your pro-gram’s working directory], page 26.
The standard input and output.Your program normally uses the same device for standard input and standardoutput as GDB is using. You can redirect input and output in the run commandline, or you can use the tty command to set a different device for your program.See Section 4.6 [Your program’s input and output], page 26.
Warning: While input and output redirection work, you cannot use pipes topass the output of the program you are debugging to another program; if youattempt this, GDB is likely to wind up debugging the wrong program.
When you issue the run command, your program begins to execute immediately. SeeChapter 5 [Stopping and continuing], page 33, for discussion of how to arrange for yourprogram to stop. Once your program has stopped, you may call functions in your program,using the print or call commands. See Chapter 8 [Examining Data], page 63.
If the modification time of your symbol file has changed since the last time GDB readits symbols, GDB discards its symbol table, and reads it again. When it does this, GDBtries to retain your current breakpoints.
4.3 Your program’s arguments
The arguments to your program can be specified by the arguments of the run command.They are passed to a shell, which expands wildcard characters and performs redirection of I/O, and thence to your program. Your SHELL environment variable (if it exists) specifies
what shell GDB uses. If you do not define SHELL, GDB uses the default shell (‘/bin/sh’on Unix).
On non-Unix systems, the program is usually invoked directly by GDB, which emulatesI/O redirection via the appropriate system calls, and the wildcard characters are expandedby the startup code of the program, not by the shell.

8/14/2019 Debugging With GDB - The GNU Source-Level Debugger
http://slidepdf.com/reader/full/debugging-with-gdb-the-gnu-source-level-debugger 36/328
Chapter 4: Running Programs Under GDB 25
run with no arguments uses the same arguments used by the previous run, or those setby the set args command.
set args Specify the arguments to be used the next time your program is run. If setargs has no arguments, run executes your program with no arguments. Onceyou have run your program with arguments, using set args before the nextrun is the only way to run it again without arguments.
show args Show the arguments to give your program when it is started.
4.4 Your program’s environment
The environment consists of a set of environment variables and their values. Environment
variables conventionally record such things as your user name, your home directory, yourterminal type, and your search path for programs to run. Usually you set up environmentvariables with the shell and they are inherited by all the other programs you run. Whendebugging, it can be useful to try running your program with a modified environmentwithout having to start GDB over again.
path directory Add directory to the front of the PATH environment variable (the search pathfor executables) that will be passed to your program. The value of PATH used
by GDB does not change. You may specify several directory names, separatedby whitespace or by a system-dependent separator character (‘:’ on Unix, ‘;’on MS-DOS and MS-Windows). If directory is already in the path, it is movedto the front, so it is searched sooner.
You can use the string ‘$cwd’ to refer to whatever is the current working di-rectory at the time GDB searches the path. If you use ‘.’ instead, it refersto the directory where you executed the path command. GDB replaces ‘.’ inthe directory argument (with the current path) before adding directory to thesearch path.
show paths Display the list of search paths for executables (the PATH environment variable).
show environment [varname ]Print the value of environment variable varname to be given to your programwhen it starts. If you do not supply varname , print the names and values of all environment variables to be given to your program. You can abbreviateenvironment as env.
set environment varname [=value ]Set environment variable varname to value . The value changes for your program
only, not for GDB itself. value may be any string; the values of environmentvariables are just strings, and any interpretation is supplied by your programitself. The value parameter is optional; if it is eliminated, the variable is set toa null value.
For example, this command:

8/14/2019 Debugging With GDB - The GNU Source-Level Debugger
http://slidepdf.com/reader/full/debugging-with-gdb-the-gnu-source-level-debugger 37/328

8/14/2019 Debugging With GDB - The GNU Source-Level Debugger
http://slidepdf.com/reader/full/debugging-with-gdb-the-gnu-source-level-debugger 38/328
Chapter 4: Running Programs Under GDB 27
the default for future run commands. It also resets the controlling terminal for the childprocess, for future run commands. For example,
tty /dev/ttyb
directs that processes started with subsequent run commands default to do input and outputon the terminal ‘/dev/ttyb’ and have that as their controlling terminal.
An explicit redirection in run overrides the tty command’s effect on the input/outputdevice, but not its effect on the controlling terminal.
When you use the tty command or redirect input in the run command, only the input for your program is affected. The input for GDB still comes from your terminal.
4.7 Debugging an already-running process
attach process-id This command attaches to a running process—one that was started outsideGDB. (info files shows your active targets.) The command takes as argumenta process ID. The usual way to find out the process-id of a Unix process is withthe ps utility, or with the ‘jobs -l’ shell command.
attach does not repeat if you press RET a second time after executing thecommand.
To use attach, your program must be running in an environment which supports pro-
cesses; for example, attach does not work for programs on bare-board targets that lack anoperating system. You must also have permission to send the process a signal.
When you use attach, the debugger finds the program running in the process first bylooking in the current working directory, then (if the program is not found) by using thesource file search path (see Section 7.3 [Specifying source directories], page 59). You canalso use the file command to load the program. See Section 14.1 [Commands to SpecifyFiles], page 127.
The first thing GDB does after arranging to debug the specified process is to stop it.You can examine and modify an attached process with all the GDB commands that are
ordinarily available when you start processes with run. You can insert breakpoints; youcan step and continue; you can modify storage. If you would rather the process continuerunning, you may use the continue command after attaching GDB to the process.
detach When you have finished debugging the attached process, you can use the detach
command to release it from GDB control. Detaching the process continues itsexecution. After the detach command, that process and GDB become com-pletely independent once more, and you are ready to attach another processor start one with run. detach does not repeat if you press RET again after
executing the command.If you exit GDB or use the run command while you have an attached process, you kill
that process. By default, GDB asks for confirmation if you try to do either of these things;you can control whether or not you need to confirm by using the set confirm command(see Section 18.6 [Optional warnings and messages], page 168).

8/14/2019 Debugging With GDB - The GNU Source-Level Debugger
http://slidepdf.com/reader/full/debugging-with-gdb-the-gnu-source-level-debugger 39/328
28 Debugging with GDB
4.8 Killing the child process
kill Kill the child process in which your program is running under GDB.
This command is useful if you wish to debug a core dump instead of a running process.GDB ignores any core dump file while your program is running.
On some operating systems, a program cannot be executed outside GDB while you havebreakpoints set on it inside GDB. You can use the kill command in this situation to permitrunning your program outside the debugger.
The kill command is also useful if you wish to recompile and relink your program,since on many systems it is impossible to modify an executable file while it is running in aprocess. In this case, when you next type run, GDB notices that the file has changed, andreads the symbol table again (while trying to preserve your current breakpoint settings).
4.9 Debugging programs with multiple threads
In some operating systems, such as HP-UX and Solaris, a single program may have morethan one thread of execution. The precise semantics of threads differ from one operatingsystem to another, but in general the threads of a single program are akin to multipleprocesses—except that they share one address space (that is, they can all examine andmodify the same variables). On the other hand, each thread has its own registers andexecution stack, and perhaps private memory.
GDB provides these facilities for debugging multi-thread programs:
• automatic notification of new threads
• ‘thread threadno ’, a command to switch among threads
• ‘info threads’, a command to inquire about existing threads
• ‘thread apply [threadno ] [all ] args ’, a command to apply a command to a list of threads
• thread-specific breakpoints
Warning: These facilities are not yet available on every GDB configurationwhere the operating system supports threads. If your GDB does not support
threads, these commands have no effect. For example, a system without threadsupport shows no output from ‘info threads’, and always rejects the threadcommand, like this:
(gdb) info threads(gdb) thread 1Thread ID 1 not known. Use the "info threads" command tosee the IDs of currently known threads.
The GDB thread debugging facility allows you to observe all threads while your programruns—but whenever GDB takes control, one thread in particular is always the focus of debugging. This thread is called the current thread . Debugging commands show program
information from the perspective of the current thread.Whenever GDB detects a new thread in your program, it displays the target system’s
identification for the thread with a message in the form ‘[New systag ]’. systag is a threadidentifier whose form varies depending on the particular system. For example, on LynxOS,you might see

8/14/2019 Debugging With GDB - The GNU Source-Level Debugger
http://slidepdf.com/reader/full/debugging-with-gdb-the-gnu-source-level-debugger 40/328
Chapter 4: Running Programs Under GDB 29
[New process 35 thread 27]
when GDB notices a new thread. In contrast, on an SGI system, the systag is simplysomething like ‘process 368’, with no further qualifier.
For debugging purposes, GDB associates its own thread number—always a singleinteger—with each thread in your program.
info threads
Display a summary of all threads currently in your program. GDB displays foreach thread (in this order):
1. the thread number assigned by GDB
2. the target system’s thread identifier (systag )
3. the current stack frame summary for that thread
An asterisk ‘*’ to the left of the GDB thread number indicates the currentthread.
For example,
(gdb) info threads3 process 35 thread 27 0x34e5 in sigpause ()2 process 35 thread 23 0x34e5 in sigpause ()
* 1 process 35 thread 13 main (argc=1, argv=0x7ffffff8)at threadtest.c:68
On HP-UX systems:
For debugging purposes, GDB associates its own thread number—a small integer as-signed in thread-creation order—with each thread in your program.
Whenever GDB detects a new thread in your program, it displays both GDB’s threadnumber and the target system’s identification for the thread with a message in the form‘[New systag ]’. systag is a thread identifier whose form varies depending on the particularsystem. For example, on HP-UX, you see
[New thread 2 (system thread 26594)]
when GDB notices a new thread.
info threads
Display a summary of all threads currently in your program. GDB displays foreach thread (in this order):
1. the thread number assigned by GDB
2. the target system’s thread identifier (systag )
3. the current stack frame summary for that thread
An asterisk ‘*’ to the left of the GDB thread number indicates the currentthread.
For example,
(gdb) info threads* 3 system thread 26607 worker (wptr=0x7b09c318 "@") \
at quicksort.c:137

8/14/2019 Debugging With GDB - The GNU Source-Level Debugger
http://slidepdf.com/reader/full/debugging-with-gdb-the-gnu-source-level-debugger 41/328
30 Debugging with GDB
2 system thread 26606 0x7b0030d8 in __ksleep () \
from /usr/lib/libc.2
1 system thread 27905 0x7b003498 in _brk () \
from /usr/lib/libc.2
thread threadno Make thread number threadno the current thread. The command argumentthreadno is the internal GDB thread number, as shown in the first field of the‘info threads’ display. GDB responds by displaying the system identifier of the thread you selected, and its current stack frame summary:
(gdb) thread 2
[Switching to process 35 thread 23]0x34e5 in sigpause ()
As with the ‘[New ...]’ message, the form of the text after ‘Switching to’depends on your system’s conventions for identifying threads.
thread apply [threadno ] [all ] args The thread apply command allows you to apply a command to one or morethreads. Specify the numbers of the threads that you want affected with thecommand argument threadno . threadno is the internal GDB thread number,as shown in the first field of the ‘info threads’ display. To apply a commandto all threads, use thread apply all args .
Whenever GDB stops your program, due to a breakpoint or a signal, it automaticallyselects the thread where that breakpoint or signal happened. GDB alerts you to the contextswitch with a message of the form ‘[Switching to systag ]’ to identify the thread.
See Section 5.4 [Stopping and starting multi-thread programs], page 50, for more infor-mation about how GDB behaves when you stop and start programs with multiple threads.
See Section 5.1.2 [Setting watchpoints], page 37, for information about watchpoints inprograms with multiple threads.
4.10 Debugging programs with multiple processes
On most systems, GDB has no special support for debugging programs which createadditional processes using the fork function. When a program forks, GDB will continueto debug the parent process and the child process will run unimpeded. If you have set abreakpoint in any code which the child then executes, the child will get a SIGTRAP signalwhich (unless it catches the signal) will cause it to terminate.
However, if you want to debug the child process there is a workaround which isn’t too
painful. Put a call to sleep in the code which the child process executes after the fork. Itmay be useful to sleep only if a certain environment variable is set, or a certain file exists,so that the delay need not occur when you don’t want to run GDB on the child. While thechild is sleeping, use the ps program to get its process ID. Then tell GDB (a new invocationof GDB if you are also debugging the parent process) to attach to the child process (see
8/14/2019 Debugging With GDB - The GNU Source-Level Debugger
http://slidepdf.com/reader/full/debugging-with-gdb-the-gnu-source-level-debugger 42/328
Chapter 4: Running Programs Under GDB 31
Section 4.7 [Attach], page 27). From that point on you can debug the child process just likeany other process which you attached to.
On HP-UX (11.x and later only?), GDB provides support for debugging programs that
create additional processes using the fork or vfork function.By default, when a program forks, GDB will continue to debug the parent process and
the child process will run unimpeded.
If you want to follow the child process instead of the parent process, use the commandset follow-fork-mode.
set follow-fork-mode mode Set the debugger response to a program call of fork or vfork. A call to fork
or vfork creates a new process. The mode can be:
parent The original process is debugged after a fork. The child processruns unimpeded. This is the default.
child The new process is debugged after a fork. The parent process runsunimpeded.
ask The debugger will ask for one of the above choices.
show follow-fork-mode
Display the current debugger response to a fork or vfork call.
If you ask to debug a child process and a vfork is followed by an exec, GDB executesthe new target up to the first breakpoint in the new target. If you have a breakpoint set on main in your original program, the breakpoint will also be set on the child process’s main.
When a child process is spawned by vfork, you cannot debug the child or parent untilan exec call completes.
If you issue a run command to GDB after an exec call executes, the new target restarts.To restart the parent process, use the file command with the parent executable name asits argument.
You can use the catch command to make GDB stop whenever a fork, vfork, or exec
call is made. See Section 5.1.3 [Setting catchpoints], page 39.

8/14/2019 Debugging With GDB - The GNU Source-Level Debugger
http://slidepdf.com/reader/full/debugging-with-gdb-the-gnu-source-level-debugger 43/328
32 Debugging with GDB

8/14/2019 Debugging With GDB - The GNU Source-Level Debugger
http://slidepdf.com/reader/full/debugging-with-gdb-the-gnu-source-level-debugger 44/328
8/14/2019 Debugging With GDB - The GNU Source-Level Debugger
http://slidepdf.com/reader/full/debugging-with-gdb-the-gnu-source-level-debugger 45/328
34 Debugging with GDB
Some GDB commands accept a range of breakpoints on which to operate. A breakpointrange is either a single breakpoint number, like ‘5’, or two such numbers, in increasingorder, separated by a hyphen, like ‘5-7’. When a breakpoint range is given to a command,
all breakpoint in that range are operated on.
5.1.1 Setting breakpoints
Breakpoints are set with the break command (abbreviated b). The debugger conve-nience variable ‘$bpnum’ records the number of the breakpoint you’ve set most recently;see Section 8.9 [Convenience variables], page 76, for a discussion of what you can do withconvenience variables.
You have several ways to say where the breakpoint should go.
break functionSet a breakpoint at entry to function function. When using source languagesthat permit overloading of symbols, such as C++, function may refer to morethan one possible place to break. See Section 5.1.8 [Breakpoint menus], page 44,for a discussion of that situation.
break +offsetbreak -offset
Set a breakpoint some number of lines forward or back from the position atwhich execution stopped in the currently selected stack frame . (See Section 6.1
[Frames], page 53, for a description of stack frames.)
break linenumSet a breakpoint at line linenum in the current source file. The current sourcefile is the last file whose source text was printed. The breakpoint will stop yourprogram just before it executes any of the code on that line.
break filename :linenumSet a breakpoint at line linenum in source file filename .
break filename :function
Set a breakpoint at entry to function function found in file filename . Specifyinga file name as well as a function name is superfluous except when multiple filescontain similarly named functions.
break *address Set a breakpoint at address address . You can use this to set breakpoints inparts of your program which do not have debugging information or source files.
break When called without any arguments, break sets a breakpoint at the next in-struction to be executed in the selected stack frame (see Chapter 6 [Examiningthe Stack], page 53). In any selected frame but the innermost, this makes your
program stop as soon as control returns to that frame. This is similar to theeffect of a finish command in the frame inside the selected frame—except thatfinish does not leave an active breakpoint. If you use break without an argu-ment in the innermost frame, GDB stops the next time it reaches the currentlocation; this may be useful inside loops.

8/14/2019 Debugging With GDB - The GNU Source-Level Debugger
http://slidepdf.com/reader/full/debugging-with-gdb-the-gnu-source-level-debugger 46/328
Chapter 5: Stopping and Continuing 35
GDB normally ignores breakpoints when it resumes execution, until at least oneinstruction has been executed. If it did not do this, you would be unable to pro-ceed past a breakpoint without first disabling the breakpoint. This rule applies
whether or not the breakpoint already existed when your program stopped.break ... if cond
Set a breakpoint with condition cond ; evaluate the expression cond each timethe breakpoint is reached, and stop only if the value is nonzero—that is, if cond evaluates as true. ‘...’ stands for one of the possible arguments describedabove (or no argument) specifying where to break. See Section 5.1.6 [Breakconditions], page 42, for more information on breakpoint conditions.
tbreak args Set a breakpoint enabled only for one stop. args are the same as for the break
command, and the breakpoint is set in the same way, but the breakpoint isautomatically deleted after the first time your program stops there. See Sec-tion 5.1.5 [Disabling breakpoints], page 41.
hbreak args Set a hardware-assisted breakpoint. args are the same as for the break com-mand and the breakpoint is set in the same way, but the breakpoint requireshardware support and some target hardware may not have this support. Themain purpose of this is EPROM/ROM code debugging, so you can set a break-point at an instruction without changing the instruction. This can be used
with the new trap-generation provided by SPARClite DSU and some x86-basedtargets. These targets will generate traps when a program accesses some dataor instruction address that is assigned to the debug registers. However thehardware breakpoint registers can take a limited number of breakpoints. Forexample, on the DSU, only two data breakpoints can be set at a time, and GDBwill reject this command if more than two are used. Delete or disable unusedhardware breakpoints before setting new ones (see Section 5.1.5 [Disabling],page 41). See Section 5.1.6 [Break conditions], page 42.
thbreak args Set a hardware-assisted breakpoint enabled only for one stop. args are thesame as for the hbreak command and the breakpoint is set in the same way.However, like the tbreak command, the breakpoint is automatically deletedafter the first time your program stops there. Also, like the hbreak command,the breakpoint requires hardware support and some target hardware may nothave this support. See Section 5.1.5 [Disabling breakpoints], page 41. See alsoSection 5.1.6 [Break conditions], page 42.
rbreak regex Set breakpoints on all functions matching the regular expression regex . Thiscommand sets an unconditional breakpoint on all matches, printing a list of all
breakpoints it set. Once these breakpoints are set, they are treated just like thebreakpoints set with the break command. You can delete them, disable them,or make them conditional the same way as any other breakpoint.
The syntax of the regular expression is the standard one used with tools like‘grep’. Note that this is different from the syntax used by shells, so for instance
8/14/2019 Debugging With GDB - The GNU Source-Level Debugger
http://slidepdf.com/reader/full/debugging-with-gdb-the-gnu-source-level-debugger 47/328
36 Debugging with GDB
foo* matches all functions that include an fo followed by zero or more os. Thereis an implicit .* leading and trailing the regular expression you supply, so tomatch only functions that begin with foo, use ^foo.
When debugging C++ programs, rbreak is useful for setting breakpoints onoverloaded functions that are not members of any special classes.
info breakpoints [n]info break [n]info watchpoints [n]
Print a table of all breakpoints, watchpoints, and catchpoints set and notdeleted, with the following columns for each breakpoint:
Breakpoint Numbers
Type Breakpoint, watchpoint, or catchpoint.Disposition
Whether the breakpoint is marked to be disabled or deleted whenhit.
Enabled or Disabled Enabled breakpoints are marked with ‘y’. ‘n’ marks breakpointsthat are not enabled.
Address Where the breakpoint is in your program, as a memory address.
What Where the breakpoint is in the source for your program, as a fileand line number.
If a breakpoint is conditional, info break shows the condition on the line fol-lowing the affected breakpoint; breakpoint commands, if any, are listed afterthat.
info break with a breakpoint number n as argument lists only that break-point. The convenience variable $_ and the default examining-address for thex command are set to the address of the last breakpoint listed (see Section 8.5
[Examining memory], page 67).info break displays a count of the number of times the breakpoint has beenhit. This is especially useful in conjunction with the ignore command. Youcan ignore a large number of breakpoint hits, look at the breakpoint info to seehow many times the breakpoint was hit, and then run again, ignoring one lessthan that number. This will get you quickly to the last hit of that breakpoint.
GDB allows you to set any number of breakpoints at the same place in your program.There is nothing silly or meaningless about this. When the breakpoints are conditional,this is even useful (see Section 5.1.6 [Break conditions], page 42).
GDB itself sometimes sets breakpoints in your program for special purposes, such asproper handling of longjmp (in C programs). These internal breakpoints are assignednegative numbers, starting with -1; ‘info breakpoints’ does not display them. You cansee these breakpoints with the GDB maintenance command ‘ maint info breakpoints’ (see[maint info breakpoints], page 279).

8/14/2019 Debugging With GDB - The GNU Source-Level Debugger
http://slidepdf.com/reader/full/debugging-with-gdb-the-gnu-source-level-debugger 48/328

8/14/2019 Debugging With GDB - The GNU Source-Level Debugger
http://slidepdf.com/reader/full/debugging-with-gdb-the-gnu-source-level-debugger 49/328
38 Debugging with GDB
floating-point number (which is typically 8 bytes wide). As a work-around, it might be pos-sible to break the large region into a series of smaller ones and watch them with separatewatchpoints.
If you set too many hardware watchpoints, GDB might be unable to insert all of themwhen you resume the execution of your program. Since the precise number of active watch-points is unknown until such time as the program is about to be resumed, GDB might notbe able to warn you about this when you set the watchpoints, and the warning will beprinted only when the program is resumed:
Hardware watchpoint num: Could not insert watchpoint
If this happens, delete or disable some of the watchpoints.
The SPARClite DSU will generate traps when a program accesses some data or instruc-tion address that is assigned to the debug registers. For the data addresses, DSU facilitatesthe watch command. However the hardware breakpoint registers can only take two datawatchpoints, and both watchpoints must be the same kind. For example, you can set twowatchpoints with watch commands, two with rwatch commands, or two with awatch com-mands, but you cannot set one watchpoint with one command and the other with a differentcommand. GDB will reject the command if you try to mix watchpoints. Delete or disableunused watchpoint commands before setting new ones.
If you call a function interactively using print or call, any watchpoints you have set
will be inactive until GDB reaches another kind of breakpoint or the call completes.
GDB automatically deletes watchpoints that watch local (automatic) variables, or ex-pressions that involve such variables, when they go out of scope, that is, when the executionleaves the block in which these variables were defined. In particular, when the program be-ing debugged terminates, all local variables go out of scope, and so only watchpoints thatwatch global variables remain set. If you rerun the program, you will need to set all suchwatchpoints again. One way of doing that would be to set a code breakpoint at the entryto the main function and when it breaks, set all the watchpoints.
Warning: In multi-thread programs, watchpoints have only limited usefulness.With the current watchpoint implementation, GDB can only watch the valueof an expression in a single thread . If you are confident that the expression canonly change due to the current thread’s activity (and if you are also confidentthat no other thread can become current), then you can use watchpoints asusual. However, GDB may not notice when a non-current thread’s activitychanges the expression.
HP-UX Warning: In multi-thread programs, software watchpoints have onlylimited usefulness. If GDB creates a software watchpoint, it can only watch
the value of an expression in a single thread . If you are confident that theexpression can only change due to the current thread’s activity (and if youare also confident that no other thread can become current), then you can usesoftware watchpoints as usual. However, GDB may not notice when a non-current thread’s activity changes the expression. (Hardware watchpoints, incontrast, watch an expression in all threads.)

8/14/2019 Debugging With GDB - The GNU Source-Level Debugger
http://slidepdf.com/reader/full/debugging-with-gdb-the-gnu-source-level-debugger 50/328
Chapter 5: Stopping and Continuing 39
5.1.3 Setting catchpoints
You can use catchpoints to cause the debugger to stop for certain kinds of program
events, such as C++ exceptions or the loading of a shared library. Use the catch commandto set a catchpoint.
catch eventStop when event occurs. event can be any of the following:
throw The throwing of a C++ exception.
catch The catching of a C++ exception.
exec A call to exec. This is currently only available for HP-UX.
fork A call to fork. This is currently only available for HP-UX.
vfork A call to vfork. This is currently only available for HP-UX.
load
load libname The dynamic loading of any shared library, or the loading of thelibrary libname . This is currently only available for HP-UX.
unload
unload libname
The unloading of any dynamically loaded shared library, or theunloading of the library libname . This is currently only availablefor HP-UX.
tcatch eventSet a catchpoint that is enabled only for one stop. The catchpoint is automat-ically deleted after the first time the event is caught.
Use the info break command to list the current catchpoints.
There are currently some limitations to C++ exception handling (catch throw and catch
catch) in GDB:
• If you call a function interactively, GDB normally returns control to you when thefunction has finished executing. If the call raises an exception, however, the call maybypass the mechanism that returns control to you and cause your program either toabort or to simply continue running until it hits a breakpoint, catches a signal thatGDB is listening for, or exits. This is the case even if you set a catchpoint for theexception; catchpoints on exceptions are disabled within interactive calls.
• You cannot raise an exception interactively.
• You cannot install an exception handler interactively.
Sometimes catch is not the best way to debug exception handling: if you need to knowexactly where an exception is raised, it is better to stop before the exception handler iscalled, since that way you can see the stack before any unwinding takes place. If you seta breakpoint in an exception handler instead, it may not be easy to find out where theexception was raised.

8/14/2019 Debugging With GDB - The GNU Source-Level Debugger
http://slidepdf.com/reader/full/debugging-with-gdb-the-gnu-source-level-debugger 51/328
40 Debugging with GDB
To stop just before an exception handler is called, you need some knowledge of theimplementation. In the case of gnu C++, exceptions are raised by calling a library functionnamed __raise_exception which has the following ANSI C interface:
/* addr is where the exception identifier is stored.id is the exception identifier. */
void __raise_exception (void **addr, void *id);
To make the debugger catch all exceptions before any stack unwinding takes place, set abreakpoint on __raise_exception (see Section 5.1 [Breakpoints; watchpoints; and excep-tions], page 33).
With a conditional breakpoint (see Section 5.1.6 [Break conditions], page 42) that de-pends on the value of id , you can stop your program when a specific exception is raised.
You can use multiple conditional breakpoints to stop your program when any of a numberof exceptions are raised.
5.1.4 Deleting breakpoints
It is often necessary to eliminate a breakpoint, watchpoint, or catchpoint once it hasdone its job and you no longer want your program to stop there. This is called deleting thebreakpoint. A breakpoint that has been deleted no longer exists; it is forgotten.
With the clear command you can delete breakpoints according to where they are in your
program. With the delete command you can delete individual breakpoints, watchpoints,or catchpoints by specifying their breakpoint numbers.
It is not necessary to delete a breakpoint to proceed past it. GDB automatically ignoresbreakpoints on the first instruction to be executed when you continue execution withoutchanging the execution address.
clear Delete any breakpoints at the next instruction to be executed in the selectedstack frame (see Section 6.3 [Selecting a frame], page 55). When the innermost
frame is selected, this is a good way to delete a breakpoint where your program just stopped.
clear functionclear filename :function
Delete any breakpoints set at entry to the function function.
clear linenumclear filename :linenum
Delete any breakpoints set at or within the code of the specified line.
delete [breakpoints] [range ...]Delete the breakpoints, watchpoints, or catchpoints of the breakpoint rangesspecified as arguments. If no argument is specified, delete all breakpoints (GDBasks confirmation, unless you have set confirm off). You can abbreviate thiscommand as d.

8/14/2019 Debugging With GDB - The GNU Source-Level Debugger
http://slidepdf.com/reader/full/debugging-with-gdb-the-gnu-source-level-debugger 52/328
8/14/2019 Debugging With GDB - The GNU Source-Level Debugger
http://slidepdf.com/reader/full/debugging-with-gdb-the-gnu-source-level-debugger 53/328
42 Debugging with GDB
5.1.6 Break conditions
The simplest sort of breakpoint breaks every time your program reaches a specified place.
You can also specify a condition for a breakpoint. A condition is just a Boolean expressionin your programming language (see Section 8.1 [Expressions], page 63). A breakpoint witha condition evaluates the expression each time your program reaches it, and your programstops only if the condition is true .
This is the converse of using assertions for program validation; in that situation, youwant to stop when the assertion is violated—that is, when the condition is false. In C, if you want to test an assertion expressed by the condition assert, you should set the condition‘! assert’ on the appropriate breakpoint.
Conditions are also accepted for watchpoints; you may not need them, since a watchpointis inspecting the value of an expression anyhow—but it might be simpler, say, to just set awatchpoint on a variable name, and specify a condition that tests whether the new value isan interesting one.
Break conditions can have side effects, and may even call functions in your program.This can be useful, for example, to activate functions that log program progress, or touse your own print functions to format special data structures. The effects are completelypredictable unless there is another enabled breakpoint at the same address. (In that case,GDB might see the other breakpoint first and stop your program without checking thecondition of this one.) Note that breakpoint commands are usually more convenient andflexible than break conditions for the purpose of performing side effects when a breakpoint
is reached (see Section 5.1.7 [Breakpoint command lists], page 43).
Break conditions can be specified when a breakpoint is set, by using ‘if’ in the argumentsto the break command. See Section 5.1.1 [Setting breakpoints], page 34. They can also bechanged at any time with the condition command.
You can also use the if keyword with the watch command. The catch command doesnot recognize the if keyword; condition is the only way to impose a further condition ona catchpoint.
condition bnum expression
Specify expression as the break condition for breakpoint, watchpoint, or catch-point number bnum. After you set a condition, breakpoint bnum stops yourprogram only if the value of expression is true (nonzero, in C). When youuse condition, GDB checks expression immediately for syntactic correctness,and to determine whether symbols in it have referents in the context of yourbreakpoint. If expression uses symbols not referenced in the context of thebreakpoint, GDB prints an error message:
No symbol "foo" in current context.
GDB does not actually evaluate expression at the time the condition command
(or a command that sets a breakpoint with a condition, like break if ...) isgiven, however. See Section 8.1 [Expressions], page 63.
condition bnumRemove the condition from breakpoint number bnum. It becomes an ordinaryunconditional breakpoint.

8/14/2019 Debugging With GDB - The GNU Source-Level Debugger
http://slidepdf.com/reader/full/debugging-with-gdb-the-gnu-source-level-debugger 54/328
Chapter 5: Stopping and Continuing 43
A special case of a breakpoint condition is to stop only when the breakpoint has beenreached a certain number of times. This is so useful that there is a special way to do it,using the ignore count of the breakpoint. Every breakpoint has an ignore count, which is
an integer. Most of the time, the ignore count is zero, and therefore has no effect. But if your program reaches a breakpoint whose ignore count is positive, then instead of stopping,it just decrements the ignore count by one and continues. As a result, if the ignore countvalue is n, the breakpoint does not stop the next n times your program reaches it.
ignore bnum countSet the ignore count of breakpoint number bnum to count. The next counttimes the breakpoint is reached, your program’s execution does not stop; otherthan to decrement the ignore count, GDB takes no action.
To make the breakpoint stop the next time it is reached, specify a count of zero.
When you use continue to resume execution of your program from a break-point, you can specify an ignore count directly as an argument to continue,rather than using ignore. See Section 5.2 [Continuing and stepping], page 45.
If a breakpoint has a positive ignore count and a condition, the condition isnot checked. Once the ignore count reaches zero, GDB resumes checking thecondition.
You could achieve the effect of the ignore count with a condition such as‘$foo-- <= 0’ using a debugger convenience variable that is decremented eachtime. See Section 8.9 [Convenience variables], page 76.
Ignore counts apply to breakpoints, watchpoints, and catchpoints.
5.1.7 Breakpoint command lists
You can give any breakpoint (or watchpoint or catchpoint) a series of commands toexecute when your program stops due to that breakpoint. For example, you might want toprint the values of certain expressions, or enable other breakpoints.
commands [bnum]
... command-list ...end Specify a list of commands for breakpoint number bnum. The commands them-selves appear on the following lines. Type a line containing just end to terminatethe commands.
To remove all commands from a breakpoint, type commands and follow it im-mediately with end; that is, give no commands.
With no bnum argument, commands refers to the last breakpoint, watchpoint,or catchpoint set (not to the breakpoint most recently encountered).
Pressing RET as a means of repeating the last GDB command is disabled within a
command-list.You can use breakpoint commands to start your program up again. Simply use the
continue command, or step, or any other command that resumes execution.
Any other commands in the command list, after a command that resumes execution, areignored. This is because any time you resume execution (even with a simple next or step),

8/14/2019 Debugging With GDB - The GNU Source-Level Debugger
http://slidepdf.com/reader/full/debugging-with-gdb-the-gnu-source-level-debugger 55/328
44 Debugging with GDB
you may encounter another breakpoint—which could have its own command list, leadingto ambiguities about which list to execute.
If the first command you specify in a command list is silent, the usual message about
stopping at a breakpoint is not printed. This may be desirable for breakpoints that areto print a specific message and then continue. If none of the remaining commands printanything, you see no sign that the breakpoint was reached. silent is meaningful only atthe beginning of a breakpoint command list.
The commands echo, output, and printf allow you to print precisely controlled output,and are often useful in silent breakpoints. See Section 19.4 [Commands for controlledoutput], page 174.
For example, here is how you could use breakpoint commands to print the value of x atentry to foo whenever x is positive.
break foo if x>0commandssilentprintf "x is %d\n",xcontend
One application for breakpoint commands is to compensate for one bug so you can testfor another. Put a breakpoint just after the erroneous line of code, give it a conditionto detect the case in which something erroneous has been done, and give it commands to
assign correct values to any variables that need them. End with the continue command sothat your program does not stop, and start with the silent command so that no outputis produced. Here is an example:
break 403commandssilents e t x = y + 4contend
5.1.8 Breakpoint menus
Some programming languages (notably C++) permit a single function name to be de-fined several times, for application in different contexts. This is called overloading . Whena function name is overloaded, ‘break function’ is not enough to tell GDB where you wanta breakpoint. If you realize this is a problem, you can use something like ‘break func-tion(types )’ to specify which particular version of the function you want. Otherwise, GDBoffers you a menu of numbered choices for different possible breakpoints, and waits for yourselection with the prompt ‘>’. The first two options are always ‘[0] cancel’ and ‘[1] all’.
Typing 1 sets a breakpoint at each definition of function, and typing 0 aborts the breakcommand without setting any new breakpoints.
For example, the following session excerpt shows an attempt to set a breakpoint at theoverloaded symbol String::after. We choose three particular definitions of that functionname:
8/14/2019 Debugging With GDB - The GNU Source-Level Debugger
http://slidepdf.com/reader/full/debugging-with-gdb-the-gnu-source-level-debugger 56/328
Chapter 5: Stopping and Continuing 45
(gdb) b String::after[0] cancel[1] all
[2] file:String.cc; line number:867[3] file:String.cc; line number:860[4] file:String.cc; line number:875[5] file:String.cc; line number:853[6] file:String.cc; line number:846[7] file:String.cc; line number:735> 2 4 6Breakpoint 1 at 0xb26c: file String.cc, line 867.Breakpoint 2 at 0xb344: file String.cc, line 875.Breakpoint 3 at 0xafcc: file String.cc, line 846.Multiple breakpoints were set.Use the "delete" command to delete unwanted
breakpoints.(gdb)
5.1.9 “Cannot insert breakpoints”
Under some operating systems, breakpoints cannot be used in a program if any otherprocess is running that program. In this situation, attempting to run or continue a programwith a breakpoint causes GDB to print an error message:
Cannot insert breakpoints.The same program may be running in another process.
When this happens, you have three ways to proceed:
1. Remove or disable the breakpoints, then continue.
2. Suspend GDB, and copy the file containing your program to a new name. ResumeGDB and use the exec-file command to specify that GDB should run your programunder that name. Then start your program again.
3. Relink your program so that the text segment is nonsharable, using the linker option‘-N’. The operating system limitation may not apply to nonsharable executables.
A similar message can be printed if you request too many active hardware-assistedbreakpoints and watchpoints:
Stopped; cannot insert breakpoints.You may have requested too many hardware breakpoints and watchpoints.
This message is printed when you attempt to resume the program, since only then GDBknows exactly how many hardware breakpoints and watchpoints it needs to insert.
When this message is printed, you need to disable or remove some of the hardware-assisted breakpoints and watchpoints, and then continue.
5.2 Continuing and stepping
Continuing means resuming program execution until your program completes normally.In contrast, stepping means executing just one more “step” of your program, where “step”may mean either one line of source code, or one machine instruction (depending on what
8/14/2019 Debugging With GDB - The GNU Source-Level Debugger
http://slidepdf.com/reader/full/debugging-with-gdb-the-gnu-source-level-debugger 57/328
46 Debugging with GDB
particular command you use). Either when continuing or when stepping, your program maystop even sooner, due to a breakpoint or a signal. (If it stops due to a signal, you may wantto use handle, or use ‘signal 0’ to resume execution. See Section 5.3 [Signals], page 48.)
continue [ignore-count]c [ignore-count]fg [ignore-count]
Resume program execution, at the address where your program last stopped;any breakpoints set at that address are bypassed. The optional argumentignore-count allows you to specify a further number of times to ignore a break-point at this location; its effect is like that of ignore (see Section 5.1.6 [Breakconditions], page 42).
The argument ignore-count is meaningful only when your program stopped dueto a breakpoint. At other times, the argument to continue is ignored.
The synonyms c and fg (for foreground , as the debugged program is deemedto be the foreground program) are provided purely for convenience, and haveexactly the same behavior as continue.
To resume execution at a different place, you can use return (see Section 13.4 [Returningfrom a function], page 125) to go back to the calling function; or jump (see Section 13.2[Continuing at a different address], page 124) to go to an arbitrary location in your program.
A typical technique for using stepping is to set a breakpoint (see Section 5.1 [Breakpoints;watchpoints; and catchpoints], page 33) at the beginning of the function or the sectionof your program where a problem is believed to lie, run your program until it stops atthat breakpoint, and then step through the suspect area, examining the variables that areinteresting, until you see the problem happen.
step Continue running your program until control reaches a different source line,then stop it and return control to GDB. This command is abbreviated s.
Warning: If you use the step command while control is within
a function that was compiled without debugging information, ex-ecution proceeds until control reaches a function that does havedebugging information. Likewise, it will not step into a functionwhich is compiled without debugging information. To step throughfunctions without debugging information, use the stepi command,described below.
The step command only stops at the first instruction of a source line. This pre-vents the multiple stops that could otherwise occur in switch statements, for
loops, etc. step continues to stop if a function that has debugging informationis called within the line. In other words, step steps inside any functions called
within the line.Also, the step command only enters a function if there is line number infor-mation for the function. Otherwise it acts like the next command. This avoidsproblems when using cc -gl on MIPS machines. Previously, step entered sub-routines if there was any debugging information about the routine.
8/14/2019 Debugging With GDB - The GNU Source-Level Debugger
http://slidepdf.com/reader/full/debugging-with-gdb-the-gnu-source-level-debugger 58/328
Chapter 5: Stopping and Continuing 47
step countContinue running as in step, but do so count times. If a breakpoint is reached,or a signal not related to stepping occurs before count steps, stepping stops
right away.next [count]
Continue to the next source line in the current (innermost) stack frame. Thisis similar to step, but function calls that appear within the line of code areexecuted without stopping. Execution stops when control reaches a differentline of code at the original stack level that was executing when you gave thenext command. This command is abbreviated n.
An argument count is a repeat count, as for step.
The next command only stops at the first instruction of a source line. This
prevents multiple stops that could otherwise occur in switch statements, forloops, etc.
set step-mode
set step-mode on
The set step-mode on command causes the step command to stop at the firstinstruction of a function which contains no debug line information rather thanstepping over it.
This is useful in cases where you may be interested in inspecting the machineinstructions of a function which has no symbolic info and do not want GDB to
automatically skip over this function.set step-mode off
Causes the step command to step over any functions which contains no debuginformation. This is the default.
finish Continue running until just after function in the selected stack frame returns.Print the returned value (if any).
Contrast this with the return command (see Section 13.4 [Returning from afunction], page 125).
until
u Continue running until a source line past the current line, in the current stackframe, is reached. This command is used to avoid single stepping through a loopmore than once. It is like the next command, except that when until encoun-ters a jump, it automatically continues execution until the program counter isgreater than the address of the jump.
This means that when you reach the end of a loop after single stepping thoughit, until makes your program continue execution until it exits the loop. In con-trast, a next command at the end of a loop simply steps back to the beginningof the loop, which forces you to step through the next iteration.
until always stops your program if it attempts to exit the current stack frame.until may produce somewhat counterintuitive results if the order of machinecode does not match the order of the source lines. For example, in the followingexcerpt from a debugging session, the f (frame) command shows that executionis stopped at line 206; yet when we use until, we get to line 195:
8/14/2019 Debugging With GDB - The GNU Source-Level Debugger
http://slidepdf.com/reader/full/debugging-with-gdb-the-gnu-source-level-debugger 59/328
48 Debugging with GDB
(gdb) f#0 main (argc=4, argv=0xf7fffae8) at m4.c:206206 expand_input();
(gdb) until195 for ( ; argc > 0; NEXTARG) {
This happened because, for execution efficiency, the compiler had generatedcode for the loop closure test at the end, rather than the start, of the loop—even though the test in a C for-loop is written before the body of the loop.The until command appeared to step back to the beginning of the loop whenit advanced to this expression; however, it has not really gone to an earlierstatement—not in terms of the actual machine code.
until with no argument works by means of single instruction stepping, andhence is slower than until with an argument.
until locationu location Continue running your program until either the specified location is reached,
or the current stack frame returns. location is any of the forms of argumentacceptable to break (see Section 5.1.1 [Setting breakpoints], page 34). This formof the command uses breakpoints, and hence is quicker than until without anargument.
stepi
stepi arg
si Execute one machine instruction, then stop and return to the debugger.It is often useful to do ‘display/i $pc’ when stepping by machine instructions.This makes GDB automatically display the next instruction to be executed,each time your program stops. See Section 8.6 [Automatic display], page 68.
An argument is a repeat count, as in step.
nexti
nexti arg ni Execute one machine instruction, but if it is a function call, proceed until the
function returns.
An argument is a repeat count, as in next.
5.3 Signals
A signal is an asynchronous event that can happen in a program. The operating systemdefines the possible kinds of signals, and gives each kind a name and a number. For example,in Unix SIGINT is the signal a program gets when you type an interrupt character (often C-
c); SIGSEGV is the signal a program gets from referencing a place in memory far away fromall the areas in use; SIGALRM occurs when the alarm clock timer goes off (which happensonly if your program has requested an alarm).
Some signals, including SIGALRM, are a normal part of the functioning of your program.Others, such as SIGSEGV, indicate errors; these signals are fatal (they kill your programimmediately) if the program has not specified in advance some other way to handle thesignal. SIGINT does not indicate an error in your program, but it is normally fatal so it cancarry out the purpose of the interrupt: to kill the program.

8/14/2019 Debugging With GDB - The GNU Source-Level Debugger
http://slidepdf.com/reader/full/debugging-with-gdb-the-gnu-source-level-debugger 60/328
Chapter 5: Stopping and Continuing 49
GDB has the ability to detect any occurrence of a signal in your program. You can tellGDB in advance what to do for each kind of signal.
Normally, GDB is set up to let the non-erroneous signals like SIGALRM be silently passed
to your program (so as not to interfere with their role in the program’s functioning) but tostop your program immediately whenever an error signal happens. You can change thesesettings with the handle command.
info signals
info handle
Print a table of all the kinds of signals and how GDB has been told to handleeach one. You can use this to see the signal numbers of all the defined types of signals.
info handle is an alias for info signals.handle signal keywords ...
Change the way GDB handles signal signal . signal can be the number of a signalor its name (with or without the ‘SIG’ at the beginning); a list of signal numbersof the form ‘low -high’; or the word ‘all’, meaning all the known signals. Thekeywords say what change to make.
The keywords allowed by the handle command can be abbreviated. Their full namesare:
nostop GDB should not stop your program when this signal happens. It may still printa message telling you that the signal has come in.
stop GDB should stop your program when this signal happens. This implies theprint keyword as well.
print GDB should print a message when this signal happens.
noprint GDB should not mention the occurrence of the signal at all. This implies thenostop keyword as well.
pass
noignore GDB should allow your program to see this signal; your program can handlethe signal, or else it may terminate if the signal is fatal and not handled. pass
and noignore are synonyms.
nopass
ignore GDB should not allow your program to see this signal. nopass and ignore aresynonyms.
When a signal stops your program, the signal is not visible to the program until youcontinue. Your program sees the signal then, if pass is in effect for the signal in questionat that time . In other words, after GDB reports a signal, you can use the handle command
with pass or nopass to control whether your program sees that signal when you continue.The default is set to nostop, noprint, pass for non-erroneous signals such as SIGALRM,
SIGWINCH and SIGCHLD, and to stop, print, pass for the erroneous signals.
You can also use the signal command to prevent your program from seeing a signal, orcause it to see a signal it normally would not see, or to give it any signal at any time. For
8/14/2019 Debugging With GDB - The GNU Source-Level Debugger
http://slidepdf.com/reader/full/debugging-with-gdb-the-gnu-source-level-debugger 61/328
50 Debugging with GDB
example, if your program stopped due to some sort of memory reference error, you mightstore correct values into the erroneous variables and continue, hoping to see more execution;but your program would probably terminate immediately as a result of the fatal signal once
it saw the signal. To prevent this, you can continue with ‘signal 0’. See Section 13.3[Giving your program a signal], page 125.
5.4 Stopping and starting multi-thread programs
When your program has multiple threads (see Section 4.9 [Debugging programs withmultiple threads], page 28), you can choose whether to set breakpoints on all threads, oron a particular thread.
break linespec thread threadno
break linespec thread threadno if ...linespec specifies source lines; there are several ways of writing them, but theeffect is always to specify some source line.
Use the qualifier ‘thread threadno ’ with a breakpoint command to specify thatyou only want GDB to stop the program when a particular thread reaches thisbreakpoint. threadno is one of the numeric thread identifiers assigned by GDB,shown in the first column of the ‘info threads’ display.
If you do not specify ‘thread threadno ’ when you set a breakpoint, the break-point applies to all threads of your program.
You can use the thread qualifier on conditional breakpoints as well; in thiscase, place ‘thread threadno ’ before the breakpoint condition, like this:
(gdb) break frik.c:13 thread 28 if bartab > lim
Whenever your program stops under GDB for any reason, all threads of execution stop,not just the current thread. This allows you to examine the overall state of the program,including switching between threads, without worrying that things may change underfoot.
Conversely, whenever you restart the program, all threads start executing. This is true even when single-stepping with commands like step or next.
In particular, GDB cannot single-step all threads in lockstep. Since thread schedulingis up to your debugging target’s operating system (not controlled by GDB), other threadsmay execute more than one statement while the current thread completes a single step.Moreover, in general other threads stop in the middle of a statement, rather than at a cleanstatement boundary, when the program stops.
You might even find your program stopped in another thread after continuing or evensingle-stepping. This happens whenever some other thread runs into a breakpoint, a signal,or an exception before the first thread completes whatever you requested.
On some OSes, you can lock the OS scheduler and thus allow only a single thread to
run.set scheduler-locking mode
Set the scheduler locking mode. If it is off, then there is no locking and anythread may run at any time. If on, then only the current thread may runwhen the inferior is resumed. The step mode optimizes for single-stepping.
8/14/2019 Debugging With GDB - The GNU Source-Level Debugger
http://slidepdf.com/reader/full/debugging-with-gdb-the-gnu-source-level-debugger 62/328
Chapter 5: Stopping and Continuing 51
It stops other threads from “seizing the prompt” by preempting the currentthread while you are stepping. Other threads will only rarely (or never) get achance to run when you step. They are more likely to run when you ‘next’ over
a function call, and they are completely free to run when you use commandslike ‘continue’, ‘until’, or ‘finish’. However, unless another thread hits abreakpoint during its timeslice, they will never steal the GDB prompt awayfrom the thread that you are debugging.
show scheduler-locking
Display the current scheduler locking mode.

8/14/2019 Debugging With GDB - The GNU Source-Level Debugger
http://slidepdf.com/reader/full/debugging-with-gdb-the-gnu-source-level-debugger 63/328
52 Debugging with GDB
8/14/2019 Debugging With GDB - The GNU Source-Level Debugger
http://slidepdf.com/reader/full/debugging-with-gdb-the-gnu-source-level-debugger 64/328
Chapter 6: Examining the Stack 53
6 Examining the Stack
When your program has stopped, the first thing you need to know is where it stopped
and how it got there.Each time your program performs a function call, information about the call is generated.
That information includes the location of the call in your program, the arguments of thecall, and the local variables of the function being called. The information is saved in a blockof data called a stack frame . The stack frames are allocated in a region of memory calledthe call stack .
When your program stops, the GDB commands for examining the stack allow you tosee all of this information.
One of the stack frames is selected by GDB and many GDB commands refer implicitly
to the selected frame. In particular, whenever you ask GDB for the value of a variable inyour program, the value is found in the selected frame. There are special GDB commandsto select whichever frame you are interested in. See Section 6.3 [Selecting a frame], page 55.
When your program stops, GDB automatically selects the currently executing frame anddescribes it briefly, similar to the frame command (see Section 6.4 [Information about aframe], page 56).
6.1 Stack frames
The call stack is divided up into contiguous pieces called stack frames , or frames forshort; each frame is the data associated with one call to one function. The frame containsthe arguments given to the function, the function’s local variables, and the address at whichthe function is executing.
When your program is started, the stack has only one frame, that of the function main.This is called the initial frame or the outermost frame. Each time a function is called, anew frame is made. Each time a function returns, the frame for that function invocationis eliminated. If a function is recursive, there can be many frames for the same function.The frame for the function in which execution is actually occurring is called the innermostframe. This is the most recently created of all the stack frames that still exist.
Inside your program, stack frames are identified by their addresses. A stack frameconsists of many bytes, each of which has its own address; each kind of computer has aconvention for choosing one byte whose address serves as the address of the frame. Usuallythis address is kept in a register called the frame pointer register while execution is goingon in that frame.
GDB assigns numbers to all existing stack frames, starting with zero for the innermostframe, one for the frame that called it, and so on upward. These numbers do not reallyexist in your program; they are assigned by GDB to give you a way of designating stackframes in GDB commands.
Some compilers provide a way to compile functions so that they operate without stackframes. (For example, the gcc option
‘-fomit-frame-pointer’
generates functions without a frame.) This is occasionally done with heavily used li-brary functions to save the frame setup time. GDB has limited facilities for dealing with
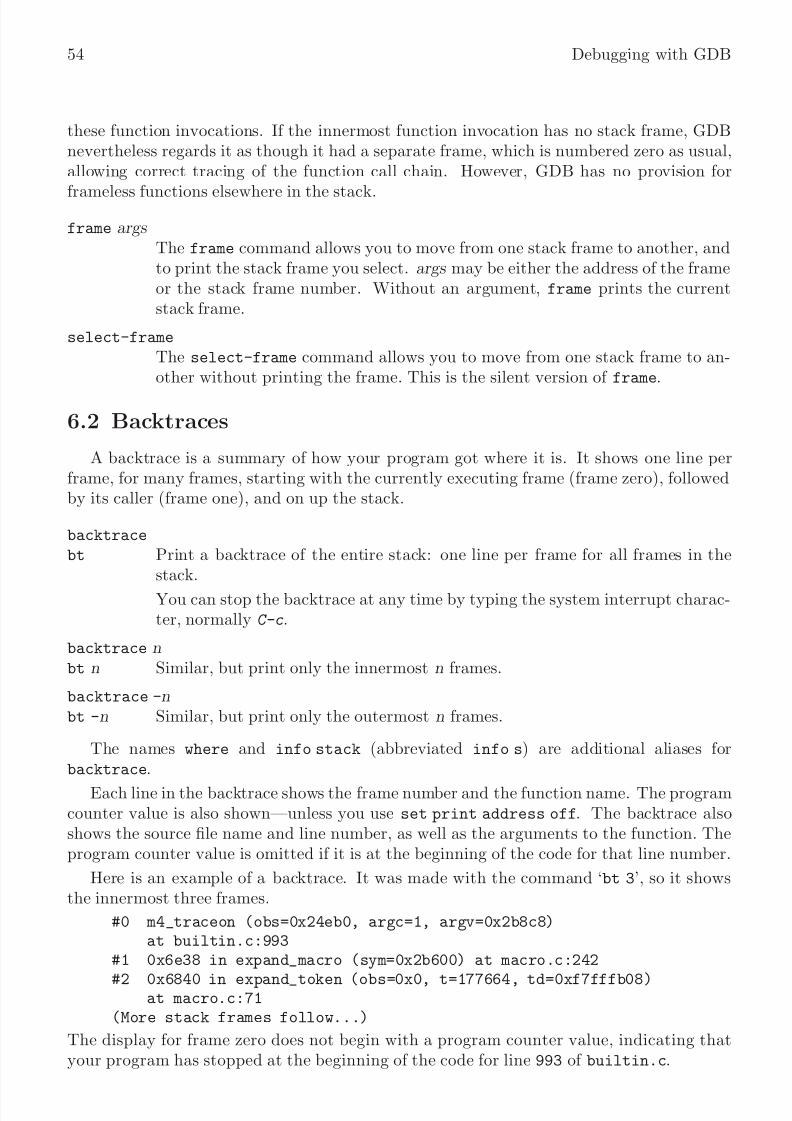
8/14/2019 Debugging With GDB - The GNU Source-Level Debugger
http://slidepdf.com/reader/full/debugging-with-gdb-the-gnu-source-level-debugger 65/328
54 Debugging with GDB
these function invocations. If the innermost function invocation has no stack frame, GDBnevertheless regards it as though it had a separate frame, which is numbered zero as usual,allowing correct tracing of the function call chain. However, GDB has no provision for
frameless functions elsewhere in the stack.
frame args The frame command allows you to move from one stack frame to another, andto print the stack frame you select. args may be either the address of the frameor the stack frame number. Without an argument, frame prints the currentstack frame.
select-frame
The select-frame command allows you to move from one stack frame to an-other without printing the frame. This is the silent version of frame.
6.2 Backtraces
A backtrace is a summary of how your program got where it is. It shows one line perframe, for many frames, starting with the currently executing frame (frame zero), followedby its caller (frame one), and on up the stack.
backtrace
bt Print a backtrace of the entire stack: one line per frame for all frames in the
stack.You can stop the backtrace at any time by typing the system interrupt charac-ter, normally C-c.
backtrace nbt n Similar, but print only the innermost n frames.
backtrace -nbt -n Similar, but print only the outermost n frames.
The names where and info stack (abbreviated info s) are additional aliases forbacktrace.
Each line in the backtrace shows the frame number and the function name. The programcounter value is also shown—unless you use set print address off. The backtrace alsoshows the source file name and line number, as well as the arguments to the function. Theprogram counter value is omitted if it is at the beginning of the code for that line number.
Here is an example of a backtrace. It was made with the command ‘bt 3’, so it showsthe innermost three frames.
#0 m4_traceon (obs=0x24eb0, argc=1, argv=0x2b8c8)at builtin.c:993
#1 0x6e38 in expand_macro (sym=0x2b600) at macro.c:242
#2 0x6840 in expand_token (obs=0x0, t=177664, td=0xf7fffb08)at macro.c:71
(More stack frames follow...)
The display for frame zero does not begin with a program counter value, indicating thatyour program has stopped at the beginning of the code for line 993 of builtin.c.

8/14/2019 Debugging With GDB - The GNU Source-Level Debugger
http://slidepdf.com/reader/full/debugging-with-gdb-the-gnu-source-level-debugger 66/328
Chapter 6: Examining the Stack 55
6.3 Selecting a frame
Most commands for examining the stack and other data in your program work on
whichever stack frame is selected at the moment. Here are the commands for selectinga stack frame; all of them finish by printing a brief description of the stack frame justselected.
frame nf n Select frame number n. Recall that frame zero is the innermost (currently
executing) frame, frame one is the frame that called the innermost one, and soon. The highest-numbered frame is the one for main.
frame addr f addr Select the frame at address addr . This is useful mainly if the chaining of stack
frames has been damaged by a bug, making it impossible for GDB to assignnumbers properly to all frames. In addition, this can be useful when yourprogram has multiple stacks and switches between them.
On the SPARC architecture, frame needs two addresses to select an arbitraryframe: a frame pointer and a stack pointer.
On the MIPS and Alpha architecture, it needs two addresses: a stack pointerand a program counter.
On the 29k architecture, it needs three addresses: a register stack pointer, aprogram counter, and a memory stack pointer.
up n Move n frames up the stack. For positive numbers n, this advances toward theoutermost frame, to higher frame numbers, to frames that have existed longer.n defaults to one.
down n Move n frames down the stack. For positive numbers n, this advances towardthe innermost frame, to lower frame numbers, to frames that were created morerecently. n defaults to one. You may abbreviate down as do.
All of these commands end by printing two lines of output describing the frame. Thefirst line shows the frame number, the function name, the arguments, and the source fileand line number of execution in that frame. The second line shows the text of that source
line.For example:
(gdb) up#1 0x22f0 in main (argc=1, argv=0xf7fffbf4, env=0xf7fffbfc)
at env.c:1010 read_input_file (argv[i]);
After such a printout, the list command with no arguments prints ten lines centeredon the point of execution in the frame. See Section 7.1 [Printing source lines], page 57.
up-silently n
down-silently nThese two commands are variants of up and down, respectively; they differin that they do their work silently, without causing display of the new frame.They are intended primarily for use in GDB command scripts, where the outputmight be unnecessary and distracting.
8/14/2019 Debugging With GDB - The GNU Source-Level Debugger
http://slidepdf.com/reader/full/debugging-with-gdb-the-gnu-source-level-debugger 67/328
56 Debugging with GDB
6.4 Information about a frame
There are several other commands to print information about the selected stack frame.
framef When used without any argument, this command does not change which frame
is selected, but prints a brief description of the currently selected stack frame.It can be abbreviated f. With an argument, this command is used to select astack frame. See Section 6.3 [Selecting a frame], page 55.
info frame
info f This command prints a verbose description of the selected stack frame, includ-ing:
• the address of the frame
• the address of the next frame down (called by this frame)
• the address of the next frame up (caller of this frame)
• the language in which the source code corresponding to this frame is written
• the address of the frame’s arguments
• the address of the frame’s local variables
• the program counter saved in it (the address of execution in the callerframe)
• which registers were saved in the frame
The verbose description is useful when something has gone wrong that has madethe stack format fail to fit the usual conventions.
info frame addr info f addr
Print a verbose description of the frame at address addr , without selecting thatframe. The selected frame remains unchanged by this command. This requiresthe same kind of address (more than one for some architectures) that you specifyin the frame command. See Section 6.3 [Selecting a frame], page 55.
info args Print the arguments of the selected frame, each on a separate line.info locals
Print the local variables of the selected frame, each on a separate line. Theseare all variables (declared either static or automatic) accessible at the point of execution of the selected frame.
info catch
Print a list of all the exception handlers that are active in the current stackframe at the current point of execution. To see other exception handlers, visitthe associated frame (using the up, down, or frame commands); then type info
catch. See Section 5.1.3 [Setting catchpoints], page 39.

8/14/2019 Debugging With GDB - The GNU Source-Level Debugger
http://slidepdf.com/reader/full/debugging-with-gdb-the-gnu-source-level-debugger 68/328
Chapter 7: Examining Source Files 57
7 Examining Source Files
GDB can print parts of your program’s source, since the debugging information recorded
in the program tells GDB what source files were used to build it. When your program stops,GDB spontaneously prints the line where it stopped. Likewise, when you select a stack frame(see Section 6.3 [Selecting a frame], page 55), GDB prints the line where execution in thatframe has stopped. You can print other portions of source files by explicit command.
If you use GDB through its gnu Emacs interface, you may prefer to use Emacs facilitiesto view source; see Chapter 21 [Using GDB under gnu Emacs], page 181.
7.1 Printing source lines
To print lines from a source file, use the list command (abbreviated l). By default, tenlines are printed. There are several ways to specify what part of the file you want to print.
Here are the forms of the list command most commonly used:
list linenumPrint lines centered around line number linenum in the current source file.
list functionPrint lines centered around the beginning of function function.
list Print more lines. If the last lines printed were printed with a list command,this prints lines following the last lines printed; however, if the last line printed
was a solitary line printed as part of displaying a stack frame (see Chapter 6[Examining the Stack], page 53), this prints lines centered around that line.
list - Print lines just before the lines last printed.
By default, GDB prints ten source lines with any of these forms of the list command.You can change this using set listsize:
set listsize countMake the list command display count source lines (unless the list argumentexplicitly specifies some other number).
show listsize
Display the number of lines that list prints.
Repeating a list command with RET discards the argument, so it is equivalent totyping just list. This is more useful than listing the same lines again. An exception ismade for an argument of ‘-’; that argument is preserved in repetition so that each repetitionmoves up in the source file.
In general, the list command expects you to supply zero, one or two linespecs . Linespecsspecify source lines; there are several ways of writing them, but the effect is always to specifysome source line. Here is a complete description of the possible arguments for list:
list linespec Print lines centered around the line specified by linespec .
list first,lastPrint lines from first to last. Both arguments are linespecs.
8/14/2019 Debugging With GDB - The GNU Source-Level Debugger
http://slidepdf.com/reader/full/debugging-with-gdb-the-gnu-source-level-debugger 69/328
58 Debugging with GDB
list ,last Print lines ending with last.
list first,
Print lines starting with first.
list + Print lines just after the lines last printed.
list - Print lines just before the lines last printed.
list As described in the preceding table.
Here are the ways of specifying a single source line—all the kinds of linespec.
number Specifies line number of the current source file. When a list command hastwo linespecs, this refers to the same source file as the first linespec.
+offset Specifies the line offset lines after the last line printed. When used as the secondlinespec in a list command that has two, this specifies the line offset lines downfrom the first linespec.
-offset Specifies the line offset lines before the last line printed.
filename :number Specifies line number in the source file filename .
function Specifies the line that begins the body of the function function. For example:in C, this is the line with the open brace.
filename :functionSpecifies the line of the open-brace that begins the body of the function functionin the file filename . You only need the file name with a function name to avoidambiguity when there are identically named functions in different source files.
*address Specifies the line containing the program address address . address may be anyexpression.
7.2 Searching source files
There are two commands for searching through the current source file for a regularexpression.
forward-search regexpsearch regexp
The command ‘forward-search regexp’ checks each line, starting with the onefollowing the last line listed, for a match for regexp. It lists the line that is found.You can use the synonym ‘search regexp’ or abbreviate the command name as
fo.reverse-search regexp
The command ‘reverse-search regexp’ checks each line, starting with the onebefore the last line listed and going backward, for a match for regexp. It liststhe line that is found. You can abbreviate this command as rev.

8/14/2019 Debugging With GDB - The GNU Source-Level Debugger
http://slidepdf.com/reader/full/debugging-with-gdb-the-gnu-source-level-debugger 70/328
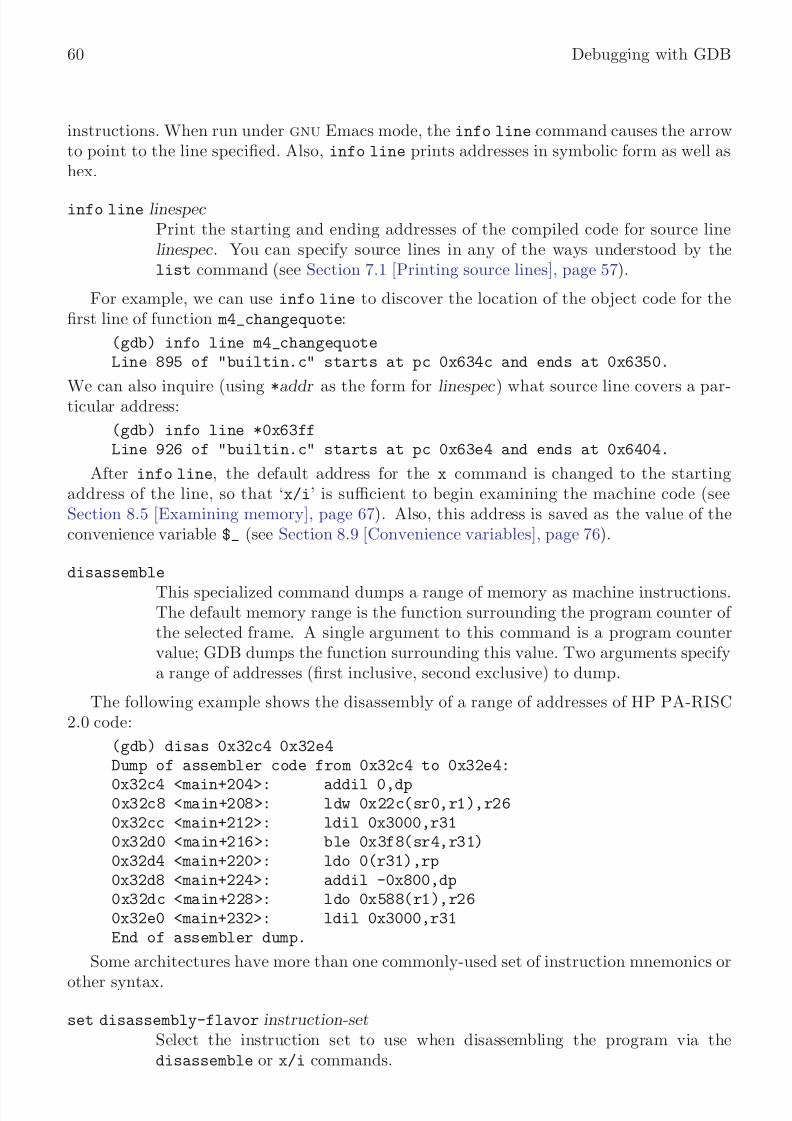
8/14/2019 Debugging With GDB - The GNU Source-Level Debugger
http://slidepdf.com/reader/full/debugging-with-gdb-the-gnu-source-level-debugger 71/328
60 Debugging with GDB
instructions. When run under gnu Emacs mode, the info line command causes the arrowto point to the line specified. Also, info line prints addresses in symbolic form as well ashex.
info line linespec Print the starting and ending addresses of the compiled code for source linelinespec . You can specify source lines in any of the ways understood by thelist command (see Section 7.1 [Printing source lines], page 57).
For example, we can use info line to discover the location of the object code for thefirst line of function m4_changequote:
(gdb) info line m4_changequoteLine 895 of "builtin.c" starts at pc 0x634c and ends at 0x6350.
We can also inquire (using *addr as the form for linespec ) what source line covers a par-ticular address:
(gdb) info line *0x63ffLine 926 of "builtin.c" starts at pc 0x63e4 and ends at 0x6404.
After info line, the default address for the x command is changed to the startingaddress of the line, so that ‘x/i’ is sufficient to begin examining the machine code (seeSection 8.5 [Examining memory], page 67). Also, this address is saved as the value of theconvenience variable $_ (see Section 8.9 [Convenience variables], page 76).
disassemble
This specialized command dumps a range of memory as machine instructions.The default memory range is the function surrounding the program counter of the selected frame. A single argument to this command is a program countervalue; GDB dumps the function surrounding this value. Two arguments specifya range of addresses (first inclusive, second exclusive) to dump.
The following example shows the disassembly of a range of addresses of HP PA-RISC2.0 code:
(gdb) disas 0x32c4 0x32e4Dump of assembler code from 0x32c4 to 0x32e4:
0x32c4 <main+204>: addil 0,dp0x32c8 <main+208>: ldw 0x22c(sr0,r1),r260x32cc <main+212>: ldil 0x3000,r310x32d0 <main+216>: ble 0x3f8(sr4,r31)0x32d4 <main+220>: ldo 0(r31),rp0x32d8 <main+224>: addil -0x800,dp0x32dc <main+228>: ldo 0x588(r1),r260x32e0 <main+232>: ldil 0x3000,r31End of assembler dump.
Some architectures have more than one commonly-used set of instruction mnemonics orother syntax.
set disassembly-flavor instruction-setSelect the instruction set to use when disassembling the program via thedisassemble or x/i commands.

8/14/2019 Debugging With GDB - The GNU Source-Level Debugger
http://slidepdf.com/reader/full/debugging-with-gdb-the-gnu-source-level-debugger 72/328
Chapter 7: Examining Source Files 61
Currently this command is only defined for the Intel x86 family. You can setinstruction-set to either intel or att. The default is att, the AT&T flavorused by default by Unix assemblers for x86-based targets.

8/14/2019 Debugging With GDB - The GNU Source-Level Debugger
http://slidepdf.com/reader/full/debugging-with-gdb-the-gnu-source-level-debugger 73/328
62 Debugging with GDB
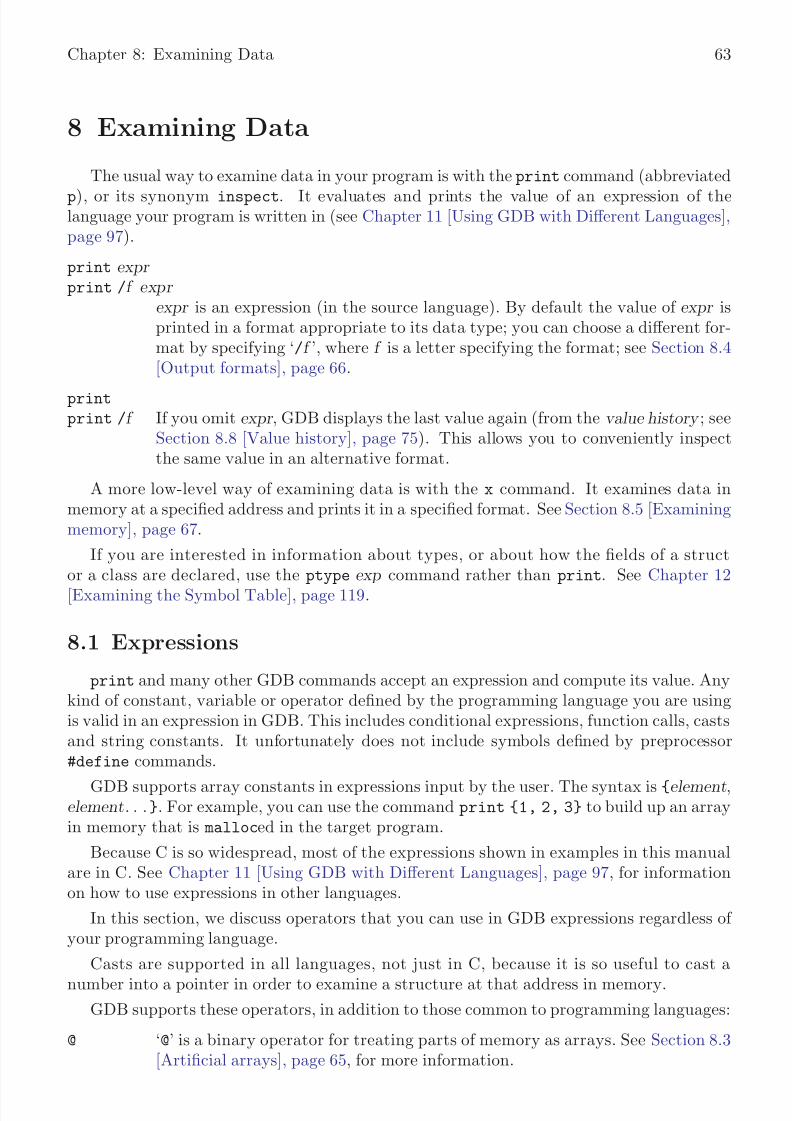
8/14/2019 Debugging With GDB - The GNU Source-Level Debugger
http://slidepdf.com/reader/full/debugging-with-gdb-the-gnu-source-level-debugger 74/328
Chapter 8: Examining Data 63
8 Examining Data
The usual way to examine data in your program is with the print command (abbreviated
p), or its synonym inspect. It evaluates and prints the value of an expression of thelanguage your program is written in (see Chapter 11 [Using GDB with Different Languages],page 97).
print expr print /f expr
expr is an expression (in the source language). By default the value of expr isprinted in a format appropriate to its data type; you can choose a different for-mat by specifying ‘/f ’, where f is a letter specifying the format; see Section 8.4[Output formats], page 66.
print /f If you omit expr , GDB displays the last value again (from the value history ; seeSection 8.8 [Value history], page 75). This allows you to conveniently inspectthe same value in an alternative format.
A more low-level way of examining data is with the x command. It examines data inmemory at a specified address and prints it in a specified format. See Section 8.5 [Examiningmemory], page 67.
If you are interested in information about types, or about how the fields of a struct
or a class are declared, use the ptype exp command rather than print. See Chapter 12[Examining the Symbol Table], page 119.
8.1 Expressions
print and many other GDB commands accept an expression and compute its value. Anykind of constant, variable or operator defined by the programming language you are usingis valid in an expression in GDB. This includes conditional expressions, function calls, castsand string constants. It unfortunately does not include symbols defined by preprocessor#define commands.
GDB supports array constants in expressions input by the user. The syntax is {element,element. . . }. For example, you can use the command print {1, 2, 3} to build up an arrayin memory that is malloced in the target program.
Because C is so widespread, most of the expressions shown in examples in this manualare in C. See Chapter 11 [Using GDB with Different Languages], page 97, for informationon how to use expressions in other languages.
In this section, we discuss operators that you can use in GDB expressions regardless of your programming language.
Casts are supported in all languages, not just in C, because it is so useful to cast anumber into a pointer in order to examine a structure at that address in memory.
GDB supports these operators, in addition to those common to programming languages:
@ ‘@’ is a binary operator for treating parts of memory as arrays. See Section 8.3[Artificial arrays], page 65, for more information.

8/14/2019 Debugging With GDB - The GNU Source-Level Debugger
http://slidepdf.com/reader/full/debugging-with-gdb-the-gnu-source-level-debugger 75/328
64 Debugging with GDB
:: ‘::’ allows you to specify a variable in terms of the file or function where it isdefined. See Section 8.2 [Program variables], page 64.
{type } addr Refers to an object of type type stored at address addr in memory. addr maybe any expression whose value is an integer or pointer (but parentheses arerequired around binary operators, just as in a cast). This construct is allowedregardless of what kind of data is normally supposed to reside at addr .
8.2 Program variables
The most common kind of expression to use is the name of a variable in your program.
Variables in expressions are understood in the selected stack frame (see Section 6.3
[Selecting a frame], page 55); they must be either:
• global (or file-static)
or
• visible according to the scope rules of the programming language from the point of execution in that frame
This means that in the function
foo (a)int a;
{bar (a);{
int b = test ();bar (b);
}}
you can examine and use the variable a whenever your program is executing within thefunction foo, but you can only use or examine the variable b while your program is executing
inside the block where b is declared.There is an exception: you can refer to a variable or function whose scope is a single
source file even if the current execution point is not in this file. But it is possible to havemore than one such variable or function with the same name (in different source files). If that happens, referring to that name has unpredictable effects. If you wish, you can specifya static variable in a particular function or file, using the colon-colon notation:
file ::variable function::variable
Here file or function is the name of the context for the static variable . In the case of file
names, you can use quotes to make sure GDB parses the file name as a single word—forexample, to print a global value of x defined in ‘f2.c’:
(gdb) p ’f2.c’::x
This use of ‘::’ is very rarely in conflict with the very similar use of the same notationin C++. GDB also supports use of the C++ scope resolution operator in GDB expressions.
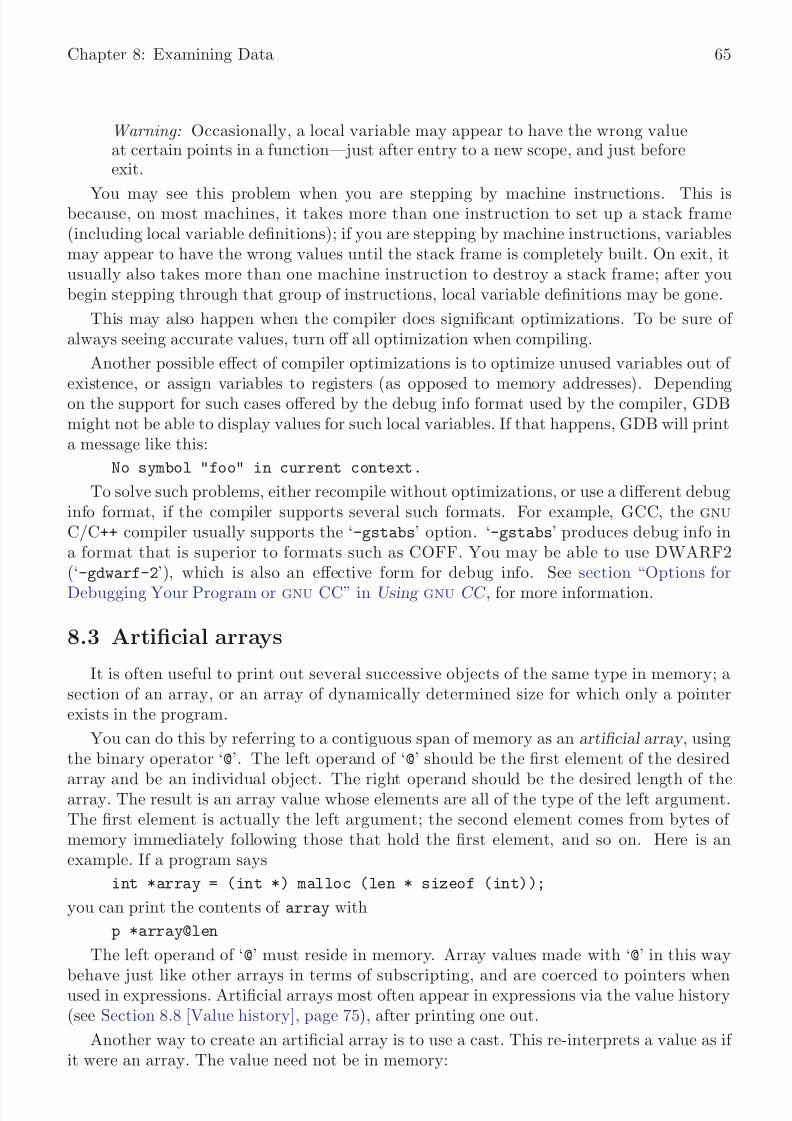
8/14/2019 Debugging With GDB - The GNU Source-Level Debugger
http://slidepdf.com/reader/full/debugging-with-gdb-the-gnu-source-level-debugger 76/328
Chapter 8: Examining Data 65
Warning: Occasionally, a local variable may appear to have the wrong valueat certain points in a function—just after entry to a new scope, and just beforeexit.
You may see this problem when you are stepping by machine instructions. This isbecause, on most machines, it takes more than one instruction to set up a stack frame(including local variable definitions); if you are stepping by machine instructions, variablesmay appear to have the wrong values until the stack frame is completely built. On exit, itusually also takes more than one machine instruction to destroy a stack frame; after youbegin stepping through that group of instructions, local variable definitions may be gone.
This may also happen when the compiler does significant optimizations. To be sure of always seeing accurate values, turn off all optimization when compiling.
Another possible effect of compiler optimizations is to optimize unused variables out of
existence, or assign variables to registers (as opposed to memory addresses). Dependingon the support for such cases offered by the debug info format used by the compiler, GDBmight not be able to display values for such local variables. If that happens, GDB will printa message like this:
No symbol "foo" in current context.
To solve such problems, either recompile without optimizations, or use a different debuginfo format, if the compiler supports several such formats. For example, GCC, the gnuC/C++ compiler usually supports the ‘-gstabs’ option. ‘-gstabs’ produces debug info ina format that is superior to formats such as COFF. You may be able to use DWARF2(‘-gdwarf-2’), which is also an effective form for debug info. See section “Options forDebugging Your Program or gnu CC” in Using gnu CC , for more information.
8.3 Artificial arrays
It is often useful to print out several successive objects of the same type in memory; asection of an array, or an array of dynamically determined size for which only a pointerexists in the program.
You can do this by referring to a contiguous span of memory as an artificial array , usingthe binary operator ‘@’. The left operand of ‘@’ should be the first element of the desired
array and be an individual object. The right operand should be the desired length of thearray. The result is an array value whose elements are all of the type of the left argument.The first element is actually the left argument; the second element comes from bytes of memory immediately following those that hold the first element, and so on. Here is anexample. If a program says
int *array = (int *) malloc (len * sizeof (int));
you can print the contents of array with
p *array@len
The left operand of ‘@’ must reside in memory. Array values made with ‘@’ in this way
behave just like other arrays in terms of subscripting, and are coerced to pointers whenused in expressions. Artificial arrays most often appear in expressions via the value history(see Section 8.8 [Value history], page 75), after printing one out.
Another way to create an artificial array is to use a cast. This re-interprets a value as if it were an array. The value need not be in memory:

8/14/2019 Debugging With GDB - The GNU Source-Level Debugger
http://slidepdf.com/reader/full/debugging-with-gdb-the-gnu-source-level-debugger 77/328
66 Debugging with GDB
(gdb) p/x (short[2])0x12345678$1 = {0x1234, 0x5678}
As a convenience, if you leave the array length out (as in ‘(type [])value ’) GDB calcu-
lates the size to fill the value (as ‘sizeof(value )/sizeof(type )’:(gdb) p/x (short[])0x12345678$2 = {0x1234, 0x5678}
Sometimes the artificial array mechanism is not quite enough; in moderately complexdata structures, the elements of interest may not actually be adjacent—for example, if you are interested in the values of pointers in an array. One useful work-around in thissituation is to use a convenience variable (see Section 8.9 [Convenience variables], page 76)as a counter in an expression that prints the first interesting value, and then repeat thatexpression via RET. For instance, suppose you have an array dtab of pointers to structures,
and you are interested in the values of a field fv in each structure. Here is an example of what you might type:
set $i = 0p dtab[$i++]->fvRET
RET
...
8.4 Output formats
By default, GDB prints a value according to its data type. Sometimes this is not whatyou want. For example, you might want to print a number in hex, or a pointer in decimal.Or you might want to view data in memory at a certain address as a character string or asan instruction. To do these things, specify an output format when you print a value.
The simplest use of output formats is to say how to print a value already computed.This is done by starting the arguments of the print command with a slash and a formatletter. The format letters supported are:
x Regard the bits of the value as an integer, and print the integer in hexadecimal.
d Print as integer in signed decimal.
u Print as integer in unsigned decimal.
o Print as integer in octal.
t Print as integer in binary. The letter ‘t’ stands for “two”.1
a Print as an address, both absolute in hexadecimal and as an offset from thenearest preceding symbol. You can use this format used to discover where (inwhat function) an unknown address is located:
(gdb) p/a 0x54320
$3 = 0x54320 <_initialize_vx+396>The command info symbol 0x54320 yields similar results. See Chapter 12[Symbols], page 119.
1 ‘b’ cannot be used because these format letters are also used with the x command, where ‘b’ stands for“byte”; see Section 8.5 [Examining memory], page 67.

8/14/2019 Debugging With GDB - The GNU Source-Level Debugger
http://slidepdf.com/reader/full/debugging-with-gdb-the-gnu-source-level-debugger 78/328
Chapter 8: Examining Data 67
c Regard as an integer and print it as a character constant.
f Regard the bits of the value as a floating point number and print using typicalfloating point syntax.
For example, to print the program counter in hex (see Section 8.10 [Registers], page 77),type
p/x $pc
Note that no space is required before the slash; this is because command names in GDBcannot contain a slash.
To reprint the last value in the value history with a different format, you can use theprint command with just a format and no expression. For example, ‘p/x’ reprints the lastvalue in hex.
8.5 Examining memory
You can use the command x (for “examine”) to examine memory in any of severalformats, independently of your program’s data types.
x/nfu addr x addr x Use the x command to examine memory.
n, f , and u are all optional parameters that specify how much memory to display and howto format it; addr is an expression giving the address where you want to start displayingmemory. If you use defaults for nfu, you need not type the slash ‘/’. Several commands setconvenient defaults for addr .
n, the repeat countThe repeat count is a decimal integer; the default is 1. It specifies how muchmemory (counting by units u) to display.
f , the display format
The display format is one of the formats used by print, ‘s’ (null-terminatedstring), or ‘i’ (machine instruction). The default is ‘x’ (hexadecimal) initially.The default changes each time you use either x or print.
u, the unit sizeThe unit size is any of
b Bytes.
h Halfwords (two bytes).
w Words (four bytes). This is the initial default.
g Giant words (eight bytes).
Each time you specify a unit size with x, that size becomes the default unit thenext time you use x. (For the ‘s’ and ‘i’ formats, the unit size is ignored andis normally not written.)

8/14/2019 Debugging With GDB - The GNU Source-Level Debugger
http://slidepdf.com/reader/full/debugging-with-gdb-the-gnu-source-level-debugger 79/328
68 Debugging with GDB
addr , starting display addressaddr is the address where you want GDB to begin displaying memory. Theexpression need not have a pointer value (though it may); it is always inter-
preted as an integer address of a byte of memory. See Section 8.1 [Expressions],page 63, for more information on expressions. The default for addr is usu-ally just after the last address examined—but several other commands also setthe default address: info breakpoints (to the address of the last breakpointlisted), info line (to the starting address of a line), and print (if you use itto display a value from memory).
For example, ‘x/3uh 0x54320’ is a request to display three halfwords (h) of memory,formatted as unsigned decimal integers (‘u’), starting at address 0x54320. ‘x/4xw $sp’prints the four words (‘w’) of memory above the stack pointer (here, ‘$sp’; see Section 8.10
[Registers], page 77) in hexadecimal (‘x’).Since the letters indicating unit sizes are all distinct from the letters specifying output
formats, you do not have to remember whether unit size or format comes first; either orderworks. The output specifications ‘4xw’ and ‘4wx’ mean exactly the same thing. (However,the count n must come first; ‘wx4’ does not work.)
Even though the unit size u is ignored for the formats ‘s’ and ‘i’, you might still want touse a count n; for example, ‘3i’ specifies that you want to see three machine instructions,including any operands. The command disassemble gives an alternative way of inspectingmachine instructions; see Section 7.4 [Source and machine code], page 59.
All the defaults for the arguments to x are designed to make it easy to continue scanningmemory with minimal specifications each time you use x. For example, after you haveinspected three machine instructions with ‘x/3i addr ’, you can inspect the next seven with just ‘x/7’. If you use RET to repeat the x command, the repeat count n is used again; theother arguments default as for successive uses of x.
The addresses and contents printed by the x command are not saved in the value historybecause there is often too much of them and they would get in the way. Instead, GDBmakes these values available for subsequent use in expressions as values of the conveniencevariables $_ and $__. After an x command, the last address examined is available for usein expressions in the convenience variable $_. The contents of that address, as examined,are available in the convenience variable $__.
If the x command has a repeat count, the address and contents saved are from the lastmemory unit printed; this is not the same as the last address printed if several units wereprinted on the last line of output.
8.6 Automatic display
If you find that you want to print the value of an expression frequently (to see how itchanges), you might want to add it to the automatic display list so that GDB prints its
value each time your program stops. Each expression added to the list is given a number toidentify it; to remove an expression from the list, you specify that number. The automaticdisplay looks like this:
2: foo = 383: bar[5] = (struct hack *) 0x3804

8/14/2019 Debugging With GDB - The GNU Source-Level Debugger
http://slidepdf.com/reader/full/debugging-with-gdb-the-gnu-source-level-debugger 80/328
Chapter 8: Examining Data 69
This display shows item numbers, expressions and their current values. As with displaysyou request manually using x or print, you can specify the output format you prefer; infact, display decides whether to use print or x depending on how elaborate your format
specification is—it uses x if you specify a unit size, or one of the two formats (‘i’ and ‘s’)that are only supported by x; otherwise it uses print.
display expr Add the expression expr to the list of expressions to display each time yourprogram stops. See Section 8.1 [Expressions], page 63.
display does not repeat if you press RET again after using it.
display/fmt expr For fmt specifying only a display format and not a size or count, add the
expression expr to the auto-display list but arrange to display it each time inthe specified format fmt. See Section 8.4 [Output formats], page 66.
display/fmt addr For fmt ‘i’ or ‘s’, or including a unit-size or a number of units, add the expres-sion addr as a memory address to be examined each time your program stops.Examining means in effect doing ‘x/fmt addr ’. See Section 8.5 [Examiningmemory], page 67.
For example, ‘display/i $pc’ can be helpful, to see the machine instruction about to
be executed each time execution stops (‘$pc’ is a common name for the program counter;see Section 8.10 [Registers], page 77).
undisplay dnums ...
delete display dnums ...
Remove item numbers dnums from the list of expressions to display.
undisplay does not repeat if you press RET after using it. (Otherwise youwould just get the error ‘No display number ...’.)
disable display dnums ...
Disable the display of item numbers dnums . A disabled display item is notprinted automatically, but is not forgotten. It may be enabled again later.
enable display dnums ...
Enable display of item numbers dnums . It becomes effective once again in autodisplay of its expression, until you specify otherwise.
display Display the current values of the expressions on the list, just as is done whenyour program stops.
info display
Print the list of expressions previously set up to display automatically, eachone with its item number, but without showing the values. This includes dis-abled expressions, which are marked as such. It also includes expressions whichwould not be displayed right now because they refer to automatic variables notcurrently available.

8/14/2019 Debugging With GDB - The GNU Source-Level Debugger
http://slidepdf.com/reader/full/debugging-with-gdb-the-gnu-source-level-debugger 81/328
70 Debugging with GDB
If a display expression refers to local variables, then it does not make sense outside thelexical context for which it was set up. Such an expression is disabled when execution entersa context where one of its variables is not defined. For example, if you give the command
display last_char while inside a function with an argument last_char, GDB displaysthis argument while your program continues to stop inside that function. When it stopselsewhere—where there is no variable last_char—the display is disabled automatically.The next time your program stops where last_char is meaningful, you can enable thedisplay expression once again.
8.7 Print settings
GDB provides the following ways to control how arrays, structures, and symbols are
printed.These settings are useful for debugging programs in any language:
set print address
set print address on
GDB prints memory addresses showing the location of stack traces, structurevalues, pointer values, breakpoints, and so forth, even when it also displays thecontents of those addresses. The default is on. For example, this is what astack frame display looks like with set print address on:
(gdb) f#0 set_quotes (lq=0x34c78 "<<", rq=0x34c88 ">>")
at input.c:530530 if (lquote != def_lquote)
set print address off
Do not print addresses when displaying their contents. For example, this is thesame stack frame displayed with set print address off:
(gdb) set print addr off(gdb) f
#0 set_quotes (lq="<<", rq=">>") at input.c:530530 if (lquote != def_lquote)
You can use ‘set print address off’ to eliminate all machine dependent dis-plays from the GDB interface. For example, with print address off, youshould get the same text for backtraces on all machines—whether or not theyinvolve pointer arguments.
show print address
Show whether or not addresses are to be printed.
When GDB prints a symbolic address, it normally prints the closest earlier symbol plusan offset. If that symbol does not uniquely identify the address (for example, it is a namewhose scope is a single source file), you may need to clarify. One way to do this is withinfo line, for example ‘info line *0x4537’. Alternately, you can set GDB to print thesource file and line number when it prints a symbolic address:

8/14/2019 Debugging With GDB - The GNU Source-Level Debugger
http://slidepdf.com/reader/full/debugging-with-gdb-the-gnu-source-level-debugger 82/328
Chapter 8: Examining Data 71
set print symbol-filename on
Tell GDB to print the source file name and line number of a symbol in thesymbolic form of an address.
set print symbol-filename off
Do not print source file name and line number of a symbol. This is the default.
show print symbol-filename
Show whether or not GDB will print the source file name and line number of asymbol in the symbolic form of an address.
Another situation where it is helpful to show symbol filenames and line numbers is whendisassembling code; GDB shows you the line number and source file that corresponds toeach instruction.
Also, you may wish to see the symbolic form only if the address being printed is reason-ably close to the closest earlier symbol:
set print max-symbolic-offset max-offsetTell GDB to only display the symbolic form of an address if the offset betweenthe closest earlier symbol and the address is less than max-offset. The defaultis 0, which tells GDB to always print the symbolic form of an address if anysymbol precedes it.
show print max-symbolic-offset
Ask how large the maximum offset is that GDB prints in a symbolic address.
If you have a pointer and you are not sure where it points, try ‘set print
symbol-filename on’. Then you can determine the name and source file location of thevariable where it points, using ‘p/a pointer ’. This interprets the address in symbolic form.For example, here GDB shows that a variable ptt points at another variable t, defined in‘hi2.c’:
(gdb) set print symbol-filename on(gdb) p/a ptt$4 = 0xe008 <t in hi2.c>
Warning: For pointers that point to a local variable, ‘p/a’ does not show thesymbol name and filename of the referent, even with the appropriate set printoptions turned on.
Other settings control how different kinds of objects are printed:
set print array
set print array on
Pretty print arrays. This format is more convenient to read, but uses morespace. The default is off.
set print array off
Return to compressed format for arrays.
show print array
Show whether compressed or pretty format is selected for displaying arrays.

8/14/2019 Debugging With GDB - The GNU Source-Level Debugger
http://slidepdf.com/reader/full/debugging-with-gdb-the-gnu-source-level-debugger 83/328
72 Debugging with GDB
set print elements number-of-elements Set a limit on how many elements of an array GDB will print. If GDB is printinga large array, it stops printing after it has printed the number of elements set
by the set print elements command. This limit also applies to the display of strings. When GDB starts, this limit is set to 200. Setting number-of-elements to zero means that the printing is unlimited.
show print elements
Display the number of elements of a large array that GDB will print. If thenumber is 0, then the printing is unlimited.
set print null-stop
Cause GDB to stop printing the characters of an array when the first nullis encountered. This is useful when large arrays actually contain only short
strings. The default is off.set print pretty on
Cause GDB to print structures in an indented format with one member perline, like this:
$ 1 = {next = 0x0,flags = {
sweet = 1,sour = 1
}, meat = 0x54 "Pork"
}
set print pretty off
Cause GDB to print structures in a compact format, like this:
$1 = {next = 0x0, flags = {sweet = 1, sour = 1}, \ meat = 0x54 "Pork"}
This is the default format.
show print pretty
Show which format GDB is using to print structures.
set print sevenbit-strings on
Print using only seven-bit characters; if this option is set, GDB displays anyeight-bit characters (in strings or character values) using the notation \nnn.This setting is best if you are working in English (ascii) and you use the high-order bit of characters as a marker or “meta” bit.
set print sevenbit-strings off
Print full eight-bit characters. This allows the use of more international char-acter sets, and is the default.
show print sevenbit-stringsShow whether or not GDB is printing only seven-bit characters.
set print union on
Tell GDB to print unions which are contained in structures. This is the defaultsetting.

8/14/2019 Debugging With GDB - The GNU Source-Level Debugger
http://slidepdf.com/reader/full/debugging-with-gdb-the-gnu-source-level-debugger 84/328
Chapter 8: Examining Data 73
set print union off
Tell GDB not to print unions which are contained in structures.
show print union
Ask GDB whether or not it will print unions which are contained in structures.
For example, given the declarations
typedef enum {Tree, Bug} Species;typedef enum {Big_tree, Acorn, Seedling} Tree_forms;typedef enum {Caterpillar, Cocoon, Butterfly}
Bug_forms;
struct thing {Species it;
union {Tree_forms tree;Bug_forms bug;
} form;};
struct thing foo = {Tree, {Acorn}};
with set print union on in effect ‘p foo’ would print
$1 = {it = Tree, form = {tree = Acorn, bug = Cocoon}}
and with set print union off in effect it would print
$1 = {it = Tree, form = {...}}
These settings are of interest when debugging C++ programs:
set print demangle
set print demangle on
Print C++ names in their source form rather than in the encoded (“mangled”)form passed to the assembler and linker for type-safe linkage. The default ison.
show print demangleShow whether C++ names are printed in mangled or demangled form.
set print asm-demangle
set print asm-demangle on
Print C++ names in their source form rather than their mangled form, even inassembler code printouts such as instruction disassemblies. The default is off.
show print asm-demangle
Show whether C++ names in assembly listings are printed in mangled or de-mangled form.
set demangle-style style Choose among several encoding schemes used by different compilers to representC++ names. The choices for style are currently:
auto Allow GDB to choose a decoding style by inspecting your program.
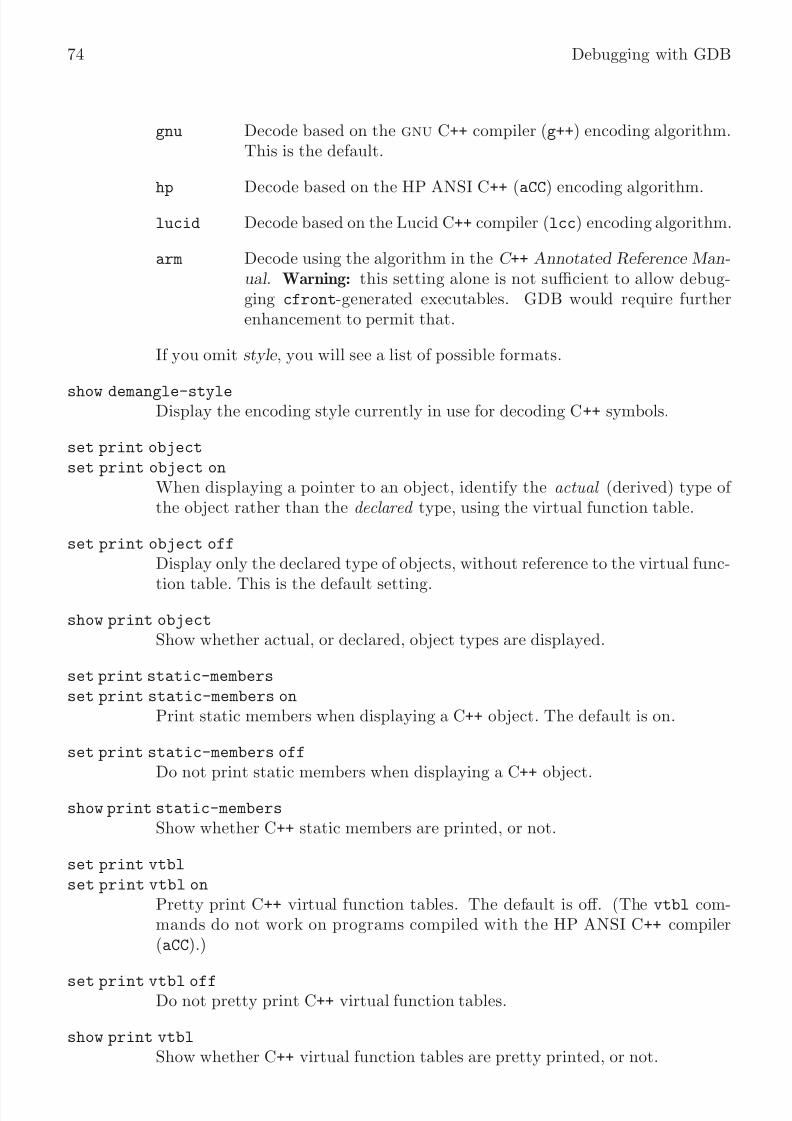
8/14/2019 Debugging With GDB - The GNU Source-Level Debugger
http://slidepdf.com/reader/full/debugging-with-gdb-the-gnu-source-level-debugger 85/328
74 Debugging with GDB
gnu Decode based on the gnu C++ compiler (g++) encoding algorithm.This is the default.
hp Decode based on the HP ANSI C++ (aCC) encoding algorithm.
lucid Decode based on the Lucid C++ compiler (lcc) encoding algorithm.
arm Decode using the algorithm in the C ++ Annotated Reference Man-ual . Warning: this setting alone is not sufficient to allow debug-ging cfront-generated executables. GDB would require furtherenhancement to permit that.
If you omit style , you will see a list of possible formats.
show demangle-styleDisplay the encoding style currently in use for decoding C++ symbols.
set print object
set print object on
When displaying a pointer to an object, identify the actual (derived) type of the object rather than the declared type, using the virtual function table.
set print object off
Display only the declared type of objects, without reference to the virtual func-
tion table. This is the default setting.
show print object
Show whether actual, or declared, object types are displayed.
set print static-members
set print static-members on
Print static members when displaying a C++ object. The default is on.
set print static-members off
Do not print static members when displaying a C++ object.
show print static-members
Show whether C++ static members are printed, or not.
set print vtbl
set print vtbl on
Pretty print C++ virtual function tables. The default is off. (The vtbl com-mands do not work on programs compiled with the HP ANSI C++ compiler(aCC).)
set print vtbl off
Do not pretty print C++ virtual function tables.
show print vtbl
Show whether C++ virtual function tables are pretty printed, or not.
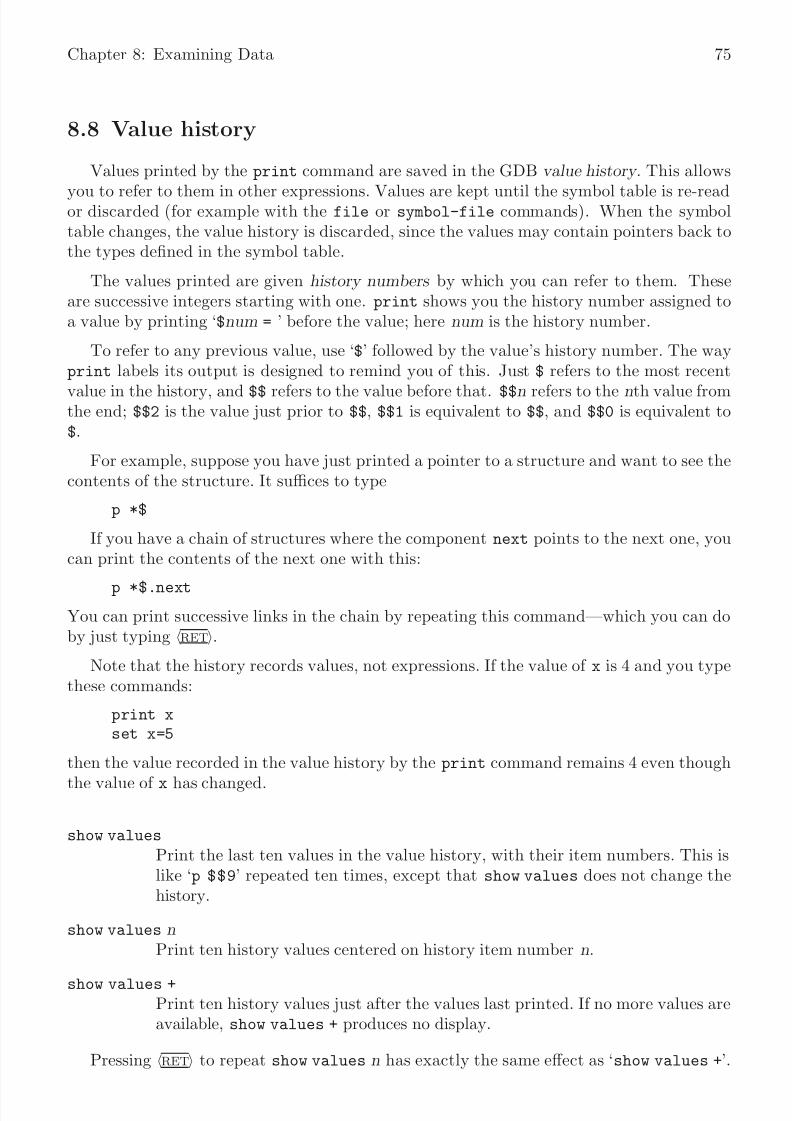
8/14/2019 Debugging With GDB - The GNU Source-Level Debugger
http://slidepdf.com/reader/full/debugging-with-gdb-the-gnu-source-level-debugger 86/328
Chapter 8: Examining Data 75
8.8 Value history
Values printed by the print command are saved in the GDB value history . This allows
you to refer to them in other expressions. Values are kept until the symbol table is re-reador discarded (for example with the file or symbol-file commands). When the symboltable changes, the value history is discarded, since the values may contain pointers back tothe types defined in the symbol table.
The values printed are given history numbers by which you can refer to them. Theseare successive integers starting with one. print shows you the history number assigned toa value by printing ‘$num = ’ before the value; here num is the history number.
To refer to any previous value, use ‘$’ followed by the value’s history number. The wayprint labels its output is designed to remind you of this. Just $ refers to the most recent
value in the history, and $$ refers to the value before that. $$n refers to the nth value fromthe end; $$2 is the value just prior to $$, $$1 is equivalent to $$, and $$0 is equivalent to$.
For example, suppose you have just printed a pointer to a structure and want to see thecontents of the structure. It suffices to type
p *$
If you have a chain of structures where the component next points to the next one, youcan print the contents of the next one with this:
p *$.next
You can print successive links in the chain by repeating this command—which you can doby just typing RET.
Note that the history records values, not expressions. If the value of x is 4 and you typethese commands:
print xset x=5
then the value recorded in the value history by the print command remains 4 even though
the value of x has changed.
show values
Print the last ten values in the value history, with their item numbers. This islike ‘p $$9’ repeated ten times, except that show values does not change thehistory.
show values nPrint ten history values centered on history item number n.
show values +
Print ten history values just after the values last printed. If no more values areavailable, show values + produces no display.
Pressing RET to repeat show values n has exactly the same effect as ‘show values +’.

8/14/2019 Debugging With GDB - The GNU Source-Level Debugger
http://slidepdf.com/reader/full/debugging-with-gdb-the-gnu-source-level-debugger 87/328
76 Debugging with GDB
8.9 Convenience variables
GDB provides convenience variables that you can use within GDB to hold on to a value
and refer to it later. These variables exist entirely within GDB; they are not part of yourprogram, and setting a convenience variable has no direct effect on further execution of yourprogram. That is why you can use them freely.
Convenience variables are prefixed with ‘$’. Any name preceded by ‘$’ can be used fora convenience variable, unless it is one of the predefined machine-specific register names(see Section 8.10 [Registers], page 77). (Value history references, in contrast, are numbers preceded by ‘$’. See Section 8.8 [Value history], page 75.)
You can save a value in a convenience variable with an assignment expression, just asyou would set a variable in your program. For example:
set $foo = *object_ptr
would save in $foo the value contained in the object pointed to by object_ptr.
Using a convenience variable for the first time creates it, but its value is void until youassign a new value. You can alter the value with another assignment at any time.
Convenience variables have no fixed types. You can assign a convenience variable anytype of value, including structures and arrays, even if that variable already has a value of a different type. The convenience variable, when used as an expression, has the type of itscurrent value.
show convenience
Print a list of convenience variables used so far, and their values. Abbreviatedshow conv.
One of the ways to use a convenience variable is as a counter to be incremented or apointer to be advanced. For example, to print a field from successive elements of an arrayof structures:
set $i = 0print bar[$i++]->contents
Repeat that command by typing RET.
Some convenience variables are created automatically by GDB and given values likelyto be useful.
$_ The variable $_ is automatically set by the x command to the last addressexamined (see Section 8.5 [Examining memory], page 67). Other commandswhich provide a default address for x to examine also set $_ to that address;these commands include info line and info breakpoint. The type of $_ isvoid * except when set by the x command, in which case it is a pointer to thetype of $__.
$__ The variable $__ is automatically set by the x command to the value found in
the last address examined. Its type is chosen to match the format in which thedata was printed.
$_exitcode
The variable $_exitcode is automatically set to the exit code when the programbeing debugged terminates.

8/14/2019 Debugging With GDB - The GNU Source-Level Debugger
http://slidepdf.com/reader/full/debugging-with-gdb-the-gnu-source-level-debugger 88/328
Chapter 8: Examining Data 77
On HP-UX systems, if you refer to a function or variable name that begins with a dollarsign, GDB searches for a user or system name first, before it searches for a conveniencevariable.
8.10 Registers
You can refer to machine register contents, in expressions, as variables with namesstarting with ‘$’. The names of registers are different for each machine; use info registers
to see the names used on your machine.
info registers
Print the names and values of all registers except floating-point registers (in
the selected stack frame).info all-registers
Print the names and values of all registers, including floating-point registers.
info registers regname ...
Print the relativized value of each specified register regname . As discussed indetail below, register values are normally relative to the selected stack frame.regname may be any register name valid on the machine you are using, with orwithout the initial ‘$’.
GDB has four “standard” register names that are available (in expressions) on mostmachines—whenever they do not conflict with an architecture’s canonical mnemonics forregisters. The register names $pc and $sp are used for the program counter register andthe stack pointer. $fp is used for a register that contains a pointer to the current stackframe, and $ps is used for a register that contains the processor status. For example, youcould print the program counter in hex with
p/x $pc
or print the instruction to be executed next with
x/i $pc
or add four to the stack pointer2
withset $sp += 4
Whenever possible, these four standard register names are available on your machineeven though the machine has different canonical mnemonics, so long as there is no conflict.The info registers command shows the canonical names. For example, on the SPARC,info registers displays the processor status register as $psr but you can also refer to itas $ps; and on x86-based machines $ps is an alias for the eflags register.
GDB always considers the contents of an ordinary register as an integer when the registeris examined in this way. Some machines have special registers which can hold nothing but
floating point; these registers are considered to have floating point values. There is no way
2 This is a way of removing one word from the stack, on machines where stacks grow downward in memory(most machines, nowadays). This assumes that the innermost stack frame is selected; setting $sp is notallowed when other stack frames are selected. To pop entire frames off the stack, regardless of machinearchitecture, use return; see Section 13.4 [Returning from a function], page 125.
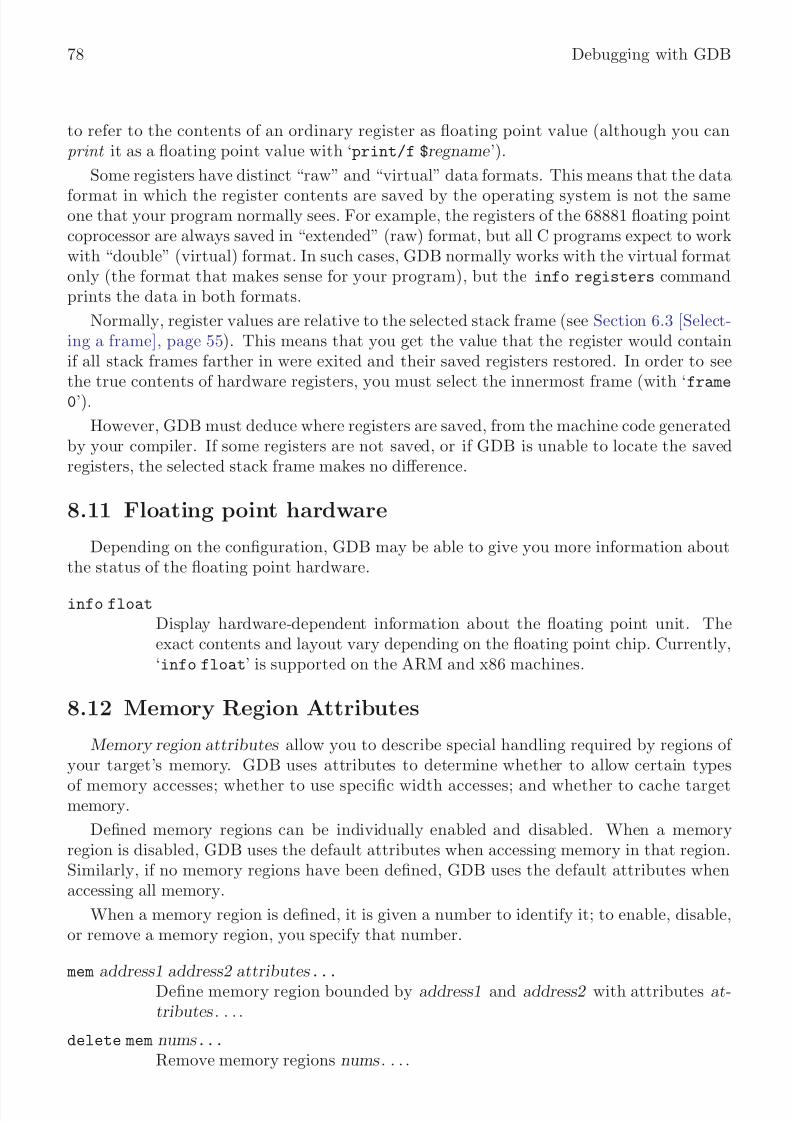
8/14/2019 Debugging With GDB - The GNU Source-Level Debugger
http://slidepdf.com/reader/full/debugging-with-gdb-the-gnu-source-level-debugger 89/328
78 Debugging with GDB
to refer to the contents of an ordinary register as floating point value (although you canprint it as a floating point value with ‘print/f $regname ’).
Some registers have distinct “raw” and “virtual” data formats. This means that the data
format in which the register contents are saved by the operating system is not the sameone that your program normally sees. For example, the registers of the 68881 floating pointcoprocessor are always saved in “extended” (raw) format, but all C programs expect to workwith “double” (virtual) format. In such cases, GDB normally works with the virtual formatonly (the format that makes sense for your program), but the info registers commandprints the data in both formats.
Normally, register values are relative to the selected stack frame (see Section 6.3 [Select-ing a frame], page 55). This means that you get the value that the register would containif all stack frames farther in were exited and their saved registers restored. In order to see
the true contents of hardware registers, you must select the innermost frame (with ‘frame0’).
However, GDB must deduce where registers are saved, from the machine code generatedby your compiler. If some registers are not saved, or if GDB is unable to locate the savedregisters, the selected stack frame makes no difference.
8.11 Floating point hardware
Depending on the configuration, GDB may be able to give you more information aboutthe status of the floating point hardware.
info float
Display hardware-dependent information about the floating point unit. Theexact contents and layout vary depending on the floating point chip. Currently,‘info float’ is supported on the ARM and x86 machines.
8.12 Memory Region Attributes
Memory region attributes allow you to describe special handling required by regions of your target’s memory. GDB uses attributes to determine whether to allow certain typesof memory accesses; whether to use specific width accesses; and whether to cache targetmemory.
Defined memory regions can be individually enabled and disabled. When a memoryregion is disabled, GDB uses the default attributes when accessing memory in that region.Similarly, if no memory regions have been defined, GDB uses the default attributes whenaccessing all memory.
When a memory region is defined, it is given a number to identify it; to enable, disable,or remove a memory region, you specify that number.
mem address1 address2 attributes ...Define memory region bounded by address1 and address2 with attributes at-tributes . . . .
delete mem nums ...
Remove memory regions nums . . . .
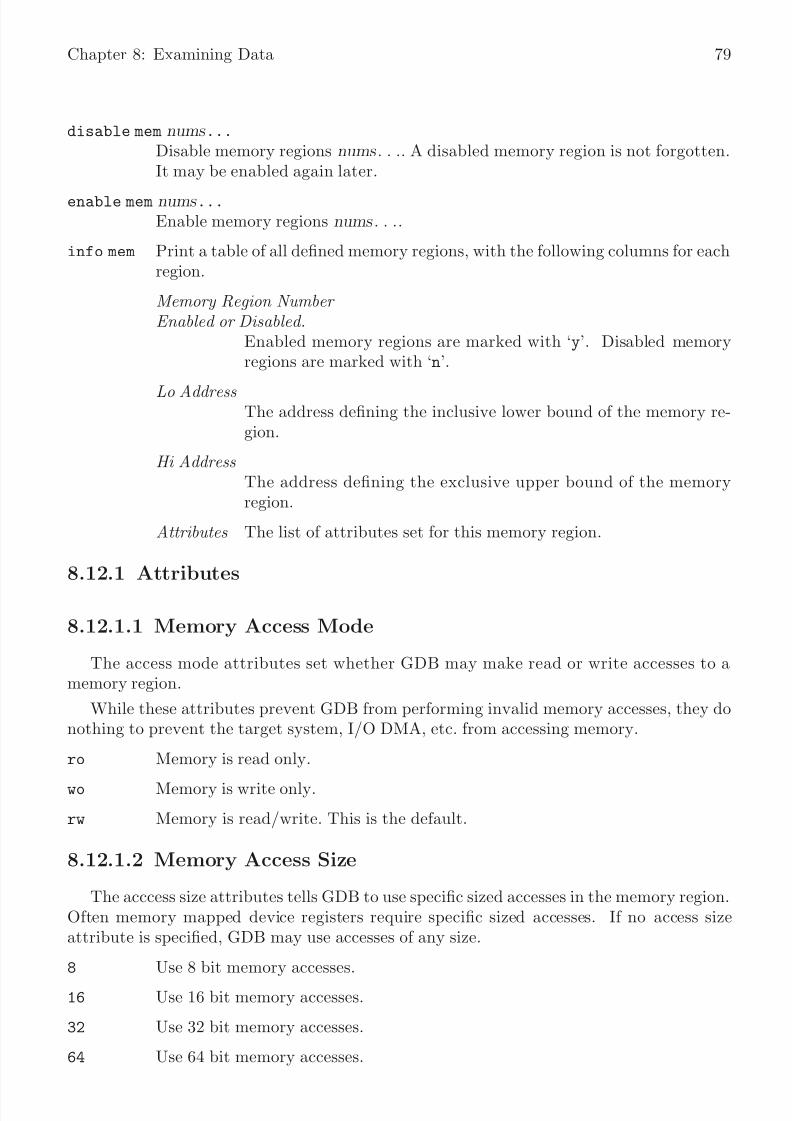
8/14/2019 Debugging With GDB - The GNU Source-Level Debugger
http://slidepdf.com/reader/full/debugging-with-gdb-the-gnu-source-level-debugger 90/328
Chapter 8: Examining Data 79
disable mem nums ...
Disable memory regions nums . . .. A disabled memory region is not forgotten.It may be enabled again later.
enable mem nums ...
Enable memory regions nums . . ..
info mem Print a table of all defined memory regions, with the following columns for eachregion.
Memory Region Number Enabled or Disabled.
Enabled memory regions are marked with ‘y’. Disabled memoryregions are marked with ‘n’.
Lo Address The address defining the inclusive lower bound of the memory re-gion.
Hi Address The address defining the exclusive upper bound of the memoryregion.
Attributes The list of attributes set for this memory region.
8.12.1 Attributes
8.12.1.1 Memory Access Mode
The access mode attributes set whether GDB may make read or write accesses to amemory region.
While these attributes prevent GDB from performing invalid memory accesses, they donothing to prevent the target system, I/O DMA, etc. from accessing memory.
ro Memory is read only.
wo Memory is write only.
rw Memory is read/write. This is the default.
8.12.1.2 Memory Access Size
The acccess size attributes tells GDB to use specific sized accesses in the memory region.Often memory mapped device registers require specific sized accesses. If no access sizeattribute is specified, GDB may use accesses of any size.
8 Use 8 bit memory accesses.16 Use 16 bit memory accesses.
32 Use 32 bit memory accesses.
64 Use 64 bit memory accesses.

8/14/2019 Debugging With GDB - The GNU Source-Level Debugger
http://slidepdf.com/reader/full/debugging-with-gdb-the-gnu-source-level-debugger 91/328
80 Debugging with GDB
8.12.1.3 Data Cache
The data cache attributes set whether GDB will cache target memory. While this gen-
erally improves performance by reducing debug protocol overhead, it can lead to incorrectresults because GDB does not know about volatile variables or memory mapped deviceregisters.
cache Enable GDB to cache target memory.
nocache Disable GDB from caching target memory. This is the default.

8/14/2019 Debugging With GDB - The GNU Source-Level Debugger
http://slidepdf.com/reader/full/debugging-with-gdb-the-gnu-source-level-debugger 92/328
Chapter 9: Tracepoints 81
9 Tracepoints
In some applications, it is not feasible for the debugger to interrupt the program’s ex-
ecution long enough for the developer to learn anything helpful about its behavior. If theprogram’s correctness depends on its real-time behavior, delays introduced by a debuggermight cause the program to change its behavior drastically, or perhaps fail, even when thecode itself is correct. It is useful to be able to observe the program’s behavior withoutinterrupting it.
Using GDB’s trace and collect commands, you can specify locations in the program,called tracepoints , and arbitrary expressions to evaluate when those tracepoints are reached.Later, using the tfind command, you can examine the values those expressions had whenthe program hit the tracepoints. The expressions may also denote objects in memory—structures or arrays, for example—whose values GDB should record; while visiting a partic-ular tracepoint, you may inspect those objects as if they were in memory at that moment.However, because GDB records these values without interacting with you, it can do soquickly and unobtrusively, hopefully not disturbing the program’s behavior.
The tracepoint facility is currently available only for remote targets. See Chapter 15[Targets], page 135. In addition, your remote target must know how to collect trace data.This functionality is implemented in the remote stub; however, none of the stubs distributedwith GDB support tracepoints as of this writing.
This chapter describes the tracepoint commands and features.
9.1 Commands to Set Tracepoints
Before running such a trace experiment, an arbitrary number of tracepoints can be set.Like a breakpoint (see Section 5.1.1 [Set Breaks], page 34), a tracepoint has a numberassigned to it by GDB. Like with breakpoints, tracepoint numbers are successive integersstarting from one. Many of the commands associated with tracepoints take the tracepointnumber as their argument, to identify which tracepoint to work on.
For each tracepoint, you can specify, in advance, some arbitrary set of data that youwant the target to collect in the trace buffer when it hits that tracepoint. The collected data
can include registers, local variables, or global data. Later, you can use GDB commands toexamine the values these data had at the time the tracepoint was hit.
This section describes commands to set tracepoints and associated conditions and ac-tions.
9.1.1 Create and Delete Tracepoints
trace The trace command is very similar to the break command. Its argument canbe a source line, a function name, or an address in the target program. SeeSection 5.1.1 [Set Breaks], page 34. The trace command defines a tracepoint,
which is a point in the target program where the debugger will briefly stop,collect some data, and then allow the program to continue. Setting a tracepointor changing its commands doesn’t take effect until the next tstart command;thus, you cannot change the tracepoint attributes once a trace experiment isrunning.
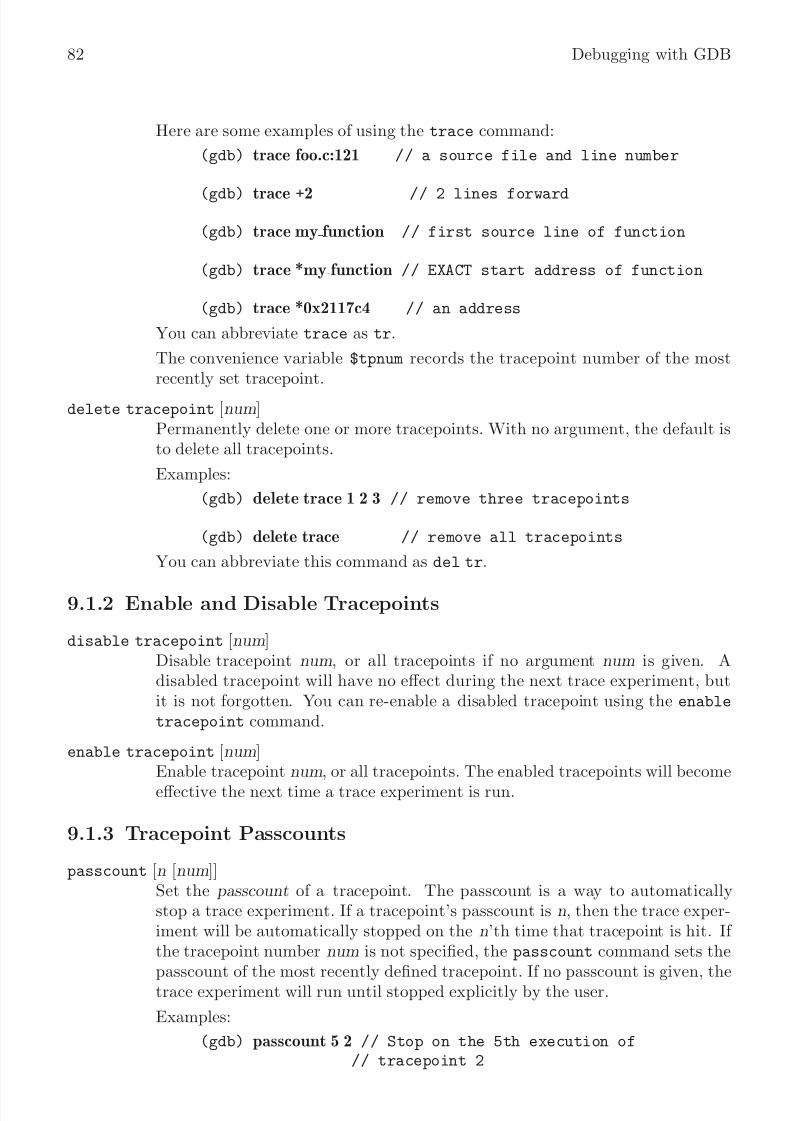
8/14/2019 Debugging With GDB - The GNU Source-Level Debugger
http://slidepdf.com/reader/full/debugging-with-gdb-the-gnu-source-level-debugger 93/328
82 Debugging with GDB
Here are some examples of using the trace command:
(gdb) trace foo.c:121 // a source file and line number
(gdb) trace +2 // 2 lines forward
(gdb) trace my function // first source line of function
(gdb) trace *my function // EXACT start address of function
(gdb) trace *0x2117c4 // an address
You can abbreviate trace as tr.
The convenience variable $tpnum records the tracepoint number of the mostrecently set tracepoint.
delete tracepoint [num]Permanently delete one or more tracepoints. With no argument, the default isto delete all tracepoints.
Examples:
(gdb) delete trace 1 2 3 // remove three tracepoints
(gdb) delete trace // remove all tracepoints
You can abbreviate this command as del tr.
9.1.2 Enable and Disable Tracepoints
disable tracepoint [num]Disable tracepoint num, or all tracepoints if no argument num is given. Adisabled tracepoint will have no effect during the next trace experiment, butit is not forgotten. You can re-enable a disabled tracepoint using the enable
tracepoint command.
enable tracepoint [num]
Enable tracepoint num, or all tracepoints. The enabled tracepoints will becomeeffective the next time a trace experiment is run.
9.1.3 Tracepoint Passcounts
passcount [n [num]]Set the passcount of a tracepoint. The passcount is a way to automaticallystop a trace experiment. If a tracepoint’s passcount is n, then the trace exper-iment will be automatically stopped on the n’th time that tracepoint is hit. If the tracepoint number num is not specified, the passcount command sets the
passcount of the most recently defined tracepoint. If no passcount is given, thetrace experiment will run until stopped explicitly by the user.
Examples:
(gdb) passcount 5 2 // Stop on the 5th execution of// tracepoint 2

8/14/2019 Debugging With GDB - The GNU Source-Level Debugger
http://slidepdf.com/reader/full/debugging-with-gdb-the-gnu-source-level-debugger 94/328
Chapter 9: Tracepoints 83
(gdb) passcount 12 // Stop on the 12th execution of the// most recently defined tracepoint.
(gdb) trace foo(gdb) pass 3(gdb) trace bar(gdb) pass 2(gdb) trace baz(gdb) pass 1 // Stop tracing when foo has been
// executed 3 times OR when bar has// been executed 2 times// OR when baz has been executed 1 time.
9.1.4 Tracepoint Action Lists
actions [num]This command will prompt for a list of actions to be taken when the tracepointis hit. If the tracepoint number num is not specified, this command sets theactions for the one that was most recently defined (so that you can define atracepoint and then say actions without bothering about its number). Youspecify the actions themselves on the following lines, one action at a time, andterminate the actions list with a line containing just end. So far, the only
defined actions are collect and while-stepping.
To remove all actions from a tracepoint, type ‘actions num’ and follow itimmediately with ‘end’.
(gdb) collect data // collect some data
(gdb) while-stepping 5 // single-step 5 times, collect data
(gdb) end // signals the end of actions.
In the following example, the action list begins with collect commands in-dicating the things to be collected when the tracepoint is hit. Then, in orderto single-step and collect additional data following the tracepoint, a while-
stepping command is used, followed by the list of things to be collected whilestepping. The while-stepping command is terminated by its own separateend command. Lastly, the action list is terminated by an end command.
(gdb) trace foo(gdb) actionsEnter actions for tracepoint 1, one per line:
> collect bar,baz> collect $regs> while-stepping 12
> collect $fp, $sp> end
end

8/14/2019 Debugging With GDB - The GNU Source-Level Debugger
http://slidepdf.com/reader/full/debugging-with-gdb-the-gnu-source-level-debugger 95/328
84 Debugging with GDB
collect expr1, expr2 , ...
Collect values of the given expressions when the tracepoint is hit. This com-mand accepts a comma-separated list of any valid expressions. In addition to
global, static, or local variables, the following special arguments are supported:$regs collect all registers
$args collect all function arguments
$locals collect all local variables.
You can give several consecutive collect commands, each one with a singleargument, or one collect command with several arguments separated by com-mas: the effect is the same.
The command info scope (see Chapter 12 [Symbols], page 119) is particularlyuseful for figuring out what data to collect.
while-stepping nPerform n single-step traces after the tracepoint, collecting new data at eachstep. The while-stepping command is followed by the list of what to collectwhile stepping (followed by its own end command):
> while-stepping 12> collect $regs, myglobal> end
>
You may abbreviate while-stepping as ws or stepping.
9.1.5 Listing Tracepoints
info tracepoints [num]Display information about the tracepoint num. If you don’t specify a tracepointnumber, displays information about all the tracepoints defined so far. For eachtracepoint, the following information is shown:
• its number
• whether it is enabled or disabled
• its address
• its passcount as given by the passcount n command
• its step count as given by the while-stepping n command
• where in the source files is the tracepoint set
• its action list as given by the actions command
(gdb) info traceNum Enb Address PassC StepC What
1 y 0x002117c4 0 0 <gdb_asm>2 y 0x0020dc64 0 0 in g_test at g_test.c:13753 y 0x0020b1f4 0 0 in get_data at ../foo.c:41(gdb)
This command can be abbreviated info tp.

8/14/2019 Debugging With GDB - The GNU Source-Level Debugger
http://slidepdf.com/reader/full/debugging-with-gdb-the-gnu-source-level-debugger 96/328
Chapter 9: Tracepoints 85
9.1.6 Starting and Stopping Trace Experiment
tstart This command takes no arguments. It starts the trace experiment, and begins
collecting data. This has the side effect of discarding all the data collected inthe trace buffer during the previous trace experiment.
tstop This command takes no arguments. It ends the trace experiment, and stopscollecting data.
Note: a trace experiment and data collection may stop automatically if anytracepoint’s passcount is reached (see Section 9.1.3 [Tracepoint Passcounts],page 82), or if the trace buffer becomes full.
tstatus This command displays the status of the current trace data collection.
Here is an example of the commands we described so far:
(gdb) trace gdb c test(gdb) actionsEnter actions for tracepoint #1, one per line.> collect $regs,$locals,$args> while-stepping 11
> collect $regs> end
> end(gdb) tstart[time passes ...](gdb) tstop
9.2 Using the collected data
After the tracepoint experiment ends, you use GDB commands for examining the tracedata. The basic idea is that each tracepoint collects a trace snapshot every time it is hit andanother snapshot every time it single-steps. All these snapshots are consecutively numberedfrom zero and go into a buffer, and you can examine them later. The way you examinethem is to focus on a specific trace snapshot. When the remote stub is focused on a trace
snapshot, it will respond to all GDB requests for memory and registers by reading fromthe buffer which belongs to that snapshot, rather than from real memory or registers of theprogram being debugged. This means that all GDB commands (print, info registers,backtrace, etc.) will behave as if we were currently debugging the program state as it waswhen the tracepoint occurred. Any requests for data that are not in the buffer will fail.
9.2.1 tfind n
The basic command for selecting a trace snapshot from the buffer is tfind n, which findstrace snapshot number n, counting from zero. If no argument n is given, the next snapshot
is selected.Here are the various forms of using the tfind command.
tfind start
Find the first snapshot in the buffer. This is a synonym for tfind 0 (since 0 isthe number of the first snapshot).
8/14/2019 Debugging With GDB - The GNU Source-Level Debugger
http://slidepdf.com/reader/full/debugging-with-gdb-the-gnu-source-level-debugger 97/328
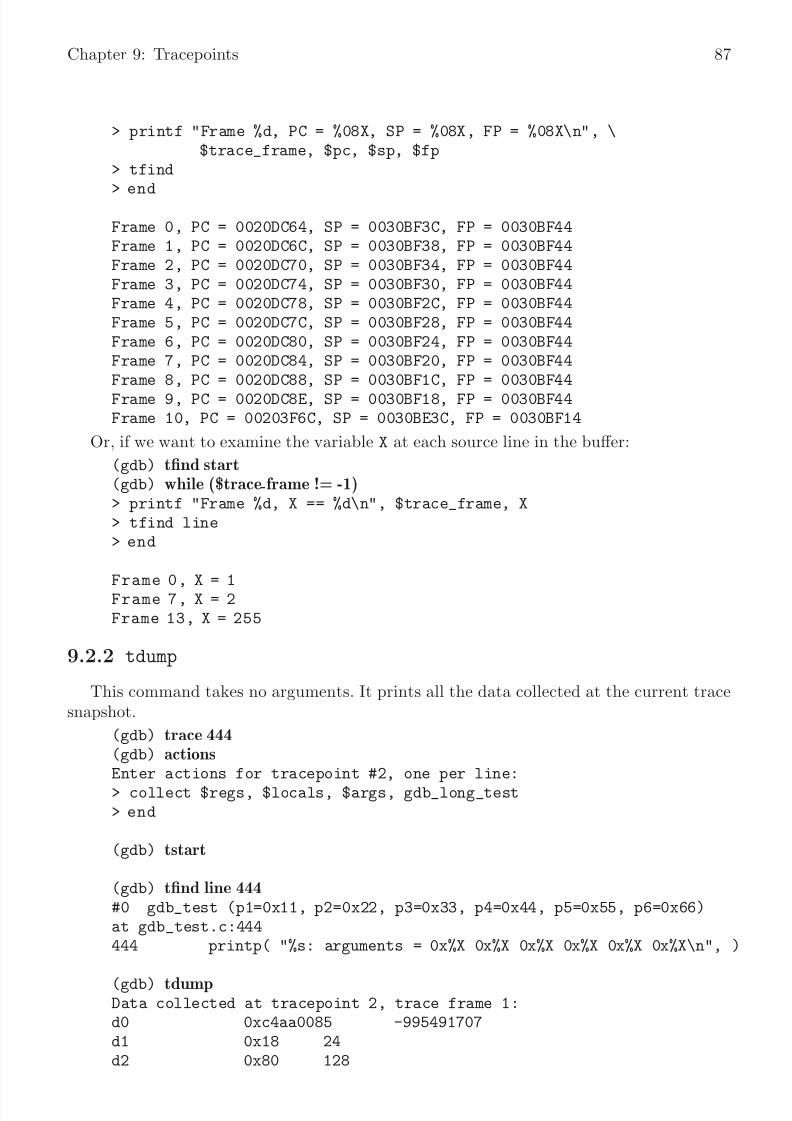
8/14/2019 Debugging With GDB - The GNU Source-Level Debugger
http://slidepdf.com/reader/full/debugging-with-gdb-the-gnu-source-level-debugger 98/328
Chapter 9: Tracepoints 87
> printf "Frame %d, PC = %08X, SP = %08X, FP = %08X\n", \$trace_frame, $pc, $sp, $fp
> tfind
> end
Frame 0, PC = 0020DC64, SP = 0030BF3C, FP = 0030BF44Frame 1, PC = 0020DC6C, SP = 0030BF38, FP = 0030BF44Frame 2, PC = 0020DC70, SP = 0030BF34, FP = 0030BF44Frame 3, PC = 0020DC74, SP = 0030BF30, FP = 0030BF44Frame 4, PC = 0020DC78, SP = 0030BF2C, FP = 0030BF44Frame 5, PC = 0020DC7C, SP = 0030BF28, FP = 0030BF44Frame 6, PC = 0020DC80, SP = 0030BF24, FP = 0030BF44Frame 7, PC = 0020DC84, SP = 0030BF20, FP = 0030BF44Frame 8, PC = 0020DC88, SP = 0030BF1C, FP = 0030BF44Frame 9, PC = 0020DC8E, SP = 0030BF18, FP = 0030BF44Frame 10, PC = 00203F6C, SP = 0030BE3C, FP = 0030BF14
Or, if we want to examine the variable X at each source line in the buffer:
(gdb) tfind start(gdb) while ($trace frame != -1)> printf "Frame %d, X == %d\n", $trace_frame, X> tfind line> end
Frame 0, X = 1Frame 7, X = 2Frame 13, X = 255
9.2.2 tdump
This command takes no arguments. It prints all the data collected at the current tracesnapshot.
(gdb) trace 444(gdb) actions
Enter actions for tracepoint #2, one per line:> collect $regs, $locals, $args, gdb_long_test> end
(gdb) tstart
(gdb) tfind line 444#0 gdb_test (p1=0x11, p2=0x22, p3=0x33, p4=0x44, p5=0x55, p6=0x66)at gdb_test.c:444444 printp( "%s: arguments = 0x%X 0x%X 0x%X 0x%X 0x%X 0x%X\n", )
(gdb) tdumpData collected at tracepoint 2, trace frame 1:d0 0xc4aa0085 -995491707d1 0x18 24d2 0x80 128

8/14/2019 Debugging With GDB - The GNU Source-Level Debugger
http://slidepdf.com/reader/full/debugging-with-gdb-the-gnu-source-level-debugger 99/328
88 Debugging with GDB
d3 0x33 51d4 0x71aea3d 119204413d5 0x22 34
d6 0xe0 224d7 0x380035 3670069a0 0x19e24a 1696330a1 0x3000668 50333288a2 0x100 256a3 0x322000 3284992a4 0x3000698 50333336a5 0x1ad3cc 1758156fp 0x30bf3c 0x30bf3csp 0x30bf34 0x30bf34ps 0x0 0pc 0x20b2c8 0x20b2c8fpcontrol 0x0 0fpstatus 0x0 0fpiaddr 0x0 0p = 0x20e5b4 "gdb-test"p1 = (void *) 0x11p2 = (void *) 0x22p3 = (void *) 0x33p4 = (void *) 0x44p5 = (void *) 0x55p6 = (void *) 0x66gdb_long_test = 17 ’\021’
(gdb)
9.2.3 save-tracepoints filename
This command saves all current tracepoint definitions together with their actions andpasscounts, into a file ‘filename ’ suitable for use in a later debugging session. To read thesaved tracepoint definitions, use the source command (see Section 19.3 [Command Files],page 173).
9.3 Convenience Variables for Tracepoints
(int) $trace_frame
The current trace snapshot (a.k.a. frame ) number, or -1 if no snapshot is se-lected.
(int) $tracepoint
The tracepoint for the current trace snapshot.
(int) $trace_line
The line number for the current trace snapshot.
(char []) $trace_file
The source file for the current trace snapshot.
8/14/2019 Debugging With GDB - The GNU Source-Level Debugger
http://slidepdf.com/reader/full/debugging-with-gdb-the-gnu-source-level-debugger 100/328
Chapter 9: Tracepoints 89
(char []) $trace_func
The name of the function containing $tracepoint.
Note: $trace_file is not suitable for use in printf, use output instead.
Here’s a simple example of using these convenience variables for stepping through all thetrace snapshots and printing some of their data.
(gdb) tfind start
(gdb) while $trace frame != -1> output $trace_file> printf ", line %d (tracepoint #%d)\n", $trace_line, $tracepoint> tfind> end

8/14/2019 Debugging With GDB - The GNU Source-Level Debugger
http://slidepdf.com/reader/full/debugging-with-gdb-the-gnu-source-level-debugger 101/328
90 Debugging with GDB
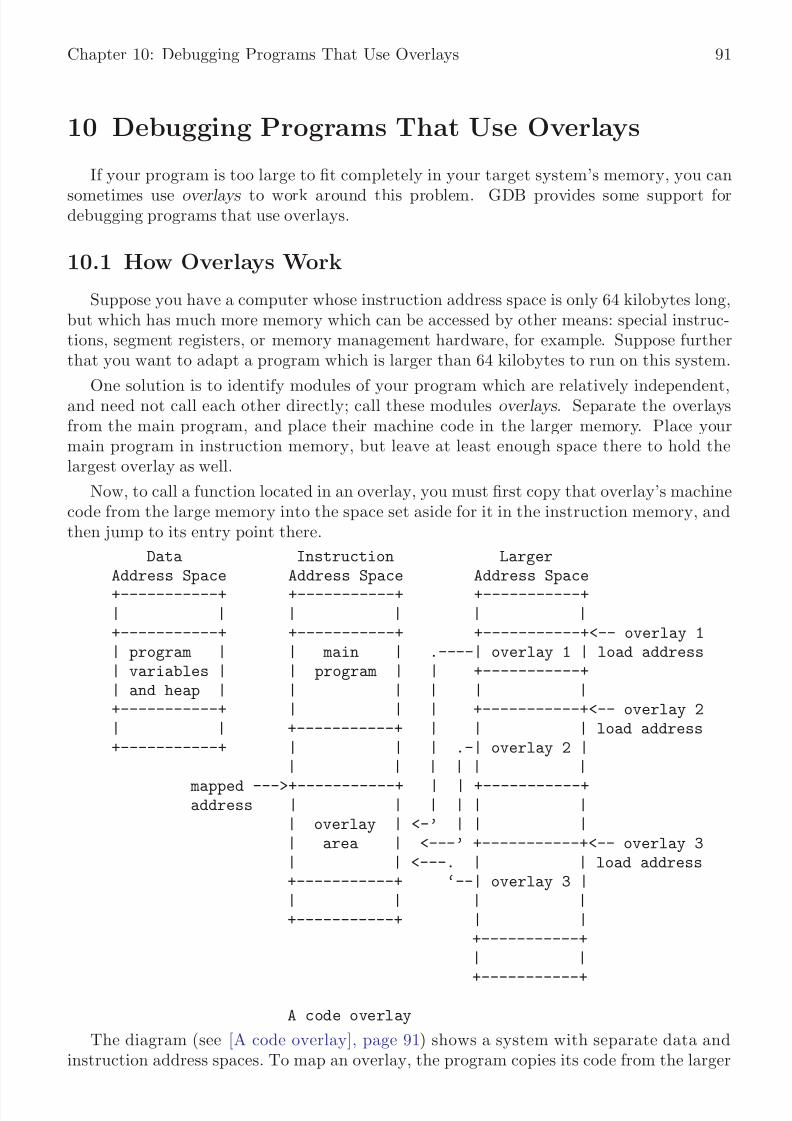
8/14/2019 Debugging With GDB - The GNU Source-Level Debugger
http://slidepdf.com/reader/full/debugging-with-gdb-the-gnu-source-level-debugger 102/328
Chapter 10: Debugging Programs That Use Overlays 91
10 Debugging Programs That Use Overlays
If your program is too large to fit completely in your target system’s memory, you can
sometimes use overlays to work around this problem. GDB provides some support fordebugging programs that use overlays.
10.1 How Overlays Work
Suppose you have a computer whose instruction address space is only 64 kilobytes long,but which has much more memory which can be accessed by other means: special instruc-tions, segment registers, or memory management hardware, for example. Suppose furtherthat you want to adapt a program which is larger than 64 kilobytes to run on this system.
One solution is to identify modules of your program which are relatively independent,and need not call each other directly; call these modules overlays . Separate the overlaysfrom the main program, and place their machine code in the larger memory. Place yourmain program in instruction memory, but leave at least enough space there to hold thelargest overlay as well.
Now, to call a function located in an overlay, you must first copy that overlay’s machinecode from the large memory into the space set aside for it in the instruction memory, andthen jump to its entry point there.
Data Instruction Larger
Address Space Address Space Address Space+-----------+ +-----------+ +-----------+| | | | | |+-----------+ +-----------+ +-----------+<-- overlay 1| program | | main | .----| overlay 1 | load address| variables | | program | | +-----------+| and heap | | | | | |+-----------+ | | | +-----------+<-- overlay 2| | +-----------+ | | | load address+-----------+ | | | .-| overlay 2 |
| | | | | | mapped --->+-----------+ | | +-----------+address | | | | | |
| overlay | <-’ | | || area | <---’ +-----------+<-- overlay 3| | <---. | | load address+-----------+ ‘--| overlay 3 || | | |+-----------+ | |
+-----------+| |
+-----------+
A code overlay
The diagram (see [A code overlay], page 91) shows a system with separate data andinstruction address spaces. To map an overlay, the program copies its code from the larger

8/14/2019 Debugging With GDB - The GNU Source-Level Debugger
http://slidepdf.com/reader/full/debugging-with-gdb-the-gnu-source-level-debugger 103/328

8/14/2019 Debugging With GDB - The GNU Source-Level Debugger
http://slidepdf.com/reader/full/debugging-with-gdb-the-gnu-source-level-debugger 104/328
Chapter 10: Debugging Programs That Use Overlays 93
memory address must be the overlay’s mapped and load addresses. Identifying overlayswith sections allows GDB to determine the appropriate address of a function or variable,depending on whether the overlay is mapped or not.
GDB’s overlay commands all start with the word overlay; you can abbreviate this asov or ovly. The commands are:
overlay off
Disable GDB’s overlay support. When overlay support is disabled, GDB as-sumes that all functions and variables are always present at their mapped ad-dresses. By default, GDB’s overlay support is disabled.
overlay manual
Enable manual overlay debugging. In this mode, GDB relies on you to tell itwhich overlays are mapped, and which are not, using the overlay map-overlay
and overlay unmap-overlay commands described below.
overlay map-overlay overlay overlay map overlay
Tell GDB that overlay is now mapped; overlay must be the name of the objectfile section containing the overlay. When an overlay is mapped, GDB assumes itcan find the overlay’s functions and variables at their mapped addresses. GDBassumes that any other overlays whose mapped ranges overlap that of overlay are now unmapped.
overlay unmap-overlay overlay overlay unmap overlay Tell GDB that overlay is no longer mapped; overlay must be the name of theobject file section containing the overlay. When an overlay is unmapped, GDBassumes it can find the overlay’s functions and variables at their load addresses.
overlay auto
Enable automatic overlay debugging. In this mode, GDB consults a data struc-ture the overlay manager maintains in the inferior to see which overlays aremapped. For details, see Section 10.3 [Automatic Overlay Debugging], page 94.
overlay load-targetoverlay load
Re-read the overlay table from the inferior. Normally, GDB re-reads the tableGDB automatically each time the inferior stops, so this command should onlybe necessary if you have changed the overlay mapping yourself using GDB. Thiscommand is only useful when using automatic overlay debugging.
overlay list-overlays
overlay list
Display a list of the overlays currently mapped, along with their mapped ad-
dresses, load addresses, and sizes.Normally, when GDB prints a code address, it includes the name of the function the
address falls in:
(gdb) print main$3 = {int ()} 0x11a0 <main>
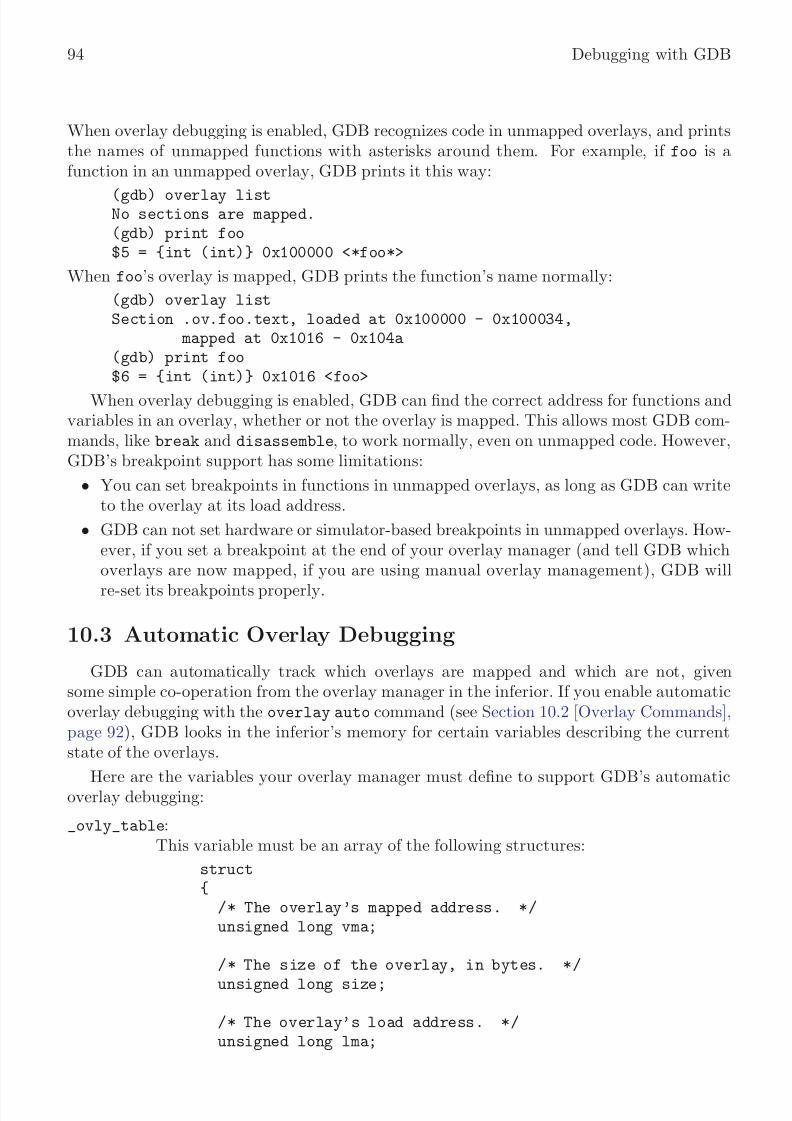
8/14/2019 Debugging With GDB - The GNU Source-Level Debugger
http://slidepdf.com/reader/full/debugging-with-gdb-the-gnu-source-level-debugger 105/328
94 Debugging with GDB
When overlay debugging is enabled, GDB recognizes code in unmapped overlays, and printsthe names of unmapped functions with asterisks around them. For example, if foo is afunction in an unmapped overlay, GDB prints it this way:
(gdb) overlay listNo sections are mapped.(gdb) print foo$5 = {int (int)} 0x100000 <*foo*>
When foo’s overlay is mapped, GDB prints the function’s name normally:
(gdb) overlay listSection .ov.foo.text, loaded at 0x100000 - 0x100034,
mapped at 0x1016 - 0x104a(gdb) print foo$6 = {int (int)} 0x1016 <foo>
When overlay debugging is enabled, GDB can find the correct address for functions andvariables in an overlay, whether or not the overlay is mapped. This allows most GDB com-mands, like break and disassemble, to work normally, even on unmapped code. However,GDB’s breakpoint support has some limitations:
• You can set breakpoints in functions in unmapped overlays, as long as GDB can writeto the overlay at its load address.
• GDB can not set hardware or simulator-based breakpoints in unmapped overlays. How-ever, if you set a breakpoint at the end of your overlay manager (and tell GDB whichoverlays are now mapped, if you are using manual overlay management), GDB willre-set its breakpoints properly.
10.3 Automatic Overlay Debugging
GDB can automatically track which overlays are mapped and which are not, givensome simple co-operation from the overlay manager in the inferior. If you enable automaticoverlay debugging with the overlay auto command (see Section 10.2 [Overlay Commands],page 92), GDB looks in the inferior’s memory for certain variables describing the currentstate of the overlays.
Here are the variables your overlay manager must define to support GDB’s automaticoverlay debugging:
_ovly_table:This variable must be an array of the following structures:
struct{
/* The overlay’s mapped address. */unsigned long vma;
/* The size of the overlay, in bytes. */unsigned long size;
/* The overlay’s load address. */unsigned long lma;
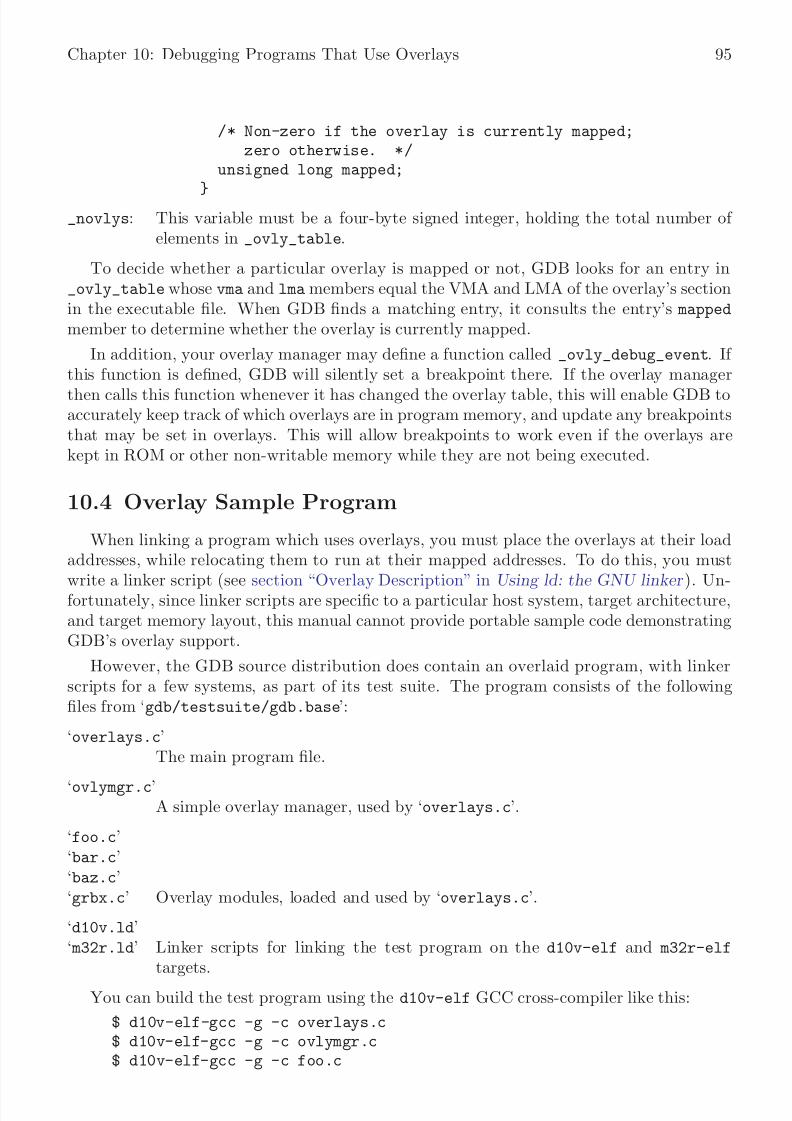
8/14/2019 Debugging With GDB - The GNU Source-Level Debugger
http://slidepdf.com/reader/full/debugging-with-gdb-the-gnu-source-level-debugger 106/328

8/14/2019 Debugging With GDB - The GNU Source-Level Debugger
http://slidepdf.com/reader/full/debugging-with-gdb-the-gnu-source-level-debugger 107/328
96 Debugging with GDB
$ d10v-elf-gcc -g -c bar.c$ d10v-elf-gcc -g -c baz.c$ d10v-elf-gcc -g -c grbx.c
$ d10v-elf-gcc -g overlays.o ovlymgr.o foo.o bar.o \baz.o grbx.o -Wl,-Td10v.ld -o overlays
The build process is identical for any other architecture, except that you must substitutethe appropriate compiler and linker script for the target system for d10v-elf-gcc andd10v.ld.
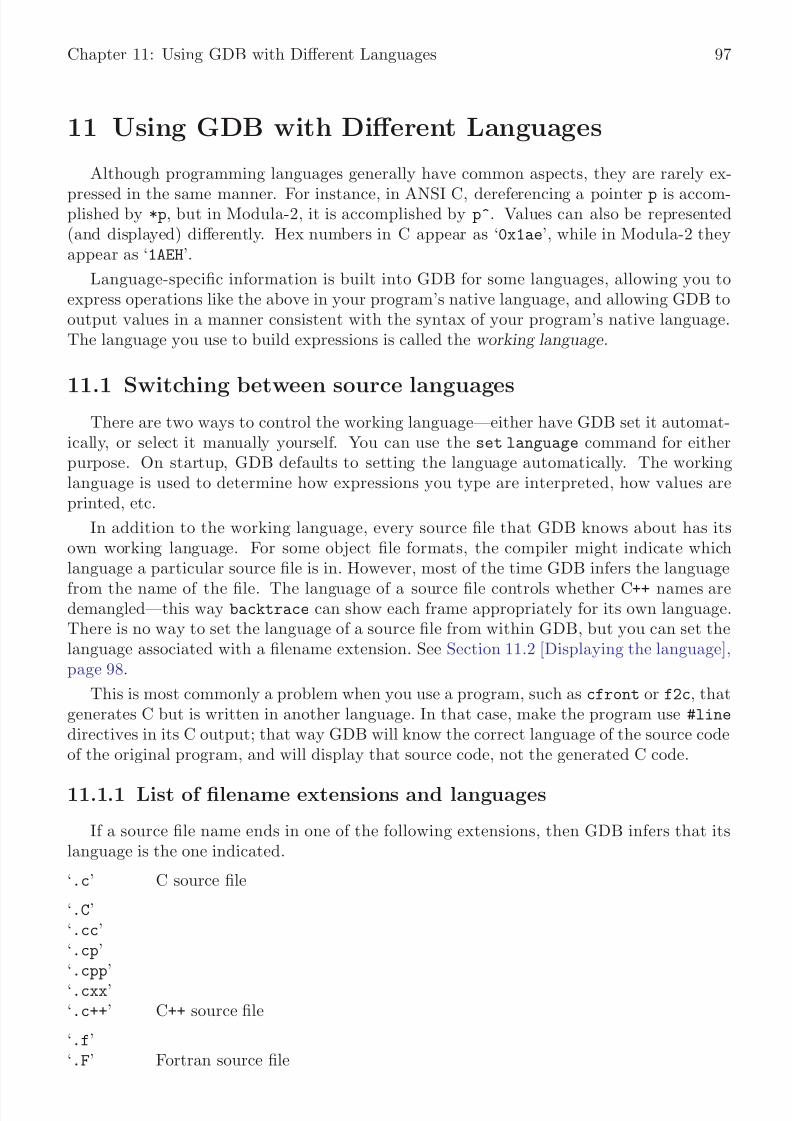
8/14/2019 Debugging With GDB - The GNU Source-Level Debugger
http://slidepdf.com/reader/full/debugging-with-gdb-the-gnu-source-level-debugger 108/328
Chapter 11: Using GDB with Different Languages 97
11 Using GDB with Different Languages
Although programming languages generally have common aspects, they are rarely ex-
pressed in the same manner. For instance, in ANSI C, dereferencing a pointer p is accom-plished by *p, but in Modula-2, it is accomplished by p^. Values can also be represented(and displayed) differently. Hex numbers in C appear as ‘0x1ae’, while in Modula-2 theyappear as ‘1AEH’.
Language-specific information is built into GDB for some languages, allowing you toexpress operations like the above in your program’s native language, and allowing GDB tooutput values in a manner consistent with the syntax of your program’s native language.The language you use to build expressions is called the working language .
11.1 Switching between source languagesThere are two ways to control the working language—either have GDB set it automat-
ically, or select it manually yourself. You can use the set language command for eitherpurpose. On startup, GDB defaults to setting the language automatically. The workinglanguage is used to determine how expressions you type are interpreted, how values areprinted, etc.
In addition to the working language, every source file that GDB knows about has itsown working language. For some object file formats, the compiler might indicate whichlanguage a particular source file is in. However, most of the time GDB infers the language
from the name of the file. The language of a source file controls whether C++ names aredemangled—this way backtrace can show each frame appropriately for its own language.There is no way to set the language of a source file from within GDB, but you can set thelanguage associated with a filename extension. See Section 11.2 [Displaying the language],page 98.
This is most commonly a problem when you use a program, such as cfront or f2c, thatgenerates C but is written in another language. In that case, make the program use #line
directives in its C output; that way GDB will know the correct language of the source codeof the original program, and will display that source code, not the generated C code.
11.1.1 List of filename extensions and languages
If a source file name ends in one of the following extensions, then GDB infers that itslanguage is the one indicated.
‘.c’ C source file
‘.C’‘.cc’‘.cp’
‘.cpp’‘.cxx’‘.c++’ C++ source file
‘.f’‘.F’ Fortran source file

8/14/2019 Debugging With GDB - The GNU Source-Level Debugger
http://slidepdf.com/reader/full/debugging-with-gdb-the-gnu-source-level-debugger 109/328
98 Debugging with GDB
‘.ch’‘.c186’‘.c286’ CHILL source file
‘.mod’ Modula-2 source file
‘.s’‘.S’ Assembler source file. This actually behaves almost like C, but GDB does not
skip over function prologues when stepping.
In addition, you may set the language associated with a filename extension. See Sec-tion 11.2 [Displaying the language], page 98.
11.1.2 Setting the working language
If you allow GDB to set the language automatically, expressions are interpreted the sameway in your debugging session and your program.
If you wish, you may set the language manually. To do this, issue the command ‘set
language lang ’, where lang is the name of a language, such as c or modula-2. For a list of the supported languages, type ‘set language’.
Setting the language manually prevents GDB from updating the working language au-tomatically. This can lead to confusion if you try to debug a program when the workinglanguage is not the same as the source language, when an expression is acceptable to bothlanguages—but means different things. For instance, if the current source file were written
in C, and GDB was parsing Modula-2, a command such as:print a = b + c
might not have the effect you intended. In C, this means to add b and c and place theresult in a. The result printed would be the value of a. In Modula-2, this means to comparea to the result of b+c, yielding a BOOLEAN value.
11.1.3 Having GDB infer the source language
To have GDB set the working language automatically, use ‘set language local’ or ‘set
language auto’. GDB then infers the working language. That is, when your program stopsin a frame (usually by encountering a breakpoint), GDB sets the working language to thelanguage recorded for the function in that frame. If the language for a frame is unknown(that is, if the function or block corresponding to the frame was defined in a source file thatdoes not have a recognized extension), the current working language is not changed, andGDB issues a warning.
This may not seem necessary for most programs, which are written entirely in one sourcelanguage. However, program modules and libraries written in one source language can beused by a main program written in a different source language. Using ‘set language auto’in this case frees you from having to set the working language manually.
11.2 Displaying the language
The following commands help you find out which language is the working language, andalso what language source files were written in.
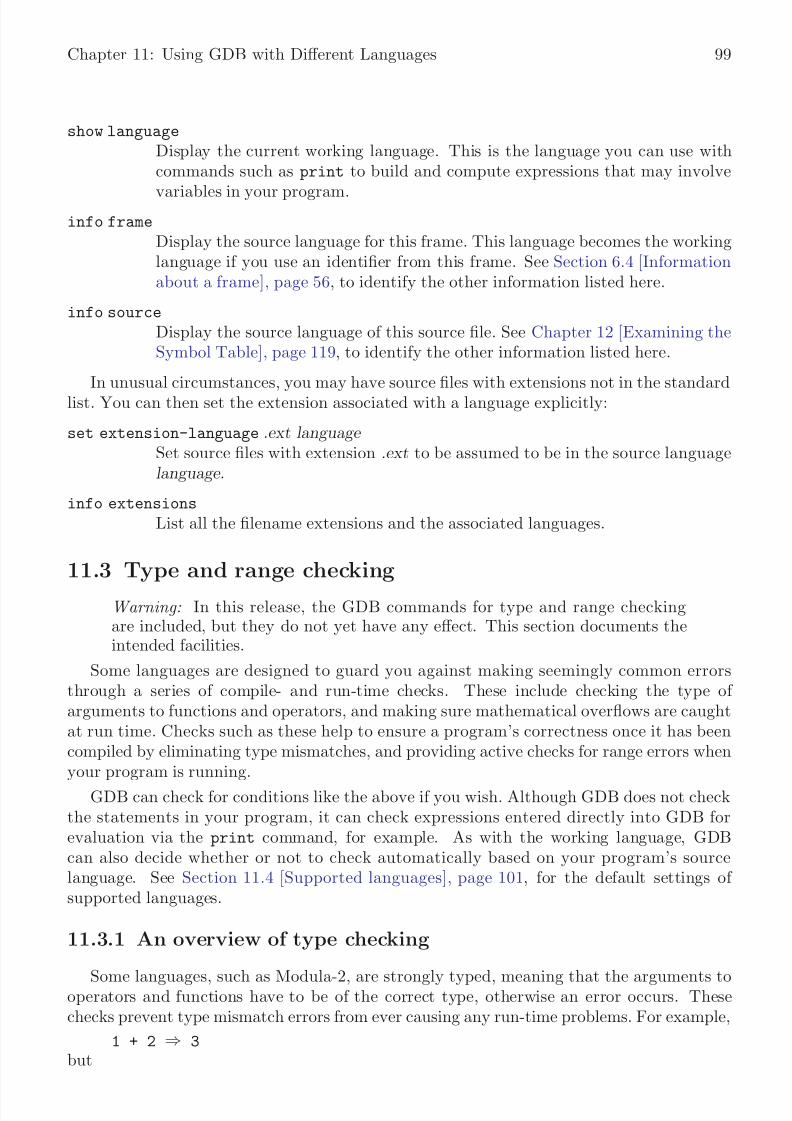
8/14/2019 Debugging With GDB - The GNU Source-Level Debugger
http://slidepdf.com/reader/full/debugging-with-gdb-the-gnu-source-level-debugger 110/328
Chapter 11: Using GDB with Different Languages 99
show language
Display the current working language. This is the language you can use withcommands such as print to build and compute expressions that may involve
variables in your program.info frame
Display the source language for this frame. This language becomes the workinglanguage if you use an identifier from this frame. See Section 6.4 [Informationabout a frame], page 56, to identify the other information listed here.
info source
Display the source language of this source file. See Chapter 12 [Examining theSymbol Table], page 119, to identify the other information listed here.
In unusual circumstances, you may have source files with extensions not in the standardlist. You can then set the extension associated with a language explicitly:
set extension-language .ext language Set source files with extension .ext to be assumed to be in the source languagelanguage .
info extensions
List all the filename extensions and the associated languages.
11.3 Type and range checking
Warning: In this release, the GDB commands for type and range checkingare included, but they do not yet have any effect. This section documents theintended facilities.
Some languages are designed to guard you against making seemingly common errorsthrough a series of compile- and run-time checks. These include checking the type of arguments to functions and operators, and making sure mathematical overflows are caughtat run time. Checks such as these help to ensure a program’s correctness once it has beencompiled by eliminating type mismatches, and providing active checks for range errors when
your program is running.GDB can check for conditions like the above if you wish. Although GDB does not check
the statements in your program, it can check expressions entered directly into GDB forevaluation via the print command, for example. As with the working language, GDBcan also decide whether or not to check automatically based on your program’s sourcelanguage. See Section 11.4 [Supported languages], page 101, for the default settings of supported languages.
11.3.1 An overview of type checking
Some languages, such as Modula-2, are strongly typed, meaning that the arguments tooperators and functions have to be of the correct type, otherwise an error occurs. Thesechecks prevent type mismatch errors from ever causing any run-time problems. For example,
1 + 2 ⇒ 3but
8/14/2019 Debugging With GDB - The GNU Source-Level Debugger
http://slidepdf.com/reader/full/debugging-with-gdb-the-gnu-source-level-debugger 111/328
100 Debugging with GDB
error 1 + 2.3
The second example fails because the CARDINAL 1 is not type-compatible with the REAL
2.3.
For the expressions you use in GDB commands, you can tell the GDB type checker toskip checking; to treat any mismatches as errors and abandon the expression; or to onlyissue warnings when type mismatches occur, but evaluate the expression anyway. Whenyou choose the last of these, GDB evaluates expressions like the second example above, butalso issues a warning.
Even if you turn type checking off, there may be other reasons related to type thatprevent GDB from evaluating an expression. For instance, GDB does not know how toadd an int and a struct foo. These particular type errors have nothing to do with thelanguage in use, and usually arise from expressions, such as the one described above, which
make little sense to evaluate anyway.
Each language defines to what degree it is strict about type. For instance, both Modula-2 and C require the arguments to arithmetical operators to be numbers. In C, enumeratedtypes and pointers can be represented as numbers, so that they are valid arguments tomathematical operators. See Section 11.4 [Supported languages], page 101, for furtherdetails on specific languages.
GDB provides some additional commands for controlling the type checker:
set check type auto
Set type checking on or off based on the current working language. See Sec-tion 11.4 [Supported languages], page 101, for the default settings for eachlanguage.
set check type on
set check type off
Set type checking on or off, overriding the default setting for the current workinglanguage. Issue a warning if the setting does not match the language default.If any type mismatches occur in evaluating an expression while type checkingis on, GDB prints a message and aborts evaluation of the expression.
set check type warn
Cause the type checker to issue warnings, but to always attempt to evaluate theexpression. Evaluating the expression may still be impossible for other reasons.For example, GDB cannot add numbers and structures.
show type Show the current setting of the type checker, and whether or not GDB is settingit automatically.
11.3.2 An overview of range checking
In some languages (such as Modula-2), it is an error to exceed the bounds of a type;this is enforced with run-time checks. Such range checking is meant to ensure programcorrectness by making sure computations do not overflow, or indices on an array elementaccess do not exceed the bounds of the array.
8/14/2019 Debugging With GDB - The GNU Source-Level Debugger
http://slidepdf.com/reader/full/debugging-with-gdb-the-gnu-source-level-debugger 112/328

8/14/2019 Debugging With GDB - The GNU Source-Level Debugger
http://slidepdf.com/reader/full/debugging-with-gdb-the-gnu-source-level-debugger 113/328

8/14/2019 Debugging With GDB - The GNU Source-Level Debugger
http://slidepdf.com/reader/full/debugging-with-gdb-the-gnu-source-level-debugger 114/328

8/14/2019 Debugging With GDB - The GNU Source-Level Debugger
http://slidepdf.com/reader/full/debugging-with-gdb-the-gnu-source-level-debugger 115/328
104 Debugging with GDB
11.4.1.2 C and C++ constants
GDB allows you to express the constants of C and C++ in the following ways:
• Integer constants are a sequence of digits. Octal constants are specified by a leading‘0’ (i.e. zero), and hexadecimal constants by a leading ‘0x’ or ‘0X’. Constants may alsoend with a letter ‘l’, specifying that the constant should be treated as a long value.
• Floating point constants are a sequence of digits, followed by a decimal point, followedby a sequence of digits, and optionally followed by an exponent. An exponent is of the form: ‘e[[+]|-]nnn’, where nnn is another sequence of digits. The ‘+’ is optionalfor positive exponents. A floating-point constant may also end with a letter ‘f’ or ‘F’,specifying that the constant should be treated as being of the float (as opposed to thedefault double) type; or with a letter ‘l’ or ‘L’, which specifies a long double constant.
• Enumerated constants consist of enumerated identifiers, or their integral equivalents.
• Character constants are a single character surrounded by single quotes (’), or anumber—the ordinal value of the corresponding character (usually its ascii value).Within quotes, the single character may be represented by a letter or by escape sequences , which are of the form ‘\nnn’, where nnn is the octal representation of the character’s ordinal value; or of the form ‘\x ’, where ‘x ’ is a predefined specialcharacter—for example, ‘\n’ for newline.
• String constants are a sequence of character constants surrounded by double quotes (").Any valid character constant (as described above) may appear. Double quotes withinthe string must be preceded by a backslash, so for instance ‘"a\"b’c"’ is a string of
five characters.• Pointer constants are an integral value. You can also write pointers to constants using
the C operator ‘&’.
• Array constants are comma-separated lists surrounded by braces ‘{’ and ‘}’; for ex-ample, ‘{1,2,3}’ is a three-element array of integers, ‘{{1,2}, {3,4}, {5,6}}’ is athree-by-two array, and ‘{&"hi", &"there", &"fred"}’ is a three-element array of pointers.
11.4.1.3 C++ expressions
GDB expression handling can interpret most C++ expressions.
Warning: GDB can only debug C++ code if you use the proper compiler. Typ-ically, C++ debugging depends on the use of additional debugging informationin the symbol table, and thus requires special support. In particular, if yourcompiler generates a.out, MIPS ecoff, RS/6000 xcoff, or elf with stabs ex-tensions to the symbol table, these facilities are all available. (With gnu CC,you can use the ‘-gstabs’ option to request stabs debugging extensions explic-itly.) Where the object code format is standard coff or dwarf in elf, on theother hand, most of the C++ support in GDB does not work.
1. Member function calls are allowed; you can use expressions likecount = aml->GetOriginal(x, y)
2. While a member function is active (in the selected stack frame), your expressions havethe same namespace available as the member function; that is, GDB allows implicitreferences to the class instance pointer this following the same rules as C++.

8/14/2019 Debugging With GDB - The GNU Source-Level Debugger
http://slidepdf.com/reader/full/debugging-with-gdb-the-gnu-source-level-debugger 116/328
Chapter 11: Using GDB with Different Languages 105
3. You can call overloaded functions; GDB resolves the function call to the right definition,with some restrictions. GDB does not perform overload resolution involving user-defined type conversions, calls to constructors, or instantiations of templates that do not
exist in the program. It also cannot handle ellipsis argument lists or default arguments.It does perform integral conversions and promotions, floating-point promotions, arith-metic conversions, pointer conversions, conversions of class objects to base classes, andstandard conversions such as those of functions or arrays to pointers; it requires anexact match on the number of function arguments.
Overload resolution is always performed, unless you have specified set overload-
resolution off. See Section 11.4.1.7 [GDB features for C++], page 106.
You must specify set overload-resolution off in order to use an explicit functionsignature to call an overloaded function, as in
p ’foo(char,int)’(’x’, 13)
The GDB command-completion facility can simplify this; see Section 3.2 [Commandcompletion], page 17.
4. GDB understands variables declared as C++ references; you can use them in expressions just as you do in C++ source—they are automatically dereferenced.
In the parameter list shown when GDB displays a frame, the values of reference vari-ables are not displayed (unlike other variables); this avoids clutter, since references areoften used for large structures. The address of a reference variable is always shown,unless you have specified ‘set print address off’.
5. GDB supports the C++ name resolution operator ::—your expressions can use it just asexpressions in your program do. Since one scope may be defined in another, you can use:: repeatedly if necessary, for example in an expression like ‘scope1::scope2 ::name ’.GDB also allows resolving name scope by reference to source files, in both C and C++
debugging (see Section 8.2 [Program variables], page 64).
In addition, when used with HP’s C++ compiler, GDB supports calling virtual functionscorrectly, printing out virtual bases of objects, calling functions in a base subobject, castingobjects, and invoking user-defined operators.
11.4.1.4 C and C++ defaults
If you allow GDB to set type and range checking automatically, they both default to off
whenever the working language changes to C or C++. This happens regardless of whetheryou or GDB selects the working language.
If you allow GDB to set the language automatically, it recognizes source files whosenames end with ‘.c’, ‘.C’, or ‘.cc’, etc, and when GDB enters code compiled from one of these files, it sets the working language to C or C++. See Section 11.1.3 [Having GDB inferthe source language], page 98, for further details.
11.4.1.5 C and C++ type and range checks
By default, when GDB parses C or C++ expressions, type checking is not used. However,if you turn type checking on, GDB considers two variables type equivalent if:
8/14/2019 Debugging With GDB - The GNU Source-Level Debugger
http://slidepdf.com/reader/full/debugging-with-gdb-the-gnu-source-level-debugger 117/328
106 Debugging with GDB
• The two variables are structured and have the same structure, union, or enumeratedtag.
• The two variables have the same type name, or types that have been declared equivalent
through typedef.Range checking, if turned on, is done on mathematical operations. Array indices are not
checked, since they are often used to index a pointer that is not itself an array.
11.4.1.6 GDB and C
The set print union and show print union commands apply to the union type. Whenset to ‘on’, any union that is inside a struct or class is also printed. Otherwise, it appearsas ‘{...}’.
The @ operator aids in the debugging of dynamic arrays, formed with pointers and amemory allocation function. See Section 8.1 [Expressions], page 63.
11.4.1.7 GDB features for C++
Some GDB commands are particularly useful with C++, and some are designed specifi-cally for use with C++. Here is a summary:
breakpoint menusWhen you want a breakpoint in a function whose name is overloaded, GDBbreakpoint menus help you specify which function definition you want. See
Section 5.1.8 [Breakpoint menus], page 44.rbreak regex
Setting breakpoints using regular expressions is helpful for setting breakpointson overloaded functions that are not members of any special classes. See Sec-tion 5.1.1 [Setting breakpoints], page 34.
catch throw
catch catch
Debug C++ exception handling using these commands. See Section 5.1.3 [Set-ting catchpoints], page 39.
ptype typename Print inheritance relationships as well as other information for type typename .See Chapter 12 [Examining the Symbol Table], page 119.
set print demangle
show print demangle
set print asm-demangle
show print asm-demangle
Control whether C++ symbols display in their source form, both when displayingcode as C++ source and when displaying disassemblies. See Section 8.7 [Print
settings], page 70.set print object
show print object
Choose whether to print derived (actual) or declared types of objects. SeeSection 8.7 [Print settings], page 70.

8/14/2019 Debugging With GDB - The GNU Source-Level Debugger
http://slidepdf.com/reader/full/debugging-with-gdb-the-gnu-source-level-debugger 118/328
Chapter 11: Using GDB with Different Languages 107
set print vtbl
show print vtbl
Control the format for printing virtual function tables. See Section 8.7 [Print
settings], page 70. (The vtbl commands do not work on programs compiledwith the HP ANSI C++ compiler (aCC).)
set overload-resolution on
Enable overload resolution for C++ expression evaluation. The default is on.For overloaded functions, GDB evaluates the arguments and searches for afunction whose signature matches the argument types, using the standard C++
conversion rules (see Section 11.4.1.3 [C++ expressions], page 104, for details).If it cannot find a match, it emits a message.
set overload-resolution off
Disable overload resolution for C++ expression evaluation. For overloaded func-tions that are not class member functions, GDB chooses the first function of the specified name that it finds in the symbol table, whether or not its argu-ments are of the correct type. For overloaded functions that are class memberfunctions, GDB searches for a function whose signature exactly matches theargument types.
Overloaded symbol namesYou can specify a particular definition of an overloaded symbol, using the samenotation that is used to declare such symbols in C++: type symbol (types ) rather
than just symbol . You can also use the GDB command-line word completionfacilities to list the available choices, or to finish the type list for you. SeeSection 3.2 [Command completion], page 17, for details on how to do this.
11.4.2 Modula-2
The extensions made to GDB to support Modula-2 only support output from the gnuModula-2 compiler (which is currently being developed). Other Modula-2 compilers are notcurrently supported, and attempting to debug executables produced by them is most likelyto give an error as GDB reads in the executable’s symbol table.
11.4.2.1 Operators
Operators must be defined on values of specific types. For instance, + is defined onnumbers, but not on structures. Operators are often defined on groups of types. For thepurposes of Modula-2, the following definitions hold:
• Integral types consist of INTEGER, CARDINAL, and their subranges.
• Character types consist of CHAR and its subranges.
• Floating-point types consist of REAL.
• Pointer types consist of anything declared as POINTER TO type .
• Scalar types consist of all of the above.
• Set types consist of SET and BITSET types.
• Boolean types consist of BOOLEAN.
8/14/2019 Debugging With GDB - The GNU Source-Level Debugger
http://slidepdf.com/reader/full/debugging-with-gdb-the-gnu-source-level-debugger 119/328
108 Debugging with GDB
The following operators are supported, and appear in order of increasing precedence:
, Function argument or array index separator.
:= Assignment. The value of var := value is value .
<, > Less than, greater than on integral, floating-point, or enumerated types.
<=, >= Less than or equal to, greater than or equal to on integral, floating-point andenumerated types, or set inclusion on set types. Same precedence as <.
=, <>, # Equality and two ways of expressing inequality, valid on scalar types. Sameprecedence as <. In GDB scripts, only <> is available for inequality, since #
conflicts with the script comment character.
IN Set membership. Defined on set types and the types of their members. Sameprecedence as <.
OR Boolean disjunction. Defined on boolean types.
AND, & Boolean conjunction. Defined on boolean types.
@ The GDB “artificial array” operator (see Section 8.1 [Expressions], page 63).
+, - Addition and subtraction on integral and floating-point types, or union anddifference on set types.
* Multiplication on integral and floating-point types, or set intersection on settypes.
/ Division on floating-point types, or symmetric set difference on set types. Sameprecedence as *.
DIV, MOD Integer division and remainder. Defined on integral types. Same precedence as*.
- Negative. Defined on INTEGER and REAL data.
^ Pointer dereferencing. Defined on pointer types.
NOT Boolean negation. Defined on boolean types. Same precedence as ^.
. RECORD field selector. Defined on RECORD data. Same precedence as ^.
[] Array indexing. Defined on ARRAY data. Same precedence as ^.
() Procedure argument list. Defined on PROCEDURE objects. Same precedence as^.
::, . GDB and Modula-2 scope operators.
Warning: Sets and their operations are not yet supported, so GDB treats theuse of the operator IN, or the use of operators +, -, *, /, =, , <>, #, <=, and >=on sets as an error.

8/14/2019 Debugging With GDB - The GNU Source-Level Debugger
http://slidepdf.com/reader/full/debugging-with-gdb-the-gnu-source-level-debugger 120/328
Chapter 11: Using GDB with Different Languages 109
11.4.2.2 Built-in functions and procedures
Modula-2 also makes available several built-in procedures and functions. In describing
these, the following metavariables are used:a represents an ARRAY variable.
c represents a CHAR constant or variable.
i represents a variable or constant of integral type.
m represents an identifier that belongs to a set. Generally used in the same func-tion with the metavariable s . The type of s should be SET OF mtype (wheremtype is the type of m).
n represents a variable or constant of integral or floating-point type.
r represents a variable or constant of floating-point type.
t represents a type.
v represents a variable.
x represents a variable or constant of one of many types. See the explanation of the function for details.
All Modula-2 built-in procedures also return a result, described below.
ABS(n) Returns the absolute value of n.
CAP(c ) If c is a lower case letter, it returns its upper case equivalent, otherwise itreturns its argument.
CHR(i ) Returns the character whose ordinal value is i .
DEC(v ) Decrements the value in the variable v by one. Returns the new value.
DEC(v ,i ) Decrements the value in the variable v by i . Returns the new value.
EXCL(m,s )Removes the element m from the set s . Returns the new set.
FLOAT(i ) Returns the floating point equivalent of the integer i .
HIGH(a ) Returns the index of the last member of a .
INC(v ) Increments the value in the variable v by one. Returns the new value.
INC(v ,i ) Increments the value in the variable v by i . Returns the new value.
INCL(m,s )Adds the element m to the set s if it is not already there. Returns the new set.
MAX(t) Returns the maximum value of the type t.
MIN(t) Returns the minimum value of the type t.
ODD(i ) Returns boolean TRUE if i is an odd number.ORD(x ) Returns the ordinal value of its argument. For example, the ordinal value of a
character is its ascii value (on machines supporting the ascii character set). x must be of an ordered type, which include integral, character and enumeratedtypes.

8/14/2019 Debugging With GDB - The GNU Source-Level Debugger
http://slidepdf.com/reader/full/debugging-with-gdb-the-gnu-source-level-debugger 121/328
110 Debugging with GDB
SIZE(x ) Returns the size of its argument. x can be a variable or a type.
TRUNC(r ) Returns the integral part of r .
VAL(t,i ) Returns the member of the type t whose ordinal value is i .Warning: Sets and their operations are not yet supported, so GDB treats theuse of procedures INCL and EXCL as an error.
11.4.2.3 Constants
GDB allows you to express the constants of Modula-2 in the following ways:
• Integer constants are simply a sequence of digits. When used in an expression, a con-stant is interpreted to be type-compatible with the rest of the expression. Hexadecimalintegers are specified by a trailing ‘H’, and octal integers by a trailing ‘B’.
• Floating point constants appear as a sequence of digits, followed by a decimal pointand another sequence of digits. An optional exponent can then be specified, in the form‘E[+|-]nnn’, where ‘[+|-]nnn’ is the desired exponent. All of the digits of the floatingpoint constant must be valid decimal (base 10) digits.
• Character constants consist of a single character enclosed by a pair of like quotes, eithersingle (’) or double ("). They may also be expressed by their ordinal value (their asciivalue, usually) followed by a ‘C’.
• String constants consist of a sequence of characters enclosed by a pair of like quotes,
either single (’) or double ("). Escape sequences in the style of C are also allowed.See Section 11.4.1.2 [C and C++ constants], page 104, for a brief explanation of escapesequences.
• Enumerated constants consist of an enumerated identifier.
• Boolean constants consist of the identifiers TRUE and FALSE.
• Pointer constants consist of integral values only.
• Set constants are not yet supported.
11.4.2.4 Modula-2 defaults
If type and range checking are set automatically by GDB, they both default to on
whenever the working language changes to Modula-2. This happens regardless of whetheryou or GDB selected the working language.
If you allow GDB to set the language automatically, then entering code compiled from afile whose name ends with ‘.mod’ sets the working language to Modula-2. See Section 11.1.3[Having GDB set the language automatically], page 98, for further details.
11.4.2.5 Deviations from standard Modula-2
A few changes have been made to make Modula-2 programs easier to debug. This isdone primarily via loosening its type strictness:
• Unlike in standard Modula-2, pointer constants can be formed by integers. This allowsyou to modify pointer variables during debugging. (In standard Modula-2, the actualaddress contained in a pointer variable is hidden from you; it can only be modified

8/14/2019 Debugging With GDB - The GNU Source-Level Debugger
http://slidepdf.com/reader/full/debugging-with-gdb-the-gnu-source-level-debugger 122/328
Chapter 11: Using GDB with Different Languages 111
through direct assignment to another pointer variable or expression that returned apointer.)
• C escape sequences can be used in strings and characters to represent non-printable
characters. GDB prints out strings with these escape sequences embedded. Singlenon-printable characters are printed using the ‘CHR(nnn)’ format.
• The assignment operator (:=) returns the value of its right-hand argument.
• All built-in procedures both modify and return their argument.
11.4.2.6 Modula-2 type and range checks
Warning: in this release, GDB does not yet perform type or range checking.
GDB considers two Modula-2 variables type equivalent if:
• They are of types that have been declared equivalent via a TYPE t1 = t2 statement• They have been declared on the same line. (Note: This is true of the gnu Modula-2
compiler, but it may not be true of other compilers.)
As long as type checking is enabled, any attempt to combine variables whose types arenot equivalent is an error.
Range checking is done on all mathematical operations, assignment, array index bounds,and all built-in functions and procedures.
11.4.2.7 The scope operators :: and .
There are a few subtle differences between the Modula-2 scope operator (.) and theGDB scope operator (::). The two have similar syntax:
module . id scope :: id
where scope is the name of a module or a procedure, module the name of a module, and id is any declared identifier within your program, except another module.
Using the :: operator makes GDB search the scope specified by scope for the identifier
id . If it is not found in the specified scope, then GDB searches all scopes enclosing the onespecified by scope .
Using the . operator makes GDB search the current scope for the identifier specified byid that was imported from the definition module specified by module . With this operator,it is an error if the identifier id was not imported from definition module module , or if id isnot an identifier in module .
11.4.2.8 GDB and Modula-2
Some GDB commands have little use when debugging Modula-2 programs. Five subcom-
mands of set print and show print apply specifically to C and C++: ‘vtbl’, ‘demangle’,‘asm-demangle’, ‘object’, and ‘union’. The first four apply to C++, and the last to the Cunion type, which has no direct analogue in Modula-2.
The @ operator (see Section 8.1 [Expressions], page 63), while available with any lan-guage, is not useful with Modula-2. Its intent is to aid the debugging of dynamic arrays ,

8/14/2019 Debugging With GDB - The GNU Source-Level Debugger
http://slidepdf.com/reader/full/debugging-with-gdb-the-gnu-source-level-debugger 123/328
112 Debugging with GDB
which cannot be created in Modula-2 as they can in C or C++. However, because an addresscan be specified by an integral constant, the construct ‘{type }adrexp’ is still useful.
In GDB scripts, the Modula-2 inequality operator # is interpreted as the beginning of a
comment. Use <> instead.
11.4.3 Chill
The extensions made to GDB to support Chill only support output from the gnu Chillcompiler. Other Chill compilers are not currently supported, and attempting to debug exe-cutables produced by them is most likely to give an error as GDB reads in the executable’ssymbol table.
This section covers the Chill related topics and the features of GDB which support thesetopics.
11.4.3.1 How modes are displayed
The Chill Datatype- (Mode) support of GDB is directly related with the functionalityof the gnu Chill compiler, and therefore deviates slightly from the standard specificationof the Chill language. The provided modes are:
Discrete modes:• Integer Modes which are predefined by BYTE, UBYTE, INT, UINT, LONG,
ULONG,
• Boolean Mode which is predefined by BOOL,• Character Mode which is predefined by CHAR,
• Set Mode which is displayed by the keyword SET.
(gdb) ptype xtype = SET (karli = 10, susi = 20, fritzi = 100)
If the type is an unnumbered set the set element values are omitted.
• Range Mode which is displayed by
type = <basemode>(<lower bound> : <upper bound>)
where <lower bound>, <upper bound> can be of any discrete literal ex-pression (e.g. set element names).
Powerset Mode:A Powerset Mode is displayed by the keyword POWERSET followed by the membermode of the powerset. The member mode can be any discrete mode.
(gdb) ptype xtype = POWERSET SET (egon, hugo, otto)
Reference Modes:• Bound Reference Mode which is displayed by the keyword REF followed by
the mode name to which the reference is bound.• Free Reference Mode which is displayed by the keyword PTR.
Procedure mode The procedure mode is displayed by type = PROC(<parameter list>) <return
mode> EXCEPTIONS (<exception list>). The <parameter list> is a list of

8/14/2019 Debugging With GDB - The GNU Source-Level Debugger
http://slidepdf.com/reader/full/debugging-with-gdb-the-gnu-source-level-debugger 124/328
Chapter 11: Using GDB with Different Languages 113
the parameter modes. <return mode> indicates the mode of the result of theprocedure if any. The exceptionlist lists all possible exceptions which can beraised by the procedure.
Synchronization Modes:• Event Mode which is displayed by
EVENT (<event length>)
where (<event length>) is optional.
• Buffer Mode which is displayed by
BUFFER (<buffer length>)<buffer element mode>
where (<buffer length>) is optional.
Timing Modes:
• Duration Mode which is predefined by DURATION• Absolute Time Mode which is predefined by TIME
Real Modes:Real Modes are predefined with REAL and LONG_REAL.
String Modes:• Character String Mode which is displayed by
CHARS(<string length>)
followed by the keyword VARYING if the String Mode is a varying mode
• Bit String Mode which is displayed byBOOLS(<stringlength>)
Array Mode:The Array Mode is displayed by the keyword ARRAY(<range>) followed by theelement mode (which may in turn be an array mode).
(gdb) ptype xtype = ARRAY (1:42)
ARRAY (1:20)
SET (karli = 10, susi = 20, fritzi = 100)Structure Mode
The Structure mode is displayed by the keyword STRUCT(<field list>). The<field list> consists of names and modes of fields of the structure. Variantstructures have the keyword CASE <field> OF <variant fields> ESAC in theirfield list. Since the current version of the GNU Chill compiler doesn’t implementtag processing (no runtime checks of variant fields, and therefore no debugginginfo), the output always displays all variant fields.
(gdb) ptype str
type = STRUCT (as x,bs x,CASE bs OF(karli):
cs a

8/14/2019 Debugging With GDB - The GNU Source-Level Debugger
http://slidepdf.com/reader/full/debugging-with-gdb-the-gnu-source-level-debugger 125/328
8/14/2019 Debugging With GDB - The GNU Source-Level Debugger
http://slidepdf.com/reader/full/debugging-with-gdb-the-gnu-source-level-debugger 126/328
Chapter 11: Using GDB with Different Languages 115
Literal Values
Literal values are specified in the same manner as in gnu Chill programs. Fordetailed specification refer to the gnu Chill implementation Manual chapter
1.5.Tuple Values
A tuple is specified by <mode name>[<tuple>], where <mode name> can be omit-ted if the mode of the tuple is unambiguous. This unambiguity is derived fromthe context of a evaluated expression. <tuple> can be one of the following:
• Powerset Tuple
• Array Tuple
• Structure Tuple Powerset tuples, array tuples and structure tuples are spec-ified in the same manner as in Chill programs refer to z200/88 chpt 5.2.5.
String Element Value
A string element value is specified by
<string value>(<index>)
where <index> is a integer expression. It delivers a character value which isequivalent to the character indexed by <index> in the string.
String Slice Value
A string slice value is specified by <string value>(<slice spec>), where<slice spec> can be either a range of integer expressions or specified by <start
expr> up <size>. <size> denotes the number of elements which the slice con-tains. The delivered value is a string value, which is part of the specified string.
Array Element Values
An array element value is specified by <array value>(<expr>) and delivers aarray element value of the mode of the specified array.
Array Slice Values
An array slice is specified by <array value>(<slice spec>), where <slice
spec> can be either a range specified by expressions or by <start expr> up
<size>. <size> denotes the number of arrayelements the slice contains. The
delivered value is an array value which is part of the specified array.
Structure Field Values
A structure field value is derived by <structure value>.<field name>, where<field name> indicates the name of a field specified in the mode definitionof the structure. The mode of the delivered value corresponds to this modedefinition in the structure definition.
Procedure Call Value
The procedure call value is derived from the return value of the procedure1.
Values of duration mode locations are represented by ULONG literals.
Values of time mode locations appear as
TIME(<secs>:<nsecs>)
1 If a procedure call is used for instance in an expression, then this procedure is called with all its sideeffects. This can lead to confusing results if used carelessly.
8/14/2019 Debugging With GDB - The GNU Source-Level Debugger
http://slidepdf.com/reader/full/debugging-with-gdb-the-gnu-source-level-debugger 127/328
116 Debugging with GDB
Zero-adic Operator Value
The zero-adic operator value is derived from the instance value for the currentactive process.
Expression ValuesThe value delivered by an expression is the result of the evaluation of the spec-ified expression. If there are error conditions (mode incompatibility, etc.) theevaluation of expressions is aborted with a corresponding error message. Ex-pressions may be parenthesised which causes the evaluation of this expressionbefore any other expression which uses the result of the parenthesised expres-sion. The following operators are supported by GDB:
OR, ORIF, XOR
AND, ANDIF
NOT Logical operators defined over operands of boolean mode.
=, /= Equality and inequality operators defined over all modes.
>, >=
<, <= Relational operators defined over predefined modes.
+, -
*, /, MOD, REM
Arithmetic operators defined over predefined modes.
- Change sign operator.
// String concatenation operator.
() String repetition operator.
-> Referenced location operator which can be used either to take theaddress of a location (->loc), or to dereference a reference location(loc->).
OR, XOR
AND
NOT Powerset and bitstring operators.
>, >=
<, <= Powerset inclusion operators.
IN Membership operator.
11.4.3.4 Chill type and range checks
GDB considers two Chill variables mode equivalent if the sizes of the two modes areequal. This rule applies recursively to more complex datatypes which means that complexmodes are treated equivalent if all element modes (which also can be complex modes like
structures, arrays, etc.) have the same size.Range checking is done on all mathematical operations, assignment, array index bounds
and all built in procedures.
Strong type checks are forced using the GDB command set check strong. This enforcesstrong type and range checks on all operations where Chill constructs are used (expressions,
8/14/2019 Debugging With GDB - The GNU Source-Level Debugger
http://slidepdf.com/reader/full/debugging-with-gdb-the-gnu-source-level-debugger 128/328
Chapter 11: Using GDB with Different Languages 117
built in functions, etc.) in respect to the semantics as defined in the z.200 language speci-fication.
All checks can be disabled by the GDB command set check off.
11.4.3.5 Chill defaults
If type and range checking are set automatically by GDB, they both default to on
whenever the working language changes to Chill. This happens regardless of whether youor GDB selected the working language.
If you allow GDB to set the language automatically, then entering code compiled froma file whose name ends with ‘.ch’ sets the working language to Chill. See Section 11.1.3[Having GDB set the language automatically], page 98, for further details.

8/14/2019 Debugging With GDB - The GNU Source-Level Debugger
http://slidepdf.com/reader/full/debugging-with-gdb-the-gnu-source-level-debugger 129/328
118 Debugging with GDB

8/14/2019 Debugging With GDB - The GNU Source-Level Debugger
http://slidepdf.com/reader/full/debugging-with-gdb-the-gnu-source-level-debugger 130/328
8/14/2019 Debugging With GDB - The GNU Source-Level Debugger
http://slidepdf.com/reader/full/debugging-with-gdb-the-gnu-source-level-debugger 131/328
120 Debugging with GDB
struct complex {double real; double imag;} v;
the two commands give this output:
(gdb) whatis v
type = struct complex(gdb) ptype vtype = struct complex {
double real;double imag;
}
As with whatis, using ptype without an argument refers to the type of $, thelast value in the value history.
info types regexp
info types Print a brief description of all types whose names match regexp (or all types inyour program, if you supply no argument). Each complete typename is matchedas though it were a complete line; thus, ‘i type value’ gives information onall types in your program whose names include the string value, but ‘i type
^value$’ gives information only on types whose complete name is value.
This command differs from ptype in two ways: first, like whatis, it does notprint a detailed description; second, it lists all source files where a type isdefined.
info scope addr List all the variables local to a particular scope. This command accepts alocation—a function name, a source line, or an address preceded by a ‘*’, andprints all the variables local to the scope defined by that location. For example:
(gdb) info scope command line handlerScope for command_line_handler:Symbol rl is an argument at stack/frame offset 8, length 4.Symbol linebuffer is in static storage at address 0x150a18, lengthSymbol linelength is in static storage at address 0x150a1c, lengthSymbol p is a local variable in register $esi, length 4.
Symbol p1 is a local variable in register $ebx, length 4.Symbol nline is a local variable in register $edx, length 4.Symbol repeat is a local variable at frame offset -8, length 4.
This command is especially useful for determining what data to collect duringa trace experiment, see Section 9.1.4 [Tracepoint Actions], page 83.
info source
Show the name of the current source file—that is, the source file for the functioncontaining the current point of execution—and the language it was written in.
info sources
Print the names of all source files in your program for which there is debugginginformation, organized into two lists: files whose symbols have already beenread, and files whose symbols will be read when needed.
info functions
Print the names and data types of all defined functions.
8/14/2019 Debugging With GDB - The GNU Source-Level Debugger
http://slidepdf.com/reader/full/debugging-with-gdb-the-gnu-source-level-debugger 132/328
Chapter 12: Examining the Symbol Table 121
info functions regexpPrint the names and data types of all defined functions whose names contain amatch for regular expression regexp. Thus, ‘info fun step’ finds all functions
whose names include step; ‘info fun ^step’ finds those whose names startwith step. If a function name contains characters that conflict with the regularexpression language (eg. ‘operator*()’), they may be quoted with a backslash.
info variables
Print the names and data types of all variables that are declared outside of functions (i.e. excluding local variables).
info variables regexpPrint the names and data types of all variables (except for local variables) whosenames contain a match for regular expression regexp.
Some systems allow individual object files that make up your program to bereplaced without stopping and restarting your program. For example, in Vx-Works you can simply recompile a defective object file and keep on running.If you are running on one of these systems, you can allow GDB to reload thesymbols for automatically relinked modules:
set symbol-reloading on
Replace symbol definitions for the corresponding source file whenan object file with a particular name is seen again.
set symbol-reloading off
Do not replace symbol definitions when encountering object files of the same name more than once. This is the default state; if youare not running on a system that permits automatic relinking of modules, you should leave symbol-reloading off, since otherwiseGDB may discard symbols when linking large programs, that maycontain several modules (from different directories or libraries) withthe same name.
show symbol-reloading
Show the current on or off setting.
set opaque-type-resolution on
Tell GDB to resolve opaque types. An opaque type is a type declared as apointer to a struct, class, or union—for example, struct MyType *—thatis used in one source file although the full declaration of struct MyType is inanother source file. The default is on.
A change in the setting of this subcommand will not take effect until the nexttime symbols for a file are loaded.
set opaque-type-resolution off
Tell GDB not to resolve opaque types. In this case, the type is printed asfollows:
{<no data fields>}
show opaque-type-resolution
Show whether opaque types are resolved or not.

8/14/2019 Debugging With GDB - The GNU Source-Level Debugger
http://slidepdf.com/reader/full/debugging-with-gdb-the-gnu-source-level-debugger 133/328
122 Debugging with GDB
maint print symbols filename maint print psymbols filename maint print msymbols filename
Write a dump of debugging symbol data into the file filename . These com-mands are used to debug the GDB symbol-reading code. Only symbols withdebugging data are included. If you use ‘ maint print symbols’, GDB includesall the symbols for which it has already collected full details: that is, filename reflects symbols for only those files whose symbols GDB has read. You canuse the command info sources to find out which files these are. If you use‘ maint print psymbols’ instead, the dump shows information about symbolsthat GDB only knows partially—that is, symbols defined in files that GDBhas skimmed, but not yet read completely. Finally, ‘ maint print msymbols’dumps just the minimal symbol information required for each object file from
which GDB has read some symbols. See Section 14.1 [Commands to specifyfiles], page 127, for a discussion of how GDB reads symbols (in the descriptionof symbol-file).

8/14/2019 Debugging With GDB - The GNU Source-Level Debugger
http://slidepdf.com/reader/full/debugging-with-gdb-the-gnu-source-level-debugger 134/328
Chapter 13: Altering Execution 123
13 Altering Execution
Once you think you have found an error in your program, you might want to find outfor certain whether correcting the apparent error would lead to correct results in the restof the run. You can find the answer by experiment, using the GDB features for alteringexecution of the program.
For example, you can store new values into variables or memory locations, give your pro-gram a signal, restart it at a different address, or even return prematurely from a function.
13.1 Assignment to variables
To alter the value of a variable, evaluate an assignment expression. See Section 8.1[Expressions], page 63. For example,
print x=4
stores the value 4 into the variable x, and then prints the value of the assignment expression(which is 4). See Chapter 11 [Using GDB with Different Languages], page 97, for moreinformation on operators in supported languages.
If you are not interested in seeing the value of the assignment, use the set command
instead of the print command. set is really the same as print except that the expression’svalue is not printed and is not put in the value history (see Section 8.8 [Value history],page 75). The expression is evaluated only for its effects.
If the beginning of the argument string of the set command appears identical to aset subcommand, use the set variable command instead of just set. This command isidentical to set except for its lack of subcommands. For example, if your program has avariable width, you get an error if you try to set a new value with just ‘ set width=13’,because GDB has the command set width:
(gdb) whatis widthtype = double(gdb) p width$4 = 13(gdb) set width=47Invalid syntax in expression.
The invalid expression, of course, is ‘=47’. In order to actually set the program’s variablewidth, use
(gdb) set var width=47
Because the set command has many subcommands that can conflict with the names of program variables, it is a good idea to use the set variable command instead of just set.For example, if your program has a variable g, you run into problems if you try to set a newvalue with just ‘set g=4’, because GDB has the command set gnutarget, abbreviated set
g:

8/14/2019 Debugging With GDB - The GNU Source-Level Debugger
http://slidepdf.com/reader/full/debugging-with-gdb-the-gnu-source-level-debugger 135/328
124 Debugging with GDB
(gdb) whatis gtype = double(gdb) p g
$ 1 = 1(gdb) set g=4(gdb) p g$ 2 = 1(gdb) rThe program being debugged has been started already.Start it from the beginning? (y or n) yStarting program: /home/smith/cc_progs/a.out"/home/smith/cc_progs/a.out": can’t open to read symbols:
Invalid bfd target.(gdb) show gThe current BFD target is "=4".
The program variable g did not change, and you silently set the gnutarget to an invalidvalue. In order to set the variable g, use
(gdb) set var g=4
GDB allows more implicit conversions in assignments than C; you can freely store aninteger value into a pointer variable or vice versa, and you can convert any structure to anyother structure that is the same length or shorter.
To store values into arbitrary places in memory, use the ‘{...}’ construct to generate a
value of specified type at a specified address (see Section 8.1 [Expressions], page 63). Forexample, {int}0x83040 refers to memory location 0x83040 as an integer (which implies acertain size and representation in memory), and
set {int}0x83040 = 4
stores the value 4 into that memory location.
13.2 Continuing at a different address
Ordinarily, when you continue your program, you do so at the place where it stopped,with the continue command. You can instead continue at an address of your own choosing,with the following commands:
jump linespec Resume execution at line linespec . Execution stops again immediately if thereis a breakpoint there. See Section 7.1 [Printing source lines], page 57, for adescription of the different forms of linespec . It is common practice to usethe tbreak command in conjunction with jump. See Section 5.1.1 [Settingbreakpoints], page 34.
The jump command does not change the current stack frame, or the stackpointer, or the contents of any memory location or any register other than theprogram counter. If line linespec is in a different function from the one cur-rently executing, the results may be bizarre if the two functions expect differentpatterns of arguments or of local variables. For this reason, the jump command

8/14/2019 Debugging With GDB - The GNU Source-Level Debugger
http://slidepdf.com/reader/full/debugging-with-gdb-the-gnu-source-level-debugger 136/328
Chapter 13: Altering Execution 125
requests confirmation if the specified line is not in the function currently exe-cuting. However, even bizarre results are predictable if you are well acquaintedwith the machine-language code of your program.
jump *address Resume execution at the instruction at address address .
On many systems, you can get much the same effect as the jump command by storinga new value into the register $pc. The difference is that this does not start your programrunning; it only changes the address of where it will run when you continue. For example,
set $pc = 0x485
makes the next continue command or stepping command execute at address 0x485, ratherthan at the address where your program stopped. See Section 5.2 [Continuing and stepping],
page 45.The most common occasion to use the jump command is to back up—perhaps with more
breakpoints set—over a portion of a program that has already executed, in order to examineits execution in more detail.
13.3 Giving your program a signal
signal signal Resume execution where your program stopped, but immediately give it the
signal signal . signal can be the name or the number of a signal. For example,on many systems signal 2 and signal SIGINT are both ways of sending aninterrupt signal.
Alternatively, if signal is zero, continue execution without giving a signal. Thisis useful when your program stopped on account of a signal and would ordinarysee the signal when resumed with the continue command; ‘signal 0’ causes itto resume without a signal.
signal does not repeat when you press RET a second time after executing thecommand.
Invoking the signal command is not the same as invoking the kill utility from the shell.Sending a signal with kill causes GDB to decide what to do with the signal depending onthe signal handling tables (see Section 5.3 [Signals], page 48). The signal command passesthe signal directly to your program.
13.4 Returning from a function
return
return expression
You can cancel execution of a function call with the return command. If yougive an expression argument, its value is used as the function’s return value.
When you use return, GDB discards the selected stack frame (and all frames withinit). You can think of this as making the discarded frame return prematurely. If you wishto specify a value to be returned, give that value as the argument to return.
8/14/2019 Debugging With GDB - The GNU Source-Level Debugger
http://slidepdf.com/reader/full/debugging-with-gdb-the-gnu-source-level-debugger 137/328
126 Debugging with GDB
This pops the selected stack frame (see Section 6.3 [Selecting a frame], page 55), and anyother frames inside of it, leaving its caller as the innermost remaining frame. That framebecomes selected. The specified value is stored in the registers used for returning values of
functions.The return command does not resume execution; it leaves the program stopped in the
state that would exist if the function had just returned. In contrast, the finish command(see Section 5.2 [Continuing and stepping], page 45) resumes execution until the selectedstack frame returns naturally.
13.5 Calling program functions
call expr Evaluate the expression expr without displaying void returned values.
You can use this variant of the print command if you want to execute a function fromyour program, but without cluttering the output with void returned values. If the resultis not void, it is printed and saved in the value history.
13.6 Patching programs
By default, GDB opens the file containing your program’s executable code (or the core-file) read-only. This prevents accidental alterations to machine code; but it also preventsyou from intentionally patching your program’s binary.
If you’d like to be able to patch the binary, you can specify that explicitly with the setwrite command. For example, you might want to turn on internal debugging flags, or evento make emergency repairs.
set write on
set write off
If you specify ‘set write on’, GDB opens executable and core files for bothreading and writing; if you specify ‘set write off’ (the default), GDB opensthem read-only.
If you have already loaded a file, you must load it again (using the exec-file
or core-file command) after changing set write, for your new setting to takeeffect.
show write
Display whether executable files and core files are opened for writing as well asreading.
8/14/2019 Debugging With GDB - The GNU Source-Level Debugger
http://slidepdf.com/reader/full/debugging-with-gdb-the-gnu-source-level-debugger 138/328
Chapter 14: GDB Files 127
14 GDB Files
GDB needs to know the file name of the program to be debugged, both in order to read
its symbol table and in order to start your program. To debug a core dump of a previousrun, you must also tell GDB the name of the core dump file.
14.1 Commands to specify files
You may want to specify executable and core dump file names. The usual way to dothis is at start-up time, using the arguments to GDB’s start-up commands (see Chapter 2[Getting In and Out of GDB], page 11).
Occasionally it is necessary to change to a different file during a GDB session. Or youmay run GDB and forget to specify a file you want to use. In these situations the GDBcommands to specify new files are useful.
file filename Use filename as the program to be debugged. It is read for its symbols and forthe contents of pure memory. It is also the program executed when you use therun command. If you do not specify a directory and the file is not found in theGDB working directory, GDB uses the environment variable PATH as a list of directories to search, just as the shell does when looking for a program to run.You can change the value of this variable, for both GDB and your program,
using the path command.On systems with memory-mapped files, an auxiliary file named ‘filename .syms’may hold symbol table information for filename . If so, GDB maps in the symboltable from ‘filename .syms’, starting up more quickly. See the descriptions of thefile options ‘-mapped’ and ‘-readnow’ (available on the command line, and withthe commands file, symbol-file, or add-symbol-file, described below), formore information.
file file with no argument makes GDB discard any information it has on bothexecutable file and the symbol table.
exec-file [ filename ]Specify that the program to be run (but not the symbol table) is found in file-name . GDB searches the environment variable PATH if necessary to locate yourprogram. Omitting filename means to discard information on the executablefile.
symbol-file [ filename ]Read symbol table information from file filename . PATH is searched when nec-essary. Use the file command to get both symbol table and program to runfrom the same file.
symbol-file with no argument clears out GDB information on your program’ssymbol table.
The symbol-file command causes GDB to forget the contents of its conve-nience variables, the value history, and all breakpoints and auto-display expres-sions. This is because they may contain pointers to the internal data recording
8/14/2019 Debugging With GDB - The GNU Source-Level Debugger
http://slidepdf.com/reader/full/debugging-with-gdb-the-gnu-source-level-debugger 139/328
128 Debugging with GDB
symbols and data types, which are part of the old symbol table data beingdiscarded inside GDB.
symbol-file does not repeat if you press RET again after executing it once.
When GDB is configured for a particular environment, it understands debug-ging information in whatever format is the standard generated for that envi-ronment; you may use either a gnu compiler, or other compilers that adhereto the local conventions. Best results are usually obtained from gnu compilers;for example, using gcc you can generate debugging information for optimizedcode.
For most kinds of object files, with the exception of old SVR3 systems usingCOFF, the symbol-file command does not normally read the symbol table infull right away. Instead, it scans the symbol table quickly to find which source
files and which symbols are present. The details are read later, one source fileat a time, as they are needed.
The purpose of this two-stage reading strategy is to make GDB start up faster.For the most part, it is invisible except for occasional pauses while the symboltable details for a particular source file are being read. (The set verbose
command can turn these pauses into messages if desired. See Section 18.6[Optional warnings and messages], page 168.)
We have not implemented the two-stage strategy for COFF yet. When thesymbol table is stored in COFF format, symbol-file reads the symbol table
data in full right away. Note that “stabs-in-COFF” still does the two-stagestrategy, since the debug info is actually in stabs format.
symbol-file filename [ -readnow ] [ -mapped ]file filename [ -readnow ] [ -mapped ]
You can override the GDB two-stage strategy for reading symbol tables byusing the ‘-readnow’ option with any of the commands that load symbol tableinformation, if you want to be sure GDB has the entire symbol table available.
If memory-mapped files are available on your system through the mmap systemcall, you can use another option, ‘-mapped’, to cause GDB to write the symbols
for your program into a reusable file. Future GDB debugging sessions mapin symbol information from this auxiliary symbol file (if the program has notchanged), rather than spending time reading the symbol table from the exe-cutable program. Using the ‘-mapped’ option has the same effect as startingGDB with the ‘-mapped’ command-line option.
You can use both options together, to make sure the auxiliary symbol file hasall the symbol information for your program.
The auxiliary symbol file for a program called myprog is called ‘myprog .syms’.Once this file exists (so long as it is newer than the corresponding executable),
GDB always attempts to use it when you debug myprog ; no special options orcommands are needed.
The ‘.syms’ file is specific to the host machine where you run GDB. It holdsan exact image of the internal GDB symbol table. It cannot be shared acrossmultiple host platforms.

8/14/2019 Debugging With GDB - The GNU Source-Level Debugger
http://slidepdf.com/reader/full/debugging-with-gdb-the-gnu-source-level-debugger 140/328
Chapter 14: GDB Files 129
core-file [ filename ]Specify the whereabouts of a core dump file to be used as the “contents of memory”. Traditionally, core files contain only some parts of the address space
of the process that generated them; GDB can access the executable file itself for other parts.
core-file with no argument specifies that no core file is to be used.
Note that the core file is ignored when your program is actually running underGDB. So, if you have been running your program and you wish to debug acore file instead, you must kill the subprocess in which the program is running.To do this, use the kill command (see Section 4.8 [Killing the child process],page 28).
add-symbol-file filename address
add-symbol-file filename address [ -readnow ] [ -mapped ]add-symbol-file filename -ssection address ...
The add-symbol-file command reads additional symbol table informationfrom the file filename . You would use this command when filename has beendynamically loaded (by some other means) into the program that is running.address should be the memory address at which the file has been loaded; GDBcannot figure this out for itself. You can additionally specify an arbitrarynumber of ‘-ssection address ’ pairs, to give an explicit section name and baseaddress for that section. You can specify any address as an expression.
The symbol table of the file filename is added to the symbol table originally readwith the symbol-file command. You can use the add-symbol-file commandany number of times; the new symbol data thus read keeps adding to the old.To discard all old symbol data instead, use the symbol-file command withoutany arguments.
Although filename is typically a shared library file, an executable file, or someother object file which has been fully relocated for loading into a process, youcan also load symbolic information from relocatable ‘.o’ files, as long as:
• the file’s symbolic information refers only to linker symbols defined in that
file, not to symbols defined by other object files,• every section the file’s symbolic information refers to has actually been
loaded into the inferior, as it appears in the file, and
• you can determine the address at which every section was loaded, andprovide these to the add-symbol-file command.
Some embedded operating systems, like Sun Chorus and VxWorks, can loadrelocatable files into an already running program; such systems typically makethe requirements above easy to meet. However, it’s important to recognize thatmany native systems use complex link procedures (.linkonce section factoring
and C++ constructor table assembly, for example) that make the requirementsdifficult to meet. In general, one cannot assume that using add-symbol-file
to read a relocatable object file’s symbolic information will have the same effectas linking the relocatable object file into the program in the normal way.
add-symbol-file does not repeat if you press RET after using it.
8/14/2019 Debugging With GDB - The GNU Source-Level Debugger
http://slidepdf.com/reader/full/debugging-with-gdb-the-gnu-source-level-debugger 141/328
130 Debugging with GDB
You can use the ‘-mapped’ and ‘-readnow’ options just as with the symbol-
file command, to change how GDB manages the symbol table information forfilename .
add-shared-symbol-file
The add-shared-symbol-file command can be used only under Harris’ CXUXoperating system for the Motorola 88k. GDB automatically looks for sharedlibraries, however if GDB does not find yours, you can run add-shared-symbol-
file. It takes no arguments.
section The section command changes the base address of section SECTION of theexec file to ADDR. This can be used if the exec file does not contain sectionaddresses, (such as in the a.out format), or when the addresses specified in thefile itself are wrong. Each section must be changed separately. The info files
command, described below, lists all the sections and their addresses.
info files
info target
info files and info target are synonymous; both print the current target(see Chapter 15 [Specifying a Debugging Target], page 135), including thenames of the executable and core dump files currently in use by GDB, andthe files from which symbols were loaded. The command help target lists allpossible targets rather than current ones.
maint info sectionsAnother command that can give you extra information about program sectionsis maint info sections. In addition to the section information displayed byinfo files, this command displays the flags and file offset of each section inthe executable and core dump files. In addition, maint info sections providesthe following command options (which may be arbitrarily combined):
ALLOBJ Display sections for all loaded object files, including shared li-braries.
sections Display info only for named sections .
section-flags Display info only for sections for which section-flags are true. Thesection flags that GDB currently knows about are:
ALLOC Section will have space allocated in the process whenloaded. Set for all sections except those containing de-bug information.
LOAD Section will be loaded from the file into the child pro-cess memory. Set for pre-initialized code and data,
clear for .bss sections.RELOC Section needs to be relocated before loading.
READONLY Section cannot be modified by the child process.
CODE Section contains executable code only.

8/14/2019 Debugging With GDB - The GNU Source-Level Debugger
http://slidepdf.com/reader/full/debugging-with-gdb-the-gnu-source-level-debugger 142/328
Chapter 14: GDB Files 131
DATA Section contains data only (no executable code).
ROM Section will reside in ROM.
CONSTRUCTORSection contains data for constructor/destructor lists.
HAS_CONTENTS
Section is not empty.
NEVER_LOAD
An instruction to the linker to not output the section.
COFF_SHARED_LIBRARY
A notification to the linker that the section containsCOFF shared library information.
IS_COMMON
Section contains common symbols.
set trust-readonly-sections on
Tell GDB that readonly sections in your object file really are read-only (i.e.that their contents will not change). In that case, GDB can fetch values fromthese sections out of the object file, rather than from the target program. Forsome targets (notably embedded ones), this can be a significant enhancementto debugging performance.
The default is off.
set trust-readonly-sections off
Tell GDB not to trust readonly sections. This means that the contents of the section might change while the program is running, and must therefore befetched from the target when needed.
All file-specifying commands allow both absolute and relative file names as arguments.GDB always converts the file name to an absolute file name and remembers it that way.
GDB supports HP-UX, SunOS, SVr4, Irix 5, and IBM RS/6000 shared libraries.
GDB automatically loads symbol definitions from shared libraries when you use the runcommand, or when you examine a core file. (Before you issue the run command, GDBdoes not understand references to a function in a shared library, however—unless you aredebugging a core file).
On HP-UX, if the program loads a library explicitly, GDB automatically loads thesymbols at the time of the shl_load call.
There are times, however, when you may wish to not automatically load symbol defini-tions from shared libraries, such as when they are particularly large or there are many of them.
To control the automatic loading of shared library symbols, use the commands:
set auto-solib-add mode If mode is on, symbols from all shared object libraries will be loaded auto-matically when the inferior begins execution, you attach to an independently

8/14/2019 Debugging With GDB - The GNU Source-Level Debugger
http://slidepdf.com/reader/full/debugging-with-gdb-the-gnu-source-level-debugger 143/328
132 Debugging with GDB
started inferior, or when the dynamic linker informs GDB that a new libraryhas been loaded. If mode is off, symbols must be loaded manually, using thesharedlibrary command. The default value is on.
show auto-solib-addDisplay the current autoloading mode.
To explicitly load shared library symbols, use the sharedlibrary command:
info share
info sharedlibrary
Print the names of the shared libraries which are currently loaded.
sharedlibrary regex share regex
Load shared object library symbols for files matching a Unix regular expression.As with files loaded automatically, it only loads shared libraries required by yourprogram for a core file or after typing run. If regex is omitted all shared librariesrequired by your program are loaded.
On some systems, such as HP-UX systems, GDB supports autoloading shared librarysymbols until a limiting threshold size is reached. This provides the benefit of allowing au-toloading to remain on by default, but avoids autoloading excessively large shared libraries,up to a threshold that is initially set, but which you can modify if you wish.
Beyond that threshold, symbols from shared libraries must be explicitly loaded. To load
these symbols, use the command sharedlibrary filename . The base address of the sharedlibrary is determined automatically by GDB and need not be specified.
To display or set the threshold, use the commands:
set auto-solib-limit threshold Set the autoloading size threshold, in an integral number of megabytes. If threshold is nonzero and shared library autoloading is enabled, symbols fromall shared object libraries will be loaded until the total size of the loaded sharedlibrary symbols exceeds this threshold. Otherwise, symbols must be loaded
manually, using the sharedlibrary command. The default threshold is 100(i.e. 100 Mb).
show auto-solib-limit
Display the current autoloading size threshold, in megabytes.
14.2 Errors reading symbol files
While reading a symbol file, GDB occasionally encounters problems, such as symboltypes it does not recognize, or known bugs in compiler output. By default, GDB does notnotify you of such problems, since they are relatively common and primarily of interest to
people debugging compilers. If you are interested in seeing information about ill-constructedsymbol tables, you can either ask GDB to print only one message about each such type of problem, no matter how many times the problem occurs; or you can ask GDB to print moremessages, to see how many times the problems occur, with the set complaints command(see Section 18.6 [Optional warnings and messages], page 168).
8/14/2019 Debugging With GDB - The GNU Source-Level Debugger
http://slidepdf.com/reader/full/debugging-with-gdb-the-gnu-source-level-debugger 144/328
Chapter 14: GDB Files 133
The messages currently printed, and their meanings, include:
inner block not inside outer block in symbol The symbol information shows where symbol scopes begin and end (such as at
the start of a function or a block of statements). This error indicates that aninner scope block is not fully contained in its outer scope blocks.
GDB circumvents the problem by treating the inner block as if it had thesame scope as the outer block. In the error message, symbol may be shown as“(don’t know)” if the outer block is not a function.
block at address out of order
The symbol information for symbol scope blocks should occur in order of in-creasing addresses. This error indicates that it does not do so.
GDB does not circumvent this problem, and has trouble locating symbols inthe source file whose symbols it is reading. (You can often determine whatsource file is affected by specifying set verbose on. See Section 18.6 [Optionalwarnings and messages], page 168.)
bad block start address patched
The symbol information for a symbol scope block has a start address smallerthan the address of the preceding source line. This is known to occur in theSunOS 4.1.1 (and earlier) C compiler.
GDB circumvents the problem by treating the symbol scope block as starting
on the previous source line.bad string table offset in symbol n
Symbol number n contains a pointer into the string table which is larger thanthe size of the string table.
GDB circumvents the problem by considering the symbol to have the namefoo, which may cause other problems if many symbols end up with this name.
unknown symbol type 0xnnThe symbol information contains new data types that GDB does not yet knowhow to read. 0xnn is the symbol type of the uncomprehended information, in
hexadecimal.GDB circumvents the error by ignoring this symbol information. This usuallyallows you to debug your program, though certain symbols are not accessible. If you encounter such a problem and feel like debugging it, you can debug gdb withitself, breakpoint on complain, then go up to the function read_dbx_symtab
and examine *bufp to see the symbol.
stub type has NULL name
GDB could not find the full definition for a struct or class.
const/volatile indicator missing (ok if using g++ v1.x), got...
The symbol information for a C++ member function is missing some informationthat recent versions of the compiler should have output for it.
info mismatch between compiler and debugger
GDB could not parse a type specification output by the compiler.

8/14/2019 Debugging With GDB - The GNU Source-Level Debugger
http://slidepdf.com/reader/full/debugging-with-gdb-the-gnu-source-level-debugger 145/328
134 Debugging with GDB
8/14/2019 Debugging With GDB - The GNU Source-Level Debugger
http://slidepdf.com/reader/full/debugging-with-gdb-the-gnu-source-level-debugger 146/328
Chapter 15: Specifying a Debugging Target 135
15 Specifying a Debugging Target
A target is the execution environment occupied by your program.
Often, GDB runs in the same host environment as your program; in that case, thedebugging target is specified as a side effect when you use the file or core commands.When you need more flexibility—for example, running GDB on a physically separate host,or controlling a standalone system over a serial port or a realtime system over a TCP/IPconnection—you can use the target command to specify one of the target types configuredfor GDB (see Section 15.2 [Commands for managing targets], page 135).
15.1 Active targets
There are three classes of targets: processes, core files, and executable files. GDB canwork concurrently on up to three active targets, one in each class. This allows you to (forexample) start a process and inspect its activity without abandoning your work on a corefile.
For example, if you execute ‘gdb a.out’, then the executable file a.out is the only activetarget. If you designate a core file as well—presumably from a prior run that crashed andcoredumped—then GDB has two active targets and uses them in tandem, looking first inthe corefile target, then in the executable file, to satisfy requests for memory addresses.
(Typically, these two classes of target are complementary, since core files contain only aprogram’s read-write memory—variables and so on—plus machine status, while executablefiles contain only the program text and initialized data.)
When you type run, your executable file becomes an active process target as well. Whena process target is active, all GDB commands requesting memory addresses refer to thattarget; addresses in an active core file or executable file target are obscured while the processtarget is active.
Use the core-file and exec-file commands to select a new core file or executabletarget (see Section 14.1 [Commands to specify files], page 127). To specify as a target a
process that is already running, use the attach command (see Section 4.7 [Debugging analready-running process], page 27).
15.2 Commands for managing targets
target type parameters Connects the GDB host environment to a target machine or process. A targetis typically a protocol for talking to debugging facilities. You use the argumenttype to specify the type or protocol of the target machine.
Further parameters are interpreted by the target protocol, but typically includethings like device names or host names to connect with, process numbers, andbaud rates.
The target command does not repeat if you press RET again after executingthe command.
8/14/2019 Debugging With GDB - The GNU Source-Level Debugger
http://slidepdf.com/reader/full/debugging-with-gdb-the-gnu-source-level-debugger 147/328
136 Debugging with GDB
help target
Displays the names of all targets available. To display targets currently selected,use either info target or info files (see Section 14.1 [Commands to specify
files], page 127).help target name
Describe a particular target, including any parameters necessary to select it.
set gnutarget args GDB uses its own library BFD to read your files. GDB knows whether it isreading an executable , a core , or a .o file; however, you can specify the fileformat with the set gnutarget command. Unlike most target commands,with gnutarget the target refers to a program, not a machine.
Warning: To specify a file format with set gnutarget, you must
know the actual BFD name.
See Section 14.1 [Commands to specify files], page 127.
show gnutarget
Use the show gnutarget command to display what file format gnutarget is setto read. If you have not set gnutarget, GDB will determine the file format foreach file automatically, and show gnutarget displays ‘The current BDF target
is "auto"’.
Here are some common targets (available, or not, depending on the GDB configuration):
target exec programAn executable file. ‘target exec program’ is the same as ‘exec-file program’.
target core filename A core dump file. ‘target core filename ’ is the same as ‘core-file filename ’.
target remote dev Remote serial target in GDB-specific protocol. The argument dev specifieswhat serial device to use for the connection (e.g. ‘/dev/ttya’). See Section 15.4[Remote debugging], page 137. target remote supports the load command.
This is only useful if you have some other way of getting the stub to the targetsystem, and you can put it somewhere in memory where it won’t get clobberedby the download.
target sim
Builtin CPU simulator. GDB includes simulators for most architectures. Ingeneral,
target simloadrun
works; however, you cannot assume that a specific memory map, device drivers,or even basic I/O is available, although some simulators do provide these. Forinfo about any processor-specific simulator details, see the appropriate sectionin Section 17.3 [Embedded Processors], page 152.
Some configurations may include these targets as well:
8/14/2019 Debugging With GDB - The GNU Source-Level Debugger
http://slidepdf.com/reader/full/debugging-with-gdb-the-gnu-source-level-debugger 148/328
Chapter 15: Specifying a Debugging Target 137
target nrom dev NetROM ROM emulator. This target only supports downloading.
Different targets are available on different configurations of GDB; your configurationmay have more or fewer targets.
Many remote targets require you to download the executable’s code once you’ve success-fully established a connection.
load filename Depending on what remote debugging facilities are configured into GDB, theload command may be available. Where it exists, it is meant to make filename (an executable) available for debugging on the remote system—by downloading,or dynamic linking, for example. load also records the filename symbol table
in GDB, like the add-symbol-file command.If your GDB does not have a load command, attempting to execute it gets theerror message “You can’t do that when your target is ...”
The file is loaded at whatever address is specified in the executable. For someobject file formats, you can specify the load address when you link the program;for other formats, like a.out, the object file format specifies a fixed address.
load does not repeat if you press RET again after using it.
15.3 Choosing target byte orderSome types of processors, such as the MIPS, PowerPC, and Hitachi SH, offer the ability
to run either big-endian or little-endian byte orders. Usually the executable or symbol willinclude a bit to designate the endian-ness, and you will not need to worry about which touse. However, you may still find it useful to adjust GDB’s idea of processor endian-nessmanually.
set endian big
Instruct GDB to assume the target is big-endian.
set endian littleInstruct GDB to assume the target is little-endian.
set endian auto
Instruct GDB to use the byte order associated with the executable.
show endian
Display GDB’s current idea of the target byte order.
Note that these commands merely adjust interpretation of symbolic data on the host,and that they have absolutely no effect on the target system.
15.4 Remote debugging
If you are trying to debug a program running on a machine that cannot run GDB inthe usual way, it is often useful to use remote debugging. For example, you might use

8/14/2019 Debugging With GDB - The GNU Source-Level Debugger
http://slidepdf.com/reader/full/debugging-with-gdb-the-gnu-source-level-debugger 149/328
138 Debugging with GDB
remote debugging on an operating system kernel, or on a small system which does not havea general purpose operating system powerful enough to run a full-featured debugger.
Some configurations of GDB have special serial or TCP/IP interfaces to make this work
with particular debugging targets. In addition, GDB comes with a generic serial protocol(specific to GDB, but not specific to any particular target system) which you can use if you write the remote stubs—the code that runs on the remote system to communicate withGDB.
Other remote targets may be available in your configuration of GDB; use help target
to list them.
15.5 Kernel Object Display
Some targets support kernel object display. Using this facility, GDB communicatesspecially with the underlying operating system and can display information about operatingsystem-level objects such as mutexes and other synchronization objects. Exactly whichobjects can be displayed is determined on a per-OS basis.
Use the set os command to set the operating system. This tells GDB which kernelobject display module to initialize:
(gdb) set os cisco
If set os succeeds, GDB will display some information about the operating system, andwill create a new info command which can be used to query the target. The info command
is named after the operating system:(gdb) info ciscoList of Cisco Kernel ObjectsObject Descriptionany Any and all objects
Further subcommands can be used to query about particular objects known by thekernel.
There is currently no way to determine whether a given operating system is supportedother than to try it.

8/14/2019 Debugging With GDB - The GNU Source-Level Debugger
http://slidepdf.com/reader/full/debugging-with-gdb-the-gnu-source-level-debugger 150/328
Chapter 16: Debugging remote programs 139
16 Debugging remote programs
16.1 Using the gdbserver programgdbserver is a control program for Unix-like systems, which allows you to connect
your program with a remote GDB via target remote—but without linking in the usualdebugging stub.
gdbserver is not a complete replacement for the debugging stubs, because it requiresessentially the same operating-system facilities that GDB itself does. In fact, a system thatcan run gdbserver to connect to a remote GDB could also run GDB locally! gdbserver
is sometimes useful nevertheless, because it is a much smaller program than GDB itself. Itis also easier to port than all of GDB, so you may be able to get started more quickly on
a new system by using gdbserver. Finally, if you develop code for real-time systems, youmay find that the tradeoffs involved in real-time operation make it more convenient to doas much development work as possible on another system, for example by cross-compiling.You can use gdbserver to make a similar choice for debugging.
GDB and gdbserver communicate via either a serial line or a TCP connection, usingthe standard GDB remote serial protocol.
On the target machine,you need to have a copy of the program you want to debug. gdbserver doesnot need your program’s symbol table, so you can strip the program if necessary
to save space. GDB on the host system does all the symbol handling.To use the server, you must tell it how to communicate with GDB; the nameof your program; and the arguments for your program. The usual syntax is:
target> gdbserver comm program [ args ... ]
comm is either a device name (to use a serial line) or a TCP hostname andportnumber. For example, to debug Emacs with the argument ‘foo.txt’ andcommunicate with GDB over the serial port ‘/dev/com1’:
target> gdbserver /dev/com1 emacs foo.txt
gdbserver waits passively for the host GDB to communicate with it.
To use a TCP connection instead of a serial line:target> gdbserver host:2345 emacs foo.txt
The only difference from the previous example is the first argument, specifyingthat you are communicating with the host GDB via TCP. The ‘host:2345’argument means that gdbserver is to expect a TCP connection from machine‘host’ to local TCP port 2345. (Currently, the ‘host’ part is ignored.) Youcan choose any number you want for the port number as long as it does notconflict with any TCP ports already in use on the target system (for example,23 is reserved for telnet).1 You must use the same port number with the host
GDB target remote command.On some targets, gdbserver can also attach to running programs. This isaccomplished via the --attach argument. The syntax is:
1 If you choose a port number that conflicts with another service, gdbserver prints an error message andexits.

8/14/2019 Debugging With GDB - The GNU Source-Level Debugger
http://slidepdf.com/reader/full/debugging-with-gdb-the-gnu-source-level-debugger 151/328
140 Debugging with GDB
target> gdbserver comm --attach pid
pid is the process ID of a currently running process. It isn’t necessary to pointgdbserver at a binary for the running process.
On the GDB host machine,you need an unstripped copy of your program, since GDB needs symbols anddebugging information. Start up GDB as usual, using the name of the localcopy of your program as the first argument. (You may also need the ‘--baud’option if the serial line is running at anything other than 9600 bps.) After that,use target remote to establish communications with gdbserver. Its argumentis either a device name (usually a serial device, like ‘/dev/ttyb’), or a TCPport descriptor in the form host:PORT . For example:
(gdb) target remote /dev/ttyb
communicates with the server via serial line ‘/dev/ttyb’, and
(gdb) target remote the-target:2345
communicates via a TCP connection to port 2345 on host ‘the-target’. ForTCP connections, you must start up gdbserver prior to using the target
remote command. Otherwise you may get an error whose text depends on thehost system, but which usually looks something like ‘Connection refused’.
16.2 Using the gdbserve.nlm program
gdbserve.nlm is a control program for NetWare systems, which allows you to connectyour program with a remote GDB via target remote.
GDB and gdbserve.nlm communicate via a serial line, using the standard GDB remoteserial protocol.
On the target machine,you need to have a copy of the program you want to debug. gdbserve.nlm
does not need your program’s symbol table, so you can strip the program if necessary to save space. GDB on the host system does all the symbol handling.
To use the server, you must tell it how to communicate with GDB; the nameof your program; and the arguments for your program. The syntax is:
load gdbserve [ BOARD=board ] [ PORT= port ][ BAUD=baud ] program [ args ... ]
board and port specify the serial line; baud specifies the baud rate used by theconnection. port and node default to 0, baud defaults to 9600 bps.
For example, to debug Emacs with the argument ‘foo.txt’and communicatewith GDB over serial port number 2 or board 1 using a 19200 bps connection:
load gdbserve BOARD=1 PORT=2 BAUD=19200 emacs foo.txt
On the GDB host machine,you need an unstripped copy of your program, since GDB needs symbols anddebugging information. Start up GDB as usual, using the name of the local copyof your program as the first argument. (You may also need the ‘--baud’ optionif the serial line is running at anything other than 9600 bps. After that, use
8/14/2019 Debugging With GDB - The GNU Source-Level Debugger
http://slidepdf.com/reader/full/debugging-with-gdb-the-gnu-source-level-debugger 152/328
Chapter 16: Debugging remote programs 141
target remote to establish communications with gdbserve.nlm. Its argumentis a device name (usually a serial device, like ‘/dev/ttyb’). For example:
(gdb) target remote /dev/ttyb
communications with the server via serial line ‘/dev/ttyb’.
16.3 Implementing a remote stub
The stub files provided with GDB implement the target side of the communicationprotocol, and the GDB side is implemented in the GDB source file ‘ remote.c’. Normally,you can simply allow these subroutines to communicate, and ignore the details. (If you’reimplementing your own stub file, you can still ignore the details: start with one of theexisting stub files. ‘sparc-stub.c’ is the best organized, and therefore the easiest to read.)
To debug a program running on another machine (the debugging target machine), youmust first arrange for all the usual prerequisites for the program to run by itself. Forexample, for a C program, you need:
1. A startup routine to set up the C runtime environment; these usually have a name like‘crt0’. The startup routine may be supplied by your hardware supplier, or you mayhave to write your own.
2. A C subroutine library to support your program’s subroutine calls, notably managinginput and output.
3. A way of getting your program to the other machine—for example, a download pro-gram. These are often supplied by the hardware manufacturer, but you may have towrite your own from hardware documentation.
The next step is to arrange for your program to use a serial port to communicate withthe machine where GDB is running (the host machine). In general terms, the scheme lookslike this:
On the host,GDB already understands how to use this protocol; when everything else isset up, you can simply use the ‘target remote’ command (see Chapter 15
[Specifying a Debugging Target], page 135).On the target,
you must link with your program a few special-purpose subroutines that imple-ment the GDB remote serial protocol. The file containing these subroutines iscalled a debugging stub.
On certain remote targets, you can use an auxiliary program gdbserver insteadof linking a stub into your program. See Section 16.1 [Using the gdbserver
program], page 139, for details.
The debugging stub is specific to the architecture of the remote machine; for example,use ‘sparc-stub.c’ to debug programs on sparc boards.
These working remote stubs are distributed with GDB:
i386-stub.c
For Intel 386 and compatible architectures.

8/14/2019 Debugging With GDB - The GNU Source-Level Debugger
http://slidepdf.com/reader/full/debugging-with-gdb-the-gnu-source-level-debugger 153/328
142 Debugging with GDB
m68k-stub.c
For Motorola 680x0 architectures.
sh-stub.c
For Hitachi SH architectures.
sparc-stub.c
For sparc architectures.
sparcl-stub.c
For Fujitsu sparclite architectures.
The ‘README’ file in the GDB distribution may list other recently added stubs.
16.3.1 What the stub can do for you
The debugging stub for your architecture supplies these three subroutines:
set_debug_traps
This routine arranges for handle_exception to run when your program stops.You must call this subroutine explicitly near the beginning of your program.
handle_exception
This is the central workhorse, but your program never calls it explicitly—thesetup code arranges for handle_exception to run when a trap is triggered.
handle_exception takes control when your program stops during execution(for example, on a breakpoint), and mediates communications with GDB onthe host machine. This is where the communications protocol is implemented;handle_exception acts as the GDB representative on the target machine. Itbegins by sending summary information on the state of your program, then con-tinues to execute, retrieving and transmitting any information GDB needs, untilyou execute a GDB command that makes your program resume; at that point,handle_exception returns control to your own code on the target machine.
breakpoint
Use this auxiliary subroutine to make your program contain a breakpoint. De-pending on the particular situation, this may be the only way for GDB to get
control. For instance, if your target machine has some sort of interrupt button,you won’t need to call this; pressing the interrupt button transfers control tohandle_exception—in effect, to GDB. On some machines, simply receivingcharacters on the serial port may also trigger a trap; again, in that situation,you don’t need to call breakpoint from your own program—simply running‘target remote’ from the host GDB session gets control.
Call breakpoint if none of these is true, or if you simply want to make certainyour program stops at a predetermined point for the start of your debuggingsession.
16.3.2 What you must do for the stub
The debugging stubs that come with GDB are set up for a particular chip architecture,but they have no information about the rest of your debugging target machine.
First of all you need to tell the stub how to communicate with the serial port.

8/14/2019 Debugging With GDB - The GNU Source-Level Debugger
http://slidepdf.com/reader/full/debugging-with-gdb-the-gnu-source-level-debugger 154/328
Chapter 16: Debugging remote programs 143
int getDebugChar()
Write this subroutine to read a single character from the serial port. It may beidentical to getchar for your target system; a different name is used to allow
you to distinguish the two if you wish.void putDebugChar(int)
Write this subroutine to write a single character to the serial port. It may beidentical to putchar for your target system; a different name is used to allowyou to distinguish the two if you wish.
If you want GDB to be able to stop your program while it is running, you need to usean interrupt-driven serial driver, and arrange for it to stop when it receives a ^C (‘\003’,the control-C character). That is the character which GDB uses to tell the remote systemto stop.
Getting the debugging target to return the proper status to GDB probably requireschanges to the standard stub; one quick and dirty way is to just execute a breakpointinstruction (the “dirty” part is that GDB reports a SIGTRAP instead of a SIGINT).
Other routines you need to supply are:
void exceptionHandler (int exception number , void *exception address )Write this function to install exception address in the exception handling ta-bles. You need to do this because the stub does not have any way of knowingwhat the exception handling tables on your target system are like (for example,the processor’s table might be in rom, containing entries which point to a table
in ram). exception number is the exception number which should be changed;its meaning is architecture-dependent (for example, different numbers mightrepresent divide by zero, misaligned access, etc). When this exception occurs,control should be transferred directly to exception address , and the processorstate (stack, registers, and so on) should be just as it is when a processor excep-tion occurs. So if you want to use a jump instruction to reach exception address ,it should be a simple jump, not a jump to subroutine.
For the 386, exception address should be installed as an interrupt gate so thatinterrupts are masked while the handler runs. The gate should be at privilege
level 0 (the most privileged level). The sparc and 68k stubs are able to maskinterrupts themselves without help from exceptionHandler.
void flush_i_cache()
On sparc and sparclite only, write this subroutine to flush the instructioncache, if any, on your target machine. If there is no instruction cache, thissubroutine may be a no-op.
On target machines that have instruction caches, GDB requires this functionto make certain that the state of your program is stable.
You must also make sure this library routine is available:
void *memset(void *, int, int)
This is the standard library function memset that sets an area of memory to aknown value. If you have one of the free versions of libc.a, memset can be foundthere; otherwise, you must either obtain it from your hardware manufacturer,or write your own.

8/14/2019 Debugging With GDB - The GNU Source-Level Debugger
http://slidepdf.com/reader/full/debugging-with-gdb-the-gnu-source-level-debugger 155/328
144 Debugging with GDB
If you do not use the GNU C compiler, you may need other standard library subroutinesas well; this varies from one stub to another, but in general the stubs are likely to use anyof the common library subroutines which gcc generates as inline code.
16.3.3 Putting it all together
In summary, when your program is ready to debug, you must follow these steps.
1. Make sure you have defined the supporting low-level routines (see Section 16.3.2 [Whatyou must do for the stub], page 142):
getDebugChar, putDebugChar,flush_i_cache, memset, exceptionHandler.
2. Insert these lines near the top of your program:
set_debug_traps();breakpoint();
3. For the 680x0 stub only, you need to provide a variable called exceptionHook. Nor-mally you just use:
void (*exceptionHook)() = 0;
but if before calling set_debug_traps, you set it to point to a function in your program,that function is called when GDB continues after stopping on a trap (for example, buserror). The function indicated by exceptionHook is called with one parameter: an int
which is the exception number.
4. Compile and link together: your program, the GDB debugging stub for your targetarchitecture, and the supporting subroutines.
5. Make sure you have a serial connection between your target machine and the GDBhost, and identify the serial port on the host.
6. Download your program to your target machine (or get it there by whatever means themanufacturer provides), and start it.
7. To start remote debugging, run GDB on the host machine, and specify as an executablefile the program that is running in the remote machine. This tells GDB how to findyour program’s symbols and the contents of its pure text.
8. Establish communication using the target remote command. Its argument specifieshow to communicate with the target machine—either via a devicename attached to adirect serial line, or a TCP port (usually to a terminal server which in turn has a serialline to the target). For example, to use a serial line connected to the device named‘/dev/ttyb’:
target remote /dev/ttyb
To use a TCP connection, use an argument of the form host:port. For example, toconnect to port 2828 on a terminal server named manyfarms:
target remote manyfarms:2828
If your remote target is actually running on the same machine as your debugger session(e.g. a simulator of your target running on the same host), you can omit the hostname.For example, to connect to port 1234 on your local machine:
target remote :1234
Note that the colon is still required here.

8/14/2019 Debugging With GDB - The GNU Source-Level Debugger
http://slidepdf.com/reader/full/debugging-with-gdb-the-gnu-source-level-debugger 156/328
Chapter 16: Debugging remote programs 145
Now you can use all the usual commands to examine and change data and to step andcontinue the remote program.
To resume the remote program and stop debugging it, use the detach command.
Whenever GDB is waiting for the remote program, if you type the interrupt character(often C-C), GDB attempts to stop the program. This may or may not succeed, dependingin part on the hardware and the serial drivers the remote system uses. If you type theinterrupt character once again, GDB displays this prompt:
Interrupted while waiting for the program.Give up (and stop debugging it)? (y or n)
If you type y , GDB abandons the remote debugging session. (If you decide you want totry again later, you can use ‘target remote’ again to connect once more.) If you type n,GDB goes back to waiting.

8/14/2019 Debugging With GDB - The GNU Source-Level Debugger
http://slidepdf.com/reader/full/debugging-with-gdb-the-gnu-source-level-debugger 157/328
146 Debugging with GDB

8/14/2019 Debugging With GDB - The GNU Source-Level Debugger
http://slidepdf.com/reader/full/debugging-with-gdb-the-gnu-source-level-debugger 158/328
Chapter 17: Configuration-Specific Information 147
17 Configuration-Specific Information
While nearly all GDB commands are available for all native and cross versions of the
debugger, there are some exceptions. This chapter describes things that are only availablein certain configurations.
There are three major categories of configurations: native configurations, where the hostand target are the same, embedded operating system configurations, which are usually thesame for several different processor architectures, and bare embedded processors, which arequite different from each other.
17.1 Native
This section describes details specific to particular native configurations.
17.1.1 HP-UX
On HP-UX systems, if you refer to a function or variable name that begins with a dollarsign, GDB searches for a user or system name first, before it searches for a conveniencevariable.
17.1.2 SVR4 process information
Many versions of SVR4 provide a facility called ‘/proc’ that can be used to examine
the image of a running process using file-system subroutines. If GDB is configured for anoperating system with this facility, the command info proc is available to report on severalkinds of information about the process running your program. info proc works only onSVR4 systems that include the procfs code. This includes OSF/1 (Digital Unix), Solaris,Irix, and Unixware, but not HP-UX or Linux, for example.
info proc Summarize available information about the process.
info proc mappings
Report on the address ranges accessible in the program, with information onwhether your program may read, write, or execute each range.
17.1.3 Features for Debugging djgpp Programs
djgpp is the port of gnu development tools to MS-DOS and MS-Windows. djgppprograms are 32-bit protected-mode programs that use the DPMI (DOS Protected-ModeInterface) API to run on top of real-mode DOS systems and their emulations.
GDB supports native debugging of djgpp programs, and defines a few commands specificto the djgpp port. This subsection describes those commands.
info dos This is a prefix of djgpp-specific commands which print information about the
target system and important OS structures.info dos sysinfo
This command displays assorted information about the underlying platform:the CPU type and features, the OS version and flavor, the DPMI version, andthe available conventional and DPMI memory.

8/14/2019 Debugging With GDB - The GNU Source-Level Debugger
http://slidepdf.com/reader/full/debugging-with-gdb-the-gnu-source-level-debugger 159/328
148 Debugging with GDB
info dos gdt
info dos ldt
info dos idt
These 3 commands display entries from, respectively, Global, Local, and Inter-rupt Descriptor Tables (GDT, LDT, and IDT). The descriptor tables are datastructures which store a descriptor for each segment that is currently in use.The segment’s selector is an index into a descriptor table; the table entry forthat index holds the descriptor’s base address and limit, and its attributes andaccess rights.
A typical djgpp program uses 3 segments: a code segment, a data segment(used for both data and the stack), and a DOS segment (which allows access toDOS/BIOS data structures and absolute addresses in conventional memory).However, the DPMI host will usually define additional segments in order tosupport the DPMI environment.
These commands allow to display entries from the descriptor tables. Withoutan argument, all entries from the specified table are displayed. An argument,which should be an integer expression, means display a single entry whose indexis given by the argument. For example, here’s a convenient way to displayinformation about the debugged program’s data segment:
(gdb) info dos ldt $ds0x13f: base=0x11970000 limit=0x0009ffff 32-Bit Data (Read/Write, Exp-up)
This comes in handy when you want to see whether a pointer is outside the
data segment’s limit (i.e. garbled ).
info dos pde
info dos pte
These two commands display entries from, respectively, the Page Directory andthe Page Tables. Page Directories and Page Tables are data structures whichcontrol how virtual memory addresses are mapped into physical addresses. APage Table includes an entry for every page of memory that is mapped into theprogram’s address space; there may be several Page Tables, each one holdingup to 4096 entries. A Page Directory has up to 4096 entries, one each for every
Page Table that is currently in use.Without an argument, info dos pde displays the entire Page Directory, andinfo dos pte displays all the entries in all of the Page Tables. An argument,an integer expression, given to the info dos pde command means display onlythat entry from the Page Directory table. An argument given to the info dos
pte command means display entries from a single Page Table, the one pointedto by the specified entry in the Page Directory.
These commands are useful when your program uses DMA (Direct MemoryAccess), which needs physical addresses to program the DMA controller.
These commands are supported only with some DPMI servers.info dos address-pte addr
This command displays the Page Table entry for a specified linear address. Theargument linear address addr should already have the appropriate segment’sbase address added to it, because this command accepts addresses which may

8/14/2019 Debugging With GDB - The GNU Source-Level Debugger
http://slidepdf.com/reader/full/debugging-with-gdb-the-gnu-source-level-debugger 160/328
Chapter 17: Configuration-Specific Information 149
belong to any segment. For example, here’s how to display the Page Tableentry for the page where the variable i is stored:
(gdb) info dos address-pte __djgpp_base_address + (char *)&i
Page Table entry for address 0x11a00d30:Base=0x02698000 Dirty Acc. Not-Cached Write-Back Usr Read-Write +0xd30
This says that i is stored at offset 0xd30 from the page whose physical baseaddress is 0x02698000, and prints all the attributes of that page.
Note that you must cast the addresses of variables to a char *, since oth-erwise the value of __djgpp_base_address, the base address of all variablesand functions in a djgpp program, will be added using the rules of C pointerarithmetics: if i is declared an int, GDB will add 4 times the value of __
djgpp_base_address to the address of i.
Here’s another example, it displays the Page Table entry for the transfer buffer:(gdb) info dos address-pte *((unsigned *)&_go32_info_block + 3)Page Table entry for address 0x29110:Base=0x00029000 Dirty Acc. Not-Cached Write-Back Usr Read-Write +0x110
(The + 3 offset is because the transfer buffer’s address is the 3rd member of the_go32_info_block structure.) The output of this command clearly shows thataddresses in conventional memory are mapped 1:1, i.e. the physical and linearaddresses are identical.
This command is supported only with some DPMI servers.
17.1.4 Features for Debugging MS Windows PE executables
GDB supports native debugging of MS Windows programs, and defines a few commandsspecific to the Cygwin port. This subsection describes those commands.
info w32 This is a prefix of MS Windows specific commands which print informationabout the target system and important OS structures.
info w32 selector
This command displays information returned by the Win32 API
GetThreadSelectorEntry function. It takes an optional argument that isevaluated to a long value to give the information about this given selector.Without argument, this command displays information about the the sixsegment registers.
info dll This is a Cygwin specific alias of info shared.
dll-symbols
This command loads symbols from a dll similarly to add-sym command butwithout the need to specify a base address.
set new-console mode If mode is on the debuggee will be started in a new console on next start. If mode is offi, the debuggee will be started in the same console as the debugger.
show new-console
Displays whether a new console is used when the debuggee is started.
8/14/2019 Debugging With GDB - The GNU Source-Level Debugger
http://slidepdf.com/reader/full/debugging-with-gdb-the-gnu-source-level-debugger 161/328
150 Debugging with GDB
set new-group mode This boolean value controls whether the debuggee should start a new group orstay in the same group as the debugger. This affects the way the Windows OS
handles Ctrl-C.
show new-group
Displays current value of new-group boolean.
set debugevents
This boolean value adds debug output concerning events seen by the debugger.
set debugexec
This boolean value adds debug output concerning execute events seen by thedebugger.
set debugexceptions
This boolean value adds debug ouptut concerning exception events seen by thedebugger.
set debugmemory
This boolean value adds debug ouptut concerning memory events seen by thedebugger.
set shell This boolean values specifies whether the debuggee is called via a shell or di-rectly (default value is on).
show shell
Displays if the debuggee will be started with a shell.
17.2 Embedded Operating Systems
This section describes configurations involving the debugging of embedded operatingsystems that are available for several different architectures.
GDB includes the ability to debug programs running on various real-time operating
systems.
17.2.1 Using GDB with VxWorks
target vxworks machinename A VxWorks system, attached via TCP/IP. The argument machinename is thetarget system’s machine name or IP address.
On VxWorks, load links filename dynamically on the current target system as well asadding its symbols in GDB.
GDB enables developers to spawn and debug tasks running on networked VxWorkstargets from a Unix host. Already-running tasks spawned from the VxWorks shell can alsobe debugged. GDB uses code that runs on both the Unix host and on the VxWorks target.The program gdb is installed and executed on the Unix host. (It may be installed with thename vxgdb, to distinguish it from a GDB for debugging programs on the host itself.)

8/14/2019 Debugging With GDB - The GNU Source-Level Debugger
http://slidepdf.com/reader/full/debugging-with-gdb-the-gnu-source-level-debugger 162/328
Chapter 17: Configuration-Specific Information 151
VxWorks-timeout args All VxWorks-based targets now support the option vxworks-timeout. Thisoption is set by the user, and args represents the number of seconds GDB waits
for responses to rpc’s. You might use this if your VxWorks target is a slowsoftware simulator or is on the far side of a thin network line.
The following information on connecting to VxWorks was current when this manual wasproduced; newer releases of VxWorks may use revised procedures.
To use GDB with VxWorks, you must rebuild your VxWorks kernel to include the remotedebugging interface routines in the VxWorks library ‘rdb.a’. To do this, define INCLUDE_
RDB in the VxWorks configuration file ‘configAll.h’ and rebuild your VxWorks kernel. Theresulting kernel contains ‘rdb.a’, and spawns the source debugging task tRdbTask whenVxWorks is booted. For more information on configuring and remaking VxWorks, see the
manufacturer’s manual.Once you have included ‘rdb.a’ in your VxWorks system image and set your Unix
execution search path to find GDB, you are ready to run GDB. From your Unix host, rungdb (or vxgdb, depending on your installation).
GDB comes up showing the prompt:
(vxgdb)
17.2.1.1 Connecting to VxWorks
The GDB command target lets you connect to a VxWorks target on the network. Toconnect to a target whose host name is “tt”, type:
(vxgdb) target vxworks tt
GDB displays messages like these:
Attaching remote machine across net...Connected to tt.
GDB then attempts to read the symbol tables of any object modules loaded into theVxWorks target since it was last booted. GDB locates these files by searching the directorieslisted in the command search path (see Section 4.4 [Your program’s environment], page 25);
if it fails to find an object file, it displays a message such as:prog.o: No such file or directory.
When this happens, add the appropriate directory to the search path with the GDBcommand path, and execute the target command again.
17.2.1.2 VxWorks download
If you have connected to the VxWorks target and you want to debug an object that hasnot yet been loaded, you can use the GDB load command to download a file from Unixto VxWorks incrementally. The object file given as an argument to the load command is
actually opened twice: first by the VxWorks target in order to download the code, thenby GDB in order to read the symbol table. This can lead to problems if the currentworking directories on the two systems differ. If both systems have NFS mounted the samefilesystems, you can avoid these problems by using absolute paths. Otherwise, it is simplestto set the working directory on both systems to the directory in which the object file resides,
8/14/2019 Debugging With GDB - The GNU Source-Level Debugger
http://slidepdf.com/reader/full/debugging-with-gdb-the-gnu-source-level-debugger 163/328
152 Debugging with GDB
and then to reference the file by its name, without any path. For instance, a program‘prog.o’ may reside in ‘vxpath/vw/demo/rdb’ in VxWorks and in ‘hostpath/vw/demo/rdb’on the host. To load this program, type this on VxWorks:
-> cd "vxpath/vw/demo/rdb"
Then, in GDB, type:
(vxgdb) cd hostpath/vw/demo/rdb(vxgdb) load prog.o
GDB displays a response similar to this:
Reading symbol data from wherever/vw/demo/rdb/prog.o... done.
You can also use the load command to reload an object module after editing and recom-piling the corresponding source file. Note that this makes GDB delete all currently-defined
breakpoints, auto-displays, and convenience variables, and to clear the value history. (Thisis necessary in order to preserve the integrity of debugger’s data structures that referencethe target system’s symbol table.)
17.2.1.3 Running tasks
You can also attach to an existing task using the attach command as follows:
(vxgdb) attach task
where task is the VxWorks hexadecimal task ID. The task can be running or suspended
when you attach to it. Running tasks are suspended at the time of attachment.
17.3 Embedded Processors
This section goes into details specific to particular embedded configurations.
17.3.1 ARM
target rdi dev
ARM Angel monitor, via RDI library interface to ADP protocol. You may usethis target to communicate with both boards running the Angel monitor, orwith the EmbeddedICE JTAG debug device.
target rdp dev ARM Demon monitor.
17.3.2 Hitachi H8/300
target hms dev
A Hitachi SH, H8/300, or H8/500 board, attached via serial line to your host.Use special commands device and speed to control the serial line and thecommunications speed used.
target e7000 dev E7000 emulator for Hitachi H8 and SH.
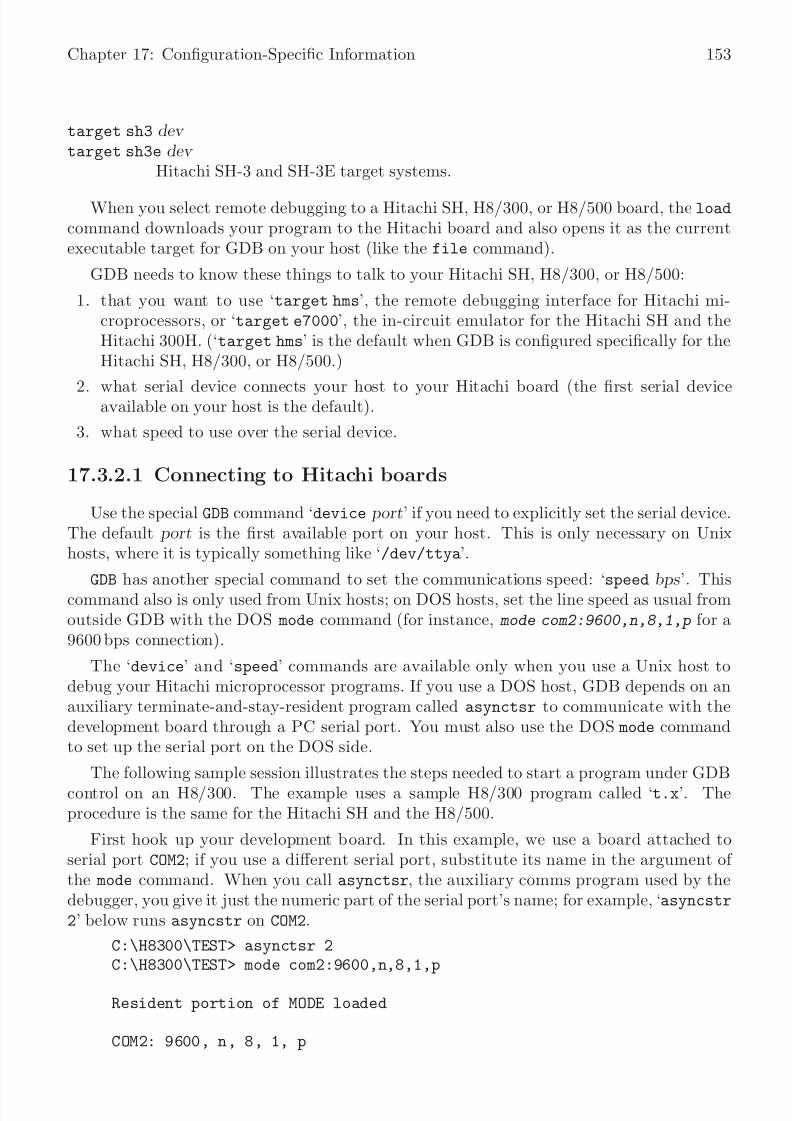
8/14/2019 Debugging With GDB - The GNU Source-Level Debugger
http://slidepdf.com/reader/full/debugging-with-gdb-the-gnu-source-level-debugger 164/328
Chapter 17: Configuration-Specific Information 153
target sh3 dev target sh3e dev
Hitachi SH-3 and SH-3E target systems.
When you select remote debugging to a Hitachi SH, H8/300, or H8/500 board, the load
command downloads your program to the Hitachi board and also opens it as the currentexecutable target for GDB on your host (like the file command).
GDB needs to know these things to talk to your Hitachi SH, H8/300, or H8/500:
1. that you want to use ‘target hms’, the remote debugging interface for Hitachi mi-croprocessors, or ‘target e7000’, the in-circuit emulator for the Hitachi SH and theHitachi 300H. (‘target hms’ is the default when GDB is configured specifically for theHitachi SH, H8/300, or H8/500.)
2. what serial device connects your host to your Hitachi board (the first serial deviceavailable on your host is the default).
3. what speed to use over the serial device.
17.3.2.1 Connecting to Hitachi boards
Use the special GDB command ‘device port’ if you need to explicitly set the serial device.The default port is the first available port on your host. This is only necessary on Unixhosts, where it is typically something like ‘/dev/ttya’.
GDB has another special command to set the communications speed: ‘speed bps ’. Thiscommand also is only used from Unix hosts; on DOS hosts, set the line speed as usual fromoutside GDB with the DOS mode command (for instance, mode com2:9600,n,8,1,p for a9600 bps connection).
The ‘device’ and ‘speed’ commands are available only when you use a Unix host todebug your Hitachi microprocessor programs. If you use a DOS host, GDB depends on anauxiliary terminate-and-stay-resident program called asynctsr to communicate with thedevelopment board through a PC serial port. You must also use the DOS mode commandto set up the serial port on the DOS side.
The following sample session illustrates the steps needed to start a program under GDBcontrol on an H8/300. The example uses a sample H8/300 program called ‘t.x’. Theprocedure is the same for the Hitachi SH and the H8/500.
First hook up your development board. In this example, we use a board attached toserial port COM2; if you use a different serial port, substitute its name in the argument of the mode command. When you call asynctsr, the auxiliary comms program used by thedebugger, you give it just the numeric part of the serial port’s name; for example, ‘asyncstr
2’ below runs asyncstr on COM2.
C:\H8300\TEST> asynctsr 2
C:\H8300\TEST> mode com2:9600,n,8,1,p
Resident portion of MODE loaded
COM2: 9600, n, 8, 1, p

8/14/2019 Debugging With GDB - The GNU Source-Level Debugger
http://slidepdf.com/reader/full/debugging-with-gdb-the-gnu-source-level-debugger 165/328
154 Debugging with GDB
Warning: We have noticed a bug in PC-NFS that conflicts with asynctsr. If you also run PC-NFS on your DOS host, you may need to disable it, or evenboot without it, to use asynctsr to control your development board.
Now that serial communications are set up, and the development board is connected,you can start up GDB. Call gdb with the name of your program as the argument. GDB
prompts you, as usual, with the prompt ‘(gdb)’. Use two special commands to begin yourdebugging session: ‘target hms’ to specify cross-debugging to the Hitachi board, and theload command to download your program to the board. load displays the names of theprogram’s sections, and a ‘*’ for each 2K of data downloaded. (If you want to refresh GDBdata on symbols or on the executable file without downloading, use the GDB commandsfile or symbol-file. These commands, and load itself, are described in Section 14.1[Commands to specify files], page 127.)
(eg-C:\H8300\TEST) gdb t.xGDB is free software and you are welcome to distribute copies
of it under certain conditions; type "show copying" to seethe conditions.
There is absolutely no warranty for GDB; type "show warranty"for details.GDB 5.2.1, Copyright 1992 Free Software Foundation, Inc...(gdb) target hmsConnected to remote H8/300 HMS system.(gdb) load t.x.text : 0x8000 .. 0xabde ***********
.data : 0xabde .. 0xad30 *
.stack : 0xf000 .. 0xf014 *
At this point, you’re ready to run or debug your program. From here on, you can useall the usual GDB commands. The break command sets breakpoints; the run commandstarts your program; print or x display data; the continue command resumes executionafter stopping at a breakpoint. You can use the help command at any time to find outmore about GDB commands.
Remember, however, that operating system facilities aren’t available on your develop-ment board; for example, if your program hangs, you can’t send an interrupt—but you can
press the reset switch!Use the reset button on the development board
• to interrupt your program (don’t use ctl-C on the DOS host—it has no way to passan interrupt signal to the development board); and
• to return to the GDB command prompt after your program finishes normally. Thecommunications protocol provides no other way for GDB to detect program completion.
In either case, GDB sees the effect of a reset on the development board as a “normalexit” of your program.
17.3.2.2 Using the E7000 in-circuit emulator
You can use the E7000 in-circuit emulator to develop code for either the Hitachi SH orthe H8/300H. Use one of these forms of the ‘target e7000’ command to connect GDB toyour E7000:
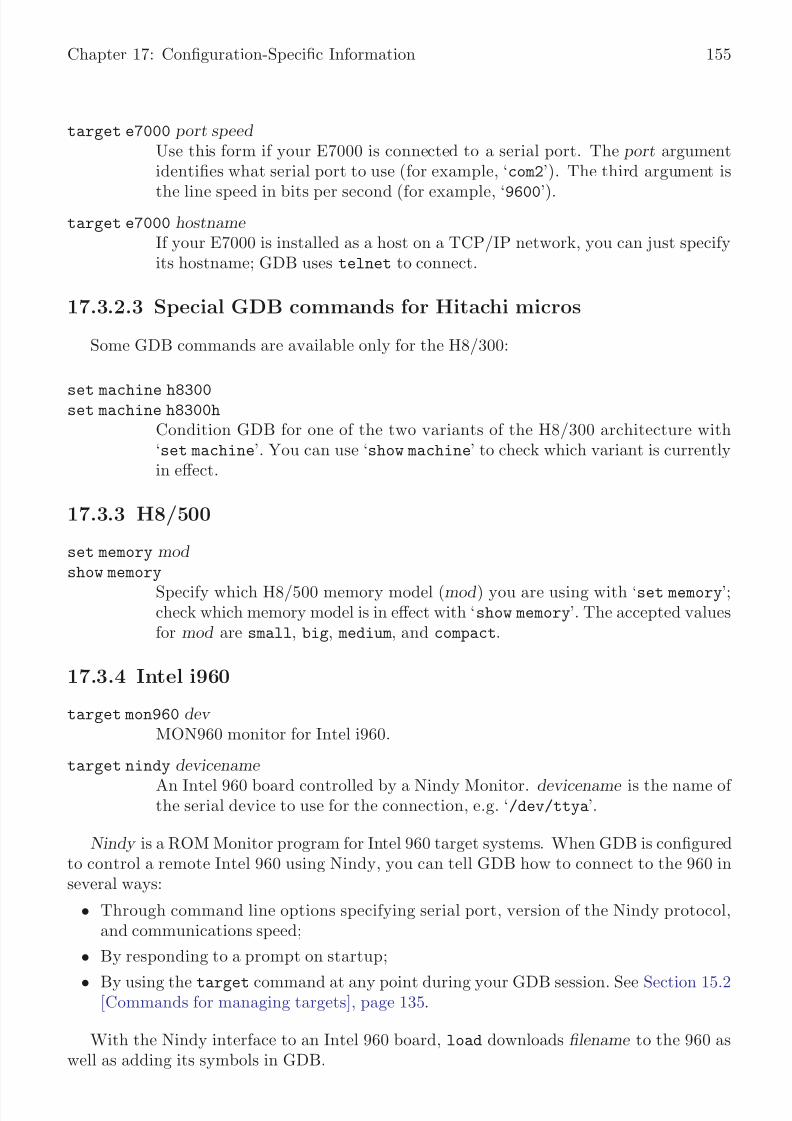
8/14/2019 Debugging With GDB - The GNU Source-Level Debugger
http://slidepdf.com/reader/full/debugging-with-gdb-the-gnu-source-level-debugger 166/328
Chapter 17: Configuration-Specific Information 155
target e7000 port speed Use this form if your E7000 is connected to a serial port. The port argumentidentifies what serial port to use (for example, ‘com2’). The third argument is
the line speed in bits per second (for example, ‘9600’).
target e7000 hostname If your E7000 is installed as a host on a TCP/IP network, you can just specifyits hostname; GDB uses telnet to connect.
17.3.2.3 Special GDB commands for Hitachi micros
Some GDB commands are available only for the H8/300:
set machine h8300set machine h8300h
Condition GDB for one of the two variants of the H8/300 architecture with‘set machine’. You can use ‘show machine’ to check which variant is currentlyin effect.
17.3.3 H8/500
set memory mod show memory
Specify which H8/500 memory model (mod ) you are using with ‘set memory’;check which memory model is in effect with ‘show memory’. The accepted valuesfor mod are small, big, medium, and compact.
17.3.4 Intel i960
target mon960 dev MON960 monitor for Intel i960.
target nindy devicename An Intel 960 board controlled by a Nindy Monitor. devicename is the name of the serial device to use for the connection, e.g. ‘/dev/ttya’.
Nindy is a ROM Monitor program for Intel 960 target systems. When GDB is configuredto control a remote Intel 960 using Nindy, you can tell GDB how to connect to the 960 inseveral ways:
• Through command line options specifying serial port, version of the Nindy protocol,and communications speed;
• By responding to a prompt on startup;
• By using the target command at any point during your GDB session. See Section 15.2[Commands for managing targets], page 135.
With the Nindy interface to an Intel 960 board, load downloads filename to the 960 aswell as adding its symbols in GDB.

8/14/2019 Debugging With GDB - The GNU Source-Level Debugger
http://slidepdf.com/reader/full/debugging-with-gdb-the-gnu-source-level-debugger 167/328
156 Debugging with GDB
17.3.4.1 Startup with Nindy
If you simply start gdb without using any command-line options, you are prompted for
what serial port to use, before you reach the ordinary GDB prompt:Attach /dev/ttyNN -- specify NN, or "quit" to quit:
Respond to the prompt with whatever suffix (after ‘/dev/tty’) identifies the serial portyou want to use. You can, if you choose, simply start up with no Nindy connection byresponding to the prompt with an empty line. If you do this and later wish to attach toNindy, use target (see Section 15.2 [Commands for managing targets], page 135).
17.3.4.2 Options for Nindy
These are the startup options for beginning your GDB session with a Nindy-960 boardattached:
-r port Specify the serial port name of a serial interface to be used to connect to thetarget system. This option is only available when GDB is configured for theIntel 960 target architecture. You may specify port as any of: a full pathname(e.g. ‘-r /dev/ttya’), a device name in ‘/dev’ (e.g. ‘-r ttya’), or simply theunique suffix for a specific tty (e.g. ‘-r a’).
-O (An uppercase letter “O”, not a zero.) Specify that GDB should use the “old”
Nindy monitor protocol to connect to the target system. This option is onlyavailable when GDB is configured for the Intel 960 target architecture.
Warning: if you specify ‘-O’, but are actually trying to connectto a target system that expects the newer protocol, the connectionfails, appearing to be a speed mismatch. GDB repeatedly attemptsto reconnect at several different line speeds. You can abort thisprocess with an interrupt.
-brk Specify that GDB should first send a BREAK signal to the target system, in anattempt to reset it, before connecting to a Nindy target.
Warning: Many target systems do not have the hardware that thisrequires; it only works with a few boards.
The standard ‘-b’ option controls the line speed used on the serial port.
17.3.4.3 Nindy reset command
reset For a Nindy target, this command sends a “break” to the remote target system;this is only useful if the target has been equipped with a circuit to perform ahard reset (or some other interesting action) when a break is detected.
17.3.5 Mitsubishi M32R/D
target m32r dev Mitsubishi M32R/D ROM monitor.

8/14/2019 Debugging With GDB - The GNU Source-Level Debugger
http://slidepdf.com/reader/full/debugging-with-gdb-the-gnu-source-level-debugger 168/328
Chapter 17: Configuration-Specific Information 157
17.3.6 M68k
The Motorola m68k configuration includes ColdFire support, and target command for
the following ROM monitors.
target abug dev ABug ROM monitor for M68K.
target cpu32bug dev CPU32BUG monitor, running on a CPU32 (M68K) board.
target dbug dev dBUG ROM monitor for Motorola ColdFire.
target est dev EST-300 ICE monitor, running on a CPU32 (M68K) board.
target rom68k dev ROM 68K monitor, running on an M68K IDP board.
If GDB is configured with m68*-ericsson-*, it will instead have only a single specialtarget command:
target es1800 dev ES-1800 emulator for M68K.
[context?]
target rombug dev ROMBUG ROM monitor for OS/9000.
17.3.7 M88K
target bug dev BUG monitor, running on a MVME187 (m88k) board.
17.3.8 MIPS Embedded
GDB can use the MIPS remote debugging protocol to talk to a MIPS board attached toa serial line. This is available when you configure GDB with ‘--target=mips-idt-ecoff’.
Use these GDB commands to specify the connection to your target board:
target mips portTo run a program on the board, start up gdb with the name of your programas the argument. To connect to the board, use the command ‘target mips
port’, where port is the name of the serial port connected to the board. If theprogram has not already been downloaded to the board, you may use the load
command to download it. You can then use all the usual GDB commands.
For example, this sequence connects to the target board through a serial port,and loads and runs a program called prog through the debugger:

8/14/2019 Debugging With GDB - The GNU Source-Level Debugger
http://slidepdf.com/reader/full/debugging-with-gdb-the-gnu-source-level-debugger 169/328
158 Debugging with GDB
host$ gdb prog GDB is free software and ...(gdb) target mips /dev/ttyb
(gdb) load prog (gdb) run
target mips hostname : portnumber On some GDB host configurations, you can specify a TCP connection (forinstance, to a serial line managed by a terminal concentrator) instead of aserial port, using the syntax ‘hostname : portnumber ’.
target pmon portPMON ROM monitor.
target ddb portNEC’s DDB variant of PMON for Vr4300.
target lsi portLSI variant of PMON.
target r3900 dev Densan DVE-R3900 ROM monitor for Toshiba R3900 Mips.
target array dev Array Tech LSI33K RAID controller board.
GDB also supports these special commands for MIPS targets:
set processor args show processor
Use the set processor command to set the type of MIPS processor when youwant to access processor-type-specific registers. For example, set processor
r3041 tells GDB to use the CPU registers appropriate for the 3041 chip. Usethe show processor command to see what MIPS processor GDB is using. Usethe info reg command to see what registers GDB is using.
set mipsfpu double
set mipsfpu singleset mipsfpu none
show mipsfpu
If your target board does not support the MIPS floating point coprocessor,you should use the command ‘set mipsfpu none’ (if you need this, you maywish to put the command in your GDB init file). This tells GDB how tofind the return value of functions which return floating point values. It alsoallows GDB to avoid saving the floating point registers when calling functionson the board. If you are using a floating point coprocessor with only singleprecision floating point support, as on the r4650 processor, use the command
‘set mipsfpu single’. The default double precision floating point coprocessormay be selected using ‘set mipsfpu double’.
In previous versions the only choices were double precision or no floating point,so ‘set mipsfpu on’ will select double precision and ‘set mipsfpu off’ will se-lect no floating point.
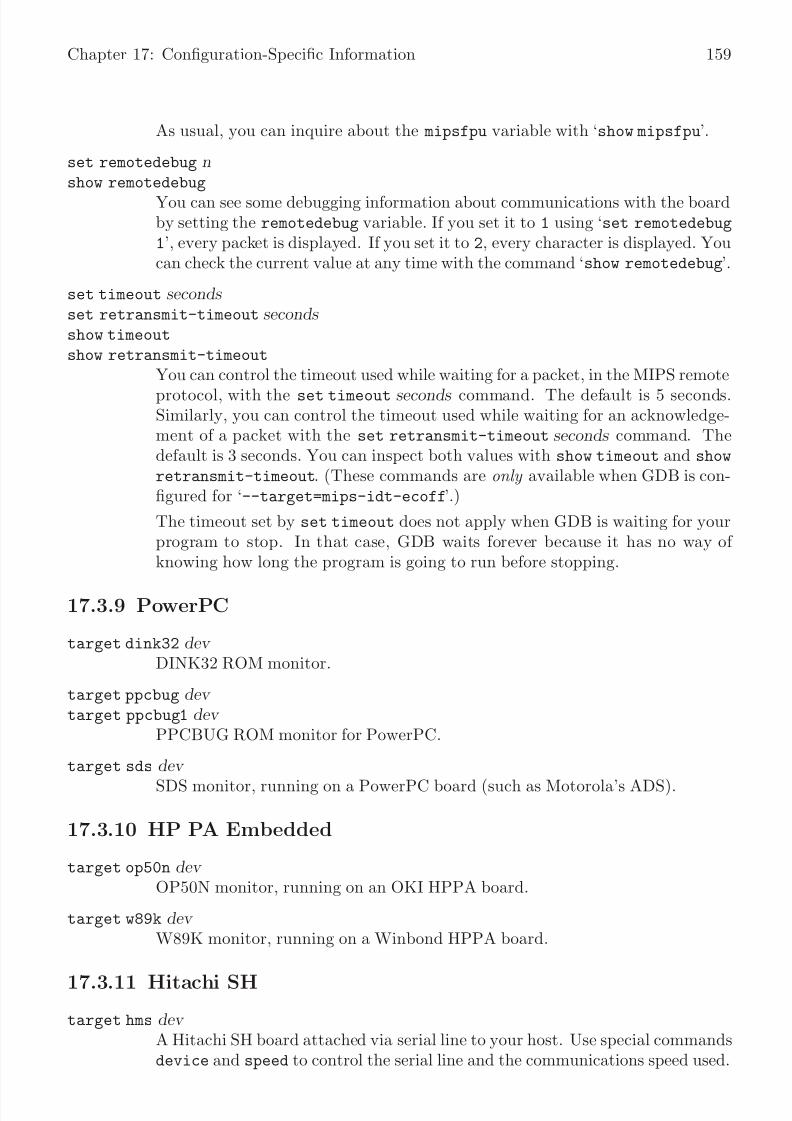
8/14/2019 Debugging With GDB - The GNU Source-Level Debugger
http://slidepdf.com/reader/full/debugging-with-gdb-the-gnu-source-level-debugger 170/328

8/14/2019 Debugging With GDB - The GNU Source-Level Debugger
http://slidepdf.com/reader/full/debugging-with-gdb-the-gnu-source-level-debugger 171/328
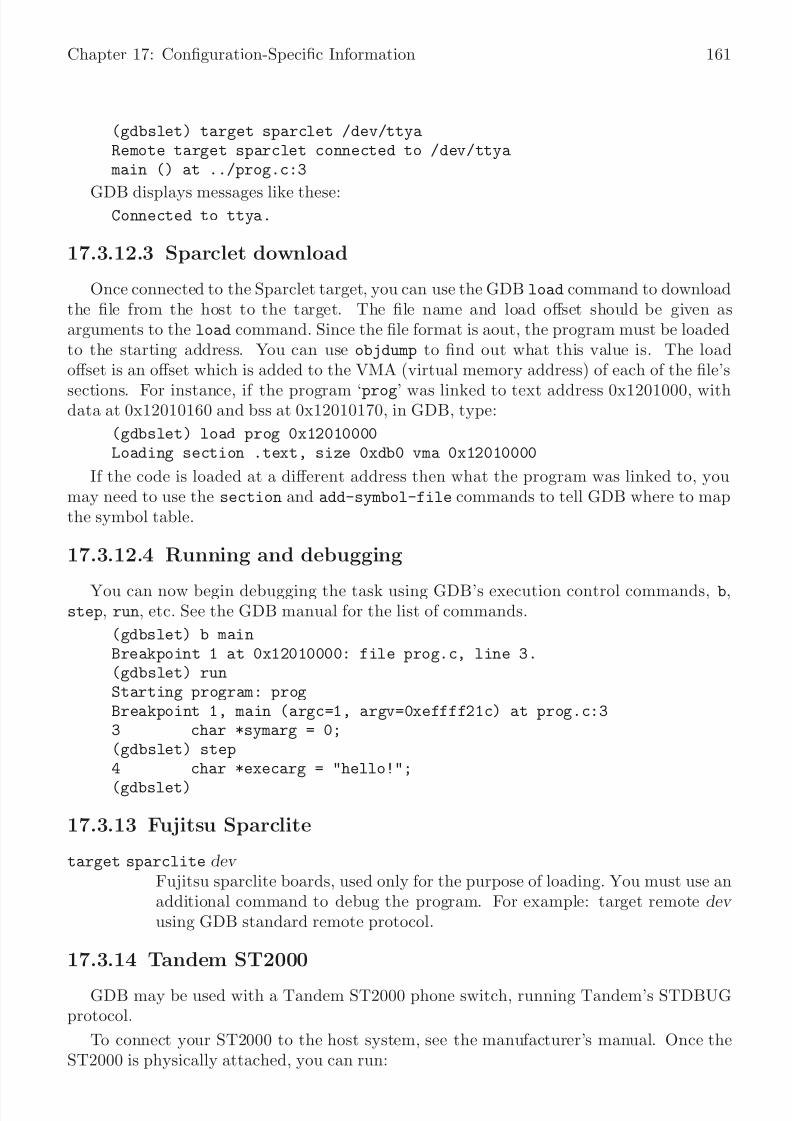
8/14/2019 Debugging With GDB - The GNU Source-Level Debugger
http://slidepdf.com/reader/full/debugging-with-gdb-the-gnu-source-level-debugger 172/328
Chapter 17: Configuration-Specific Information 161
(gdbslet) target sparclet /dev/ttyaRemote target sparclet connected to /dev/ttya main () at ../prog.c:3
GDB displays messages like these:Connected to ttya.
17.3.12.3 Sparclet download
Once connected to the Sparclet target, you can use the GDB load command to downloadthe file from the host to the target. The file name and load offset should be given asarguments to the load command. Since the file format is aout, the program must be loadedto the starting address. You can use objdump to find out what this value is. The loadoffset is an offset which is added to the VMA (virtual memory address) of each of the file’s
sections. For instance, if the program ‘prog’ was linked to text address 0x1201000, withdata at 0x12010160 and bss at 0x12010170, in GDB, type:
(gdbslet) load prog 0x12010000Loading section .text, size 0xdb0 vma 0x12010000
If the code is loaded at a different address then what the program was linked to, youmay need to use the section and add-symbol-file commands to tell GDB where to mapthe symbol table.
17.3.12.4 Running and debugging
You can now begin debugging the task using GDB’s execution control commands, b,step, run, etc. See the GDB manual for the list of commands.
(gdbslet) b mainBreakpoint 1 at 0x12010000: file prog.c, line 3.(gdbslet) runStarting program: progBreakpoint 1, main (argc=1, argv=0xeffff21c) at prog.c:33 char *symarg = 0;(gdbslet) step4 char *execarg = "hello!";(gdbslet)
17.3.13 Fujitsu Sparclite
target sparclite dev Fujitsu sparclite boards, used only for the purpose of loading. You must use anadditional command to debug the program. For example: target remote dev using GDB standard remote protocol.
17.3.14 Tandem ST2000
GDB may be used with a Tandem ST2000 phone switch, running Tandem’s STDBUGprotocol.
To connect your ST2000 to the host system, see the manufacturer’s manual. Once theST2000 is physically attached, you can run:

8/14/2019 Debugging With GDB - The GNU Source-Level Debugger
http://slidepdf.com/reader/full/debugging-with-gdb-the-gnu-source-level-debugger 173/328
162 Debugging with GDB
target st2000 dev speed
to establish it as your debugging environment. dev is normally the name of a serial device,such as ‘/dev/ttya’, connected to the ST2000 via a serial line. You can instead specify dev
as a TCP connection (for example, to a serial line attached via a terminal concentrator)using the syntax hostname : portnumber .
The load and attach commands are not defined for this target; you must load yourprogram into the ST2000 as you normally would for standalone operation. GDB readsdebugging information (such as symbols) from a separate, debugging version of the programavailable on your host computer.
These auxiliary GDB commands are available to help you with the ST2000 environment:
st2000 command
Send a command to the STDBUG monitor. See the manufacturer’s manual foravailable commands.
connect Connect the controlling terminal to the STDBUG command monitor. Whenyou are done interacting with STDBUG, typing either of two character se-quences gets you back to the GDB command prompt: RET~. (Return, followedby tilde and period) or RET~C-d (Return, followed by tilde and control-D).
17.3.15 Zilog Z8000
When configured for debugging Zilog Z8000 targets, GDB includes a Z8000 simulator.
For the Z8000 family, ‘target sim’ simulates either the Z8002 (the unsegmented variantof the Z8000 architecture) or the Z8001 (the segmented variant). The simulator recognizeswhich architecture is appropriate by inspecting the object code.
target sim args Debug programs on a simulated CPU. If the simulator supports setup options,specify them via args .
After specifying this target, you can debug programs for the simulated CPU in the samestyle as programs for your host computer; use the file command to load a new programimage, the run command to run your program, and so on.
As well as making available all the usual machine registers (see Section 8.10 [Registers],page 77), the Z8000 simulator provides three additional items of information as speciallynamed registers:
cycles Counts clock-ticks in the simulator.
insts Counts instructions run in the simulator.
time Execution time in 60ths of a second.
You can refer to these values in GDB expressions with the usual conventions; for example,‘b fputc if $cycles>5000’ sets a conditional breakpoint that suspends only after at least5000 simulated clock ticks.

8/14/2019 Debugging With GDB - The GNU Source-Level Debugger
http://slidepdf.com/reader/full/debugging-with-gdb-the-gnu-source-level-debugger 174/328
Chapter 17: Configuration-Specific Information 163
17.4 Architectures
This section describes characteristics of architectures that affect all uses of GDB with
the architecture, both native and cross.
17.4.1 A29K
set rstack_high_address address On AMD 29000 family processors, registers are saved in a separate register stack . There is no way for GDB to determine the extent of this stack. Normally,GDB just assumes that the stack is “large enough”. This may result in GDBreferencing memory locations that do not exist. If necessary, you can get aroundthis problem by specifying the ending address of the register stack with the set
rstack_high_address command. The argument should be an address, whichyou probably want to precede with ‘0x’ to specify in hexadecimal.
show rstack_high_address
Display the current limit of the register stack, on AMD 29000 family processors.
17.4.2 Alpha
See the following section.
17.4.3 MIPS
Alpha- and MIPS-based computers use an unusual stack frame, which sometimes requiresGDB to search backward in the object code to find the beginning of a function.
To improve response time (especially for embedded applications, where GDB may berestricted to a slow serial line for this search) you may want to limit the size of this search,using one of these commands:
set heuristic-fence-post limitRestrict GDB to examining at most limit bytes in its search for the beginning
of a function. A value of 0 (the default) means there is no limit. However,except for 0 , the larger the limit the more bytes heuristic-fence-post mustsearch and therefore the longer it takes to run.
show heuristic-fence-post
Display the current limit.
These commands are available only when GDB is configured for debugging programs onAlpha or MIPS processors.

8/14/2019 Debugging With GDB - The GNU Source-Level Debugger
http://slidepdf.com/reader/full/debugging-with-gdb-the-gnu-source-level-debugger 175/328
164 Debugging with GDB

8/14/2019 Debugging With GDB - The GNU Source-Level Debugger
http://slidepdf.com/reader/full/debugging-with-gdb-the-gnu-source-level-debugger 176/328
Chapter 18: Controlling GDB 165
18 Controlling GDB
You can alter the way GDB interacts with you by using the set command. For commands
controlling how GDB displays data, see Section 8.7 [Print settings], page 70. Other settingsare described here.
18.1 Prompt
GDB indicates its readiness to read a command by printing a string called the prompt.This string is normally ‘(gdb)’. You can change the prompt string with the set prompt
command. For instance, when debugging GDB with GDB, it is useful to change the promptin one of the GDB sessions so that you can always tell which one you are talking to.
Note: set prompt does not add a space for you after the prompt you set. This allowsyou to set a prompt which ends in a space or a prompt that does not.
set prompt newpromptDirects GDB to use newprompt as its prompt string henceforth.
show prompt
Prints a line of the form: ‘Gdb’s prompt is: your-prompt’
18.2 Command editing
GDB reads its input commands via the readline interface. This gnu library providesconsistent behavior for programs which provide a command line interface to the user. Ad-vantages are gnu Emacs-style or vi -style inline editing of commands, csh-like history sub-stitution, and a storage and recall of command history across debugging sessions.
You may control the behavior of command line editing in GDB with the command set.
set editing
set editing on
Enable command line editing (enabled by default).
set editing off
Disable command line editing.
show editing
Show whether command line editing is enabled.
18.3 Command history
GDB can keep track of the commands you type during your debugging sessions, so thatyou can be certain of precisely what happened. Use these commands to manage the GDBcommand history facility.
set history filename fname Set the name of the GDB command history file to fname . This is the file whereGDB reads an initial command history list, and where it writes the command
8/14/2019 Debugging With GDB - The GNU Source-Level Debugger
http://slidepdf.com/reader/full/debugging-with-gdb-the-gnu-source-level-debugger 177/328
166 Debugging with GDB
history from this session when it exits. You can access this list through historyexpansion or through the history command editing characters listed below.This file defaults to the value of the environment variable GDBHISTFILE, or to
‘./.gdb_history’ (‘./_gdb_history’ on MS-DOS) if this variable is not set.set history save
set history save on
Record command history in a file, whose name may be specified with the set
history filename command. By default, this option is disabled.
set history save off
Stop recording command history in a file.
set history size size Set the number of commands which GDB keeps in its history list. This defaults
to the value of the environment variable HISTSIZE, or to 256 if this variable isnot set.
History expansion assigns special meaning to the character !.
Since ! is also the logical not operator in C, history expansion is off by default. If youdecide to enable history expansion with the set history expansion on command, you maysometimes need to follow ! (when it is used as logical not, in an expression) with a spaceor a tab to prevent it from being expanded. The readline history facilities do not attemptsubstitution on the strings != and !( , even when history expansion is enabled.
The commands to control history expansion are:
set history expansion on
set history expansion
Enable history expansion. History expansion is off by default.
set history expansion off
Disable history expansion.
The readline code comes with more complete documentation of editing andhistory expansion features. Users unfamiliar with gnu Emacs or vi may wishto read it.
show history
show history filename
show history save
show history size
show history expansion
These commands display the state of the GDB history parameters. show
history by itself displays all four states.
show commands
Display the last ten commands in the command history.
show commands nPrint ten commands centered on command number n.
show commands +
Print ten commands just after the commands last printed.
8/14/2019 Debugging With GDB - The GNU Source-Level Debugger
http://slidepdf.com/reader/full/debugging-with-gdb-the-gnu-source-level-debugger 178/328
Chapter 18: Controlling GDB 167
18.4 Screen size
Certain commands to GDB may produce large amounts of information output to the
screen. To help you read all of it, GDB pauses and asks you for input at the end of eachpage of output. Type RET when you want to continue the output, or q to discard theremaining output. Also, the screen width setting determines when to wrap lines of output.Depending on what is being printed, GDB tries to break the line at a readable place, ratherthan simply letting it overflow onto the following line.
Normally GDB knows the size of the screen from the terminal driver software. Forexample, on Unix GDB uses the termcap data base together with the value of the TERM
environment variable and the stty rows and stty cols settings. If this is not correct, youcan override it with the set height and set width commands:
set height lppshow height
set width cpl show width
These set commands specify a screen height of lpp lines and a screen width of cpl characters. The associated show commands display the current settings.
If you specify a height of zero lines, GDB does not pause during output nomatter how long the output is. This is useful if output is to a file or to aneditor buffer.
Likewise, you can specify ‘set width 0’ to prevent GDB from wrapping itsoutput.
18.5 Numbers
You can always enter numbers in octal, decimal, or hexadecimal in GDB by the usualconventions: octal numbers begin with ‘0’, decimal numbers end with ‘.’, and hexadecimalnumbers begin with ‘0x’. Numbers that begin with none of these are, by default, entered inbase 10; likewise, the default display for numbers—when no particular format is specified—is base 10. You can change the default base for both input and output with the set radix
command.
set input-radix base Set the default base for numeric input. Supported choices for base are decimal8, 10, or 16. base must itself be specified either unambiguously or using thecurrent default radix; for example, any of
set radix 012set radix 10.set radix 0xa
sets the base to decimal. On the other hand, ‘set radix 10’ leaves the radix
unchanged no matter what it was.set output-radix base
Set the default base for numeric display. Supported choices for base are decimal8, 10, or 16. base must itself be specified either unambiguously or using thecurrent default radix.
8/14/2019 Debugging With GDB - The GNU Source-Level Debugger
http://slidepdf.com/reader/full/debugging-with-gdb-the-gnu-source-level-debugger 179/328
168 Debugging with GDB
show input-radix
Display the current default base for numeric input.
show output-radix
Display the current default base for numeric display.
18.6 Optional warnings and messages
By default, GDB is silent about its inner workings. If you are running on a slow machine,you may want to use the set verbose command. This makes GDB tell you when it does alengthy internal operation, so you will not think it has crashed.
Currently, the messages controlled by set verbose are those which announce that thesymbol table for a source file is being read; see symbol-file in Section 14.1 [Commands to
specify files], page 127.set verbose on
Enables GDB output of certain informational messages.
set verbose off
Disables GDB output of certain informational messages.
show verbose
Displays whether set verbose is on or off.
By default, if GDB encounters bugs in the symbol table of an object file, it is silent;
but if you are debugging a compiler, you may find this information useful (see Section 14.2[Errors reading symbol files], page 132).
set complaints limitPermits GDB to output limit complaints about each type of unusual symbolsbefore becoming silent about the problem. Set limit to zero to suppress all com-plaints; set it to a large number to prevent complaints from being suppressed.
show complaints
Displays how many symbol complaints GDB is permitted to produce.
By default, GDB is cautious, and asks what sometimes seems to be a lot of stupid
questions to confirm certain commands. For example, if you try to run a program which isalready running:
(gdb) runThe program being debugged has been started already.Start it from the beginning? (y or n)
If you are willing to unflinchingly face the consequences of your own commands, you candisable this “feature”:
set confirm off
Disables confirmation requests.
set confirm on
Enables confirmation requests (the default).
show confirm
Displays state of confirmation requests.

8/14/2019 Debugging With GDB - The GNU Source-Level Debugger
http://slidepdf.com/reader/full/debugging-with-gdb-the-gnu-source-level-debugger 180/328
Chapter 18: Controlling GDB 169
18.7 Optional messages about internal happenings
set debug arch
Turns on or off display of gdbarch debugging info. The default is off show debug arch
Displays the current state of displaying gdbarch debugging info.
set debug event
Turns on or off display of GDB event debugging info. The default is off.
show debug event
Displays the current state of displaying GDB event debugging info.
set debug expression
Turns on or off display of GDB expression debugging info. The default is off.show debug expression
Displays the current state of displaying GDB expression debugging info.
set debug overload
Turns on or off display of GDB C++ overload debugging info. This includes infosuch as ranking of functions, etc. The default is off.
show debug overload
Displays the current state of displaying GDB C++ overload debugging info.
set debug remoteTurns on or off display of reports on all packets sent back and forth across theserial line to the remote machine. The info is printed on the GDB standardoutput stream. The default is off.
show debug remote
Displays the state of display of remote packets.
set debug serial
Turns on or off display of GDB serial debugging info. The default is off.
show debug serialDisplays the current state of displaying GDB serial debugging info.
set debug target
Turns on or off display of GDB target debugging info. This info includes whatis going on at the target level of GDB, as it happens. The default is off.
show debug target
Displays the current state of displaying GDB target debugging info.
set debug varobj
Turns on or off display of GDB variable object debugging info. The default isoff.
show debug varobj
Displays the current state of displaying GDB variable object debugging info.

8/14/2019 Debugging With GDB - The GNU Source-Level Debugger
http://slidepdf.com/reader/full/debugging-with-gdb-the-gnu-source-level-debugger 181/328
170 Debugging with GDB
8/14/2019 Debugging With GDB - The GNU Source-Level Debugger
http://slidepdf.com/reader/full/debugging-with-gdb-the-gnu-source-level-debugger 182/328
Chapter 19: Canned Sequences of Commands 171
19 Canned Sequences of Commands
Aside from breakpoint commands (see Section 5.1.7 [Breakpoint command lists],
page 43), GDB provides two ways to store sequences of commands for execution as a unit:user-defined commands and command files.
19.1 User-defined commands
A user-defined command is a sequence of GDB commands to which you assign a newname as a command. This is done with the define command. User commands may acceptup to 10 arguments separated by whitespace. Arguments are accessed within the usercommand via $arg0. . . $arg9 . A trivial example:
define adder
print $arg0 + $arg1 + $arg2
To execute the command use:
adder 1 2 3
This defines the command adder, which prints the sum of its three arguments. Note thearguments are text substitutions, so they may reference variables, use complex expressions,or even perform inferior functions calls.
define commandname Define a command named commandname . If there is already a command by
that name, you are asked to confirm that you want to redefine it.The definition of the command is made up of other GDB command lines, whichare given following the define command. The end of these commands is markedby a line containing end.
if Takes a single argument, which is an expression to evaluate. It is followed by aseries of commands that are executed only if the expression is true (nonzero).There can then optionally be a line else, followed by a series of commands thatare only executed if the expression was false. The end of the list is marked bya line containing end.
while The syntax is similar to if: the command takes a single argument, which isan expression to evaluate, and must be followed by the commands to execute,one per line, terminated by an end. The commands are executed repeatedly aslong as the expression evaluates to true.
document commandname Document the user-defined command commandname , so that it can be ac-cessed by help. The command commandname must already be defined. Thiscommand reads lines of documentation just as define reads the lines of thecommand definition, ending with end. After the document command is fin-
ished, help on command commandname displays the documentation you havewritten.
You may use the document command again to change the documentation of acommand. Redefining the command with define does not change the docu-mentation.

8/14/2019 Debugging With GDB - The GNU Source-Level Debugger
http://slidepdf.com/reader/full/debugging-with-gdb-the-gnu-source-level-debugger 183/328
172 Debugging with GDB
help user-defined
List all user-defined commands, with the first line of the documentation (if any)for each.
show usershow user commandname
Display the GDB commands used to define commandname (but not its docu-mentation). If no commandname is given, display the definitions for all user-defined commands.
When user-defined commands are executed, the commands of the definition are notprinted. An error in any command stops execution of the user-defined command.
If used interactively, commands that would ask for confirmation proceed without askingwhen used inside a user-defined command. Many GDB commands that normally print mes-
sages to say what they are doing omit the messages when used in a user-defined command.
19.2 User-defined command hooks
You may define hooks , which are a special kind of user-defined command. Wheneveryou run the command ‘foo’, if the user-defined command ‘hook-foo’ exists, it is executed(with no arguments) before that command.
A hook may also be defined which is run after the command you executed. Whenever yourun the command ‘foo’, if the user-defined command ‘hookpost-foo’ exists, it is executed
(with no arguments) after that command. Post-execution hooks may exist simultaneouslywith pre-execution hooks, for the same command.
It is valid for a hook to call the command which it hooks. If this occurs, the hook is notre-executed, thereby avoiding infinte recursion.
In addition, a pseudo-command, ‘stop’ exists. Defining (‘hook-stop’) makes the asso-ciated commands execute every time execution stops in your program: before breakpointcommands are run, displays are printed, or the stack frame is printed.
For example, to ignore SIGALRM signals while single-stepping, but treat them normallyduring normal execution, you could define:
define hook-stophandle SIGALRM nopassend
define hook-runhandle SIGALRM passend
define hook-continuehandle SIGLARM pass
endAs a further example, to hook at the begining and end of the echo command, and to
add extra text to the beginning and end of the message, you could define:
define hook-echoecho <<<---

8/14/2019 Debugging With GDB - The GNU Source-Level Debugger
http://slidepdf.com/reader/full/debugging-with-gdb-the-gnu-source-level-debugger 184/328
Chapter 19: Canned Sequences of Commands 173
end
define hookpost-echo
echo --->>>\nend
(gdb) echo Hello World<<<---Hello World--->>>(gdb)
You can define a hook for any single-word command in GDB, but not for commandaliases; you should define a hook for the basic command name, e.g. backtrace rather thanbt. If an error occurs during the execution of your hook, execution of GDB commands
stops and GDB issues a prompt (before the command that you actually typed had a chanceto run).
If you try to define a hook which does not match any known command, you get a warningfrom the define command.
19.3 Command files
A command file for GDB is a file of lines that are GDB commands. Comments (linesstarting with # ) may also be included. An empty line in a command file does nothing; it
does not mean to repeat the last command, as it would from the terminal.When you start GDB, it automatically executes commands from its init files , normally
called ‘.gdbinit’1. During startup, GDB does the following:
1. Reads the init file (if any) in your home directory2.
2. Processes command line options and operands.
3. Reads the init file (if any) in the current working directory.
4. Reads command files specified by the ‘-x’ option.
The init file in your home directory can set options (such as ‘set complaints’) that affect
subsequent processing of command line options and operands. Init files are not executed if you use the ‘-nx’ option (see Section 2.1.2 [Choosing modes], page 13).
On some configurations of GDB, the init file is known by a different name (these are typ-ically environments where a specialized form of GDB may need to coexist with other forms,hence a different name for the specialized version’s init file). These are the environmentswith special init file names:
• VxWorks (Wind River Systems real-time OS): ‘.vxgdbinit’
• OS68K (Enea Data Systems real-time OS): ‘.os68gdbinit’
• ES-1800 (Ericsson Telecom AB M68000 emulator): ‘.esgdbinit’
You can also request the execution of a command file with the source command:
1 The DJGPP port of GDB uses the name ‘gdb.ini’ instead, due to the limitations of file names imposedby DOS filesystems.
2 On DOS/Windows systems, the home directory is the one pointed to by the HOME environment variable.

8/14/2019 Debugging With GDB - The GNU Source-Level Debugger
http://slidepdf.com/reader/full/debugging-with-gdb-the-gnu-source-level-debugger 185/328
174 Debugging with GDB
source filename Execute the command file filename .
The lines in a command file are executed sequentially. They are not printed as they are
executed. An error in any command terminates execution of the command file.
Commands that would ask for confirmation if used interactively proceed without askingwhen used in a command file. Many GDB commands that normally print messages to saywhat they are doing omit the messages when called from command files.
GDB also accepts command input from standard input. In this mode, normal outputgoes to standard output and error output goes to standard error. Errors in a command filesupplied on standard input do not terminate execution of the command file — executioncontinues with the next command.
gdb < cmds > log 2>&1
(The syntax above will vary depending on the shell used.) This example will executecommands from the file ‘cmds’. All output and errors would be directed to ‘log’.
19.4 Commands for controlled output
During the execution of a command file or a user-defined command, normal GDB outputis suppressed; the only output that appears is what is explicitly printed by the commandsin the definition. This section describes three commands useful for generating exactly theoutput you want.
echo text Print text. Nonprinting characters can be included in text using C escape se-quences, such as ‘\n’ to print a newline. No newline is printed unless you specifyone. In addition to the standard C escape sequences, a backslash followed by aspace stands for a space. This is useful for displaying a string with spaces at thebeginning or the end, since leading and trailing spaces are otherwise trimmedfrom all arguments. To print ‘ and foo = ’, use the command ‘echo \ and foo
= \ ’.
A backslash at the end of text can be used, as in C, to continue the commandonto subsequent lines. For example,
echo This is some text\n\which is continued\n\onto several lines.\n
produces the same output as
echo This is some text\necho which is continued\necho onto several lines.\n
output expressionPrint the value of expression and nothing but that value: no newlines, no
‘$nn = ’. The value is not entered in the value history either. See Section 8.1[Expressions], page 63, for more information on expressions.
output/fmt expressionPrint the value of expression in format fmt. You can use the same formats asfor print. See Section 8.4 [Output formats], page 66, for more information.

8/14/2019 Debugging With GDB - The GNU Source-Level Debugger
http://slidepdf.com/reader/full/debugging-with-gdb-the-gnu-source-level-debugger 186/328

8/14/2019 Debugging With GDB - The GNU Source-Level Debugger
http://slidepdf.com/reader/full/debugging-with-gdb-the-gnu-source-level-debugger 187/328
176 Debugging with GDB
8/14/2019 Debugging With GDB - The GNU Source-Level Debugger
http://slidepdf.com/reader/full/debugging-with-gdb-the-gnu-source-level-debugger 188/328
Chapter 20: GDB Text User Interface 177
20 GDB Text User Interface
The GDB Text User Interface, TUI in short, is a terminal interface which uses the
curses library to show the source file, the assembly output, the program registers and GDBcommands in separate text windows. The TUI is available only when GDB is configuredwith the --enable-tui configure option (see Section B.3 [Configure Options], page 277).
20.1 TUI overview
The TUI has two display modes that can be switched while GDB runs:
• A curses (or TUI) mode in which it displays several text windows on the terminal.
•A standard mode which corresponds to the GDB configured without the TUI.
In the TUI mode, GDB can display several text window on the terminal:
command This window is the GDB command window with the GDB prompt and theGDB outputs. The GDB input is still managed using readline but through theTUI. The command window is always visible.
source The source window shows the source file of the program. The current line aswell as active breakpoints are displayed in this window. The current programposition is shown with the ‘>’ marker and active breakpoints are shown with
‘*’ markers.assembly The assembly window shows the disassembly output of the program.
register This window shows the processor registers. It detects when a register is changedand when this is the case, registers that have changed are highlighted.
The source, assembly and register windows are attached to the thread and the frameposition. They are updated when the current thread changes, when the frame changesor when the program counter changes. These three windows are arranged by the TUIaccording to several layouts. The layout defines which of these three windows are visible.
The following layouts are available:• source
• assembly
• source and assembly
• source and registers
• assembly and registers
20.2 TUI Key Bindings
The TUI installs several key bindings in the readline keymaps (see Chapter 25 [CommandLine Editing], page 251). They allow to leave or enter in the TUI mode or they operatedirectly on the TUI layout and windows. The following key bindings are installed for bothTUI mode and the GDB standard mode.

8/14/2019 Debugging With GDB - The GNU Source-Level Debugger
http://slidepdf.com/reader/full/debugging-with-gdb-the-gnu-source-level-debugger 189/328
178 Debugging with GDB
C-x C-a
C-x a
C-x A Enter or leave the TUI mode. When the TUI mode is left, the curses window
management is left and GDB operates using its standard mode writing on theterminal directly. When the TUI mode is entered, the control is given back tothe curses windows. The screen is then refreshed.
C-x 1 Use a TUI layout with only one window. The layout will either be ‘source’ or‘assembly’. When the TUI mode is not active, it will switch to the TUI mode.
Think of this key binding as the Emacs C-x 1 binding.
C-x 2 Use a TUI layout with at least two windows. When the current layout showsalready two windows, a next layout with two windows is used. When a newlayout is chosen, one window will always be common to the previous layout and
the new one.
Think of it as the Emacs C-x 2 binding.
The following key bindings are handled only by the TUI mode:
PgUp Scroll the active window one page up.
PgDn Scroll the active window one page down.
Up Scroll the active window one line up.
Down Scroll the active window one line down.
Left Scroll the active window one column left.
Right Scroll the active window one column right.
C-L Refresh the screen.
In the TUI mode, the arrow keys are used by the active window for scrolling. This meansthey are not available for readline. It is necessary to use other readline key bindings suchas C-p, C-n, C-b and C-f .
20.3 TUI specific commandsThe TUI has specific commands to control the text windows. These commands are
always available, that is they do not depend on the current terminal mode in which GDBruns. When GDB is in the standard mode, using these commands will automatically switchin the TUI mode.
layout next
Display the next layout.
layout prev
Display the previous layout.
layout src
Display the source window only.
layout asm
Display the assembly window only.
8/14/2019 Debugging With GDB - The GNU Source-Level Debugger
http://slidepdf.com/reader/full/debugging-with-gdb-the-gnu-source-level-debugger 190/328
Chapter 20: GDB Text User Interface 179
layout split
Display the source and assembly window.
layout regs
Display the register window together with the source or assembly window.
focus next | prev | src | asm | regs | split
Set the focus to the named window. This command allows to change the activewindow so that scrolling keys can be affected to another window.
refresh Refresh the screen. This is similar to using C-L key.
update Update the source window and the current execution point.
winheight name +countwinheight name -count
Change the height of the window name by count lines. Positive counts increasethe height, while negative counts decrease it.
20.4 TUI configuration variables
The TUI has several configuration variables that control the appearance of windows onthe terminal.
set tui border-kind kind Select the border appearance for the source, assembly and register windows.The possible values are the following:
space Use a space character to draw the border.
ascii Use ascii characters + - and | to draw the border.
acs Use the Alternate Character Set to draw the border. The border isdrawn using character line graphics if the terminal supports them.
set tui active-border-mode mode Select the attributes to display the border of the active window. The possiblevalues are normal, standout, reverse, half, half-standout, bold and bold-
standout.
set tui border-mode mode Select the attributes to display the border of other windows. The mode can beone of the following:
normal Use normal attributes to display the border.
standout Use standout mode.
reverse Use reverse video mode.
half Use half bright mode.
half-standout
Use half bright and standout mode.
bold Use extra bright or bold mode.
bold-standout
Use extra bright or bold and standout mode.

8/14/2019 Debugging With GDB - The GNU Source-Level Debugger
http://slidepdf.com/reader/full/debugging-with-gdb-the-gnu-source-level-debugger 191/328
180 Debugging with GDB
8/14/2019 Debugging With GDB - The GNU Source-Level Debugger
http://slidepdf.com/reader/full/debugging-with-gdb-the-gnu-source-level-debugger 192/328
Chapter 21: Using GDB under gnu Emacs 181
21 Using GDB under gnu Emacs
A special interface allows you to use gnu Emacs to view (and edit) the source files for
the program you are debugging with GDB.To use this interface, use the command M-x gdb in Emacs. Give the executable file you
want to debug as an argument. This command starts GDB as a subprocess of Emacs, withinput and output through a newly created Emacs buffer.
Using GDB under Emacs is just like using GDB normally except for two things:
• All “terminal” input and output goes through the Emacs buffer.
This applies both to GDB commands and their output, and to the input and outputdone by the program you are debugging.
This is useful because it means that you can copy the text of previous commands andinput them again; you can even use parts of the output in this way.
All the facilities of Emacs’ Shell mode are available for interacting with your program.In particular, you can send signals the usual way—for example, C-c C-c for an interrupt,C-c C-z for a stop.
• GDB displays source code through Emacs.
Each time GDB displays a stack frame, Emacs automatically finds the source file forthat frame and puts an arrow (‘=>’) at the left margin of the current line. Emacs uses aseparate buffer for source display, and splits the screen to show both your GDB session andthe source.
Explicit GDB list or search commands still produce output as usual, but you probablyhave no reason to use them from Emacs.
Warning: If the directory where your program resides is not your current di-rectory, it can be easy to confuse Emacs about the location of the source files,in which case the auxiliary display buffer does not appear to show your source.GDB can find programs by searching your environment’s PATH variable, so theGDB input and output session proceeds normally; but Emacs does not getenough information back from GDB to locate the source files in this situation.
To avoid this problem, either start GDB mode from the directory where yourprogram resides, or specify an absolute file name when prompted for the M-x gdb argument.
A similar confusion can result if you use the GDB file command to switch todebugging a program in some other location, from an existing GDB buffer inEmacs.
By default, M-x gdb calls the program called ‘gdb’. If you need to call GDB by a differentname (for example, if you keep several configurations around, with different names) you canset the Emacs variable gdb-command-name; for example,
(setq gdb-command-name "mygdb")(preceded by M-: or ESC :, or typed in the *scratch* buffer, or in your ‘.emacs’ file) makesEmacs call the program named “ mygdb” instead.
In the GDB I/O buffer, you can use these special Emacs commands in addition to thestandard Shell mode commands:

8/14/2019 Debugging With GDB - The GNU Source-Level Debugger
http://slidepdf.com/reader/full/debugging-with-gdb-the-gnu-source-level-debugger 193/328

8/14/2019 Debugging With GDB - The GNU Source-Level Debugger
http://slidepdf.com/reader/full/debugging-with-gdb-the-gnu-source-level-debugger 194/328
Chapter 22: GDB Annotations 183
22 GDB Annotations
This chapter describes annotations in GDB. Annotations are designed to interface GDB
to graphical user interfaces or other similar programs which want to interact with GDB ata relatively high level.
22.1 What is an Annotation?
To produce annotations, start GDB with the --annotate=2 option.
Annotations start with a newline character, two ‘control-z’ characters, and the nameof the annotation. If there is no additional information associated with this annotation,the name of the annotation is followed immediately by a newline. If there is additionalinformation, the name of the annotation is followed by a space, the additional information,and a newline. The additional information cannot contain newline characters.
Any output not beginning with a newline and two ‘control-z’ characters denotes literaloutput from GDB. Currently there is no need for GDB to output a newline followed by two‘control-z’ characters, but if there was such a need, the annotations could be extendedwith an ‘escape’ annotation which means those three characters as output.
A simple example of starting up GDB with annotations is:
$ gdb --annotate=2GNU GDB 5.0Copyright 2000 Free Software Foundation, Inc.
GDB is free software, covered by the GNU General Public License,and you are welcome to change it and/or distribute copies of itunder certain conditions.Type "show copying" to see the conditions.There is absolutely no warranty for GDB. Type "show warranty"for details.This GDB was configured as "sparc-sun-sunos4.1.3"
^Z^Zpre-prompt(gdb)
^Z^Zpromptquit
^Z^Zpost-prompt$
Here ‘quit’ is input to GDB; the rest is output from GDB. The three lines beginning‘^Z^Z’ (where ‘^Z’ denotes a ‘control-z’ character) are annotations; the rest is output fromGDB.
22.2 The Server PrefixTo issue a command to GDB without affecting certain aspects of the state which is
seen by users, prefix it with ‘server ’. This means that this command will not affect thecommand history, nor will it affect GDB’s notion of which command to repeat if RET ispressed on a line by itself.

8/14/2019 Debugging With GDB - The GNU Source-Level Debugger
http://slidepdf.com/reader/full/debugging-with-gdb-the-gnu-source-level-debugger 195/328
184 Debugging with GDB
The server prefix does not affect the recording of values into the value history; to printa value without recording it into the value history, use the output command instead of theprint command.
22.3 Values
When a value is printed in various contexts, GDB uses annotations to delimit the valuefrom the surrounding text.
If a value is printed using print and added to the value history, the annotation lookslike
^Z^Zvalue-history-begin history-number value-flags history-string ^Z^Zvalue-history-valuethe-value ^Z^Zvalue-history-end
where history-number is the number it is getting in the value history, history-string isa string, such as ‘$5 = ’, which introduces the value to the user, the-value is the outputcorresponding to the value itself, and value-flags is ‘*’ for a value which can be dereferencedand ‘-’ for a value which cannot.
If the value is not added to the value history (it is an invalid float or it is printed withthe output command), the annotation is similar:
^Z^Zvalue-begin value-flags the-value ^Z^Zvalue-end
When GDB prints an argument to a function (for example, in the output from thebacktrace command), it annotates it as follows:
^Z^Zarg-beginargument-name ^Z^Zarg-name-endseparator-string ^Z^Zarg-value value-flags the-value ^Z^Zarg-end
where argument-name is the name of the argument, separator-string is text which separatesthe name from the value for the user’s benefit (such as ‘=’), and value-flags and the-value have the same meanings as in a value-history-begin annotation.
When printing a structure, GDB annotates it as follows:
^Z^Zfield-begin value-flags
field-name ^Z^Zfield-name-endseparator-string ^Z^Zfield-valuethe-value ^Z^Zfield-end
8/14/2019 Debugging With GDB - The GNU Source-Level Debugger
http://slidepdf.com/reader/full/debugging-with-gdb-the-gnu-source-level-debugger 196/328
Chapter 22: GDB Annotations 185
where field-name is the name of the field, separator-string is text which separates the namefrom the value for the user’s benefit (such as ‘=’), and value-flags and the-value have thesame meanings as in a value-history-begin annotation.
When printing an array, GDB annotates it as follows:^Z^Zarray-section-begin array-index value-flags
where array-index is the index of the first element being annotated and value-flags has thesame meaning as in a value-history-begin annotation. This is followed by any numberof elements, where is element can be either a single element:
‘,’ whitespace ; omitted for the first elementthe-value ^Z^Zelt
or a repeated element
‘,’ whitespace ; omitted for the first elementthe-value ^Z^Zelt-rep number-of-repititions repetition-string ^Z^Zelt-rep-end
In both cases, the-value is the output for the value of the element and whitespace cancontain spaces, tabs, and newlines. In the repeated case, number-of-repititons is the numberof consecutive array elements which contain that value, and repetition-string is a stringwhich is designed to convey to the user that repitition is being depicted.
Once all the array elements have been output, the array annotation is ended with^Z^Zarray-section-end
22.4 Frames
Whenever GDB prints a frame, it annotates it. For example, this applies to framesprinted when GDB stops, output from commands such as backtrace or up, etc.
The frame annotation begins with
^Z^Zframe-begin level address
level-string where level is the number of the frame (0 is the innermost frame, and other frames havepositive numbers), address is the address of the code executing in that frame, and level-string is a string designed to convey the level to the user. address is in the form ‘0x’ followedby one or more lowercase hex digits (note that this does not depend on the language). Theframe ends with
^Z^Zframe-end
Between these annotations is the main body of the frame, which can consist of
•
^Z^Zfunction-callfunction-call-string
where function-call-string is text designed to convey to the user that this frame isassociated with a function call made by GDB to a function in the program beingdebugged.
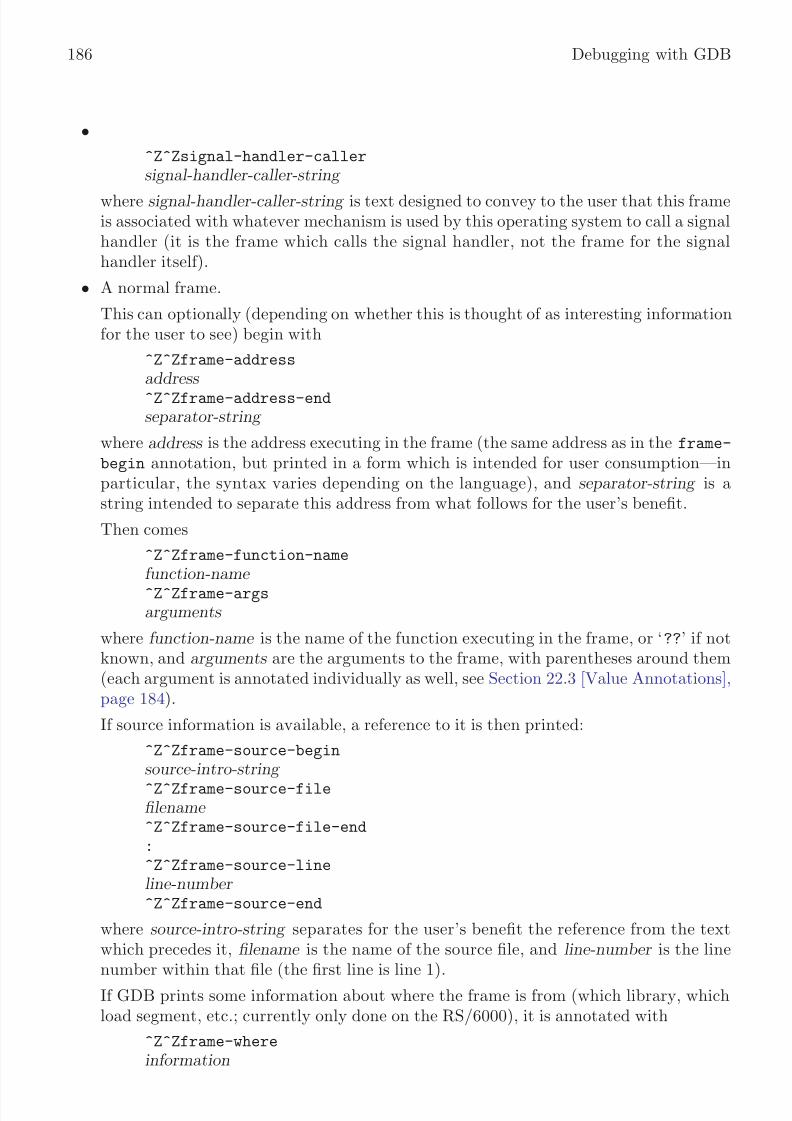
8/14/2019 Debugging With GDB - The GNU Source-Level Debugger
http://slidepdf.com/reader/full/debugging-with-gdb-the-gnu-source-level-debugger 197/328
186 Debugging with GDB
•
^Z^Zsignal-handler-callersignal-handler-caller-string
where signal-handler-caller-string is text designed to convey to the user that this frameis associated with whatever mechanism is used by this operating system to call a signalhandler (it is the frame which calls the signal handler, not the frame for the signalhandler itself).
• A normal frame.
This can optionally (depending on whether this is thought of as interesting informationfor the user to see) begin with
^Z^Zframe-addressaddress ^Z^Zframe-address-endseparator-string
where address is the address executing in the frame (the same address as in the frame-
begin annotation, but printed in a form which is intended for user consumption—inparticular, the syntax varies depending on the language), and separator-string is astring intended to separate this address from what follows for the user’s benefit.
Then comes
^Z^Zframe-function-namefunction-name ^Z^Zframe-argsarguments
where function-name is the name of the function executing in the frame, or ‘??’ if notknown, and arguments are the arguments to the frame, with parentheses around them(each argument is annotated individually as well, see Section 22.3 [Value Annotations],page 184).
If source information is available, a reference to it is then printed:
^Z^Zframe-source-begin
source-intro-string ^Z^Zframe-source-filefilename ^Z^Zframe-source-file-end:^Z^Zframe-source-lineline-number ^Z^Zframe-source-end
where source-intro-string separates for the user’s benefit the reference from the textwhich precedes it, filename is the name of the source file, and line-number is the line
number within that file (the first line is line 1).If GDB prints some information about where the frame is from (which library, whichload segment, etc.; currently only done on the RS/6000), it is annotated with
^Z^Zframe-whereinformation

8/14/2019 Debugging With GDB - The GNU Source-Level Debugger
http://slidepdf.com/reader/full/debugging-with-gdb-the-gnu-source-level-debugger 198/328
Chapter 22: GDB Annotations 187
Then, if source is to actually be displayed for this frame (for example, this is not truefor output from the backtrace command), then a source annotation (see Section 22.11[Source Annotations], page 190) is displayed. Unlike most annotations, this is output
instead of the normal text which would be output, not in addition.
22.5 Displays
When GDB is told to display something using the display command, the results of thedisplay are annotated:
^Z^Zdisplay-beginnumber ^Z^Zdisplay-number-end
number-separator ^Z^Zdisplay-formatformat^Z^Zdisplay-expressionexpression^Z^Zdisplay-expression-endexpression-separator ^Z^Zdisplay-valuevalue ^Z^Zdisplay-end
where number is the number of the display, number-separator is intended to separate thenumber from what follows for the user, format includes information such as the size, format,or other information about how the value is being displayed, expression is the expressionbeing displayed, expression-separator is intended to separate the expression from the textthat follows for the user, and value is the actual value being displayed.
22.6 Annotation for GDB Input
When GDB prompts for input, it annotates this fact so it is possible to know when to
send output, when the output from a given command is over, etc.Different kinds of input each have a different input type . Each input type has three
annotations: a pre- annotation, which denotes the beginning of any prompt which is beingoutput, a plain annotation, which denotes the end of the prompt, and then a post- anno-tation which denotes the end of any echo which may (or may not) be associated with theinput. For example, the prompt input type features the following annotations:
^Z^Zpre-prompt^Z^Zprompt^Z^Zpost-prompt
The input types are
prompt When GDB is prompting for a command (the main GDB prompt).
commands When GDB prompts for a set of commands, like in the commands command.The annotations are repeated for each command which is input.
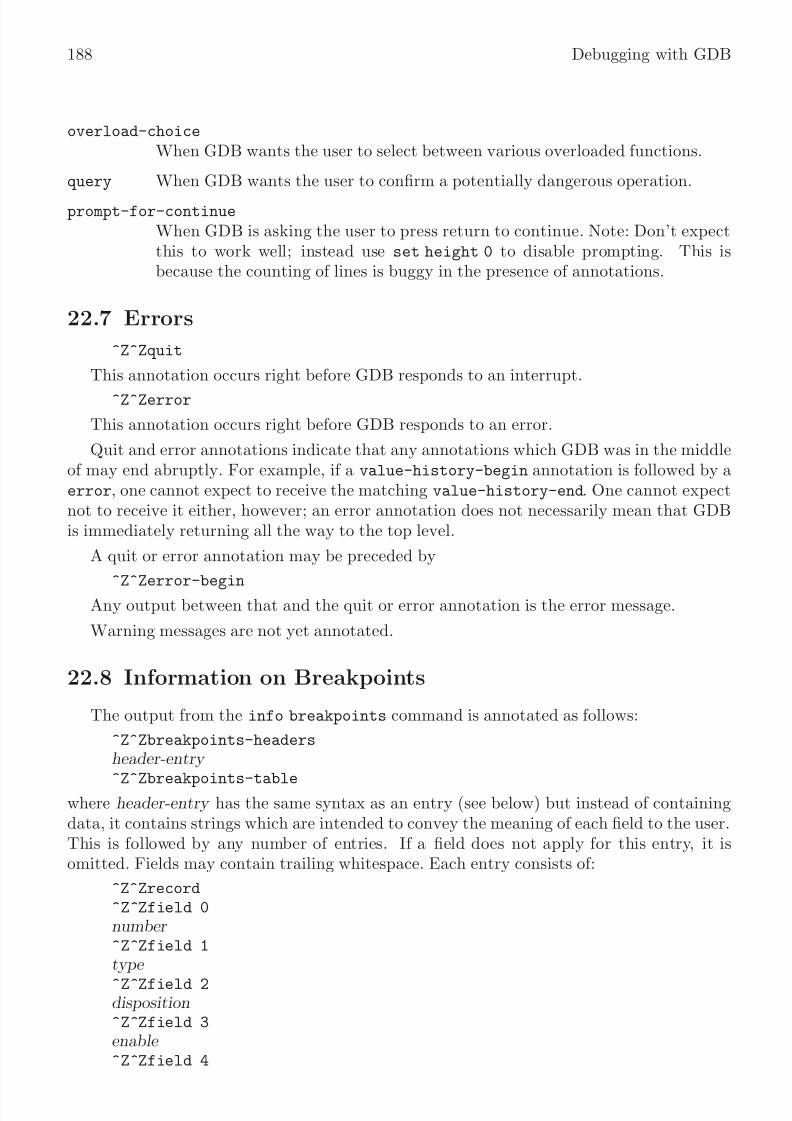
8/14/2019 Debugging With GDB - The GNU Source-Level Debugger
http://slidepdf.com/reader/full/debugging-with-gdb-the-gnu-source-level-debugger 199/328
188 Debugging with GDB
overload-choice
When GDB wants the user to select between various overloaded functions.
query When GDB wants the user to confirm a potentially dangerous operation.
prompt-for-continue
When GDB is asking the user to press return to continue. Note: Don’t expectthis to work well; instead use set height 0 to disable prompting. This isbecause the counting of lines is buggy in the presence of annotations.
22.7 Errors
^Z^Zquit
This annotation occurs right before GDB responds to an interrupt.
^Z^Zerror
This annotation occurs right before GDB responds to an error.
Quit and error annotations indicate that any annotations which GDB was in the middleof may end abruptly. For example, if a value-history-begin annotation is followed by aerror, one cannot expect to receive the matching value-history-end. One cannot expectnot to receive it either, however; an error annotation does not necessarily mean that GDBis immediately returning all the way to the top level.
A quit or error annotation may be preceded by
^Z^Zerror-beginAny output between that and the quit or error annotation is the error message.
Warning messages are not yet annotated.
22.8 Information on Breakpoints
The output from the info breakpoints command is annotated as follows:
^Z^Zbreakpoints-headersheader-entry
^Z^Zbreakpoints-tablewhere header-entry has the same syntax as an entry (see below) but instead of containingdata, it contains strings which are intended to convey the meaning of each field to the user.This is followed by any number of entries. If a field does not apply for this entry, it isomitted. Fields may contain trailing whitespace. Each entry consists of:
^Z^Zrecord^Z^Zfield 0number ^Z^Zfield 1
type ^Z^Zfield 2disposition^Z^Zfield 3enable ^Z^Zfield 4

8/14/2019 Debugging With GDB - The GNU Source-Level Debugger
http://slidepdf.com/reader/full/debugging-with-gdb-the-gnu-source-level-debugger 200/328
Chapter 22: GDB Annotations 189
address ^Z^Zfield 5what
^Z^Zfield 6frame ^Z^Zfield 7condition^Z^Zfield 8ignore-count^Z^Zfield 9commands
Note that address is intended for user consumption—the syntax varies depending on thelanguage.
The output ends with^Z^Zbreakpoints-table-end
22.9 Invalidation Notices
The following annotations say that certain pieces of state may have changed.
^Z^Zframes-invalid
The frames (for example, output from the backtrace command) may have
changed.^Z^Zbreakpoints-invalid
The breakpoints may have changed. For example, the user just added or deleteda breakpoint.
22.10 Running the Program
When the program starts executing due to a GDB command such as step or continue,
^Z^Zstarting
is output. When the program stops,^Z^Zstopped
is output. Before the stopped annotation, a variety of annotations describe how theprogram stopped.
^Z^Zexited exit-status The program exited, and exit-status is the exit status (zero for successful exit,otherwise nonzero).
^Z^Zsignalled
The program exited with a signal. After the ^Z^Zsignalled, the annotationcontinues:
intro-text^Z^Zsignal-namename
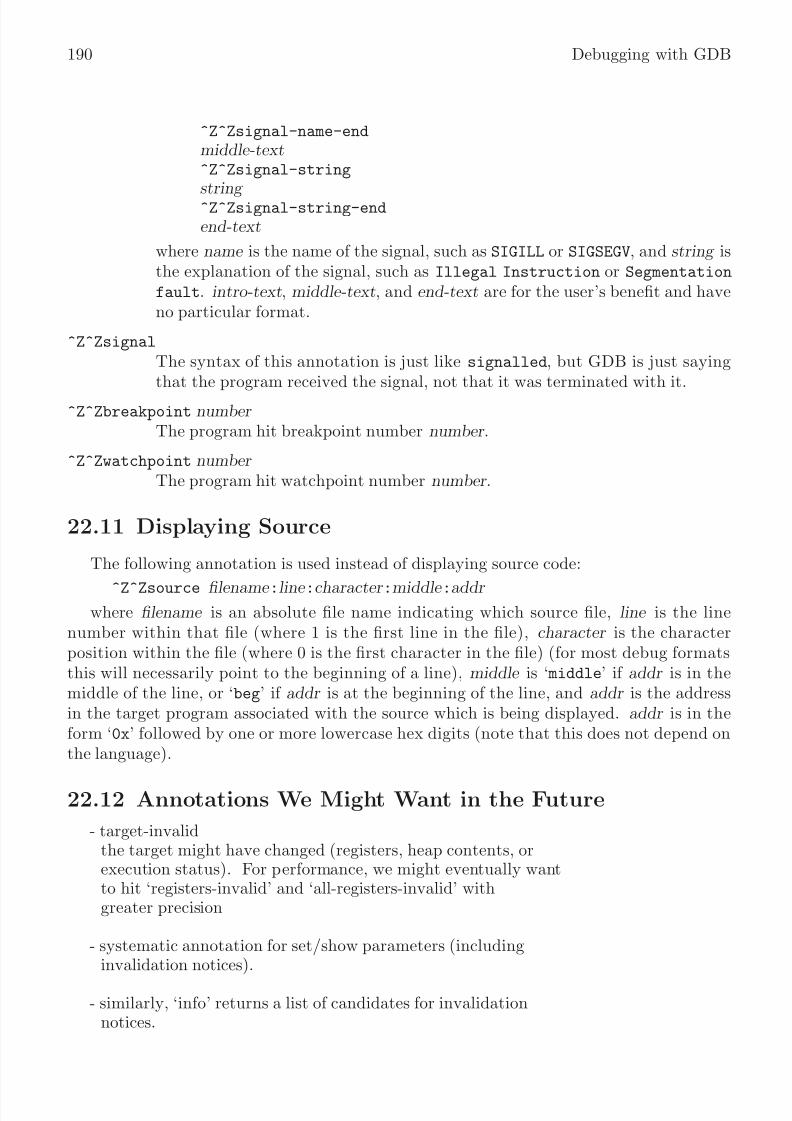
8/14/2019 Debugging With GDB - The GNU Source-Level Debugger
http://slidepdf.com/reader/full/debugging-with-gdb-the-gnu-source-level-debugger 201/328
190 Debugging with GDB
^Z^Zsignal-name-endmiddle-text^Z^Zsignal-string
string ^Z^Zsignal-string-endend-text
where name is the name of the signal, such as SIGILL or SIGSEGV, and string isthe explanation of the signal, such as Illegal Instruction or Segmentation
fault. intro-text, middle-text, and end-text are for the user’s benefit and haveno particular format.
^Z^Zsignal
The syntax of this annotation is just like signalled, but GDB is just saying
that the program received the signal, not that it was terminated with it.^Z^Zbreakpoint number
The program hit breakpoint number number .
^Z^Zwatchpoint number The program hit watchpoint number number .
22.11 Displaying Source
The following annotation is used instead of displaying source code:
^Z^Zsource filename :line :character :middle :addr
where filename is an absolute file name indicating which source file, line is the linenumber within that file (where 1 is the first line in the file), character is the characterposition within the file (where 0 is the first character in the file) (for most debug formatsthis will necessarily point to the beginning of a line), middle is ‘ middle’ if addr is in themiddle of the line, or ‘beg’ if addr is at the beginning of the line, and addr is the addressin the target program associated with the source which is being displayed. addr is in theform ‘0x’ followed by one or more lowercase hex digits (note that this does not depend onthe language).
22.12 Annotations We Might Want in the Future
- target-invalidthe target might have changed (registers, heap contents, orexecution status). For performance, we might eventually wantto hit ‘registers-invalid’ and ‘all-registers-invalid’ withgreater precision
- systematic annotation for set/show parameters (including
invalidation notices).
- similarly, ‘info’ returns a list of candidates for invalidationnotices.
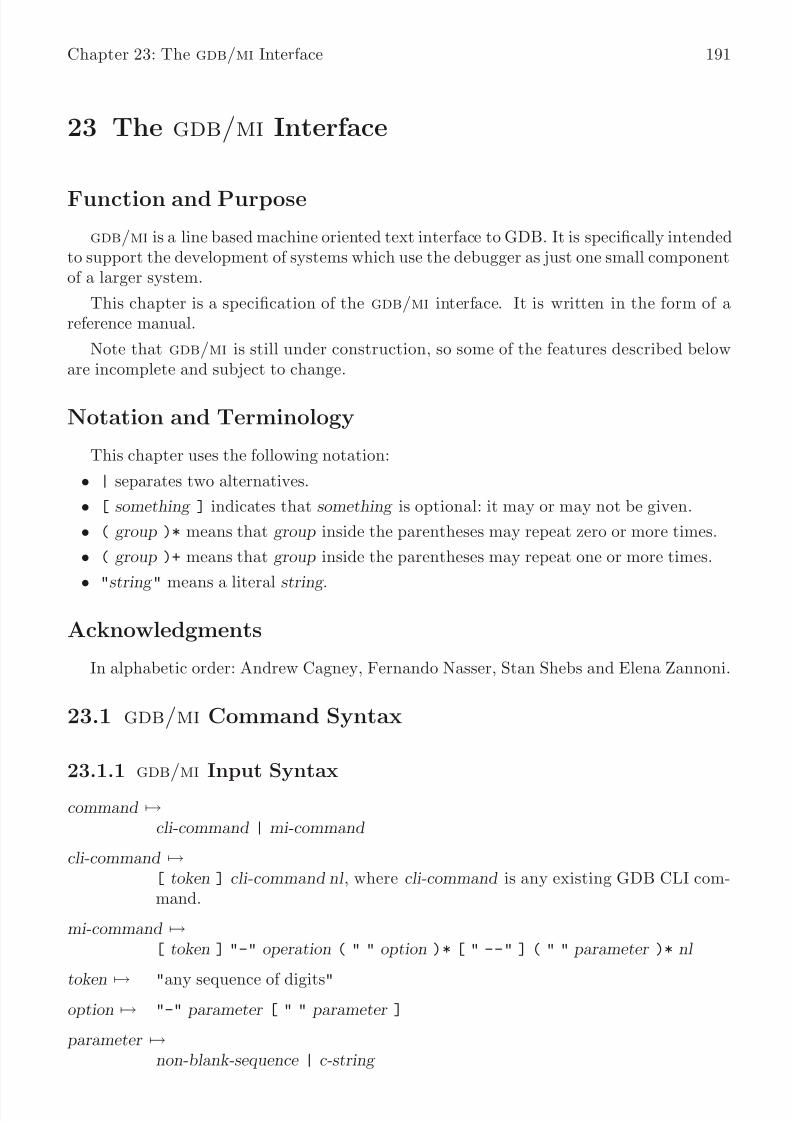
8/14/2019 Debugging With GDB - The GNU Source-Level Debugger
http://slidepdf.com/reader/full/debugging-with-gdb-the-gnu-source-level-debugger 202/328
Chapter 23: The gdb/mi Interface 191
23 The gdb/mi Interface
Function and Purpose
gdb/mi is a line based machine oriented text interface to GDB. It is specifically intendedto support the development of systems which use the debugger as just one small componentof a larger system.
This chapter is a specification of the gdb/mi interface. It is written in the form of areference manual.
Note that gdb/mi is still under construction, so some of the features described beloware incomplete and subject to change.
Notation and Terminology
This chapter uses the following notation:
• | separates two alternatives.
• [ something ] indicates that something is optional: it may or may not be given.
• ( group )* means that group inside the parentheses may repeat zero or more times.
• ( group )+ means that group inside the parentheses may repeat one or more times.
• "string " means a literal string .
Acknowledgments
In alphabetic order: Andrew Cagney, Fernando Nasser, Stan Shebs and Elena Zannoni.
23.1 gdb/mi Command Syntax
23.1.1 gdb/mi Input Syntaxcommand →
cli-command | mi-command
cli-command →
[ token ] cli-command nl , where cli-command is any existing GDB CLI com-mand.
mi-command →
[ token ] "-" operation ( " " option )* [ " --" ] ( " " parameter )* nl
token → "any sequence of digits"
option → "-" parameter [ " " parameter ]
parameter →non-blank-sequence | c-string
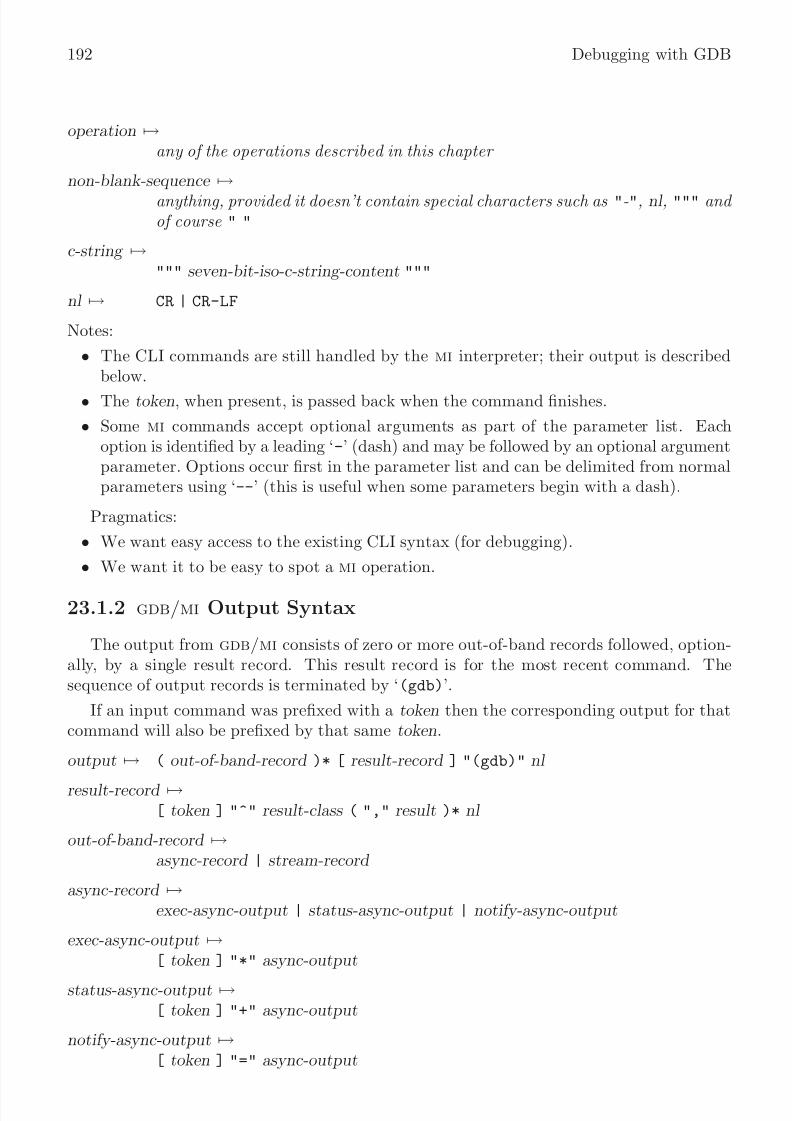
8/14/2019 Debugging With GDB - The GNU Source-Level Debugger
http://slidepdf.com/reader/full/debugging-with-gdb-the-gnu-source-level-debugger 203/328
192 Debugging with GDB
operation →any of the operations described in this chapter
non-blank-sequence →
anything, provided it doesn’t contain special characters such as "-", nl , """ and of course " "
c-string →
""" seven-bit-iso-c-string-content """
nl → CR | CR-LF
Notes:
• The CLI commands are still handled by the mi interpreter; their output is describedbelow.
• The token, when present, is passed back when the command finishes.
• Some mi commands accept optional arguments as part of the parameter list. Eachoption is identified by a leading ‘-’ (dash) and may be followed by an optional argumentparameter. Options occur first in the parameter list and can be delimited from normalparameters using ‘--’ (this is useful when some parameters begin with a dash).
Pragmatics:
• We want easy access to the existing CLI syntax (for debugging).
• We want it to be easy to spot a mi operation.
23.1.2 gdb/mi Output Syntax
The output from gdb/mi consists of zero or more out-of-band records followed, option-ally, by a single result record. This result record is for the most recent command. Thesequence of output records is terminated by ‘(gdb)’.
If an input command was prefixed with a token then the corresponding output for thatcommand will also be prefixed by that same token.
output → ( out-of-band-record )* [ result-record ] "(gdb)" nl
result-record →
[ token ] "^" result-class ( "," result )* nl
out-of-band-record →async-record | stream-record
async-record →exec-async-output | status-async-output | notify-async-output
exec-async-output →
[ token ] "*" async-output
status-async-output →
[ token ] "+" async-output
notify-async-output →
[ token ] "=" async-output
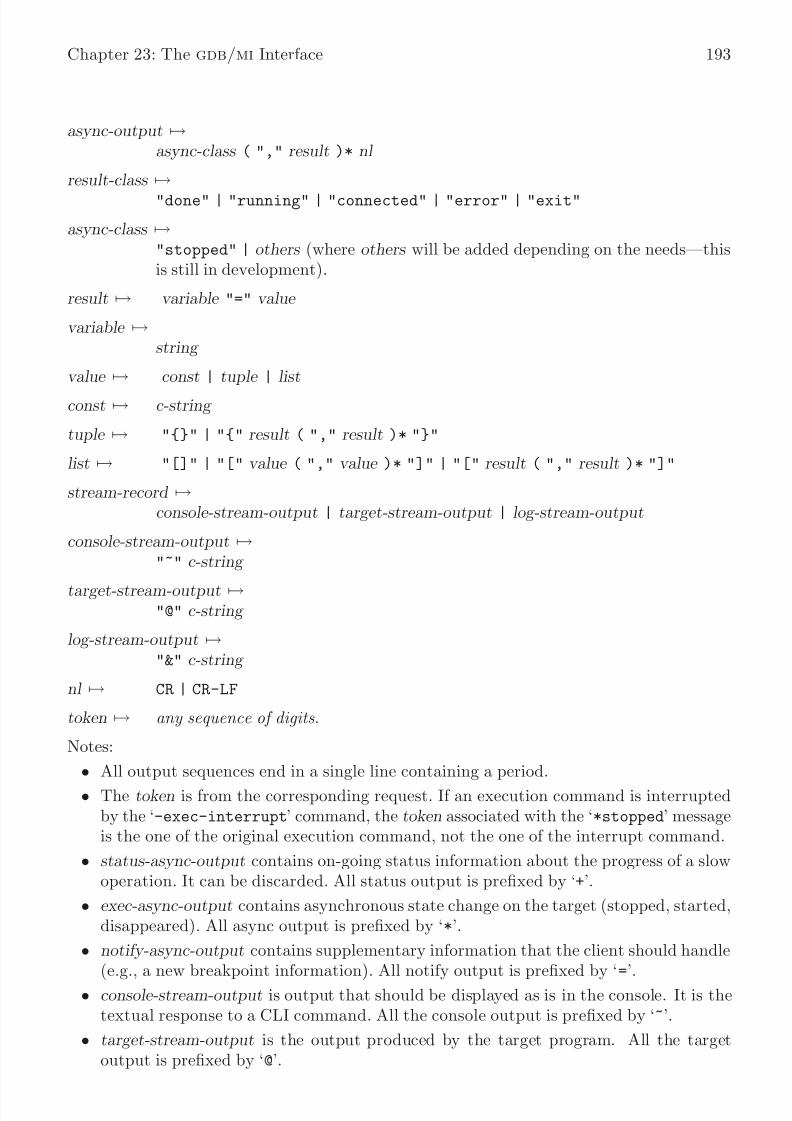
8/14/2019 Debugging With GDB - The GNU Source-Level Debugger
http://slidepdf.com/reader/full/debugging-with-gdb-the-gnu-source-level-debugger 204/328
Chapter 23: The gdb/mi Interface 193
async-output →async-class ( "," result )* nl
result-class →
"done" | "running" | "connected" | "error" | "exit"
async-class →
"stopped" | others (where others will be added depending on the needs—thisis still in development).
result → variable "=" value
variable →string
value → const | tuple | list
const → c-string
tuple → "{}" | "{" result ( "," result )* "}"
list → "[]" | "[" value ( "," value )* "]" | "[" result ( "," result )* "]"
stream-record →console-stream-output | target-stream-output | log-stream-output
console-stream-output →
"~" c-string
target-stream-output →"@" c-string
log-stream-output →"&" c-string
nl → CR | CR-LF
token → any sequence of digits .
Notes:
• All output sequences end in a single line containing a period.• The token is from the corresponding request. If an execution command is interrupted
by the ‘-exec-interrupt’ command, the token associated with the ‘*stopped’ messageis the one of the original execution command, not the one of the interrupt command.
• status-async-output contains on-going status information about the progress of a slowoperation. It can be discarded. All status output is prefixed by ‘+’.
• exec-async-output contains asynchronous state change on the target (stopped, started,disappeared). All async output is prefixed by ‘*’.
• notify-async-output contains supplementary information that the client should handle
(e.g., a new breakpoint information). All notify output is prefixed by ‘=’.• console-stream-output is output that should be displayed as is in the console. It is the
textual response to a CLI command. All the console output is prefixed by ‘~’.
• target-stream-output is the output produced by the target program. All the targetoutput is prefixed by ‘@’.

8/14/2019 Debugging With GDB - The GNU Source-Level Debugger
http://slidepdf.com/reader/full/debugging-with-gdb-the-gnu-source-level-debugger 205/328
194 Debugging with GDB
• log-stream-output is output text coming from GDB’s internals, for instance messagesthat should be displayed as part of an error log. All the log output is prefixed by ‘&’.
• New gdb/mi commands should only output lists containing values .
See Section 23.3.2 [gdb/mi Stream Records], page 195, for more details about the variousoutput records.
23.1.3 Simple Examples of gdb/mi Interaction
This subsection presents several simple examples of interaction using the gdb/mi inter-face. In these examples, ‘->’ means that the following line is passed to gdb/mi as input,while ‘<-’ means the output received from gdb/mi.
Target Stop
Here’s an example of stopping the inferior process:
-> -stop<- (gdb)
and later:
<- *stop,reason="stop",address="0x123",source="a.c:123"<- (gdb)
Simple CLI Command
Here’s an example of a simple CLI command being passed through gdb/mi and on tothe CLI.
-> print 1+2<- ~3\n
<- (gdb)
Command With Side Effects
-> -symbol-file xyz.exe<- *breakpoint,nr="3",address="0x123",source="a.c:123"<- (gdb)
A Bad Command
Here’s what happens if you pass a non-existent command:
-> -rubbish<- error,"Rubbish not found"<- (gdb)
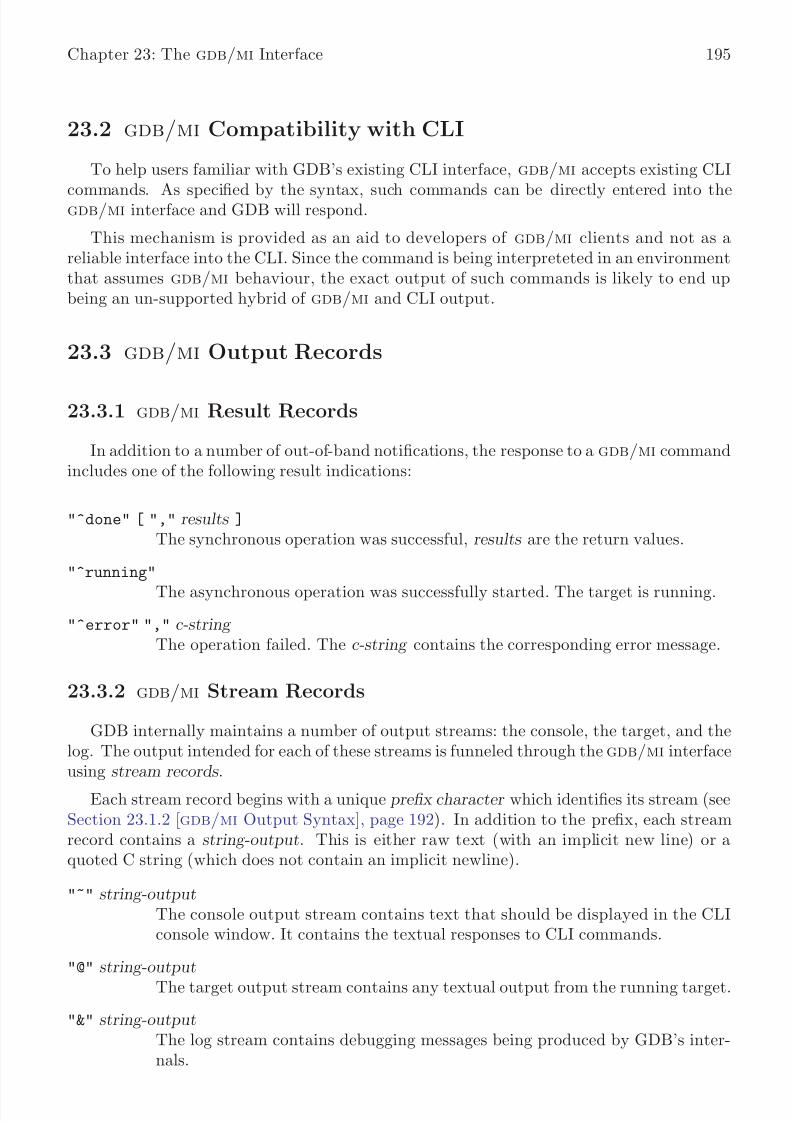
8/14/2019 Debugging With GDB - The GNU Source-Level Debugger
http://slidepdf.com/reader/full/debugging-with-gdb-the-gnu-source-level-debugger 206/328
Chapter 23: The gdb/mi Interface 195
23.2 gdb/mi Compatibility with CLI
To help users familiar with GDB’s existing CLI interface, gdb/mi accepts existing CLI
commands. As specified by the syntax, such commands can be directly entered into thegdb/mi interface and GDB will respond.
This mechanism is provided as an aid to developers of gdb/mi clients and not as areliable interface into the CLI. Since the command is being interpreteted in an environmentthat assumes gdb/mi behaviour, the exact output of such commands is likely to end upbeing an un-supported hybrid of gdb/mi and CLI output.
23.3 gdb/mi Output Records
23.3.1 gdb/mi Result Records
In addition to a number of out-of-band notifications, the response to a gdb/mi commandincludes one of the following result indications:
"^done" [ "," results ]
The synchronous operation was successful, results are the return values.
"^running"
The asynchronous operation was successfully started. The target is running.
"^error" "," c-string The operation failed. The c-string contains the corresponding error message.
23.3.2 gdb/mi Stream Records
GDB internally maintains a number of output streams: the console, the target, and thelog. The output intended for each of these streams is funneled through the gdb/mi interface
using stream records .Each stream record begins with a unique prefix character which identifies its stream (see
Section 23.1.2 [gdb/mi Output Syntax], page 192). In addition to the prefix, each streamrecord contains a string-output. This is either raw text (with an implicit new line) or aquoted C string (which does not contain an implicit newline).
"~" string-outputThe console output stream contains text that should be displayed in the CLIconsole window. It contains the textual responses to CLI commands.
"@" string-outputThe target output stream contains any textual output from the running target.
"&" string-outputThe log stream contains debugging messages being produced by GDB’s inter-nals.
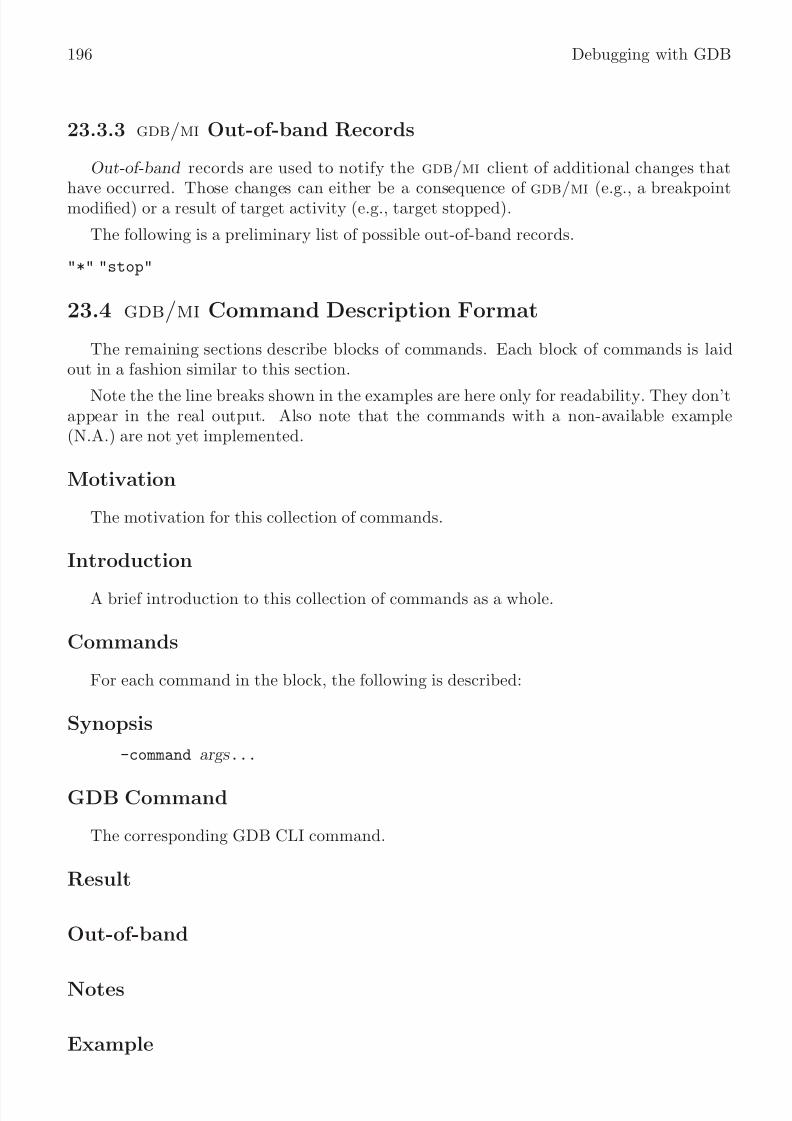
8/14/2019 Debugging With GDB - The GNU Source-Level Debugger
http://slidepdf.com/reader/full/debugging-with-gdb-the-gnu-source-level-debugger 207/328
196 Debugging with GDB
23.3.3 gdb/mi Out-of-band Records
Out-of-band records are used to notify the gdb/mi client of additional changes that
have occurred. Those changes can either be a consequence of gdb/mi (e.g., a breakpointmodified) or a result of target activity (e.g., target stopped).
The following is a preliminary list of possible out-of-band records.
"*" "stop"
23.4 gdb/mi Command Description Format
The remaining sections describe blocks of commands. Each block of commands is laidout in a fashion similar to this section.
Note the the line breaks shown in the examples are here only for readability. They don’tappear in the real output. Also note that the commands with a non-available example(N.A.) are not yet implemented.
Motivation
The motivation for this collection of commands.
Introduction
A brief introduction to this collection of commands as a whole.
Commands
For each command in the block, the following is described:
Synopsis
-command args ...
GDB Command
The corresponding GDB CLI command.
Result
Out-of-band
Notes
Example

8/14/2019 Debugging With GDB - The GNU Source-Level Debugger
http://slidepdf.com/reader/full/debugging-with-gdb-the-gnu-source-level-debugger 208/328
Chapter 23: The gdb/mi Interface 197
23.5 gdb/mi Breakpoint table commands
This section documents gdb/mi commands for manipulating breakpoints.
The -break-after Command
Synopsis
-break-after number count
The breakpoint number number is not in effect until it has been hit count times. To seehow this is reflected in the output of the ‘-break-list’ command, see the description of the ‘-break-list’ command below.
GDB Command
The corresponding GDB command is ‘ignore’.
Example
(gdb)-break-insert main^done,bkpt={number="1",addr="0x000100d0",file="hello.c",line="5"}(gdb)
-break-after 1 3~^done(gdb)-break-list^done,BreakpointTable={nr_rows="1",nr_cols="6",hdr=[{width="3",alignment="-1",col_name="number",colhdr="Num"},{width="14",alignment="-1",col_name="type",colhdr="Type"},{width="4",alignment="-1",col_name="disp",colhdr="Disp"},{width="3",alignment="-1",col_name="enabled",colhdr="Enb"},
{width="10",alignment="-1",col_name="addr",colhdr="Address"},{width="40",alignment="2",col_name="what",colhdr="What"}],body=[bkpt={number="1",type="breakpoint",disp="keep",enabled="y",addr="0x000100d0",func="main",file="hello.c",line="5",times="0",ignore="3"}]}(gdb)
The -break-condition Command
Synopsis-break-condition number expr
Breakpoint number will stop the program only if the condition in expr is true. The con-dition becomes part of the ‘-break-list’ output (see the description of the ‘-break-list’command below).

8/14/2019 Debugging With GDB - The GNU Source-Level Debugger
http://slidepdf.com/reader/full/debugging-with-gdb-the-gnu-source-level-debugger 209/328
198 Debugging with GDB
GDB Command
The corresponding GDB command is ‘condition’.
Example
(gdb)-break-condition 1 1^done(gdb)-break-list^done,BreakpointTable={nr_rows="1",nr_cols="6",hdr=[{width="3",alignment="-1",col_name="number",colhdr="Num"},{width="14",alignment="-1",col_name="type",colhdr="Type"},
{width="4",alignment="-1",col_name="disp",colhdr="Disp"},{width="3",alignment="-1",col_name="enabled",colhdr="Enb"},{width="10",alignment="-1",col_name="addr",colhdr="Address"},{width="40",alignment="2",col_name="what",colhdr="What"}],body=[bkpt={number="1",type="breakpoint",disp="keep",enabled="y",addr="0x000100d0",func="main",file="hello.c",line="5",cond="1",times="0",ignore="3"}]}(gdb)
The -break-delete Command
Synopsis
-break-delete ( breakpoint )+
Delete the breakpoint(s) whose number(s) are specified in the argument list. This isobviously reflected in the breakpoint list.
GDB command
The corresponding GDB command is ‘delete’.
Example
(gdb)-break-delete 1^done(gdb)-break-list^done,BreakpointTable={nr_rows="0",nr_cols="6",
hdr=[{width="3",alignment="-1",col_name="number",colhdr="Num"},{width="14",alignment="-1",col_name="type",colhdr="Type"},{width="4",alignment="-1",col_name="disp",colhdr="Disp"},{width="3",alignment="-1",col_name="enabled",colhdr="Enb"},{width="10",alignment="-1",col_name="addr",colhdr="Address"},{width="40",alignment="2",col_name="what",colhdr="What"}],

8/14/2019 Debugging With GDB - The GNU Source-Level Debugger
http://slidepdf.com/reader/full/debugging-with-gdb-the-gnu-source-level-debugger 210/328
Chapter 23: The gdb/mi Interface 199
body=[]}(gdb)
The -break-disable Command
Synopsis
-break-disable ( breakpoint )+
Disable the named breakpoint(s). The field ‘enabled’ in the break list is now set to ‘n’for the named breakpoint(s).
GDB Command
The corresponding GDB command is ‘disable’.
Example
(gdb)-break-disable 2^done(gdb)-break-list^done,BreakpointTable={nr_rows="1",nr_cols="6",
hdr=[{width="3",alignment="-1",col_name="number",colhdr="Num"},{width="14",alignment="-1",col_name="type",colhdr="Type"},{width="4",alignment="-1",col_name="disp",colhdr="Disp"},{width="3",alignment="-1",col_name="enabled",colhdr="Enb"},{width="10",alignment="-1",col_name="addr",colhdr="Address"},{width="40",alignment="2",col_name="what",colhdr="What"}],body=[bkpt={number="2",type="breakpoint",disp="keep",enabled="n",addr="0x000100d0",func="main",file="hello.c",line="5",times="0"}]}(gdb)
The -break-enable Command
Synopsis
-break-enable ( breakpoint )+
Enable (previously disabled) breakpoint(s).
GDB Command
The corresponding GDB command is ‘enable’.
Example
(gdb)-break-enable 2^done

8/14/2019 Debugging With GDB - The GNU Source-Level Debugger
http://slidepdf.com/reader/full/debugging-with-gdb-the-gnu-source-level-debugger 211/328
200 Debugging with GDB
(gdb)-break-list^done,BreakpointTable={nr_rows="1",nr_cols="6",
hdr=[{width="3",alignment="-1",col_name="number",colhdr="Num"},{width="14",alignment="-1",col_name="type",colhdr="Type"},{width="4",alignment="-1",col_name="disp",colhdr="Disp"},{width="3",alignment="-1",col_name="enabled",colhdr="Enb"},{width="10",alignment="-1",col_name="addr",colhdr="Address"},{width="40",alignment="2",col_name="what",colhdr="What"}],body=[bkpt={number="2",type="breakpoint",disp="keep",enabled="y",addr="0x000100d0",func="main",file="hello.c",line="5",times="0"}]}(gdb)
The -break-info Command
Synopsis
-break-info breakpoint
Get information about a single breakpoint.
GDB command
The corresponding GDB command is ‘info break breakpoint’.
Example
N.A.
The -break-insert Command
Synopsis
-break-insert [ -t ] [ -h ] [ -r ]
[ -c condition ] [ - i ignore-count ][ -p thread ] [ line | addr ]
If specified, line , can be one of:
• function
• filename:linenum
• filename:function
• *address
The possible optional parameters of this command are:
‘-t’ Insert a tempoary breakpoint.
‘-h’ Insert a hardware breakpoint.
‘-c condition’Make the breakpoint conditional on condition.

8/14/2019 Debugging With GDB - The GNU Source-Level Debugger
http://slidepdf.com/reader/full/debugging-with-gdb-the-gnu-source-level-debugger 212/328

8/14/2019 Debugging With GDB - The GNU Source-Level Debugger
http://slidepdf.com/reader/full/debugging-with-gdb-the-gnu-source-level-debugger 213/328
202 Debugging with GDB
Synopsis
-break-list
Displays the list of inserted breakpoints, showing the following fields:‘Number’ number of the breakpoint
‘Type’ type of the breakpoint: ‘breakpoint’ or ‘watchpoint’
‘Disposition’should the breakpoint be deleted or disabled when it is hit: ‘keep’ or ‘nokeep’
‘Enabled’ is the breakpoint enabled or no: ‘y’ or ‘n’
‘Address’ memory location at which the breakpoint is set
‘What’ logical location of the breakpoint, expressed by function name, file name, linenumber
‘Times’ number of times the breakpoint has been hit
If there are no breakpoints or watchpoints, the BreakpointTable body field is an emptylist.
GDB Command
The corresponding GDB command is ‘info break’.
Example
(gdb)-break-list^done,BreakpointTable={nr_rows="2",nr_cols="6",hdr=[{width="3",alignment="-1",col_name="number",colhdr="Num"},{width="14",alignment="-1",col_name="type",colhdr="Type"},{width="4",alignment="-1",col_name="disp",colhdr="Disp"},{width="3",alignment="-1",col_name="enabled",colhdr="Enb"},{width="10",alignment="-1",col_name="addr",colhdr="Address"},
{width="40",alignment="2",col_name="what",colhdr="What"}],body=[bkpt={number="1",type="breakpoint",disp="keep",enabled="y",addr="0x000100d0",func="main",file="hello.c",line="5",times="0"},bkpt={number="2",type="breakpoint",disp="keep",enabled="y",addr="0x00010114",func="foo",file="hello.c",line="13",times="0"}]}(gdb)
Here’s an example of the result when there are no breakpoints:
(gdb)-break-list
^done,BreakpointTable={nr_rows="0",nr_cols="6",hdr=[{width="3",alignment="-1",col_name="number",colhdr="Num"},{width="14",alignment="-1",col_name="type",colhdr="Type"},{width="4",alignment="-1",col_name="disp",colhdr="Disp"},{width="3",alignment="-1",col_name="enabled",colhdr="Enb"},{width="10",alignment="-1",col_name="addr",colhdr="Address"},

8/14/2019 Debugging With GDB - The GNU Source-Level Debugger
http://slidepdf.com/reader/full/debugging-with-gdb-the-gnu-source-level-debugger 214/328
Chapter 23: The gdb/mi Interface 203
{width="40",alignment="2",col_name="what",colhdr="What"}],body=[]}(gdb)
The -break-watch Command
Synopsis
-break-watch [ -a | -r ]
Create a watchpoint. With the ‘-a’ option it will create an access watchpoint, i.e. awatchpoint that triggers either on a read from or on a write to the memory location. Withthe ‘-r’ option, the watchpoint created is a read watchpoint, i.e. it will trigger only when
the memory location is accessed for reading. Without either of the options, the watchpointcreated is a regular watchpoint, i.e. it will trigger when the memory location is accessedfor writing. See Section 5.1.2 [Setting watchpoints], page 37.
Note that ‘-break-list’ will report a single list of watchpoints and breakpoints inserted.
GDB Command
The corresponding GDB commands are ‘watch’, ‘awatch’, and ‘rwatch’.
Example
Setting a watchpoint on a variable in the main function:
(gdb)-break-watch x^done,wpt={number="2",exp="x"}(gdb)-exec-continue^running^done,reason="watchpoint-trigger",wpt={number="2",exp="x"},value={old="-268439212",new="55"},
frame={func="main",args=[],file="recursive2.c",line="5"}(gdb)
Setting a watchpoint on a variable local to a function. GDB will stop the programexecution twice: first for the variable changing value, then for the watchpoint going out of scope.
(gdb)-break-watch C^done,wpt={number="5",exp="C"}(gdb)
-exec-continue^running^done,reason="watchpoint-trigger",wpt={number="5",exp="C"},value={old="-276895068",new="3"},frame={func="callee4",args=[],file="../../../devo/gdb/testsuite/gdb.mi/basics.c",line="13"}

8/14/2019 Debugging With GDB - The GNU Source-Level Debugger
http://slidepdf.com/reader/full/debugging-with-gdb-the-gnu-source-level-debugger 215/328
204 Debugging with GDB
(gdb)-exec-continue^running
^done,reason="watchpoint-scope",wpnum="5",frame={func="callee3",args=[{name="strarg",value="0x11940 \"A string argument.\""}],file="../../../devo/gdb/testsuite/gdb.mi/basics.c",line="18"}(gdb)
Listing breakpoints and watchpoints, at different points in the program execution. Notethat once the watchpoint goes out of scope, it is deleted.
(gdb)-break-watch C^done,wpt={number="2",exp="C"}
(gdb)-break-list^done,BreakpointTable={nr_rows="2",nr_cols="6",hdr=[{width="3",alignment="-1",col_name="number",colhdr="Num"},{width="14",alignment="-1",col_name="type",colhdr="Type"},{width="4",alignment="-1",col_name="disp",colhdr="Disp"},{width="3",alignment="-1",col_name="enabled",colhdr="Enb"},{width="10",alignment="-1",col_name="addr",colhdr="Address"},{width="40",alignment="2",col_name="what",colhdr="What"}],body=[bkpt={number="1",type="breakpoint",disp="keep",enabled="y",
addr="0x00010734",func="callee4",file="../../../devo/gdb/testsuite/gdb.mi/basics.c",line="8",times="1"},bkpt={number="2",type="watchpoint",disp="keep",enabled="y",addr="",what="C",times="0"}]}(gdb)-exec-continue^running^done,reason="watchpoint-trigger",wpt={number="2",exp="C"},value={old="-276895068",new="3"},frame={func="callee4",args=[],
file="../../../devo/gdb/testsuite/gdb.mi/basics.c",line="13"}(gdb)-break-list^done,BreakpointTable={nr_rows="2",nr_cols="6",hdr=[{width="3",alignment="-1",col_name="number",colhdr="Num"},{width="14",alignment="-1",col_name="type",colhdr="Type"},{width="4",alignment="-1",col_name="disp",colhdr="Disp"},{width="3",alignment="-1",col_name="enabled",colhdr="Enb"},{width="10",alignment="-1",col_name="addr",colhdr="Address"},{width="40",alignment="2",col_name="what",colhdr="What"}],
body=[bkpt={number="1",type="breakpoint",disp="keep",enabled="y",addr="0x00010734",func="callee4",file="../../../devo/gdb/testsuite/gdb.mi/basics.c",line="8",times="1"},bkpt={number="2",type="watchpoint",disp="keep",enabled="y",addr="",what="C",times="-5"}]}(gdb)
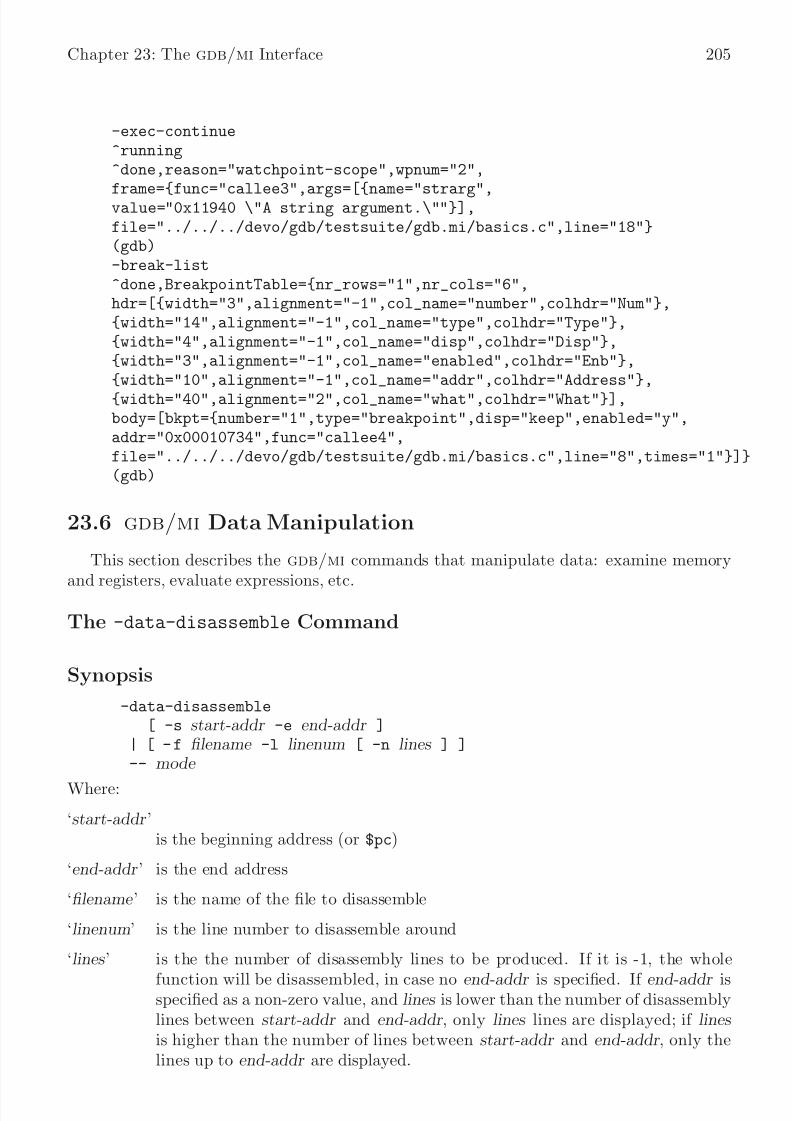
8/14/2019 Debugging With GDB - The GNU Source-Level Debugger
http://slidepdf.com/reader/full/debugging-with-gdb-the-gnu-source-level-debugger 216/328
Chapter 23: The gdb/mi Interface 205
-exec-continue^running^done,reason="watchpoint-scope",wpnum="2",
frame={func="callee3",args=[{name="strarg",value="0x11940 \"A string argument.\""}],file="../../../devo/gdb/testsuite/gdb.mi/basics.c",line="18"}(gdb)-break-list^done,BreakpointTable={nr_rows="1",nr_cols="6",hdr=[{width="3",alignment="-1",col_name="number",colhdr="Num"},{width="14",alignment="-1",col_name="type",colhdr="Type"},{width="4",alignment="-1",col_name="disp",colhdr="Disp"},{width="3",alignment="-1",col_name="enabled",colhdr="Enb"},{width="10",alignment="-1",col_name="addr",colhdr="Address"},{width="40",alignment="2",col_name="what",colhdr="What"}],body=[bkpt={number="1",type="breakpoint",disp="keep",enabled="y",addr="0x00010734",func="callee4",file="../../../devo/gdb/testsuite/gdb.mi/basics.c",line="8",times="1"}]}(gdb)
23.6 gdb/mi Data Manipulation
This section describes the gdb/mi commands that manipulate data: examine memory
and registers, evaluate expressions, etc.
The -data-disassemble Command
Synopsis
-data-disassemble[ -s start-addr -e end-addr ]
| [ - f filename -l linenum [ -n lines ] ]-- mode
Where:
‘start-addr ’is the beginning address (or $pc)
‘end-addr ’ is the end address
‘filename ’ is the name of the file to disassemble
‘linenum’ is the line number to disassemble around
‘lines ’ is the the number of disassembly lines to be produced. If it is -1, the whole
function will be disassembled, in case no end-addr is specified. If end-addr isspecified as a non-zero value, and lines is lower than the number of disassemblylines between start-addr and end-addr , only lines lines are displayed; if lines is higher than the number of lines between start-addr and end-addr , only thelines up to end-addr are displayed.
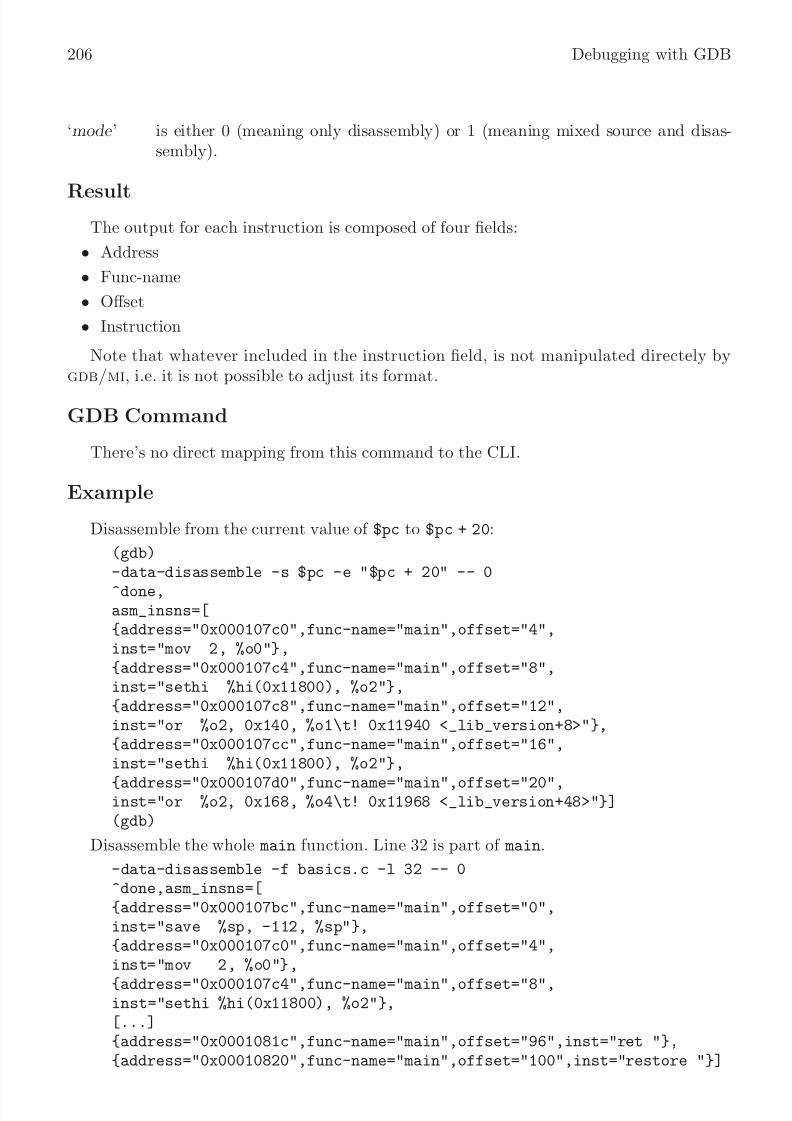
8/14/2019 Debugging With GDB - The GNU Source-Level Debugger
http://slidepdf.com/reader/full/debugging-with-gdb-the-gnu-source-level-debugger 217/328
206 Debugging with GDB
‘mode ’ is either 0 (meaning only disassembly) or 1 (meaning mixed source and disas-sembly).
ResultThe output for each instruction is composed of four fields:
• Address
• Func-name
• Offset
• Instruction
Note that whatever included in the instruction field, is not manipulated directely bygdb/mi, i.e. it is not possible to adjust its format.
GDB Command
There’s no direct mapping from this command to the CLI.
Example
Disassemble from the current value of $pc to $pc + 20:
(gdb)-data-disassemble -s $pc -e "$pc + 20" -- 0^done,asm_insns=[{address="0x000107c0",func-name="main",offset="4",inst="mov 2, %o0"},{address="0x000107c4",func-name="main",offset="8",inst="sethi %hi(0x11800), %o2"},{address="0x000107c8",func-name="main",offset="12",inst="or %o2, 0x140, %o1\t! 0x11940 <_lib_version+8>"},{address="0x000107cc",func-name="main",offset="16",inst="sethi %hi(0x11800), %o2"},
{address="0x000107d0",func-name="main",offset="20",inst="or %o2, 0x168, %o4\t! 0x11968 <_lib_version+48>"}](gdb)
Disassemble the whole main function. Line 32 is part of main.
-data-disassemble -f basics.c -l 32 -- 0^done,asm_insns=[{address="0x000107bc",func-name="main",offset="0",inst="save %sp, -112, %sp"},{address="0x000107c0",func-name="main",offset="4",
inst="mov 2, %o0"},{address="0x000107c4",func-name="main",offset="8",inst="sethi %hi(0x11800), %o2"},[...]{address="0x0001081c",func-name="main",offset="96",inst="ret "},{address="0x00010820",func-name="main",offset="100",inst="restore "}]

8/14/2019 Debugging With GDB - The GNU Source-Level Debugger
http://slidepdf.com/reader/full/debugging-with-gdb-the-gnu-source-level-debugger 218/328
Chapter 23: The gdb/mi Interface 207
(gdb)
Disassemble 3 instructions from the start of main:
(gdb)-data-disassemble -f basics.c -l 32 -n 3 -- 0^done,asm_insns=[{address="0x000107bc",func-name="main",offset="0",inst="save %sp, -112, %sp"},{address="0x000107c0",func-name="main",offset="4",inst="mov 2, %o0"},{address="0x000107c4",func-name="main",offset="8",inst="sethi %hi(0x11800), %o2"}](gdb)
Disassemble 3 instructions from the start of main in mixed mode:
(gdb)-data-disassemble -f basics.c -l 32 -n 3 -- 1^done,asm_insns=[src_and_asm_line={line="31",file="/kwikemart/marge/ezannoni/flathead-dev/devo/gdb/ \
testsuite/gdb.mi/basics.c",line_asm_insn=[{address="0x000107bc",func-name="main",offset="0",inst="save %sp, -112, %sp"}]},
src_and_asm_line={line="32",file="/kwikemart/marge/ezannoni/flathead-dev/devo/gdb/ \
testsuite/gdb.mi/basics.c",line_asm_insn=[{address="0x000107c0",func-name="main",offset="4",inst="mov 2, %o0"},{address="0x000107c4",func-name="main",offset="8",inst="sethi %hi(0x11800), %o2"}]}](gdb)
The -data-evaluate-expression Command
Synopsis
-data-evaluate-expression expr
Evaluate expr as an expression. The expression could contain an inferior function call.The function call will execute synchronously. If the expression contains spaces, it must beenclosed in double quotes.
GDB Command
The corresponding GDB commands are ‘print’, ‘output’, and ‘call’. In gdbtk only,there’s a corresponding ‘gdb_eval’ command.

8/14/2019 Debugging With GDB - The GNU Source-Level Debugger
http://slidepdf.com/reader/full/debugging-with-gdb-the-gnu-source-level-debugger 219/328
208 Debugging with GDB
Example
In the following example, the numbers that precede the commands are the tokens de-
scribed in Section 23.1 [gdb/mi Command Syntax], page 191. Notice how gdb/mi returnsthe same tokens in its output.
211-data-evaluate-expression A211^done,value="1"(gdb)311-data-evaluate-expression &A311^done,value="0xefffeb7c"(gdb)411-data-evaluate-expression A+3411^done,value="4"
(gdb)511-data-evaluate-expression "A + 3"511^done,value="4"(gdb)
The -data-list-changed-registers Command
Synopsis
-data-list-changed-registers
Display a list of the registers that have changed.
GDB Command
GDB doesn’t have a direct analog for this command; gdbtk has the corresponding com-mand ‘gdb_changed_register_list’.
Example
On a PPC MBX board:
(gdb)-exec-continue^running
(gdb)*stopped,reason="breakpoint-hit",bkptno="1",frame={func="main",args=[],file="try.c",line="5"}(gdb)-data-list-changed-registers^done,changed-registers=["0","1","2","4","5","6","7","8","9",
"10","11","13","14","15","16","17","18","19","20","21","22","23","24","25","26","27","28","30","31","64","65","66","67","69"](gdb)
The -data-list-register-names Command
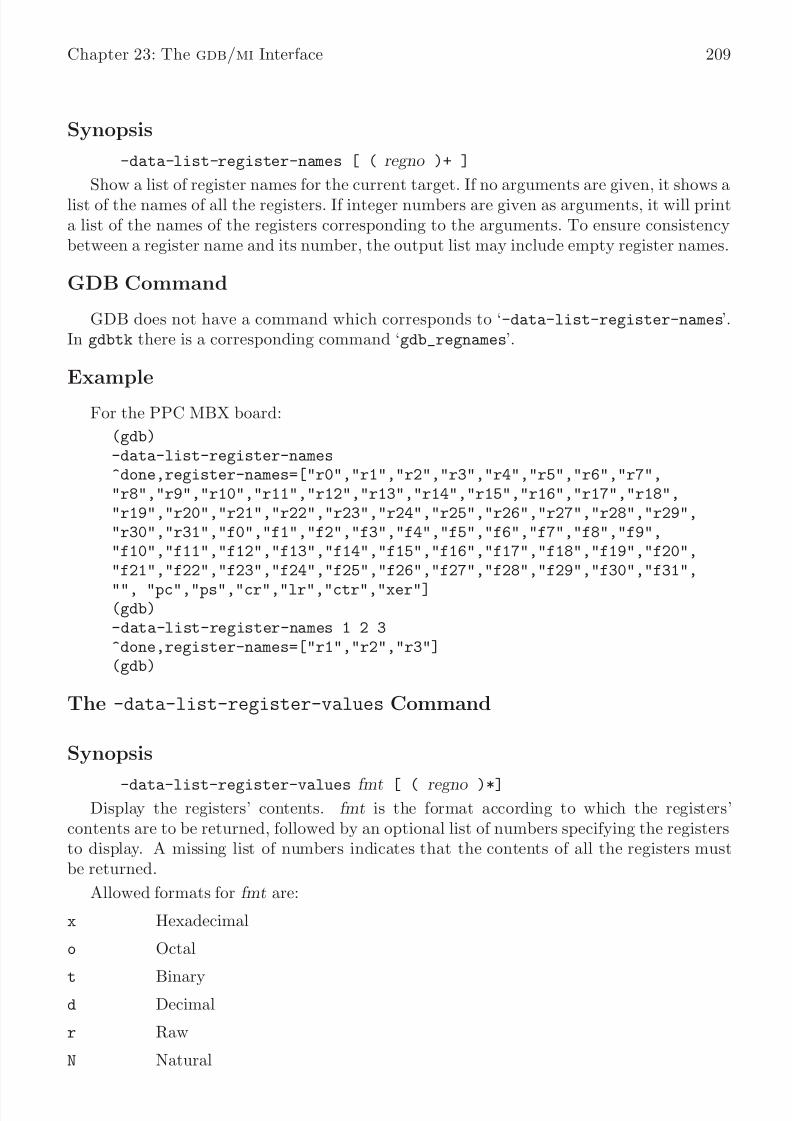
8/14/2019 Debugging With GDB - The GNU Source-Level Debugger
http://slidepdf.com/reader/full/debugging-with-gdb-the-gnu-source-level-debugger 220/328
Chapter 23: The gdb/mi Interface 209
Synopsis
-data-list-register-names [ ( regno )+ ]
Show a list of register names for the current target. If no arguments are given, it shows alist of the names of all the registers. If integer numbers are given as arguments, it will printa list of the names of the registers corresponding to the arguments. To ensure consistencybetween a register name and its number, the output list may include empty register names.
GDB Command
GDB does not have a command which corresponds to ‘-data-list-register-names’.In gdbtk there is a corresponding command ‘gdb_regnames’.
Example
For the PPC MBX board:
(gdb)-data-list-register-names^done,register-names=["r0","r1","r2","r3","r4","r5","r6","r7","r8","r9","r10","r11","r12","r13","r14","r15","r16","r17","r18","r19","r20","r21","r22","r23","r24","r25","r26","r27","r28","r29","r30","r31","f0","f1","f2","f3","f4","f5","f6","f7","f8","f9","f10","f11","f12","f13","f14","f15","f16","f17","f18","f19","f20","f21","f22","f23","f24","f25","f26","f27","f28","f29","f30","f31",
"", "pc","ps","cr","lr","ctr","xer"](gdb)-data-list-register-names 1 2 3^done,register-names=["r1","r2","r3"](gdb)
The -data-list-register-values Command
Synopsis
-data-list-register-values fmt [ ( regno )*]
Display the registers’ contents. fmt is the format according to which the registers’contents are to be returned, followed by an optional list of numbers specifying the registersto display. A missing list of numbers indicates that the contents of all the registers mustbe returned.
Allowed formats for fmt are:
x Hexadecimal
o Octal
t Binary
d Decimal
r Raw
N Natural
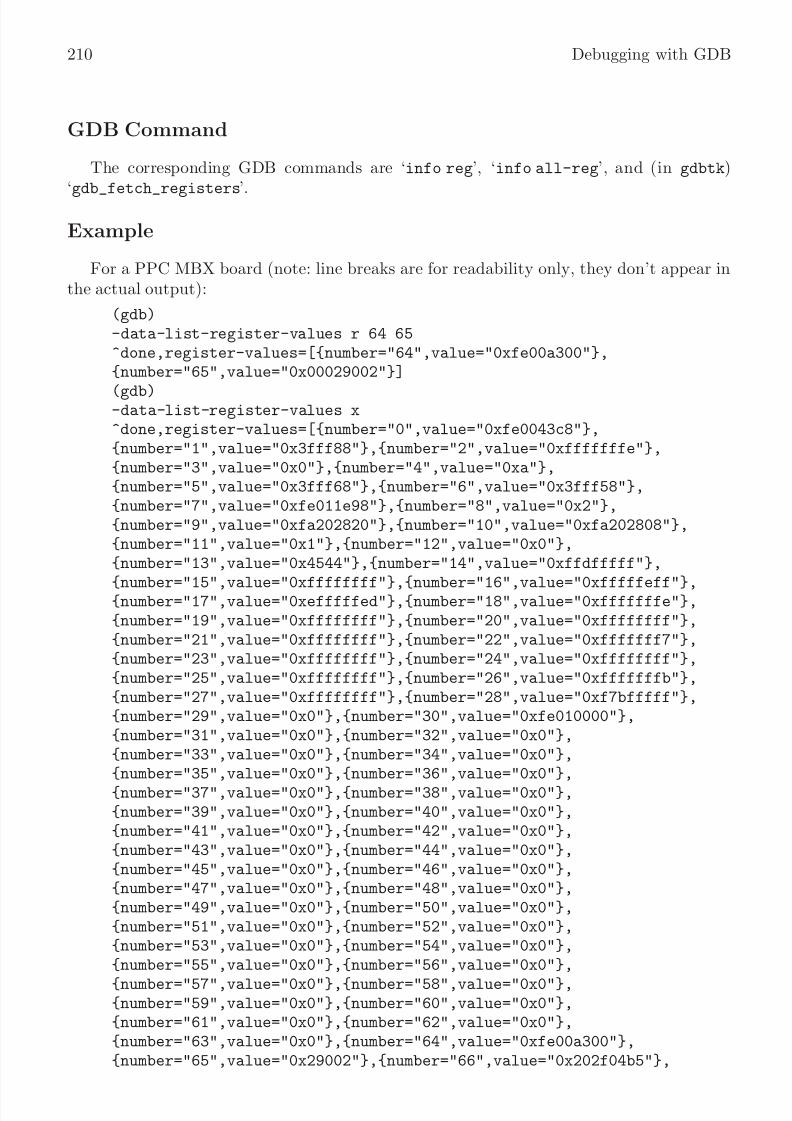
8/14/2019 Debugging With GDB - The GNU Source-Level Debugger
http://slidepdf.com/reader/full/debugging-with-gdb-the-gnu-source-level-debugger 221/328
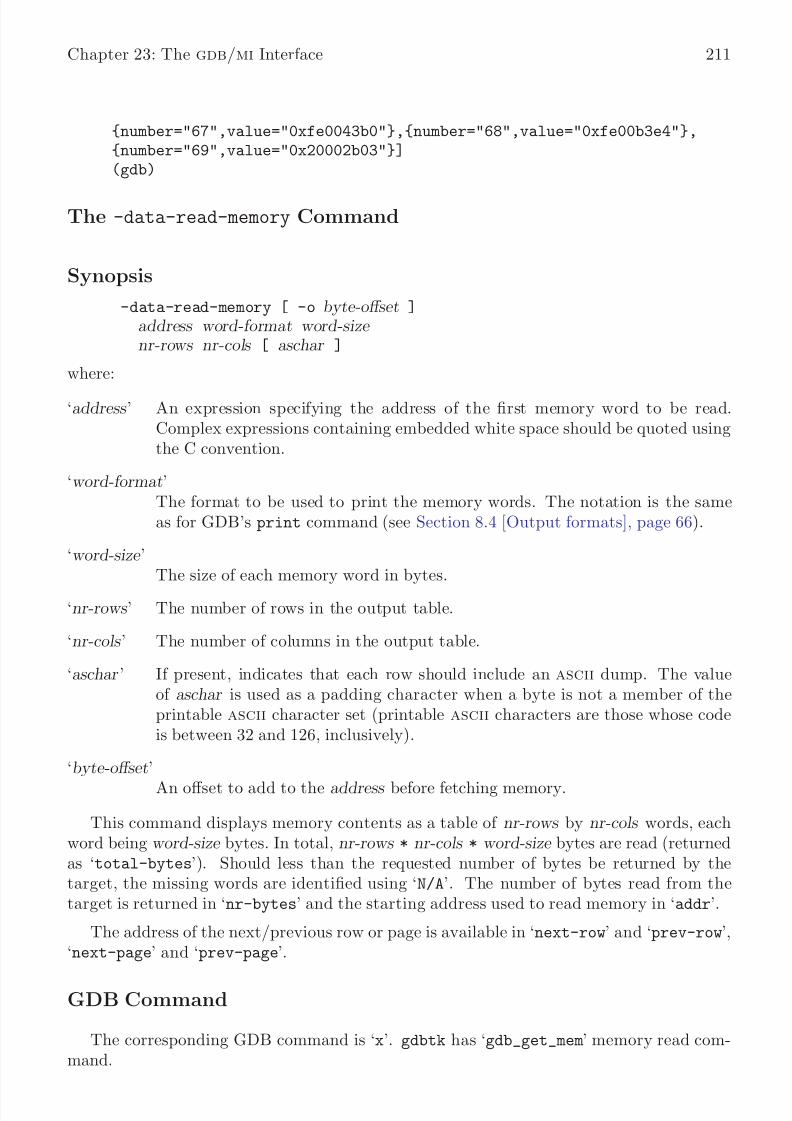
8/14/2019 Debugging With GDB - The GNU Source-Level Debugger
http://slidepdf.com/reader/full/debugging-with-gdb-the-gnu-source-level-debugger 222/328
Chapter 23: The gdb/mi Interface 211
{number="67",value="0xfe0043b0"},{number="68",value="0xfe00b3e4"},{number="69",value="0x20002b03"}](gdb)
The -data-read-memory Command
Synopsis
-data-read-memory [ -o byte-offset ]address word-format word-size nr-rows nr-cols [ aschar ]
where:
‘address ’ An expression specifying the address of the first memory word to be read.Complex expressions containing embedded white space should be quoted usingthe C convention.
‘word-format’The format to be used to print the memory words. The notation is the sameas for GDB’s print command (see Section 8.4 [Output formats], page 66).
‘word-size ’
The size of each memory word in bytes.‘nr-rows ’ The number of rows in the output table.
‘nr-cols ’ The number of columns in the output table.
‘aschar ’ If present, indicates that each row should include an ascii dump. The valueof aschar is used as a padding character when a byte is not a member of theprintable ascii character set (printable ascii characters are those whose codeis between 32 and 126, inclusively).
‘byte-offset’An offset to add to the address before fetching memory.
This command displays memory contents as a table of nr-rows by nr-cols words, eachword being word-size bytes. In total, nr-rows * nr-cols * word-size bytes are read (returnedas ‘total-bytes’). Should less than the requested number of bytes be returned by thetarget, the missing words are identified using ‘N/A’. The number of bytes read from thetarget is returned in ‘nr-bytes’ and the starting address used to read memory in ‘addr’.
The address of the next/previous row or page is available in ‘next-row’ and ‘prev-row’,‘next-page’ and ‘prev-page’.
GDB Command
The corresponding GDB command is ‘x’. gdbtk has ‘gdb_get_mem’ memory read com-mand.
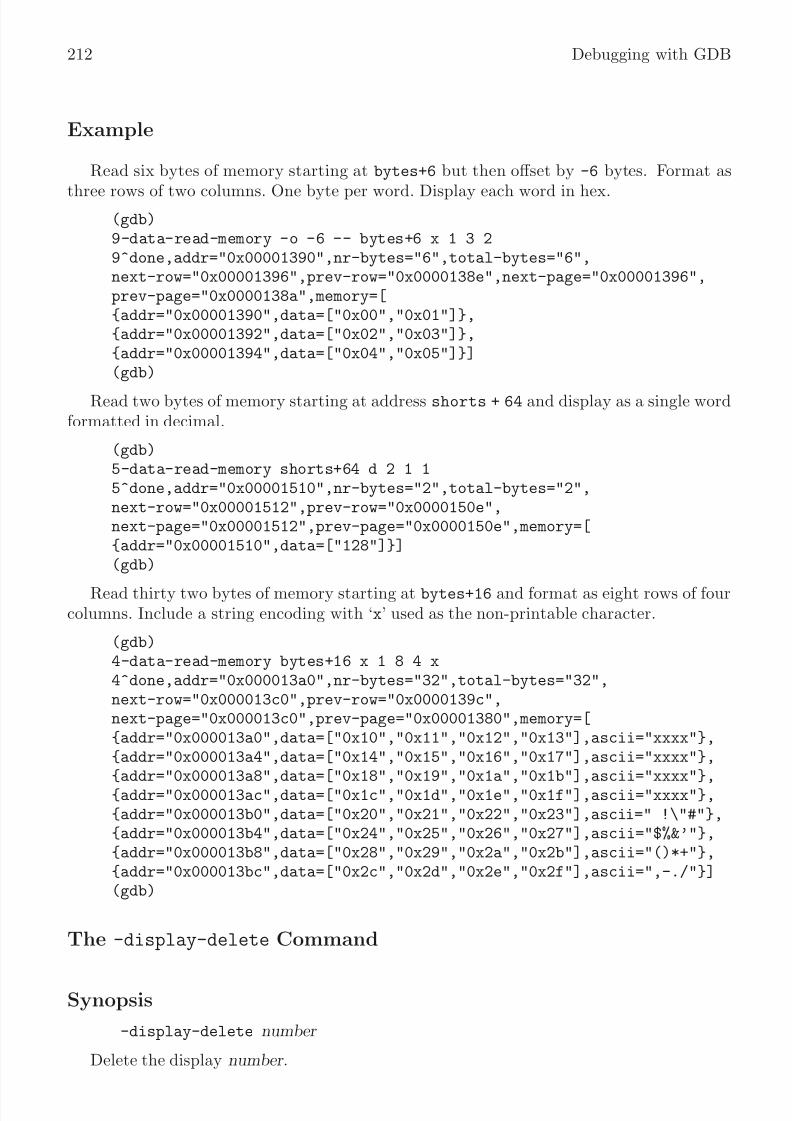
8/14/2019 Debugging With GDB - The GNU Source-Level Debugger
http://slidepdf.com/reader/full/debugging-with-gdb-the-gnu-source-level-debugger 223/328
212 Debugging with GDB
Example
Read six bytes of memory starting at bytes+6 but then offset by -6 bytes. Format as
three rows of two columns. One byte per word. Display each word in hex.(gdb)9-data-read-memory -o -6 -- bytes+6 x 1 3 29^done,addr="0x00001390",nr-bytes="6",total-bytes="6",next-row="0x00001396",prev-row="0x0000138e",next-page="0x00001396",prev-page="0x0000138a",memory=[{addr="0x00001390",data=["0x00","0x01"]},{addr="0x00001392",data=["0x02","0x03"]},{addr="0x00001394",data=["0x04","0x05"]}](gdb)
Read two bytes of memory starting at address shorts + 64 and display as a single wordformatted in decimal.
(gdb)5-data-read-memory shorts+64 d 2 1 15^done,addr="0x00001510",nr-bytes="2",total-bytes="2",next-row="0x00001512",prev-row="0x0000150e",next-page="0x00001512",prev-page="0x0000150e",memory=[{addr="0x00001510",data=["128"]}](gdb)
Read thirty two bytes of memory starting at bytes+16 and format as eight rows of fourcolumns. Include a string encoding with ‘x’ used as the non-printable character.
(gdb)4-data-read-memory bytes+16 x 1 8 4 x4^done,addr="0x000013a0",nr-bytes="32",total-bytes="32",next-row="0x000013c0",prev-row="0x0000139c",next-page="0x000013c0",prev-page="0x00001380",memory=[{addr="0x000013a0",data=["0x10","0x11","0x12","0x13"],ascii="xxxx"},{addr="0x000013a4",data=["0x14","0x15","0x16","0x17"],ascii="xxxx"},
{addr="0x000013a8",data=["0x18","0x19","0x1a","0x1b"],ascii="xxxx"},{addr="0x000013ac",data=["0x1c","0x1d","0x1e","0x1f"],ascii="xxxx"},{addr="0x000013b0",data=["0x20","0x21","0x22","0x23"],ascii=" !\"#"},{addr="0x000013b4",data=["0x24","0x25","0x26","0x27"],ascii="$%&’"},{addr="0x000013b8",data=["0x28","0x29","0x2a","0x2b"],ascii="()*+"},{addr="0x000013bc",data=["0x2c","0x2d","0x2e","0x2f"],ascii=",-./"}](gdb)
The -display-delete Command
Synopsis
-display-delete number
Delete the display number .
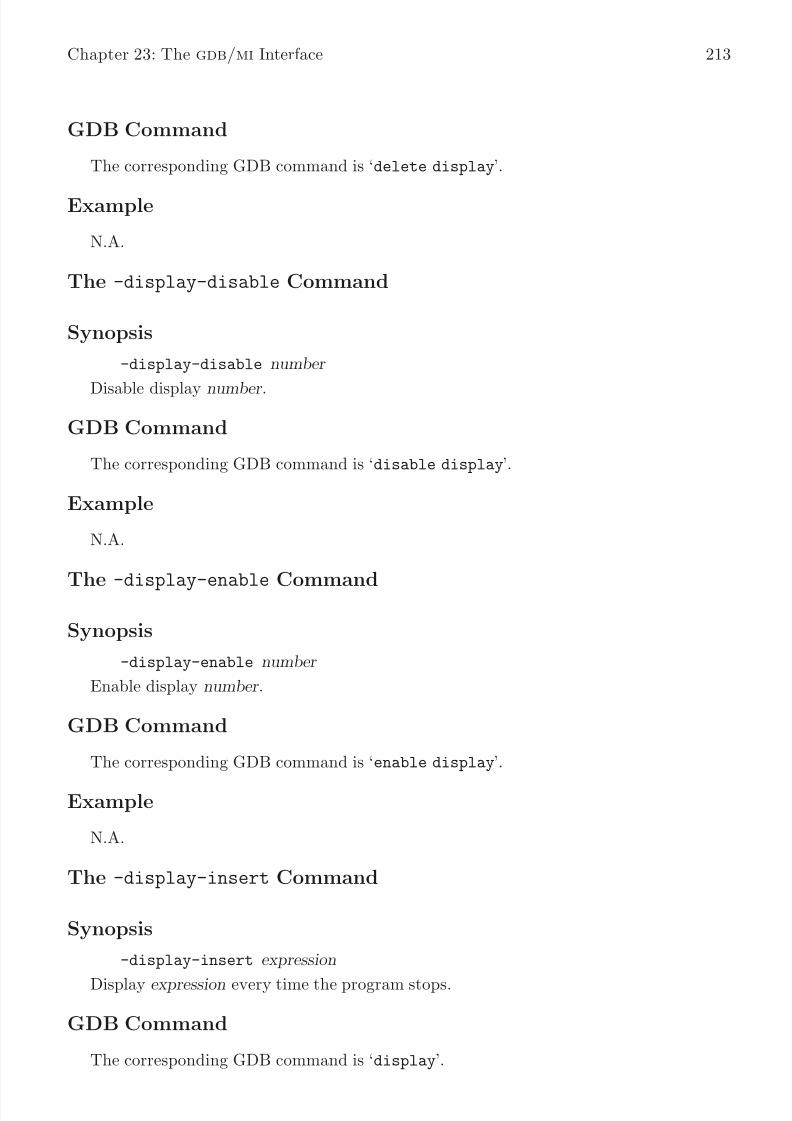
8/14/2019 Debugging With GDB - The GNU Source-Level Debugger
http://slidepdf.com/reader/full/debugging-with-gdb-the-gnu-source-level-debugger 224/328
Chapter 23: The gdb/mi Interface 213
GDB Command
The corresponding GDB command is ‘delete display’.
Example
N.A.
The -display-disable Command
Synopsis
-display-disable number
Disable display number .
GDB Command
The corresponding GDB command is ‘disable display’.
Example
N.A.
The -display-enable Command
Synopsis
-display-enable number
Enable display number .
GDB Command
The corresponding GDB command is ‘enable display’.
Example
N.A.
The -display-insert Command
Synopsis
-display-insert expression
Display expression every time the program stops.
GDB Command
The corresponding GDB command is ‘display’.

8/14/2019 Debugging With GDB - The GNU Source-Level Debugger
http://slidepdf.com/reader/full/debugging-with-gdb-the-gnu-source-level-debugger 225/328
214 Debugging with GDB
Example
N.A.
The -display-list Command
Synopsis
-display-list
List the displays. Do not show the current values.
GDB Command
The corresponding GDB command is ‘info display’.
Example
N.A.
The -environment-cd Command
Synopsis
-environment-cd pathdir
Set GDB’s working directory.
GDB Command
The corresponding GDB command is ‘cd’.
Example
(gdb)-environment-cd /kwikemart/marge/ezannoni/flathead-dev/devo/gdb^done(gdb)
The -environment-directory Command
Synopsis
-environment-directory pathdir
Add directory pathdir to beginning of search path for source files.
GDB Command
The corresponding GDB command is ‘dir’.
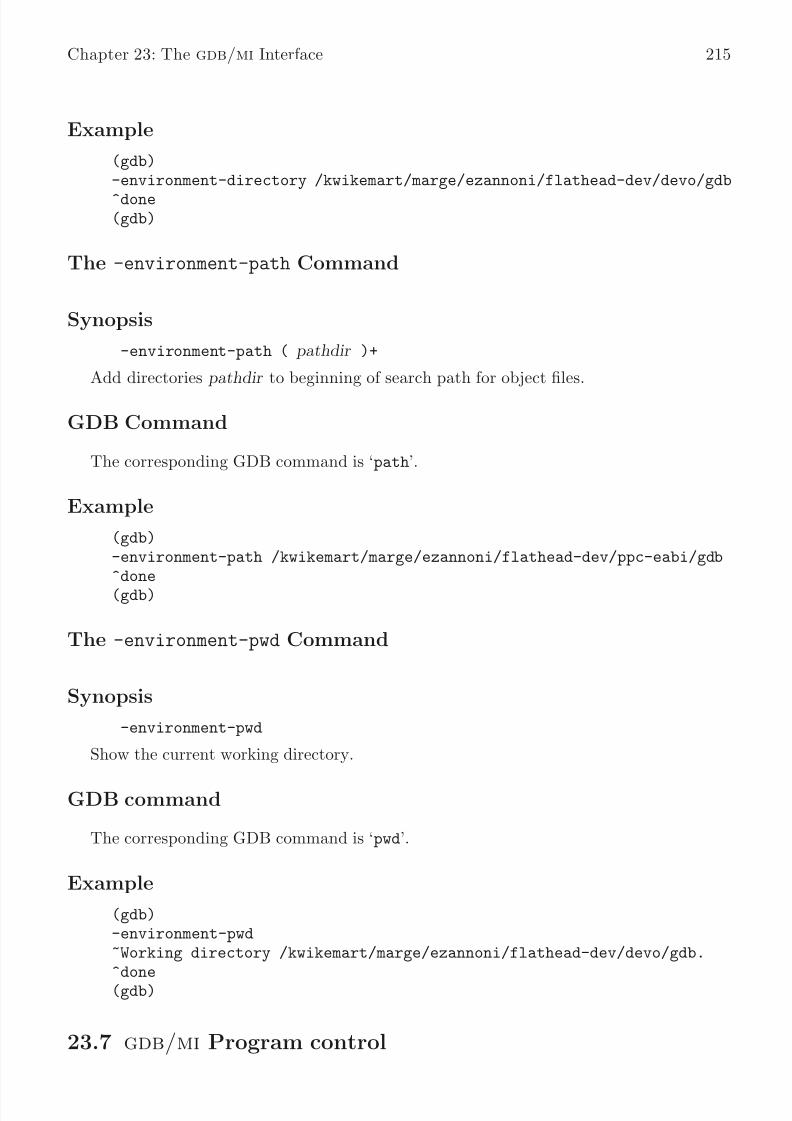
8/14/2019 Debugging With GDB - The GNU Source-Level Debugger
http://slidepdf.com/reader/full/debugging-with-gdb-the-gnu-source-level-debugger 226/328
Chapter 23: The gdb/mi Interface 215
Example
(gdb)-environment-directory /kwikemart/marge/ezannoni/flathead-dev/devo/gdb
^done(gdb)
The -environment-path Command
Synopsis
-environment-path ( pathdir )+
Add directories pathdir to beginning of search path for object files.
GDB Command
The corresponding GDB command is ‘path’.
Example
(gdb)-environment-path /kwikemart/marge/ezannoni/flathead-dev/ppc-eabi/gdb
^done(gdb)
The -environment-pwd Command
Synopsis
-environment-pwd
Show the current working directory.
GDB command
The corresponding GDB command is ‘pwd’.
Example
(gdb)-environment-pwd~Working directory /kwikemart/marge/ezannoni/flathead-dev/devo/gdb.
^done(gdb)
23.7 gdb/mi Program control

8/14/2019 Debugging With GDB - The GNU Source-Level Debugger
http://slidepdf.com/reader/full/debugging-with-gdb-the-gnu-source-level-debugger 227/328
216 Debugging with GDB
Program termination
As a result of execution, the inferior program can run to completion, if it doesn’t en-
counter any breakpoints. In this case the output will include an exit code, if the programhas exited exceptionally.
Examples
Program exited normally:
(gdb)-exec-run^running(gdb)
x = 5 5*stopped,reason="exited-normally"(gdb)
Program exited exceptionally:
(gdb)-exec-run^running(gdb)x = 5 5*stopped,reason="exited",exit-code="01"
(gdb)
Another way the program can terminate is if it receives a signal such as SIGINT. In thiscase, gdb/mi displays this:
(gdb)*stopped,reason="exited-signalled",signal-name="SIGINT",signal-meaning="Interrupt"
The -exec-abort Command
Synopsis
-exec-abort
Kill the inferior running program.
GDB Command
The corresponding GDB command is ‘kill’.
ExampleN.A.
The -exec-arguments Command
8/14/2019 Debugging With GDB - The GNU Source-Level Debugger
http://slidepdf.com/reader/full/debugging-with-gdb-the-gnu-source-level-debugger 228/328
Chapter 23: The gdb/mi Interface 217
Synopsis
-exec-arguments args
Set the inferior program arguments, to be used in the next ‘-exec-run’.
GDB Command
The corresponding GDB command is ‘set args’.
Example
Don’t have one around.
The -exec-continue Command
Synopsis
-exec-continue
Asynchronous command. Resumes the execution of the inferior program until a break-point is encountered, or until the inferior exits.
GDB CommandThe corresponding GDB corresponding is ‘continue’.
Example
-exec-continue^running(gdb)@Hello world*stopped,reason="breakpoint-hit",bkptno="2",frame={func="foo",args=[],
file="hello.c",line="13"}(gdb)
The -exec-finish Command
Synopsis
-exec-finish
Asynchronous command. Resumes the execution of the inferior program until the current
function is exited. Displays the results returned by the function.
GDB Command
The corresponding GDB command is ‘finish’.
8/14/2019 Debugging With GDB - The GNU Source-Level Debugger
http://slidepdf.com/reader/full/debugging-with-gdb-the-gnu-source-level-debugger 229/328
218 Debugging with GDB
Example
Function returning void.
-exec-finish^running(gdb)@hello from foo*stopped,reason="function-finished",frame={func="main",args=[],file="hello.c",line="7"}(gdb)
Function returning other than void. The name of the internal GDB variable storing theresult is printed, together with the value itself.
-exec-finish
^running(gdb)*stopped,reason="function-finished",frame={addr="0x000107b0",func="foo",args=[{name="a",value="1"],{name="b",value="9"}},file="recursive2.c",line="14"},gdb-result-var="$1",return-value="0"(gdb)
The -exec-interrupt Command
Synopsis
-exec-interrupt
Asynchronous command. Interrupts the background execution of the target. Note howthe token associated with the stop message is the one for the execution command that hasbeen interrupted. The token for the interrupt itself only appears in the ‘^done’ output. If the user is trying to interrupt a non-running program, an error message will be printed.
GDB Command
The corresponding GDB command is ‘interrupt’.
Example
(gdb)111-exec-continue111^running
(gdb)
222-exec-interrupt222^done(gdb)111*stopped,signal-name="SIGINT",signal-meaning="Interrupt",frame={addr="0x00010140",func="foo",args=[],file="try.c",line="13"}(gdb)
8/14/2019 Debugging With GDB - The GNU Source-Level Debugger
http://slidepdf.com/reader/full/debugging-with-gdb-the-gnu-source-level-debugger 230/328
Chapter 23: The gdb/mi Interface 219
(gdb)-exec-interrupt
^error,msg="mi_cmd_exec_interrupt: Inferior not executing."(gdb)
The -exec-next Command
Synopsis
-exec-next
Asynchronous command. Resumes execution of the inferior program, stopping when thebeginning of the next source line is reached.
GDB Command
The corresponding GDB command is ‘next’.
Example
-exec-next^running(gdb)
*stopped,reason="end-stepping-range",line="8",file="hello.c"(gdb)
The -exec-next-instruction Command
Synopsis
-exec-next-instruction
Asynchronous command. Executes one machine instruction. If the instruction is afunction call continues until the function returns. If the program stops at an instruction in
the middle of a source line, the address will be printed as well.
GDB Command
The corresponding GDB command is ‘nexti’.
Example
(gdb)-exec-next-instruction
^running
(gdb)*stopped,reason="end-stepping-range",addr="0x000100d4",line="5",file="hello.c"(gdb)

8/14/2019 Debugging With GDB - The GNU Source-Level Debugger
http://slidepdf.com/reader/full/debugging-with-gdb-the-gnu-source-level-debugger 231/328
220 Debugging with GDB
The -exec-return Command
Synopsis-exec-return
Makes current function return immediately. Doesn’t execute the inferior. Displays thenew current frame.
GDB Command
The corresponding GDB command is ‘return’.
Example(gdb)200-break-insert callee4200^done,bkpt={number="1",addr="0x00010734",file="../../../devo/gdb/testsuite/gdb.mi/basics.c",line="8"}(gdb)000-exec-run000^running(gdb)000*stopped,reason="breakpoint-hit",bkptno="1",frame={func="callee4",args=[],file="../../../devo/gdb/testsuite/gdb.mi/basics.c",line="8"}(gdb)205-break-delete205^done(gdb)111-exec-return111^done,frame={level="0 ",func="callee3",args=[{name="strarg",value="0x11940 \"A string argument.\""}],
file="../../../devo/gdb/testsuite/gdb.mi/basics.c",line="18"}(gdb)
The -exec-run Command
Synopsis
-exec-run
Asynchronous command. Starts execution of the inferior from the beginning. The
inferior executes until either a breakpoint is encountered or the program exits.
GDB Command
The corresponding GDB command is ‘run’.
8/14/2019 Debugging With GDB - The GNU Source-Level Debugger
http://slidepdf.com/reader/full/debugging-with-gdb-the-gnu-source-level-debugger 232/328
Chapter 23: The gdb/mi Interface 221
Example
(gdb)-break-insert main
^done,bkpt={number="1",addr="0x0001072c",file="recursive2.c",line="4"}(gdb)-exec-run^running(gdb)*stopped,reason="breakpoint-hit",bkptno="1",frame={func="main",args=[],file="recursive2.c",line="4"}(gdb)
The -exec-show-arguments Command
Synopsis
-exec-show-arguments
Print the arguments of the program.
GDB Command
The corresponding GDB command is ‘show args’.
Example
N.A.
The -exec-step Command
Synopsis
-exec-step
Asynchronous command. Resumes execution of the inferior program, stopping when thebeginning of the next source line is reached, if the next source line is not a function call. If it is, stop at the first instruction of the called function.
GDB Command
The corresponding GDB command is ‘step’.
Example
Stepping into a function:
-exec-step^running(gdb)*stopped,reason="end-stepping-range",
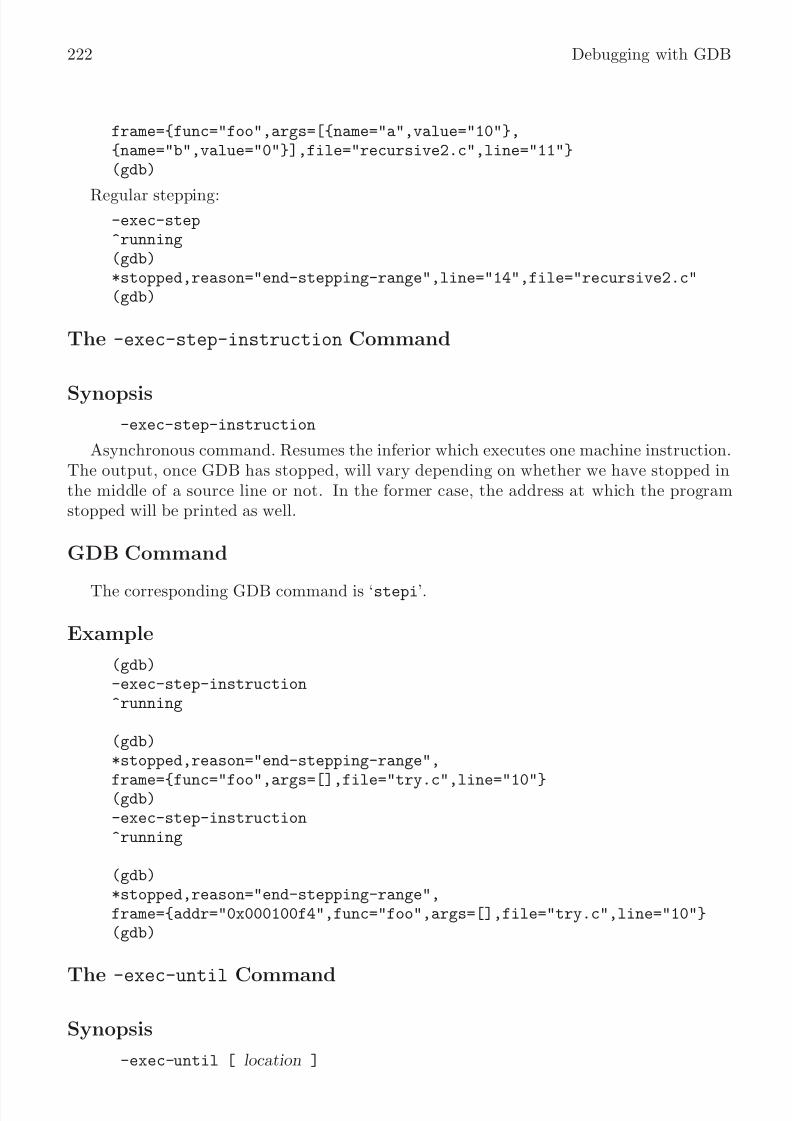
8/14/2019 Debugging With GDB - The GNU Source-Level Debugger
http://slidepdf.com/reader/full/debugging-with-gdb-the-gnu-source-level-debugger 233/328

8/14/2019 Debugging With GDB - The GNU Source-Level Debugger
http://slidepdf.com/reader/full/debugging-with-gdb-the-gnu-source-level-debugger 234/328
Chapter 23: The gdb/mi Interface 223
Asynchronous command. Executes the inferior until the location specified in the argu-ment is reached. If there is no argument, the inferior executes until a source line greater thanthe current one is reached. The reason for stopping in this case will be ‘location-reached’.
GDB Command
The corresponding GDB command is ‘until’.
Example
(gdb)-exec-until recursive2.c:6^running(gdb)x = 5 5*stopped,reason="location-reached",frame={func="main",args=[],file="recursive2.c",line="6"}(gdb)
The -file-exec-and-symbols Command
Synopsis
-file-exec-and-symbols file Specify the executable file to be debugged. This file is the one from which the symbol
table is also read. If no file is specified, the command clears the executable and symbolinformation. If breakpoints are set when using this command with no arguments, GDB willproduce error messages. Otherwise, no output is produced, except a completion notification.
GDB Command
The corresponding GDB command is ‘file’.
Example(gdb)-file-exec-and-symbols /kwikemart/marge/ezannoni/TRUNK/mbx/hello.mbx^done(gdb)
The -file-exec-file Command
Synopsis-file-exec-file file
Specify the executable file to be debugged. Unlike ‘-file-exec-and-symbols’, the sym-bol table is not read from this file. If used without argument, GDB clears the informationabout the executable file. No output is produced, except a completion notification.

8/14/2019 Debugging With GDB - The GNU Source-Level Debugger
http://slidepdf.com/reader/full/debugging-with-gdb-the-gnu-source-level-debugger 235/328
224 Debugging with GDB
GDB Command
The corresponding GDB command is ‘exec-file’.
Example
(gdb)-file-exec-file /kwikemart/marge/ezannoni/TRUNK/mbx/hello.mbx^done(gdb)
The -file-list-exec-sections Command
Synopsis-file-list-exec-sections
List the sections of the current executable file.
GDB Command
The GDB command ‘info file’ shows, among the rest, the same information as thiscommand. gdbtk has a corresponding command ‘gdb_load_info’.
Example
N.A.
The -file-list-exec-source-files Command
Synopsis
-file-list-exec-source-files
List the source files for the current executable.
GDB Command
There’s no GDB command which directly corresponds to this one. gdbtk has an analo-gous command ‘gdb_listfiles’.
Example
N.A.
The -file-list-shared-libraries Command
Synopsis
-file-list-shared-libraries
List the shared libraries in the program.

8/14/2019 Debugging With GDB - The GNU Source-Level Debugger
http://slidepdf.com/reader/full/debugging-with-gdb-the-gnu-source-level-debugger 236/328
Chapter 23: The gdb/mi Interface 225
GDB Command
The corresponding GDB command is ‘info shared’.
Example
N.A.
The -file-list-symbol-files Command
Synopsis
-file-list-symbol-files
List symbol files.
GDB Command
The corresponding GDB command is ‘info file’ (part of it).
Example
N.A.
The -file-symbol-file Command
Synopsis
-file-symbol-file file
Read symbol table info from the specified file argument. When used without arguments,clears GDB’s symbol table info. No output is produced, except for a completion notification.
GDB CommandThe corresponding GDB command is ‘symbol-file’.
Example
(gdb)-file-symbol-file /kwikemart/marge/ezannoni/TRUNK/mbx/hello.mbx^done(gdb)
23.8 Miscellaneous GDB commands in gdb/mi
The -gdb-exit Command
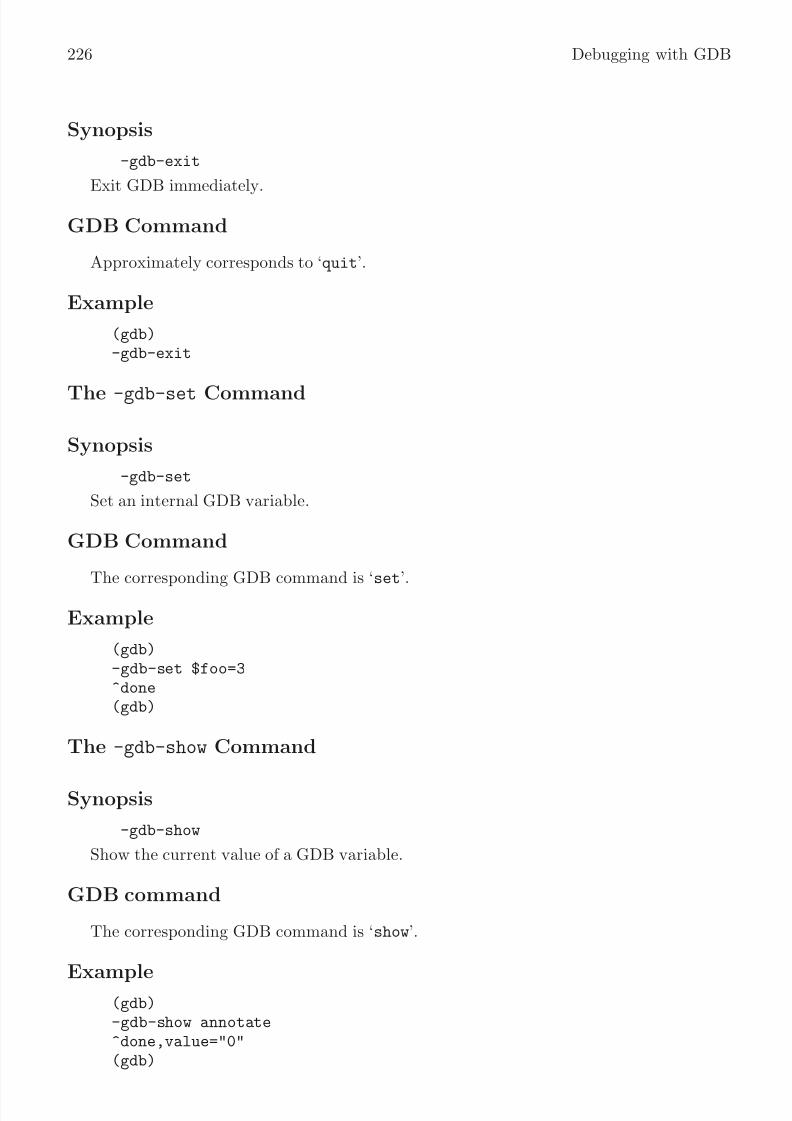
8/14/2019 Debugging With GDB - The GNU Source-Level Debugger
http://slidepdf.com/reader/full/debugging-with-gdb-the-gnu-source-level-debugger 237/328
226 Debugging with GDB
Synopsis
-gdb-exit
Exit GDB immediately.
GDB Command
Approximately corresponds to ‘quit’.
Example
(gdb)-gdb-exit
The -gdb-set Command
Synopsis
-gdb-set
Set an internal GDB variable.
GDB Command
The corresponding GDB command is ‘set’.
Example
(gdb)-gdb-set $foo=3^done(gdb)
The -gdb-show Command
Synopsis
-gdb-show
Show the current value of a GDB variable.
GDB command
The corresponding GDB command is ‘show’.
Example(gdb)-gdb-show annotate^done,value="0"(gdb)
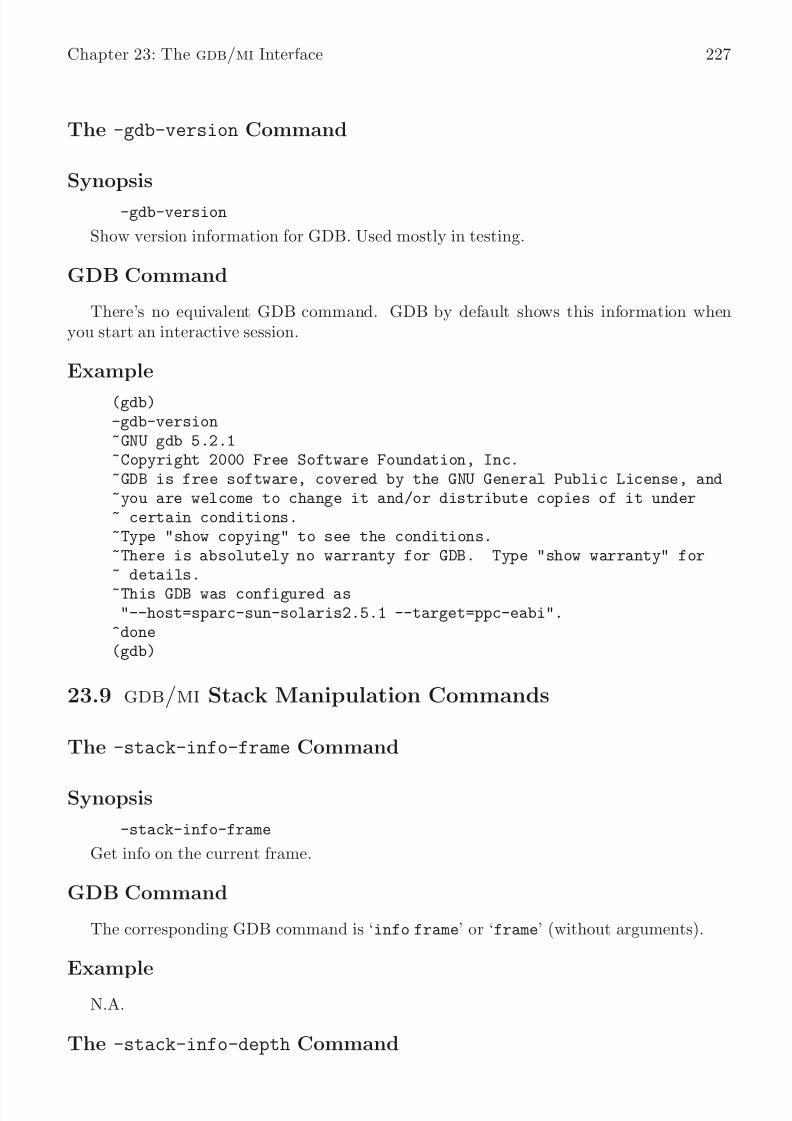
8/14/2019 Debugging With GDB - The GNU Source-Level Debugger
http://slidepdf.com/reader/full/debugging-with-gdb-the-gnu-source-level-debugger 238/328
Chapter 23: The gdb/mi Interface 227
The -gdb-version Command
Synopsis
-gdb-version
Show version information for GDB. Used mostly in testing.
GDB Command
There’s no equivalent GDB command. GDB by default shows this information whenyou start an interactive session.
Example
(gdb)-gdb-version~GNU gdb 5.2.1~Copyright 2000 Free Software Foundation, Inc.~GDB is free software, covered by the GNU General Public License, and~you are welcome to change it and/or distribute copies of it under~ certain conditions.~Type "show copying" to see the conditions.~There is absolutely no warranty for GDB. Type "show warranty" for~ details.~This GDB was configured as
"--host=sparc-sun-solaris2.5.1 --target=ppc-eabi".^done(gdb)
23.9 gdb/mi Stack Manipulation Commands
The -stack-info-frame Command
Synopsis
-stack-info-frame
Get info on the current frame.
GDB Command
The corresponding GDB command is ‘info frame’ or ‘frame’ (without arguments).
ExampleN.A.
The -stack-info-depth Command
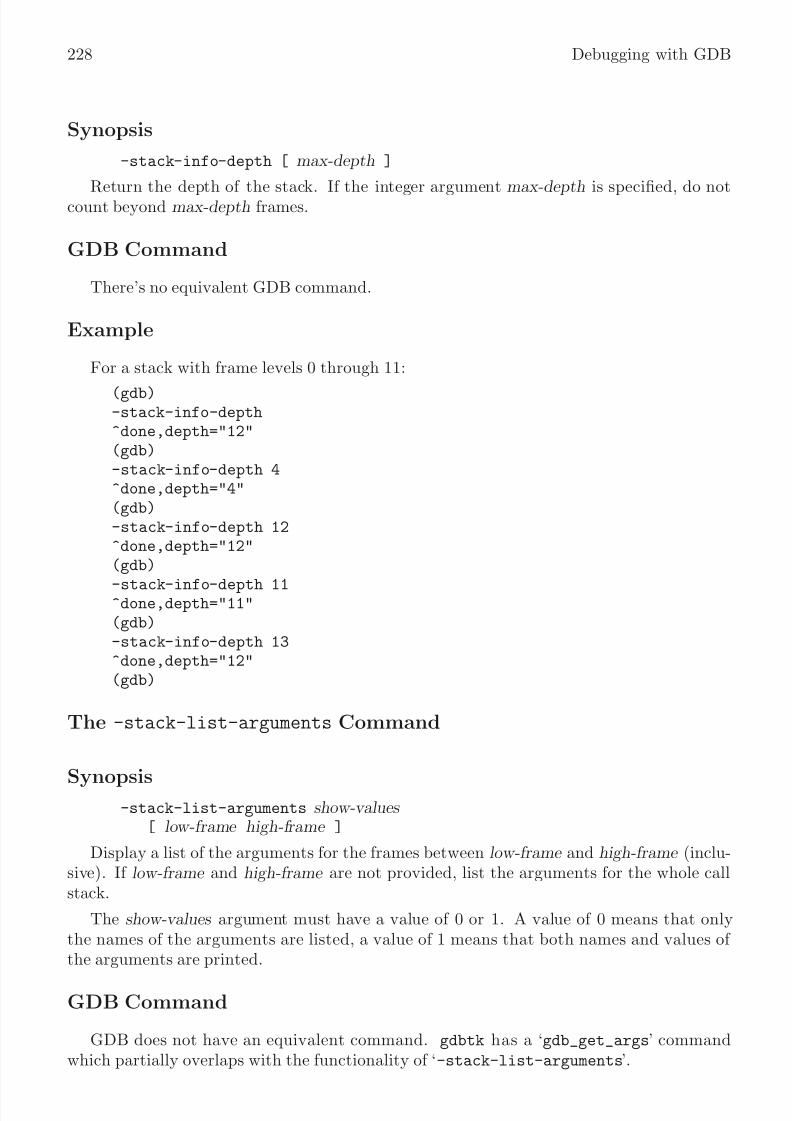
8/14/2019 Debugging With GDB - The GNU Source-Level Debugger
http://slidepdf.com/reader/full/debugging-with-gdb-the-gnu-source-level-debugger 239/328
228 Debugging with GDB
Synopsis
-stack-info-depth [ max-depth ]
Return the depth of the stack. If the integer argument max-depth is specified, do notcount beyond max-depth frames.
GDB Command
There’s no equivalent GDB command.
Example
For a stack with frame levels 0 through 11:
(gdb)-stack-info-depth^done,depth="12"(gdb)-stack-info-depth 4^done,depth="4"(gdb)-stack-info-depth 12^done,depth="12"(gdb)
-stack-info-depth 11^done,depth="11"(gdb)-stack-info-depth 13^done,depth="12"(gdb)
The -stack-list-arguments Command
Synopsis-stack-list-arguments show-values
[ low-frame high-frame ]
Display a list of the arguments for the frames between low-frame and high-frame (inclu-sive). If low-frame and high-frame are not provided, list the arguments for the whole callstack.
The show-values argument must have a value of 0 or 1. A value of 0 means that onlythe names of the arguments are listed, a value of 1 means that both names and values of the arguments are printed.
GDB Command
GDB does not have an equivalent command. gdbtk has a ‘gdb_get_args’ commandwhich partially overlaps with the functionality of ‘-stack-list-arguments’.

8/14/2019 Debugging With GDB - The GNU Source-Level Debugger
http://slidepdf.com/reader/full/debugging-with-gdb-the-gnu-source-level-debugger 240/328
Chapter 23: The gdb/mi Interface 229
Example
(gdb)-stack-list-frames
^done,stack=[frame={level="0 ",addr="0x00010734",func="callee4",file="../../../devo/gdb/testsuite/gdb.mi/basics.c",line="8"},frame={level="1 ",addr="0x0001076c",func="callee3",file="../../../devo/gdb/testsuite/gdb.mi/basics.c",line="17"},frame={level="2 ",addr="0x0001078c",func="callee2",file="../../../devo/gdb/testsuite/gdb.mi/basics.c",line="22"},frame={level="3 ",addr="0x000107b4",func="callee1",file="../../../devo/gdb/testsuite/gdb.mi/basics.c",line="27"},
frame={level="4 ",addr="0x000107e0",func="main",file="../../../devo/gdb/testsuite/gdb.mi/basics.c",line="32"}](gdb)-stack-list-arguments 0^done,stack-args=[frame={level="0",args=[]},frame={level="1",args=[name="strarg"]},frame={level="2",args=[name="intarg",name="strarg"]},frame={level="3",args=[name="intarg",name="strarg",name="fltarg"]},
frame={level="4",args=[]}](gdb)-stack-list-arguments 1^done,stack-args=[frame={level="0",args=[]},frame={level="1",
args=[{name="strarg",value="0x11940 \"A string argument.\""}]},frame={level="2",args=[{name="intarg",value="2"},
{name="strarg",value="0x11940 \"A string argument.\""}]},{frame={level="3",args=[{name="intarg",value="2"},{name="strarg",value="0x11940 \"A string argument.\""},{name="fltarg",value="3.5"}]},frame={level="4",args=[]}](gdb)-stack-list-arguments 0 2 2^done,stack-args=[frame={level="2",args=[name="intarg",name="strarg"]}](gdb)
-stack-list-arguments 1 2 2^done,stack-args=[frame={level="2",args=[{name="intarg",value="2"},{name="strarg",value="0x11940 \"A string argument.\""}]}](gdb)
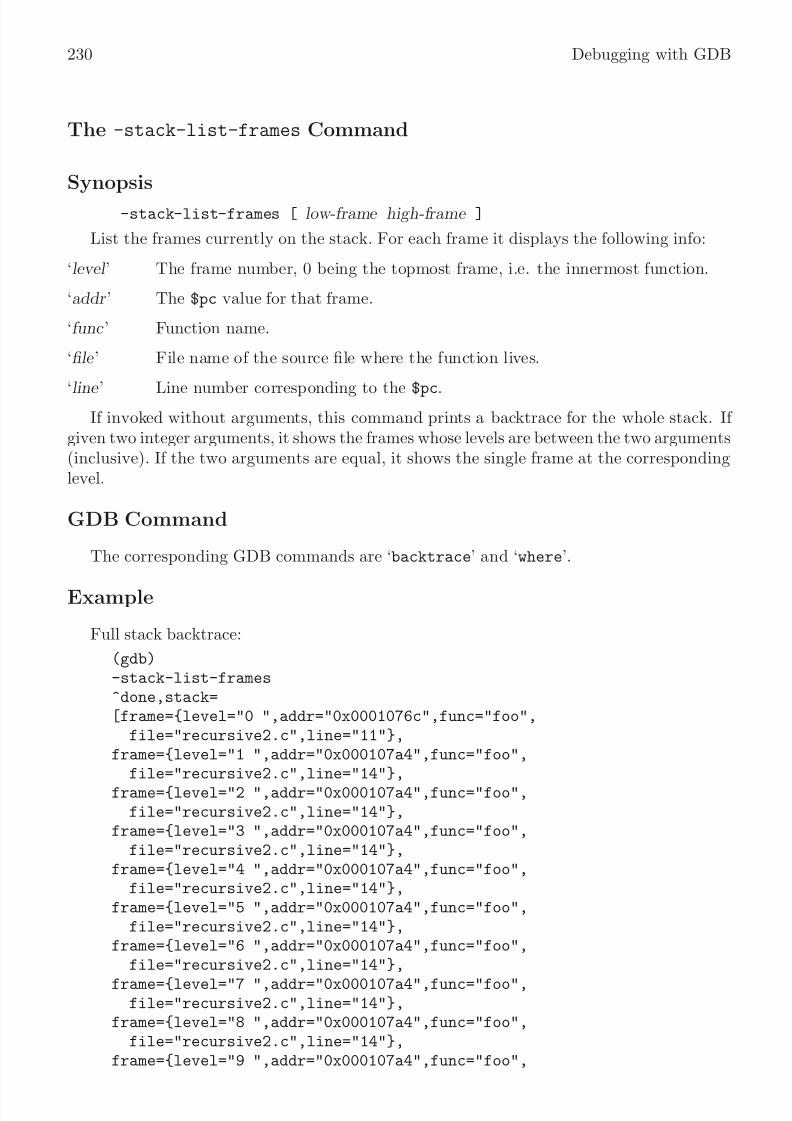
8/14/2019 Debugging With GDB - The GNU Source-Level Debugger
http://slidepdf.com/reader/full/debugging-with-gdb-the-gnu-source-level-debugger 241/328
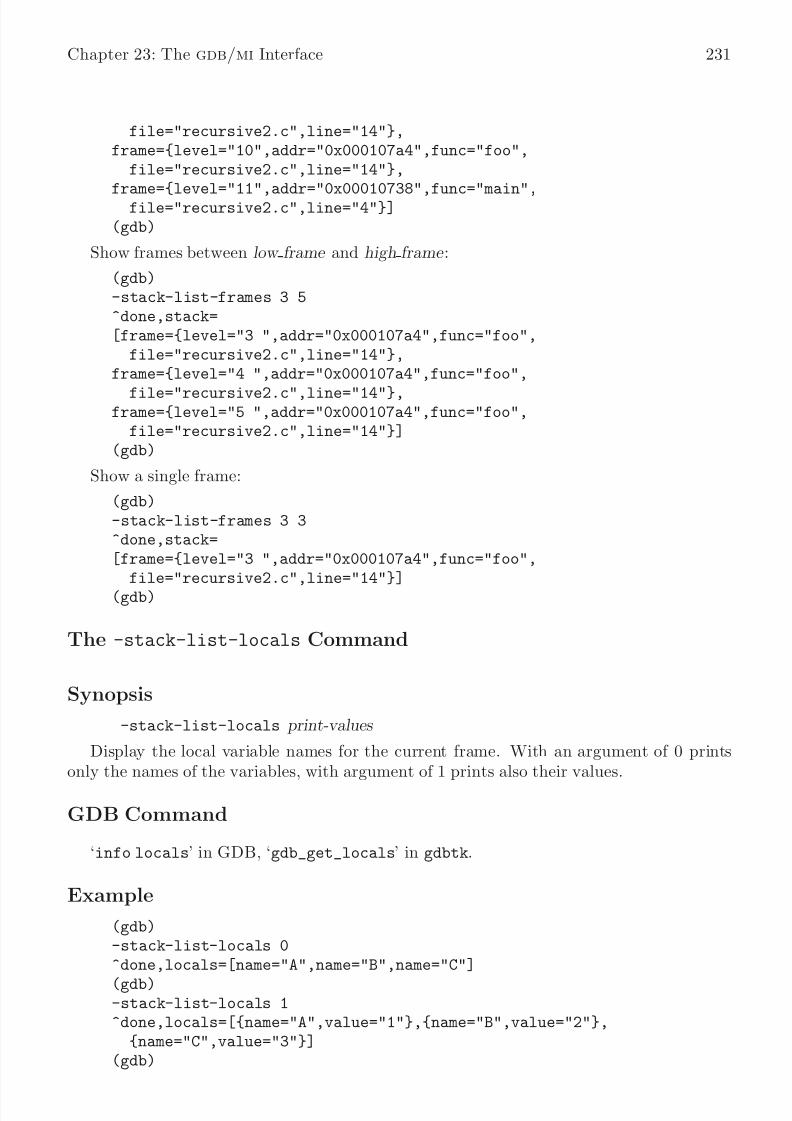
8/14/2019 Debugging With GDB - The GNU Source-Level Debugger
http://slidepdf.com/reader/full/debugging-with-gdb-the-gnu-source-level-debugger 242/328
Chapter 23: The gdb/mi Interface 231
file="recursive2.c",line="14"},frame={level="10",addr="0x000107a4",func="foo",
file="recursive2.c",line="14"},
frame={level="11",addr="0x00010738",func="main",file="recursive2.c",line="4"}](gdb)
Show frames between low frame and high frame :
(gdb)-stack-list-frames 3 5^done,stack=[frame={level="3 ",addr="0x000107a4",func="foo",
file="recursive2.c",line="14"},frame={level="4 ",addr="0x000107a4",func="foo",
file="recursive2.c",line="14"},frame={level="5 ",addr="0x000107a4",func="foo",
file="recursive2.c",line="14"}](gdb)
Show a single frame:
(gdb)-stack-list-frames 3 3^done,stack=[frame={level="3 ",addr="0x000107a4",func="foo",
file="recursive2.c",line="14"}](gdb)
The -stack-list-locals Command
Synopsis
-stack-list-locals print-values
Display the local variable names for the current frame. With an argument of 0 prints
only the names of the variables, with argument of 1 prints also their values.
GDB Command
‘info locals’ in GDB, ‘gdb_get_locals’ in gdbtk.
Example
(gdb)-stack-list-locals 0
^done,locals=[name="A",name="B",name="C"](gdb)-stack-list-locals 1^done,locals=[{name="A",value="1"},{name="B",value="2"},
{name="C",value="3"}](gdb)
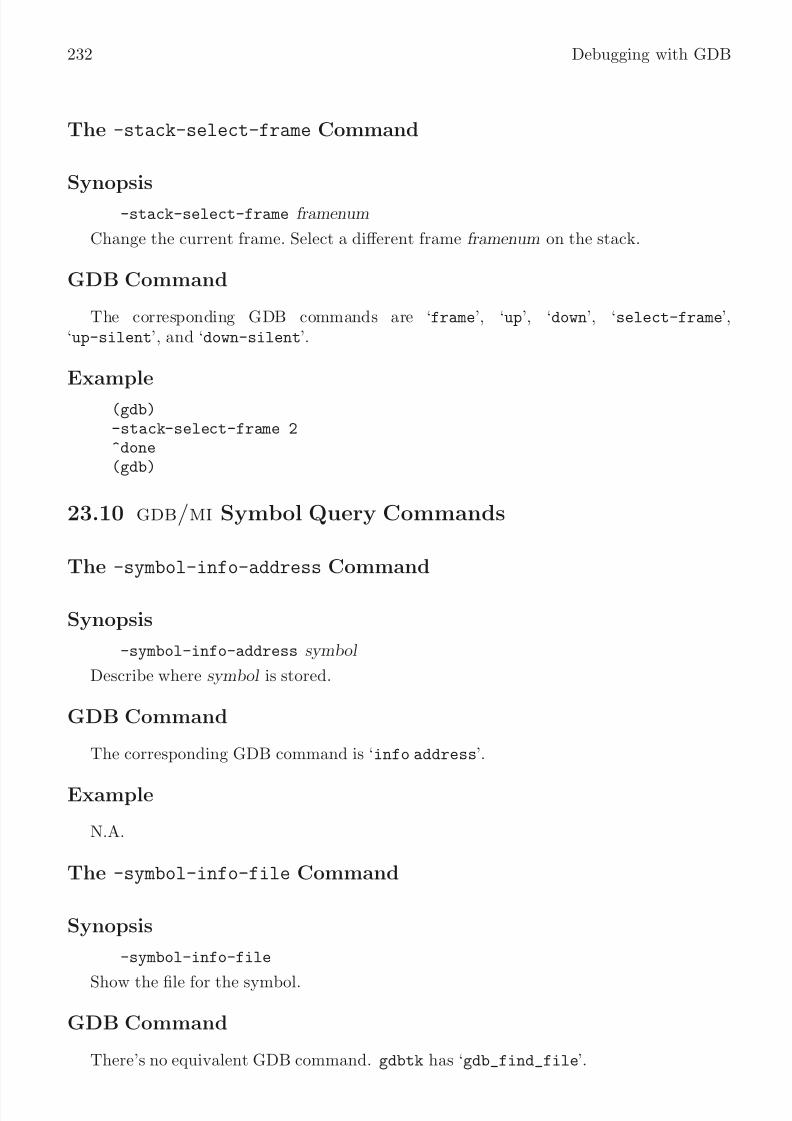
8/14/2019 Debugging With GDB - The GNU Source-Level Debugger
http://slidepdf.com/reader/full/debugging-with-gdb-the-gnu-source-level-debugger 243/328
232 Debugging with GDB
The -stack-select-frame Command
Synopsis
-stack-select-frame framenum
Change the current frame. Select a different frame framenum on the stack.
GDB Command
The corresponding GDB commands are ‘frame’, ‘up’, ‘down’, ‘select-frame’,‘up-silent’, and ‘down-silent’.
Example(gdb)-stack-select-frame 2^done(gdb)
23.10 gdb/mi Symbol Query Commands
The -symbol-info-address Command
Synopsis
-symbol-info-address symbol
Describe where symbol is stored.
GDB Command
The corresponding GDB command is ‘info address’.
Example
N.A.
The -symbol-info-file Command
Synopsis
-symbol-info-file
Show the file for the symbol.
GDB Command
There’s no equivalent GDB command. gdbtk has ‘gdb_find_file’.

8/14/2019 Debugging With GDB - The GNU Source-Level Debugger
http://slidepdf.com/reader/full/debugging-with-gdb-the-gnu-source-level-debugger 244/328
Chapter 23: The gdb/mi Interface 233
Example
N.A.
The -symbol-info-function Command
Synopsis
-symbol-info-function
Show which function the symbol lives in.
GDB Command
‘gdb_get_function’ in gdbtk.
Example
N.A.
The -symbol-info-line Command
Synopsis
-symbol-info-lineShow the core addresses of the code for a source line.
GDB Command
The corresponding GDB comamnd is ‘info line’. gdbtk has the ‘gdb_get_line’ and‘gdb_get_file’ commands.
Example
N.A.
The -symbol-info-symbol Command
Synopsis
-symbol-info-symbol addr
Describe what symbol is at location addr .
GDB Command
The corresponding GDB command is ‘info symbol’.
Example
N.A.

8/14/2019 Debugging With GDB - The GNU Source-Level Debugger
http://slidepdf.com/reader/full/debugging-with-gdb-the-gnu-source-level-debugger 245/328
234 Debugging with GDB
The -symbol-list-functions Command
Synopsis
-symbol-list-functions
List the functions in the executable.
GDB Command
‘info functions’ in GDB, ‘gdb_listfunc’ and ‘gdb_search’ in gdbtk.
Example
N.A.
The -symbol-list-types Command
Synopsis
-symbol-list-types
List all the type names.
GDB Command
The corresponding commands are ‘info types’ in GDB, ‘gdb_search’ in gdbtk.
Example
N.A.
The -symbol-list-variables Command
Synopsis
-symbol-list-variables
List all the global and static variable names.
GDB Command
‘info variables’ in GDB, ‘gdb_search’ in gdbtk.
ExampleN.A.
The -symbol-locate Command
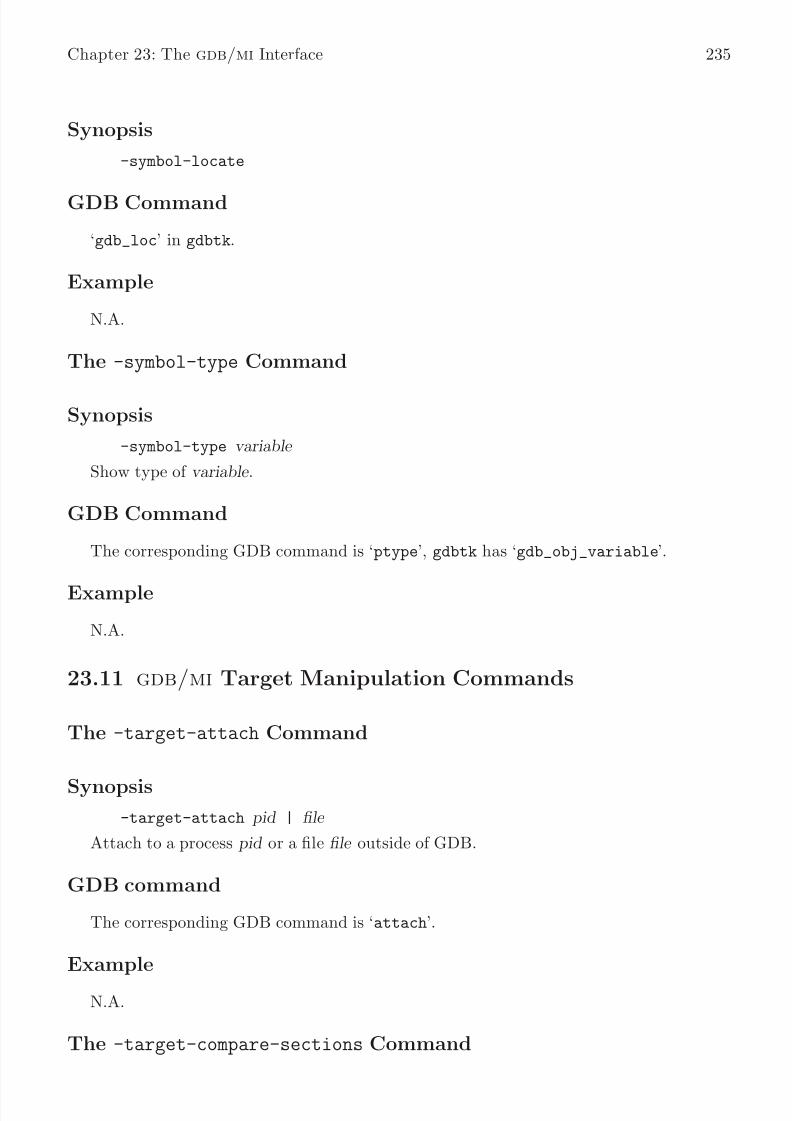
8/14/2019 Debugging With GDB - The GNU Source-Level Debugger
http://slidepdf.com/reader/full/debugging-with-gdb-the-gnu-source-level-debugger 246/328
Chapter 23: The gdb/mi Interface 235
Synopsis
-symbol-locate
GDB Command
‘gdb_loc’ in gdbtk.
Example
N.A.
The -symbol-type Command
Synopsis
-symbol-type variable
Show type of variable .
GDB Command
The corresponding GDB command is ‘ptype’, gdbtk has ‘gdb_obj_variable’.
Example
N.A.
23.11 gdb/mi Target Manipulation Commands
The -target-attach Command
Synopsis
-target-attach pid | file
Attach to a process pid or a file file outside of GDB.
GDB command
The corresponding GDB command is ‘attach’.
ExampleN.A.
The -target-compare-sections Command
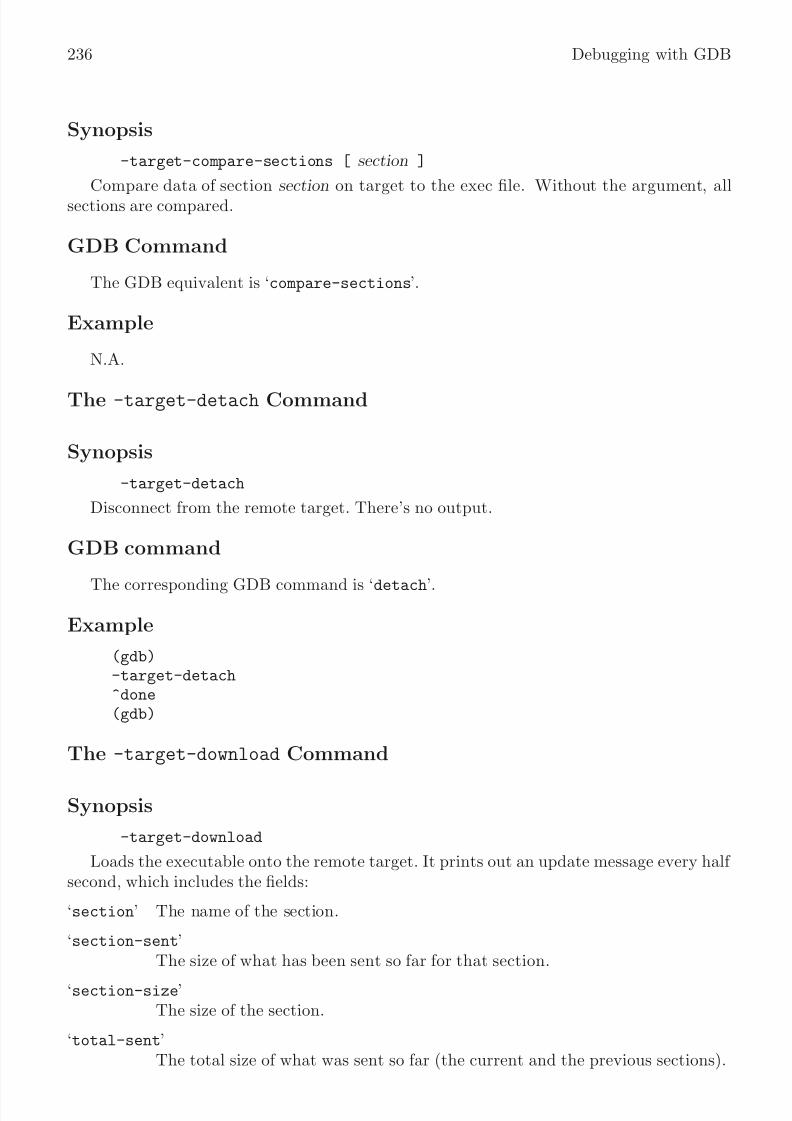
8/14/2019 Debugging With GDB - The GNU Source-Level Debugger
http://slidepdf.com/reader/full/debugging-with-gdb-the-gnu-source-level-debugger 247/328
236 Debugging with GDB
Synopsis
-target-compare-sections [ section ]
Compare data of section section on target to the exec file. Without the argument, allsections are compared.
GDB Command
The GDB equivalent is ‘compare-sections’.
Example
N.A.
The -target-detach Command
Synopsis
-target-detach
Disconnect from the remote target. There’s no output.
GDB command
The corresponding GDB command is ‘detach’.
Example
(gdb)-target-detach^done(gdb)
The -target-download Command
Synopsis
-target-download
Loads the executable onto the remote target. It prints out an update message every half second, which includes the fields:
‘section’ The name of the section.
‘section-sent’The size of what has been sent so far for that section.
‘section-size’The size of the section.
‘total-sent’The total size of what was sent so far (the current and the previous sections).

8/14/2019 Debugging With GDB - The GNU Source-Level Debugger
http://slidepdf.com/reader/full/debugging-with-gdb-the-gnu-source-level-debugger 248/328
Chapter 23: The gdb/mi Interface 237
‘total-size’The size of the overall executable to download.
Each message is sent as status record (see Section 23.1.2 [gdb/mi Output Syntax], page 192).
In addition, it prints the name and size of the sections, as they are downloaded. Thesemessages include the following fields:
‘section’ The name of the section.
‘section-size’The size of the section.
‘total-size’The size of the overall executable to download.
At the end, a summary is printed.
GDB Command
The corresponding GDB command is ‘load’.
Example
Note: each status message appears on a single line. Here the messages have been brokendown so that they can fit onto a page.
(gdb)-target-download+download,{section=".text",section-size="6668",total-size="9880"}+download,{section=".text",section-sent="512",section-size="6668",total-sent="512",total-size="9880"}+download,{section=".text",section-sent="1024",section-size="6668",total-sent="1024",total-size="9880"}+download,{section=".text",section-sent="1536",section-size="6668",total-sent="1536",total-size="9880"}+download,{section=".text",section-sent="2048",section-size="6668",
total-sent="2048",total-size="9880"}+download,{section=".text",section-sent="2560",section-size="6668",total-sent="2560",total-size="9880"}+download,{section=".text",section-sent="3072",section-size="6668",total-sent="3072",total-size="9880"}+download,{section=".text",section-sent="3584",section-size="6668",total-sent="3584",total-size="9880"}+download,{section=".text",section-sent="4096",section-size="6668",total-sent="4096",total-size="9880"}+download,{section=".text",section-sent="4608",section-size="6668",
total-sent="4608",total-size="9880"}+download,{section=".text",section-sent="5120",section-size="6668",total-sent="5120",total-size="9880"}+download,{section=".text",section-sent="5632",section-size="6668",total-sent="5632",total-size="9880"}+download,{section=".text",section-sent="6144",section-size="6668",

8/14/2019 Debugging With GDB - The GNU Source-Level Debugger
http://slidepdf.com/reader/full/debugging-with-gdb-the-gnu-source-level-debugger 249/328
238 Debugging with GDB
total-sent="6144",total-size="9880"}+download,{section=".text",section-sent="6656",section-size="6668",total-sent="6656",total-size="9880"}
+download,{section=".init",section-size="28",total-size="9880"}+download,{section=".fini",section-size="28",total-size="9880"}+download,{section=".data",section-size="3156",total-size="9880"}+download,{section=".data",section-sent="512",section-size="3156",total-sent="7236",total-size="9880"}+download,{section=".data",section-sent="1024",section-size="3156",total-sent="7748",total-size="9880"}+download,{section=".data",section-sent="1536",section-size="3156",total-sent="8260",total-size="9880"}+download,{section=".data",section-sent="2048",section-size="3156",total-sent="8772",total-size="9880"}+download,{section=".data",section-sent="2560",section-size="3156",total-sent="9284",total-size="9880"}+download,{section=".data",section-sent="3072",section-size="3156",total-sent="9796",total-size="9880"}^done,address="0x10004",load-size="9880",transfer-rate="6586",write-rate="429"(gdb)
The -target-exec-status Command
Synopsis
-target-exec-status
Provide information on the state of the target (whether it is running or not, for instance).
GDB Command
There’s no equivalent GDB command.
Example
N.A.
The -target-list-available-targets Command
Synopsis
-target-list-available-targets
List the possible targets to connect to.
GDB Command
The corresponding GDB command is ‘help target’.
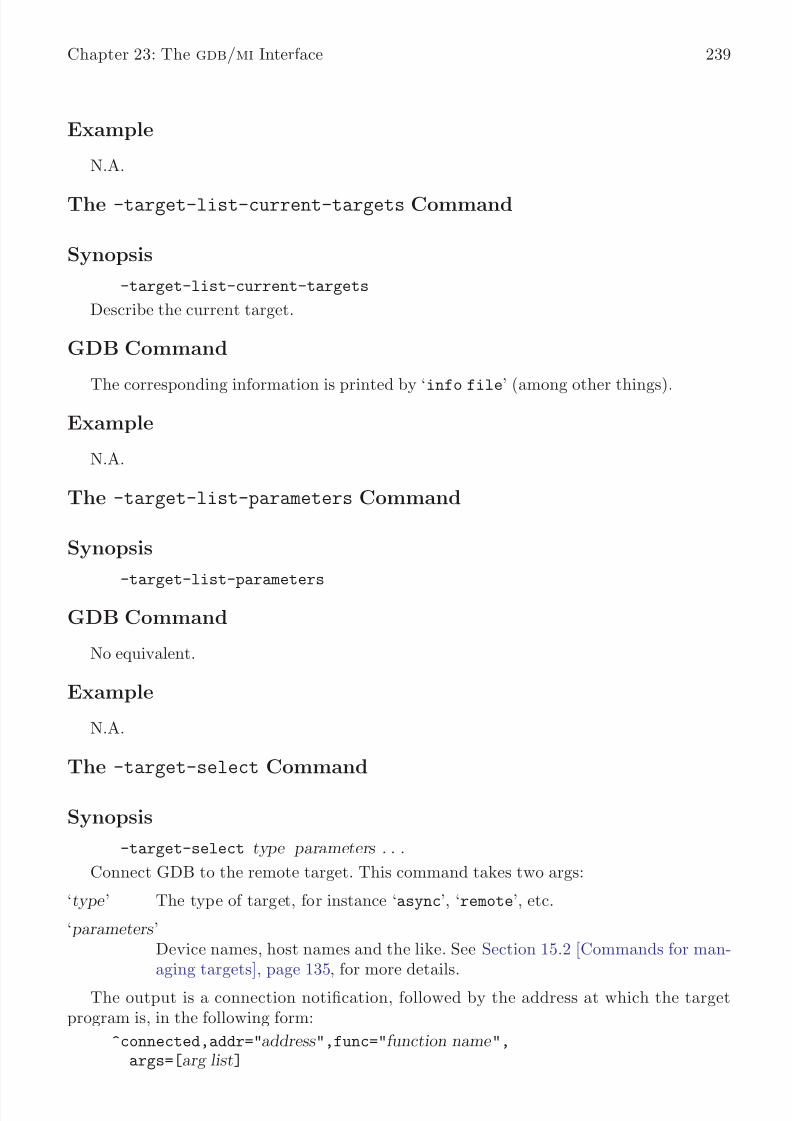
8/14/2019 Debugging With GDB - The GNU Source-Level Debugger
http://slidepdf.com/reader/full/debugging-with-gdb-the-gnu-source-level-debugger 250/328
Chapter 23: The gdb/mi Interface 239
Example
N.A.
The -target-list-current-targets Command
Synopsis
-target-list-current-targets
Describe the current target.
GDB Command
The corresponding information is printed by ‘info file’ (among other things).
Example
N.A.
The -target-list-parameters Command
Synopsis
-target-list-parameters
GDB Command
No equivalent.
Example
N.A.
The -target-select Command
Synopsis
-target-select type parameters . . .
Connect GDB to the remote target. This command takes two args:
‘type ’ The type of target, for instance ‘async’, ‘remote’, etc.
‘ parameters ’Device names, host names and the like. See Section 15.2 [Commands for man-
aging targets], page 135, for more details.The output is a connection notification, followed by the address at which the target
program is, in the following form:
^connected,addr="address ",func="function name ",args=[arg list]
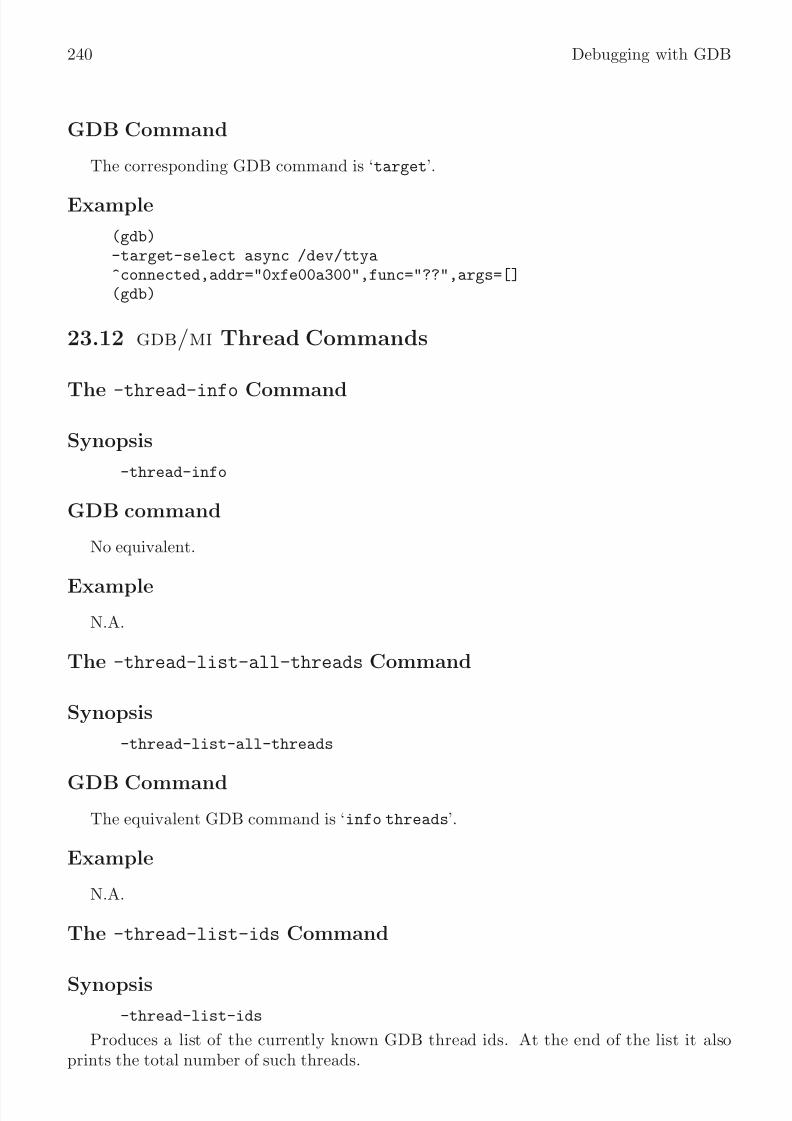
8/14/2019 Debugging With GDB - The GNU Source-Level Debugger
http://slidepdf.com/reader/full/debugging-with-gdb-the-gnu-source-level-debugger 251/328
240 Debugging with GDB
GDB Command
The corresponding GDB command is ‘target’.
Example
(gdb)-target-select async /dev/ttya^connected,addr="0xfe00a300",func="??",args=[](gdb)
23.12 gdb/mi Thread Commands
The -thread-info Command
Synopsis
-thread-info
GDB command
No equivalent.
Example
N.A.
The -thread-list-all-threads Command
Synopsis
-thread-list-all-threads
GDB Command
The equivalent GDB command is ‘info threads’.
Example
N.A.
The -thread-list-ids Command
Synopsis
-thread-list-ids
Produces a list of the currently known GDB thread ids. At the end of the list it alsoprints the total number of such threads.

8/14/2019 Debugging With GDB - The GNU Source-Level Debugger
http://slidepdf.com/reader/full/debugging-with-gdb-the-gnu-source-level-debugger 252/328
Chapter 23: The gdb/mi Interface 241
GDB Command
Part of ‘info threads’ supplies the same information.
Example
No threads present, besides the main process:
(gdb)-thread-list-ids^done,thread-ids={},number-of-threads="0"(gdb)
Several threads:
(gdb)
-thread-list-ids^done,thread-ids={thread-id="3",thread-id="2",thread-id="1"},number-of-threads="3"(gdb)
The -thread-select Command
Synopsis
-thread-select threadnum
Make threadnum the current thread. It prints the number of the new current thread,and the topmost frame for that thread.
GDB Command
The corresponding GDB command is ‘thread’.
Example
(gdb)-exec-next
^running(gdb)*stopped,reason="end-stepping-range",thread-id="2",line="187",file="../../../devo/gdb/testsuite/gdb.threads/linux-dp.c"(gdb)-thread-list-ids^done,thread-ids={thread-id="3",thread-id="2",thread-id="1"},number-of-threads="3"(gdb)
-thread-select 3^done,new-thread-id="3",frame={level="0 ",func="vprintf",args=[{name="format",value="0x8048e9c \"%*s%c %d %c\\n\""},{name="arg",value="0x2"}],file="vprintf.c",line="31"}(gdb)
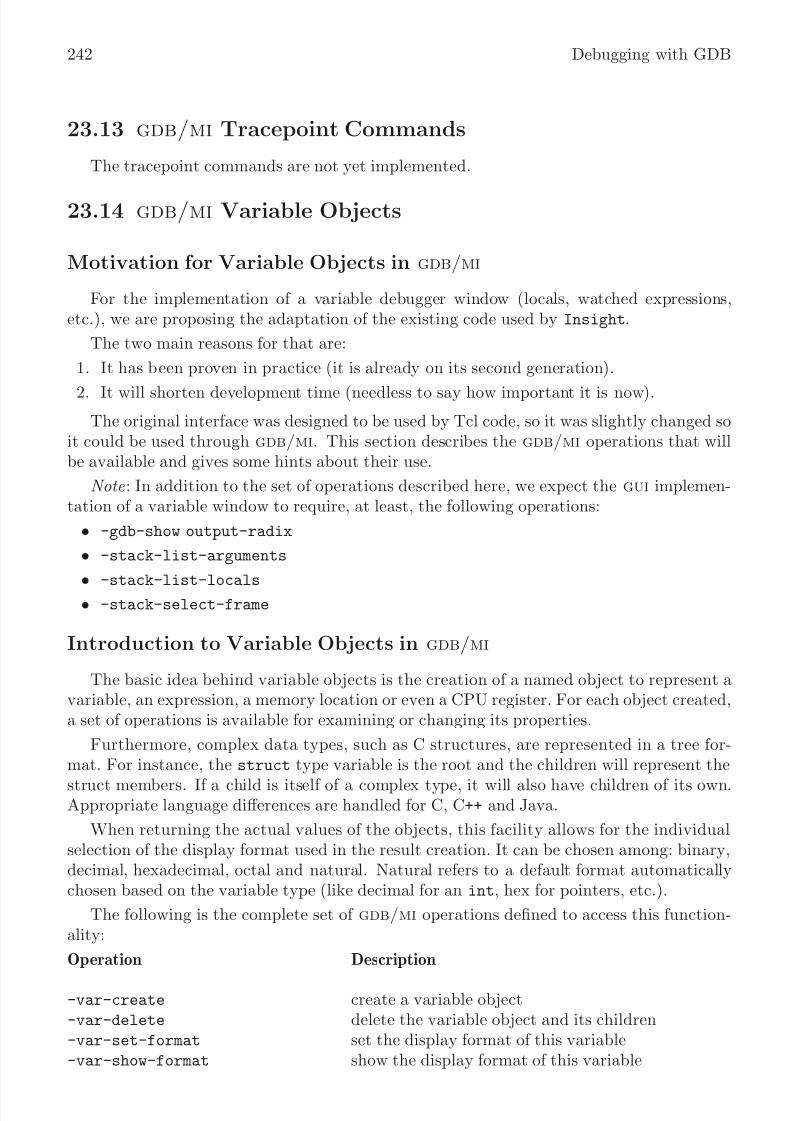
8/14/2019 Debugging With GDB - The GNU Source-Level Debugger
http://slidepdf.com/reader/full/debugging-with-gdb-the-gnu-source-level-debugger 253/328
242 Debugging with GDB
23.13 gdb/mi Tracepoint Commands
The tracepoint commands are not yet implemented.
23.14 gdb/mi Variable Objects
Motivation for Variable Objects in gdb/mi
For the implementation of a variable debugger window (locals, watched expressions,etc.), we are proposing the adaptation of the existing code used by Insight.
The two main reasons for that are:
1. It has been proven in practice (it is already on its second generation).
2. It will shorten development time (needless to say how important it is now).
The original interface was designed to be used by Tcl code, so it was slightly changed soit could be used through gdb/mi. This section describes the gdb/mi operations that willbe available and gives some hints about their use.
Note : In addition to the set of operations described here, we expect the gui implemen-tation of a variable window to require, at least, the following operations:
• -gdb-show output-radix
• -stack-list-arguments
• -stack-list-locals• -stack-select-frame
Introduction to Variable Objects in gdb/mi
The basic idea behind variable objects is the creation of a named object to represent avariable, an expression, a memory location or even a CPU register. For each object created,a set of operations is available for examining or changing its properties.
Furthermore, complex data types, such as C structures, are represented in a tree for-mat. For instance, the struct type variable is the root and the children will represent thestruct members. If a child is itself of a complex type, it will also have children of its own.Appropriate language differences are handled for C, C++ and Java.
When returning the actual values of the objects, this facility allows for the individualselection of the display format used in the result creation. It can be chosen among: binary,decimal, hexadecimal, octal and natural. Natural refers to a default format automaticallychosen based on the variable type (like decimal for an int, hex for pointers, etc.).
The following is the complete set of gdb/mi operations defined to access this function-ality:
Operation Description
-var-create create a variable object-var-delete delete the variable object and its children-var-set-format set the display format of this variable-var-show-format show the display format of this variable
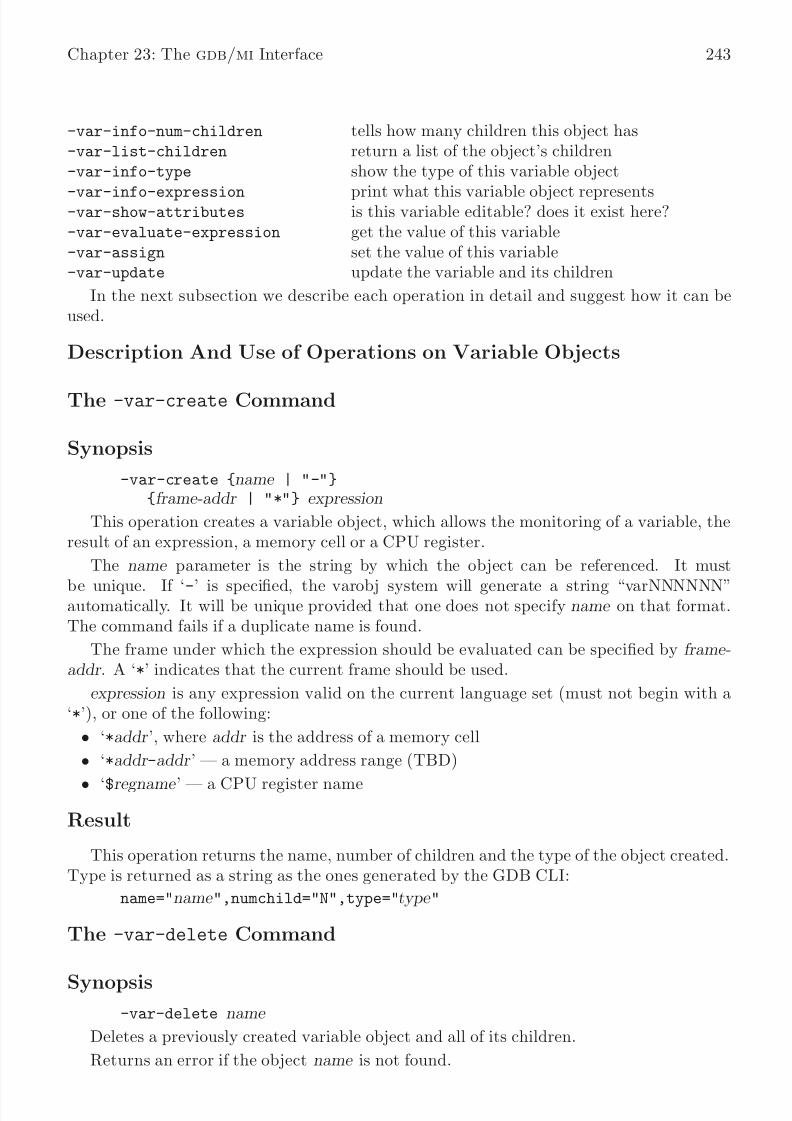
8/14/2019 Debugging With GDB - The GNU Source-Level Debugger
http://slidepdf.com/reader/full/debugging-with-gdb-the-gnu-source-level-debugger 254/328
Chapter 23: The gdb/mi Interface 243
-var-info-num-children tells how many children this object has-var-list-children return a list of the object’s children-var-info-type show the type of this variable object
-var-info-expression print what this variable object represents-var-show-attributes is this variable editable? does it exist here?-var-evaluate-expression get the value of this variable-var-assign set the value of this variable-var-update update the variable and its children
In the next subsection we describe each operation in detail and suggest how it can beused.
Description And Use of Operations on Variable Objects
The -var-create Command
Synopsis
-var-create {name | "-"}{frame-addr | "*"} expression
This operation creates a variable object, which allows the monitoring of a variable, theresult of an expression, a memory cell or a CPU register.
The name parameter is the string by which the object can be referenced. It must
be unique. If ‘-’ is specified, the varobj system will generate a string “varNNNNNN”automatically. It will be unique provided that one does not specify name on that format.The command fails if a duplicate name is found.
The frame under which the expression should be evaluated can be specified by frame-addr . A ‘*’ indicates that the current frame should be used.
expression is any expression valid on the current language set (must not begin with a‘*’), or one of the following:
• ‘*addr ’, where addr is the address of a memory cell
• ‘*addr -addr ’ — a memory address range (TBD)
• ‘$regname ’ — a CPU register name
Result
This operation returns the name, number of children and the type of the object created.Type is returned as a string as the ones generated by the GDB CLI:
name="name ",numchild="N",type="type "
The -var-delete Command
Synopsis
-var-delete name
Deletes a previously created variable object and all of its children.
Returns an error if the object name is not found.
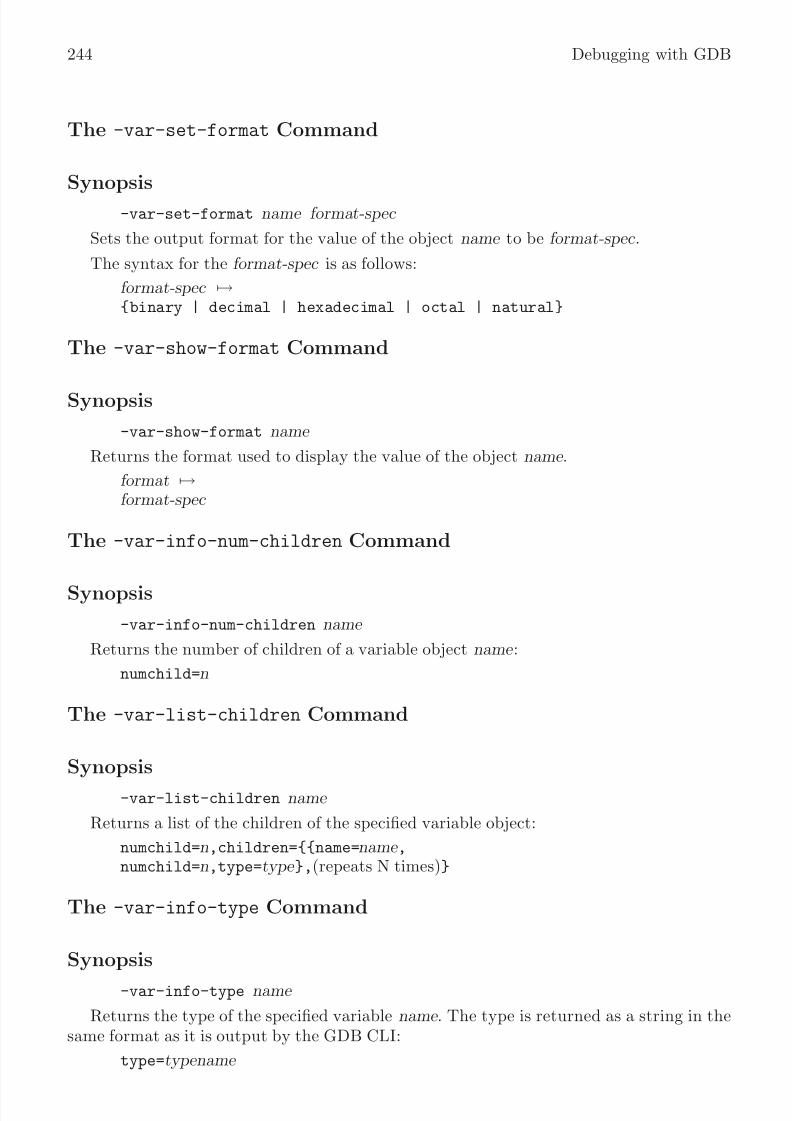
8/14/2019 Debugging With GDB - The GNU Source-Level Debugger
http://slidepdf.com/reader/full/debugging-with-gdb-the-gnu-source-level-debugger 255/328
244 Debugging with GDB
The -var-set-format Command
Synopsis
-var-set-format name format-spec
Sets the output format for the value of the object name to be format-spec .
The syntax for the format-spec is as follows:
format-spec →{binary | decimal | hexadecimal | octal | natural}
The -var-show-format Command
Synopsis
-var-show-format name
Returns the format used to display the value of the object name .
format →format-spec
The -var-info-num-children Command
Synopsis
-var-info-num-children name
Returns the number of children of a variable object name :
numchild=n
The -var-list-children Command
Synopsis
-var-list-children name
Returns a list of the children of the specified variable object:
numchild=n,children={{name=name ,numchild=n,type=type },(repeats N times)}
The -var-info-type Command
Synopsis
-var-info-type name
Returns the type of the specified variable name . The type is returned as a string in thesame format as it is output by the GDB CLI:
type=typename

8/14/2019 Debugging With GDB - The GNU Source-Level Debugger
http://slidepdf.com/reader/full/debugging-with-gdb-the-gnu-source-level-debugger 256/328
Chapter 23: The gdb/mi Interface 245
The -var-info-expression Command
Synopsis
-var-info-expression name
Returns what is represented by the variable object name :
lang=lang-spec ,exp=expression
where lang-spec is {"C" | "C++" | "Java"}.
The -var-show-attributes Command
Synopsis-var-show-attributes name
List attributes of the specified variable object name :
status=attr [ ( ,attr )* ]
where attr is { { editable | noneditable } | TBD }.
The -var-evaluate-expression Command
Synopsis-var-evaluate-expression name
Evaluates the expression that is represented by the specified variable object and returnsits value as a string in the current format specified for the object:
value=value
The -var-assign Command
Synopsis
-var-assign name expression
Assigns the value of expression to the variable object specified by name . The objectmust be ‘editable’.
The -var-update Command
Synopsis
-var-update {name | "*"}Update the value of the variable object name by evaluating its expression after fetching
all the new values from memory or registers. A ‘*’ causes all existing variable objects to beupdated.

8/14/2019 Debugging With GDB - The GNU Source-Level Debugger
http://slidepdf.com/reader/full/debugging-with-gdb-the-gnu-source-level-debugger 257/328
246 Debugging with GDB
8/14/2019 Debugging With GDB - The GNU Source-Level Debugger
http://slidepdf.com/reader/full/debugging-with-gdb-the-gnu-source-level-debugger 258/328
Chapter 24: Reporting Bugs in GDB 247
24 Reporting Bugs in GDB
Your bug reports play an essential role in making GDB reliable.
Reporting a bug may help you by bringing a solution to your problem, or it may not.But in any case the principal function of a bug report is to help the entire community bymaking the next version of GDB work better. Bug reports are your contribution to themaintenance of GDB.
In order for a bug report to serve its purpose, you must include the information thatenables us to fix the bug.
24.1 Have you found a bug?
If you are not sure whether you have found a bug, here are some guidelines:
• If the debugger gets a fatal signal, for any input whatever, that is a GDB bug. Reliabledebuggers never crash.
• If GDB produces an error message for valid input, that is a bug. (Note that if you’recross debugging, the problem may also be somewhere in the connection to the target.)
• If GDB does not produce an error message for invalid input, that is a bug. However,you should note that your idea of “invalid input” might be our idea of “an extension”or “support for traditional practice”.
• If you are an experienced user of debugging tools, your suggestions for improvement of GDB are welcome in any case.
24.2 How to report bugs
A number of companies and individuals offer support for gnu products. If you obtainedGDB from a support organization, we recommend you contact that organization first.
You can find contact information for many support companies and individuals in the file‘etc/SERVICE’ in the gnu Emacs distribution.
In any event, we also recommend that you submit bug reports for GDB. The preferedmethod is to submit them directly using GDB’s Bugs web page. Alternatively, the e-mailgateway can be used.
Do not send bug reports to ‘info-gdb’, or to ‘help-gdb’, or to any newsgroups. Mostusers of GDB do not want to receive bug reports. Those that do have arranged to receive‘bug-gdb’.
The mailing list ‘bug-gdb’ has a newsgroup ‘gnu.gdb.bug’ which serves as a repeater.The mailing list and the newsgroup carry exactly the same messages. Often people think of posting bug reports to the newsgroup instead of mailing them. This appears to work, but
it has one problem which can be crucial: a newsgroup posting often lacks a mail path backto the sender. Thus, if we need to ask for more information, we may be unable to reachyou. For this reason, it is better to send bug reports to the mailing list.
The fundamental principle of reporting bugs usefully is this: report all the facts. If youare not sure whether to state a fact or leave it out, state it!
8/14/2019 Debugging With GDB - The GNU Source-Level Debugger
http://slidepdf.com/reader/full/debugging-with-gdb-the-gnu-source-level-debugger 259/328
248 Debugging with GDB
Often people omit facts because they think they know what causes the problem andassume that some details do not matter. Thus, you might assume that the name of thevariable you use in an example does not matter. Well, probably it does not, but one cannot
be sure. Perhaps the bug is a stray memory reference which happens to fetch from thelocation where that name is stored in memory; perhaps, if the name were different, thecontents of that location would fool the debugger into doing the right thing despite the bug.Play it safe and give a specific, complete example. That is the easiest thing for you to do,and the most helpful.
Keep in mind that the purpose of a bug report is to enable us to fix the bug. It maybe that the bug has been reported previously, but neither you nor we can know that unlessyour bug report is complete and self-contained.
Sometimes people give a few sketchy facts and ask, “Does this ring a bell?” Those bug
reports are useless, and we urge everyone to refuse to respond to them except to chide thesender to report bugs properly.
To enable us to fix the bug, you should include all these things:
• The version of GDB. GDB announces it if you start with no arguments; you can alsoprint it at any time using show version.
Without this, we will not know whether there is any point in looking for the bug in thecurrent version of GDB.
• The type of machine you are using, and the operating system name and version number.
• What compiler (and its version) was used to compile GDB—e.g. “gcc–2.8.1”.• What compiler (and its version) was used to compile the program you are debugging—
e.g. “gcc–2.8.1”, or “HP92453-01 A.10.32.03 HP C Compiler”. For GCC, you can saygcc --version to get this information; for other compilers, see the documentation forthose compilers.
• The command arguments you gave the compiler to compile your example and observethe bug. For example, did you use ‘-O’? To guarantee you will not omit somethingimportant, list them all. A copy of the Makefile (or the output from make) is sufficient.
If we were to try to guess the arguments, we would probably guess wrong and then we
might not encounter the bug.• A complete input script, and all necessary source files, that will reproduce the bug.
• A description of what behavior you observe that you believe is incorrect. For example,“It gets a fatal signal.”
Of course, if the bug is that GDB gets a fatal signal, then we will certainly notice it.But if the bug is incorrect output, we might not notice unless it is glaringly wrong.You might as well not give us a chance to make a mistake.
Even if the problem you experience is a fatal signal, you should still say so explicitly.Suppose something strange is going on, such as, your copy of GDB is out of synch, or
you have encountered a bug in the C library on your system. (This has happened!)Your copy might crash and ours would not. If you told us to expect a crash, then whenours fails to crash, we would know that the bug was not happening for us. If you hadnot told us to expect a crash, then we would not be able to draw any conclusion fromour observations.
8/14/2019 Debugging With GDB - The GNU Source-Level Debugger
http://slidepdf.com/reader/full/debugging-with-gdb-the-gnu-source-level-debugger 260/328
Chapter 24: Reporting Bugs in GDB 249
• If you wish to suggest changes to the GDB source, send us context diffs. If you evendiscuss something in the GDB source, refer to it by context, not by line number.
The line numbers in our development sources will not match those in your sources.
Your line numbers would convey no useful information to us.
Here are some things that are not necessary:
• A description of the envelope of the bug.
Often people who encounter a bug spend a lot of time investigating which changes tothe input file will make the bug go away and which changes will not affect it.
This is often time consuming and not very useful, because the way we will find thebug is by running a single example under the debugger with breakpoints, not by purededuction from a series of examples. We recommend that you save your time for
something else.Of course, if you can find a simpler example to report instead of the original one, thatis a convenience for us. Errors in the output will be easier to spot, running under thedebugger will take less time, and so on.
However, simplification is not vital; if you do not want to do this, report the buganyway and send us the entire test case you used.
• A patch for the bug.
A patch for the bug does help us if it is a good one. But do not omit the necessaryinformation, such as the test case, on the assumption that a patch is all we need. We
might see problems with your patch and decide to fix the problem another way, or wemight not understand it at all.
Sometimes with a program as complicated as GDB it is very hard to construct anexample that will make the program follow a certain path through the code. If you donot send us the example, we will not be able to construct one, so we will not be ableto verify that the bug is fixed.
And if we cannot understand what bug you are trying to fix, or why your patch shouldbe an improvement, we will not install it. A test case will help us to understand.
• A guess about what the bug is or what it depends on.
Such guesses are usually wrong. Even we cannot guess right about such things withoutfirst using the debugger to find the facts.

8/14/2019 Debugging With GDB - The GNU Source-Level Debugger
http://slidepdf.com/reader/full/debugging-with-gdb-the-gnu-source-level-debugger 261/328
250 Debugging with GDB
8/14/2019 Debugging With GDB - The GNU Source-Level Debugger
http://slidepdf.com/reader/full/debugging-with-gdb-the-gnu-source-level-debugger 262/328
Chapter 25: Command Line Editing 251
25 Command Line Editing
This chapter describes the basic features of the gnu command line editing interface.
25.1 Introduction to Line Editing
The following paragraphs describe the notation used to represent keystrokes.
The text C-k is read as ‘Control-K’ and describes the character produced when the k
key is pressed while the Control key is depressed.
The text M-k is read as ‘Meta-K’ and describes the character produced when the Metakey (if you have one) is depressed, and the k key is pressed. The Meta key is labeled ALT
on many keyboards. On keyboards with two keys labeled ALT (usually to either side of the
space bar), the ALT on the left side is generally set to work as a Meta key. The ALT keyon the right may also be configured to work as a Meta key or may be configured as someother modifier, such as a Compose key for typing accented characters.
If you do not have a Meta or ALT key, or another key working as a Meta key, the identicalkeystroke can be generated by typing ESC first , and then typing k. Either process is knownas metafying the k key.
The text M-C-k is read as ‘Meta-Control-k’ and describes the character produced bymetafying C-k.
In addition, several keys have their own names. Specifically, DEL, ESC, LFD, SPC,RET, and TAB all stand for themselves when seen in this text, or in an init file (seeSection 25.3 [Readline Init File], page 254). If your keyboard lacks a LFD key, typing C-j
will produce the desired character. The RET key may be labeled Return or Enter on somekeyboards.
25.2 Readline Interaction
Often during an interactive session you type in a long line of text, only to notice that thefirst word on the line is misspelled. The Readline library gives you a set of commands for
manipulating the text as you type it in, allowing you to just fix your typo, and not forcingyou to retype the majority of the line. Using these editing commands, you move the cursorto the place that needs correction, and delete or insert the text of the corrections. Then,when you are satisfied with the line, you simply press RETURN. You do not have to be atthe end of the line to press RETURN; the entire line is accepted regardless of the locationof the cursor within the line.
25.2.1 Readline Bare Essentials
In order to enter characters into the line, simply type them. The typed character appears
where the cursor was, and then the cursor moves one space to the right. If you mistype acharacter, you can use your erase character to back up and delete the mistyped character.
Sometimes you may mistype a character, and not notice the error until you have typedseveral other characters. In that case, you can type C-b to move the cursor to the left, andthen correct your mistake. Afterwards, you can move the cursor to the right with C-f .

8/14/2019 Debugging With GDB - The GNU Source-Level Debugger
http://slidepdf.com/reader/full/debugging-with-gdb-the-gnu-source-level-debugger 263/328
252 Debugging with GDB
When you add text in the middle of a line, you will notice that characters to the rightof the cursor are ‘pushed over’ to make room for the text that you have inserted. Likewise,when you delete text behind the cursor, characters to the right of the cursor are ‘pulled
back’ to fill in the blank space created by the removal of the text. A list of the bare essentialsfor editing the text of an input line follows.
C-b Move back one character.
C-f Move forward one character.
DEL or Backspace
Delete the character to the left of the cursor.
C-d Delete the character underneath the cursor.
Printing charactersInsert the character into the line at the cursor.
C- or C-x C-u
Undo the last editing command. You can undo all the way back to an emptyline.
(Depending on your configuration, the Backspace key be set to delete the character to theleft of the cursor and the DEL key set to delete the character underneath the cursor, likeC-d, rather than the character to the left of the cursor.)
25.2.2 Readline Movement CommandsThe above table describes the most basic keystrokes that you need in order to do editing
of the input line. For your convenience, many other commands have been added in additionto C-b, C-f , C-d, and DEL. Here are some commands for moving more rapidly about theline.
C-a Move to the start of the line.
C-e Move to the end of the line.
M-f Move forward a word, where a word is composed of letters and digits.
M-b Move backward a word.
C-l Clear the screen, reprinting the current line at the top.
Notice how C-f moves forward a character, while M-f moves forward a word. It is a looseconvention that control keystrokes operate on characters while meta keystrokes operate onwords.
25.2.3 Readline Killing Commands
Killing text means to delete the text from the line, but to save it away for later use,usually by yanking (re-inserting) it back into the line. (‘Cut’ and ‘paste’ are more recent jargon for ‘kill’ and ‘yank’.)
If the description for a command says that it ‘kills’ text, then you can be sure that youcan get the text back in a different (or the same) place later.

8/14/2019 Debugging With GDB - The GNU Source-Level Debugger
http://slidepdf.com/reader/full/debugging-with-gdb-the-gnu-source-level-debugger 264/328
Chapter 25: Command Line Editing 253
When you use a kill command, the text is saved in a kill-ring . Any number of consecutivekills save all of the killed text together, so that when you yank it back, you get it all. Thekill ring is not line specific; the text that you killed on a previously typed line is available
to be yanked back later, when you are typing another line.Here is the list of commands for killing text.
C-k Kill the text from the current cursor position to the end of the line.
M-d Kill from the cursor to the end of the current word, or, if between words, to theend of the next word. Word boundaries are the same as those used by M-f .
M-DEL Kill from the cursor the start of the previous word, or, if between words, tothe start of the previous word. Word boundaries are the same as those used byM-b.
C-w Kill from the cursor to the previous whitespace. This is different than M-DELbecause the word boundaries differ.
Here is how to yank the text back into the line. Yanking means to copy the most-recently-killed text from the kill buffer.
C-y Yank the most recently killed text back into the buffer at the cursor.
M-y Rotate the kill-ring, and yank the new top. You can only do this if the priorcommand is C-y or M-y.
25.2.4 Readline ArgumentsYou can pass numeric arguments to Readline commands. Sometimes the argument acts
as a repeat count, other times it is the sign of the argument that is significant. If youpass a negative argument to a command which normally acts in a forward direction, thatcommand will act in a backward direction. For example, to kill text back to the start of the line, you might type ‘M-- C-k’.
The general way to pass numeric arguments to a command is to type meta digits beforethe command. If the first ‘digit’ typed is a minus sign (‘-’), then the sign of the argumentwill be negative. Once you have typed one meta digit to get the argument started, you can
type the remainder of the digits, and then the command. For example, to give the C-dcommand an argument of 10, you could type ‘M-1 0 C-d’.
25.2.5 Searching for Commands in the History
Readline provides commands for searching through the command history for lines con-taining a specified string. There are two search modes: incremental and non-incremental .
Incremental searches begin before the user has finished typing the search string. As eachcharacter of the search string is typed, Readline displays the next entry from the historymatching the string typed so far. An incremental search requires only as many characters as
needed to find the desired history entry. To search backward in the history for a particularstring, type C-r. Typing C-s searches forward through the history. The characters presentin the value of the isearch-terminators variable are used to terminate an incrementalsearch. If that variable has not been assigned a value, the ESC and C-J characters willterminate an incremental search. C-g will abort an incremental search and restore the

8/14/2019 Debugging With GDB - The GNU Source-Level Debugger
http://slidepdf.com/reader/full/debugging-with-gdb-the-gnu-source-level-debugger 265/328
254 Debugging with GDB
original line. When the search is terminated, the history entry containing the search stringbecomes the current line.
To find other matching entries in the history list, type C-r or C-s as appropriate. This
will search backward or forward in the history for the next entry matching the search stringtyped so far. Any other key sequence bound to a Readline command will terminate thesearch and execute that command. For instance, a RET will terminate the search andaccept the line, thereby executing the command from the history list.
Non-incremental searches read the entire search string before starting to search formatching history lines. The search string may be typed by the user or be part of thecontents of the current line.
25.3 Readline Init File
Although the Readline library comes with a set of Emacs-like keybindings installedby default, it is possible to use a different set of keybindings. Any user can customizeprograms that use Readline by putting commands in an inputrc file, conventionally in hishome directory. The name of this file is taken from the value of the environment variableINPUTRC. If that variable is unset, the default is ‘~/.inputrc’.
When a program which uses the Readline library starts up, the init file is read, and thekey bindings are set.
In addition, the C-x C-r command re-reads this init file, thus incorporating any changes
that you might have made to it.
25.3.1 Readline Init File Syntax
There are only a few basic constructs allowed in the Readline init file. Blank lines areignored. Lines beginning with a ‘#’ are comments. Lines beginning with a ‘$’ indicateconditional constructs (see Section 25.3.2 [Conditional Init Constructs], page 258). Otherlines denote variable settings and key bindings.
Variable Settings
You can modify the run-time behavior of Readline by altering the values of variables in Readline using the set command within the init file. Here is how tochange from the default Emacs-like key binding to use vi line editing commands:
set editing-mode vi
A great deal of run-time behavior is changeable with the following variables.
bell-style
Controls what happens when Readline wants to ring the termi-nal bell. If set to ‘none’, Readline never rings the bell. If set to‘visible’, Readline uses a visible bell if one is available. If set to
‘audible’ (the default), Readline attempts to ring the terminal’sbell.
comment-begin
The string to insert at the beginning of the line when the insert-
comment command is executed. The default value is "#".
8/14/2019 Debugging With GDB - The GNU Source-Level Debugger
http://slidepdf.com/reader/full/debugging-with-gdb-the-gnu-source-level-debugger 266/328
Chapter 25: Command Line Editing 255
completion-ignore-case
If set to ‘on’, Readline performs filename matching and completionin a case-insensitive fashion. The default value is ‘off’.
completion-query-itemsThe number of possible completions that determines when the useris asked whether he wants to see the list of possibilities. If thenumber of possible completions is greater than this value, Readlinewill ask the user whether or not he wishes to view them; otherwise,they are simply listed. The default limit is 100.
convert-meta
If set to ‘on’, Readline will convert characters with the eighth bitset to an ASCII key sequence by stripping the eighth bit and pre-
fixing an ESC character, converting them to a meta-prefixed keysequence. The default value is ‘on’.
disable-completion
If set to ‘On’, Readline will inhibit word completion. Completioncharacters will be inserted into the line as if they had been mappedto self-insert. The default is ‘off’.
editing-mode
The editing-mode variable controls which default set of key bind-ings is used. By default, Readline starts up in Emacs editing mode,
where the keystrokes are most similar to Emacs. This variable canbe set to either ‘emacs’ or ‘vi’.
enable-keypad
When set to ‘on’, Readline will try to enable the application keypadwhen it is called. Some systems need this to enable the arrow keys.The default is ‘off’.
expand-tilde
If set to ‘on’, tilde expansion is performed when Readline attemptsword completion. The default is ‘off’.
horizontal-scroll-modeThis variable can be set to either ‘on’ or ‘off’. Setting it to ‘on’means that the text of the lines being edited will scroll horizontallyon a single screen line when they are longer than the width of thescreen, instead of wrapping onto a new screen line. By default, thisvariable is set to ‘off’.
input-meta
If set to ‘on’, Readline will enable eight-bit input (it will not stripthe eighth bit from the characters it reads), regardless of what the
terminal claims it can support. The default value is ‘off’. Thename meta-flag is a synonym for this variable.
isearch-terminators
The string of characters that should terminate an incrementalsearch without subsequently executing the character as a command

8/14/2019 Debugging With GDB - The GNU Source-Level Debugger
http://slidepdf.com/reader/full/debugging-with-gdb-the-gnu-source-level-debugger 267/328
256 Debugging with GDB
(see Section 25.2.5 [Searching], page 253). If this variable has notbeen given a value, the characters ESC and C-J will terminate anincremental search.
keymap Sets Readline’s idea of the current keymap for key binding com-mands. Acceptable keymap names are emacs, emacs-standard,emacs-meta, emacs-ctlx, vi, vi-command, and vi-insert. vi isequivalent to vi-command; emacs is equivalent to emacs-standard.The default value is emacs. The value of the editing-mode variablealso affects the default keymap.
mark-directories
If set to ‘on’, completed directory names have a slash appended.The default is ‘on’.
mark-modified-lines
This variable, when set to ‘on’, causes Readline to display an as-terisk (‘*’) at the start of history lines which have been modified.This variable is ‘off’ by default.
output-meta
If set to ‘on’, Readline will display characters with the eighth bitset directly rather than as a meta-prefixed escape sequence. Thedefault is ‘off’.
print-completions-horizontallyIf set to ‘on’, Readline will display completions with matches sortedhorizontally in alphabetical order, rather than down the screen.The default is ‘off’.
show-all-if-ambiguous
This alters the default behavior of the completion functions. If setto ‘on’, words which have more than one possible completion causethe matches to be listed immediately instead of ringing the bell.The default value is ‘off’.
visible-statsIf set to ‘on’, a character denoting a file’s type is appended to thefilename when listing possible completions. The default is ‘off’.
Key BindingsThe syntax for controlling key bindings in the init file is simple. First youneed to find the name of the command that you want to change. The followingsections contain tables of the command name, the default keybinding, if any,and a short description of what the command does.
Once you know the name of the command, simply place the name of the key
you wish to bind the command to, a colon, and then the name of the commandon a line in the init file. The name of the key can be expressed in differentways, depending on which is most comfortable for you.
keyname : function-name or macro keyname is the name of a key spelled out in English. For example:

8/14/2019 Debugging With GDB - The GNU Source-Level Debugger
http://slidepdf.com/reader/full/debugging-with-gdb-the-gnu-source-level-debugger 268/328
Chapter 25: Command Line Editing 257
Control-u: universal-argumentMeta-Rubout: backward-kill-wordControl-o: "> output"
In the above example, C-u is bound to the function universal-argument, and C-o is bound to run the macro expressed on theright hand side (that is, to insert the text ‘> output’ into the line).
"keyseq": function-name or macro keyseq differs from keyname above in that strings denoting an en-tire key sequence can be specified, by placing the key sequence indouble quotes. Some gnu Emacs style key escapes can be used, asin the following example, but the special character names are notrecognized.
"\C-u": universal-argument"\C-x\C-r": re-read-init-file"\e[11~": "Function Key 1"
In the above example, C-u is bound to the function universal-
argument (just as it was in the first example), ‘C-x C-r’ is bound tothe function re-read-init-file, and ‘ESC [ 1 1 ~’ is boundto insert the text ‘Function Key 1’.
The following gnu Emacs style escape sequences are available when specifyingkey sequences:
\C- control prefix
\M- meta prefix
\e an escape character
\\ backslash
\" ", a double quotation mark
\’ ’, a single quote or apostrophe
In addition to the gnu Emacs style escape sequences, a second set of backslash
escapes is available:
\a alert (bell)
\b backspace
\d delete
\f form feed
\n newline
\r carriage return
\t horizontal tab
\v vertical tab
\nnn the character whose ASCII code is the octal value nnn (one to threedigits)

8/14/2019 Debugging With GDB - The GNU Source-Level Debugger
http://slidepdf.com/reader/full/debugging-with-gdb-the-gnu-source-level-debugger 269/328
258 Debugging with GDB
\xnnn the character whose ASCII code is the hexadecimal value nnn (oneto three digits)
When entering the text of a macro, single or double quotes must be used to
indicate a macro definition. Unquoted text is assumed to be a function name. Inthe macro body, the backslash escapes described above are expanded. Backslashwill quote any other character in the macro text, including ‘"’ and ‘’’. Forexample, the following binding will make ‘C-x \’ insert a single ‘\’ into the line:
"\C-x\\": "\\"
25.3.2 Conditional Init Constructs
Readline implements a facility similar in spirit to the conditional compilation featuresof the C preprocessor which allows key bindings and variable settings to be performed asthe result of tests. There are four parser directives used.
$if The $if construct allows bindings to be made based on the editing mode, theterminal being used, or the application using Readline. The text of the testextends to the end of the line; no characters are required to isolate it.
mode The mode= form of the $if directive is used to test whether Readlineis in emacs or vi mode. This may be used in conjunction with the‘set keymap’ command, for instance, to set bindings in the emacs-
standard and emacs-ctlx keymaps only if Readline is starting outin emacs mode.
term The term= form may be used to include terminal-specific key bind-ings, perhaps to bind the key sequences output by the terminal’sfunction keys. The word on the right side of the ‘=’ is tested againstboth the full name of the terminal and the portion of the terminalname before the first ‘-’. This allows sun to match both sun andsun-cmd, for instance.
application
The application construct is used to include application-specific set-
tings. Each program using the Readline library sets the applicationname , and you can test for it. This could be used to bind key se-quences to functions useful for a specific program. For instance, thefollowing command adds a key sequence that quotes the current orprevious word in Bash:
$if Bash# Quote the current or previous word"\C-xq": "\eb\"\ef\""$endif
$endif This command, as seen in the previous example, terminates an $if command.
$else Commands in this branch of the $if directive are executed if the test fails.
$include This directive takes a single filename as an argument and reads commands andbindings from that file.
$include /etc/inputrc

8/14/2019 Debugging With GDB - The GNU Source-Level Debugger
http://slidepdf.com/reader/full/debugging-with-gdb-the-gnu-source-level-debugger 270/328
Chapter 25: Command Line Editing 259
25.3.3 Sample Init File
Here is an example of an inputrc file. This illustrates key binding, variable assignment,
and conditional syntax.
8/14/2019 Debugging With GDB - The GNU Source-Level Debugger
http://slidepdf.com/reader/full/debugging-with-gdb-the-gnu-source-level-debugger 271/328
260 Debugging with GDB
# This file controls the behaviour of line input editing for# programs that use the Gnu Readline library. Existing programs
# include FTP, Bash, and Gdb.## You can re-read the inputrc file with C-x C-r.# Lines beginning with ’#’ are comments.## First, include any systemwide bindings and variable assignments from# /etc/Inputrc$include /etc/Inputrc
## Set various bindings for emacs mode.
set editing-mode emacs
$if mode=emacs
Meta-Control-h: backward-kill-word Text after the function name is ignored
## Arrow keys in keypad mode##"\M-OD": backward-char#"\M-OC": forward-char#"\M-OA": previous-history#"\M-OB": next-history## Arrow keys in ANSI mode#"\M-[D": backward-char"\M-[C": forward-char"\M-[A": previous-history
"\M-[B": next-history## Arrow keys in 8 bit keypad mode##"\M-\C-OD": backward-char#"\M-\C-OC": forward-char#"\M-\C-OA": previous-history#"\M-\C-OB": next-history## Arrow keys in 8 bit ANSI mode
##"\M-\C-[D": backward-char#"\M-\C-[C": forward-char#"\M-\C-[A": previous-history#"\M-\C-[B": next-history
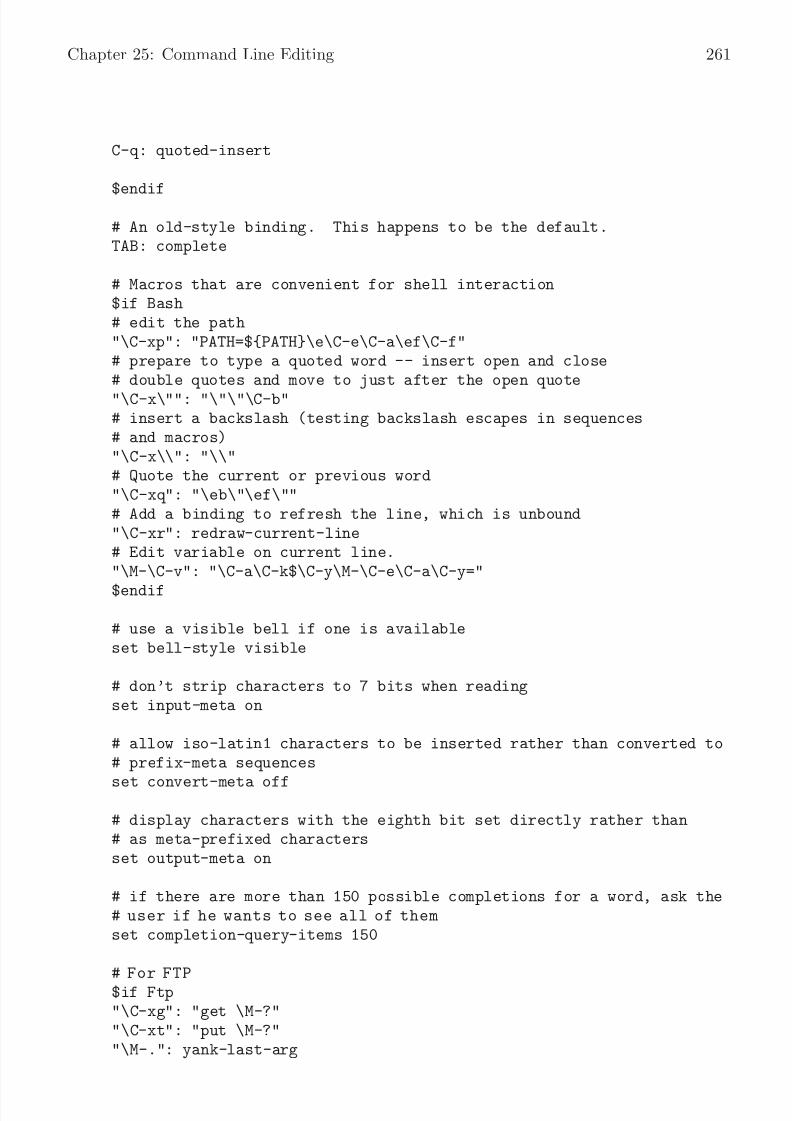
8/14/2019 Debugging With GDB - The GNU Source-Level Debugger
http://slidepdf.com/reader/full/debugging-with-gdb-the-gnu-source-level-debugger 272/328
Chapter 25: Command Line Editing 261
C-q: quoted-insert
$endif
# An old-style binding. This happens to be the default.TAB: complete
# Macros that are convenient for shell interaction$if Bash# edit the path"\C-xp": "PATH=${PATH}\e\C-e\C-a\ef\C-f"# prepare to type a quoted word -- insert open and close# double quotes and move to just after the open quote"\C-x\"": "\"\"\C-b"# insert a backslash (testing backslash escapes in sequences# and macros)"\C-x\\": "\\"# Quote the current or previous word"\C-xq": "\eb\"\ef\""# Add a binding to refresh the line, which is unbound"\C-xr": redraw-current-line# Edit variable on current line."\M-\C-v": "\C-a\C-k$\C-y\M-\C-e\C-a\C-y="$endif
# use a visible bell if one is availableset bell-style visible
# don’t strip characters to 7 bits when readingset input-meta on
# allow iso-latin1 characters to be inserted rather than converted to# prefix-meta sequences
set convert-meta off
# display characters with the eighth bit set directly rather than# as meta-prefixed charactersset output-meta on
# if there are more than 150 possible completions for a word, ask the# user if he wants to see all of themset completion-query-items 150
# For FTP$if Ftp"\C-xg": "get \M-?""\C-xt": "put \M-?""\M-.": yank-last-arg
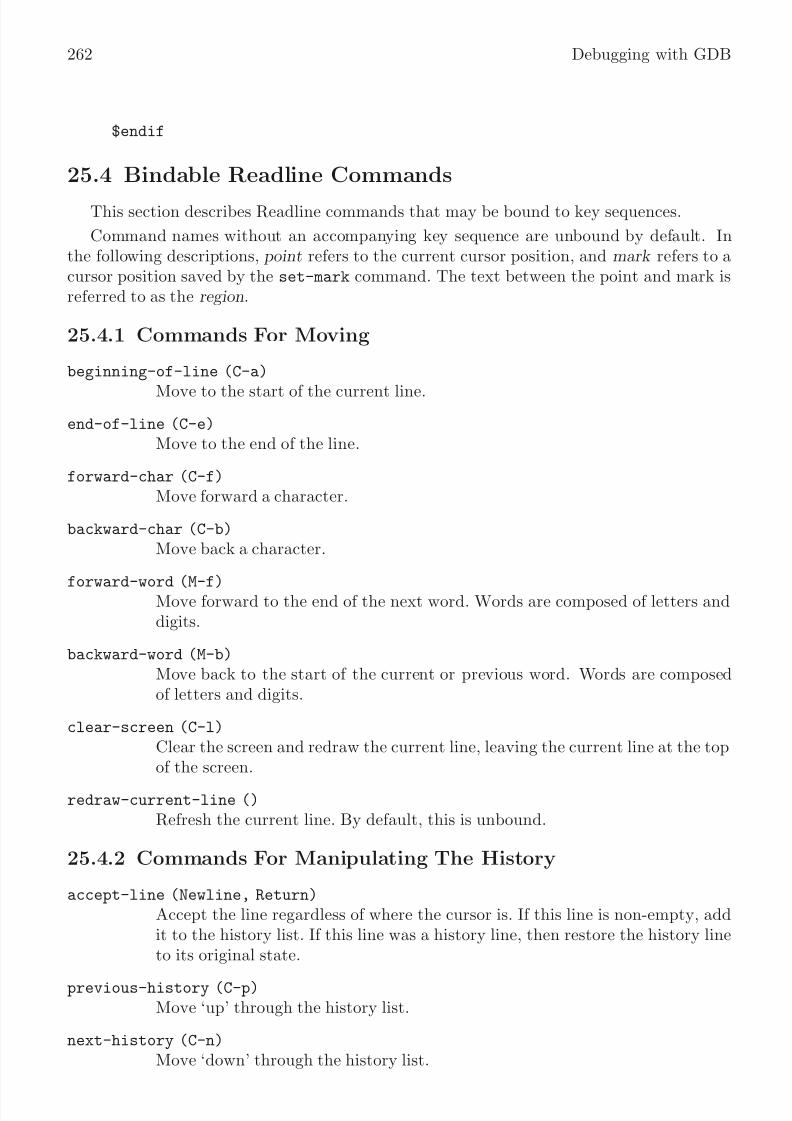
8/14/2019 Debugging With GDB - The GNU Source-Level Debugger
http://slidepdf.com/reader/full/debugging-with-gdb-the-gnu-source-level-debugger 273/328
262 Debugging with GDB
$endif
25.4 Bindable Readline Commands
This section describes Readline commands that may be bound to key sequences.
Command names without an accompanying key sequence are unbound by default. Inthe following descriptions, point refers to the current cursor position, and mark refers to acursor position saved by the set-mark command. The text between the point and mark isreferred to as the region.
25.4.1 Commands For Moving
beginning-of-line (C-a)
Move to the start of the current line.
end-of-line (C-e)
Move to the end of the line.
forward-char (C-f)
Move forward a character.
backward-char (C-b)
Move back a character.
forward-word (M-f)Move forward to the end of the next word. Words are composed of letters anddigits.
backward-word (M-b)
Move back to the start of the current or previous word. Words are composedof letters and digits.
clear-screen (C-l)
Clear the screen and redraw the current line, leaving the current line at the topof the screen.
redraw-current-line ()
Refresh the current line. By default, this is unbound.
25.4.2 Commands For Manipulating The History
accept-line (Newline, Return)
Accept the line regardless of where the cursor is. If this line is non-empty, addit to the history list. If this line was a history line, then restore the history lineto its original state.
previous-history (C-p)
Move ‘up’ through the history list.
next-history (C-n)
Move ‘down’ through the history list.

8/14/2019 Debugging With GDB - The GNU Source-Level Debugger
http://slidepdf.com/reader/full/debugging-with-gdb-the-gnu-source-level-debugger 274/328
Chapter 25: Command Line Editing 263
beginning-of-history (M-<)
Move to the first line in the history.
end-of-history (M->)
Move to the end of the input history, i.e., the line currently being entered.
reverse-search-history (C-r)
Search backward starting at the current line and moving ‘up’ through the his-tory as necessary. This is an incremental search.
forward-search-history (C-s)
Search forward starting at the current line and moving ‘down’ through the thehistory as necessary. This is an incremental search.
non-incremental-reverse-search-history (M-p)
Search backward starting at the current line and moving ‘up’ through the his-tory as necessary using a non-incremental search for a string supplied by theuser.
non-incremental-forward-search-history (M-n)
Search forward starting at the current line and moving ‘down’ through the thehistory as necessary using a non-incremental search for a string supplied by theuser.
history-search-forward ()
Search forward through the history for the string of characters between thestart of the current line and the point. This is a non-incremental search. Bydefault, this command is unbound.
history-search-backward ()
Search backward through the history for the string of characters between thestart of the current line and the point. This is a non-incremental search. Bydefault, this command is unbound.
yank-nth-arg (M-C-y)
Insert the first argument to the previous command (usually the second word on
the previous line). With an argument n, insert the nth word from the previouscommand (the words in the previous command begin with word 0). A negativeargument inserts the nth word from the end of the previous command.
yank-last-arg (M-., M-_)
Insert last argument to the previous command (the last word of the previoushistory entry). With an argument, behave exactly like yank-nth-arg. Succes-sive calls to yank-last-arg move back through the history list, inserting thelast argument of each line in turn.
25.4.3 Commands For Changing Textdelete-char (C-d)
Delete the character under the cursor. If the cursor is at the beginning of theline, there are no characters in the line, and the last character typed was notbound to delete-char, then return EOF.

8/14/2019 Debugging With GDB - The GNU Source-Level Debugger
http://slidepdf.com/reader/full/debugging-with-gdb-the-gnu-source-level-debugger 275/328
264 Debugging with GDB
backward-delete-char (Rubout)
Delete the character behind the cursor. A numeric argument means to kill thecharacters instead of deleting them.
forward-backward-delete-char ()
Delete the character under the cursor, unless the cursor is at the end of theline, in which case the character behind the cursor is deleted. By default, thisis not bound to a key.
quoted-insert (C-q, C-v)
Add the next character typed to the line verbatim. This is how to insert keysequences like C-q, for example.
tab-insert (M-TAB)
Insert a tab character.
self-insert (a, b, A, 1, !, ...)
Insert yourself.
transpose-chars (C-t)
Drag the character before the cursor forward over the character at the cursor,moving the cursor forward as well. If the insertion point is at the end of theline, then this transposes the last two characters of the line. Negative argumentshave no effect.
transpose-words (M-t)
Drag the word before point past the word after point, moving point past thatword as well.
upcase-word (M-u)
Uppercase the current (or following) word. With a negative argument, upper-case the previous word, but do not move the cursor.
downcase-word (M-l)
Lowercase the current (or following) word. With a negative argument, lowercase
the previous word, but do not move the cursor.
capitalize-word (M-c)
Capitalize the current (or following) word. With a negative argument, capitalizethe previous word, but do not move the cursor.
25.4.4 Killing And Yanking
kill-line (C-k)
Kill the text from point to the end of the line.
backward-kill-line (C-x Rubout)
Kill backward to the beginning of the line.
unix-line-discard (C-u)
Kill backward from the cursor to the beginning of the current line.

8/14/2019 Debugging With GDB - The GNU Source-Level Debugger
http://slidepdf.com/reader/full/debugging-with-gdb-the-gnu-source-level-debugger 276/328
Chapter 25: Command Line Editing 265
kill-whole-line ()
Kill all characters on the current line, no matter point is. By default, this isunbound.
kill-word (M-d)
Kill from point to the end of the current word, or if between words, to the endof the next word. Word boundaries are the same as forward-word.
backward-kill-word (M-DEL)
Kill the word behind point. Word boundaries are the same as backward-word.
unix-word-rubout (C-w)
Kill the word behind point, using white space as a word boundary. The killedtext is saved on the kill-ring.
delete-horizontal-space ()
Delete all spaces and tabs around point. By default, this is unbound.
kill-region ()
Kill the text in the current region. By default, this command is unbound.
copy-region-as-kill ()
Copy the text in the region to the kill buffer, so it can be yanked right away.By default, this command is unbound.
copy-backward-word ()Copy the word before point to the kill buffer. The word boundaries are thesame as backward-word. By default, this command is unbound.
copy-forward-word ()
Copy the word following point to the kill buffer. The word boundaries are thesame as forward-word. By default, this command is unbound.
yank (C-y)
Yank the top of the kill ring into the buffer at the current cursor position.
yank-pop (M-y)
Rotate the kill-ring, and yank the new top. You can only do this if the priorcommand is yank or yank-pop.
25.4.5 Specifying Numeric Arguments
digit-argument (M-0, M-1, ... M--)
Add this digit to the argument already accumulating, or start a new argument.M– starts a negative argument.
universal-argument ()
This is another way to specify an argument. If this command is followed by oneor more digits, optionally with a leading minus sign, those digits define the ar-gument. If the command is followed by digits, executing universal-argument
again ends the numeric argument, but is otherwise ignored. As a special case,
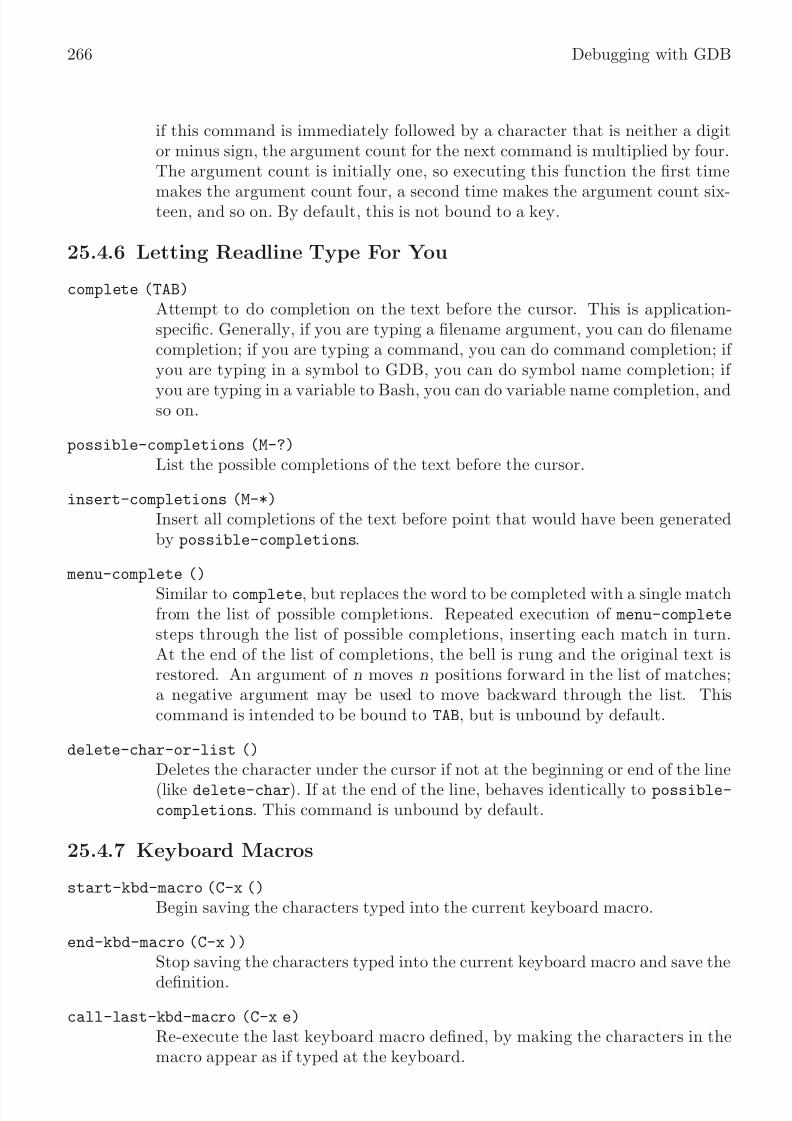
8/14/2019 Debugging With GDB - The GNU Source-Level Debugger
http://slidepdf.com/reader/full/debugging-with-gdb-the-gnu-source-level-debugger 277/328
266 Debugging with GDB
if this command is immediately followed by a character that is neither a digitor minus sign, the argument count for the next command is multiplied by four.The argument count is initially one, so executing this function the first time
makes the argument count four, a second time makes the argument count six-teen, and so on. By default, this is not bound to a key.
25.4.6 Letting Readline Type For You
complete (TAB)
Attempt to do completion on the text before the cursor. This is application-specific. Generally, if you are typing a filename argument, you can do filenamecompletion; if you are typing a command, you can do command completion; if you are typing in a symbol to GDB, you can do symbol name completion; if
you are typing in a variable to Bash, you can do variable name completion, andso on.
possible-completions (M-?)
List the possible completions of the text before the cursor.
insert-completions (M-*)
Insert all completions of the text before point that would have been generatedby possible-completions.
menu-complete ()
Similar to complete, but replaces the word to be completed with a single matchfrom the list of possible completions. Repeated execution of menu-complete
steps through the list of possible completions, inserting each match in turn.At the end of the list of completions, the bell is rung and the original text isrestored. An argument of n moves n positions forward in the list of matches;a negative argument may be used to move backward through the list. Thiscommand is intended to be bound to TAB, but is unbound by default.
delete-char-or-list ()
Deletes the character under the cursor if not at the beginning or end of the line(like delete-char). If at the end of the line, behaves identically to possible-
completions. This command is unbound by default.
25.4.7 Keyboard Macros
start-kbd-macro (C-x ()
Begin saving the characters typed into the current keyboard macro.
end-kbd-macro (C-x ))
Stop saving the characters typed into the current keyboard macro and save thedefinition.
call-last-kbd-macro (C-x e)
Re-execute the last keyboard macro defined, by making the characters in themacro appear as if typed at the keyboard.

8/14/2019 Debugging With GDB - The GNU Source-Level Debugger
http://slidepdf.com/reader/full/debugging-with-gdb-the-gnu-source-level-debugger 278/328
Chapter 25: Command Line Editing 267
25.4.8 Some Miscellaneous Commands
re-read-init-file (C-x C-r)
Read in the contents of the inputrc file, and incorporate any bindings or variableassignments found there.
abort (C-g)
Abort the current editing command and ring the terminal’s bell (subject to thesetting of bell-style).
do-uppercase-version (M-a, M-b, M-x , ...)
If the metafied character x is lowercase, run the command that is bound to thecorresponding uppercase character.
prefix-meta (ESC)Make the next character typed be metafied. This is for keyboards without ameta key. Typing ‘ESC f’ is equivalent to typing ‘M-f’.
undo (C-_, C-x C-u)
Incremental undo, separately remembered for each line.
revert-line (M-r)
Undo all changes made to this line. This is like executing the undo commandenough times to get back to the beginning.
tilde-expand (M-~)Perform tilde expansion on the current word.
set-mark (C-@)
Set the mark to the current point. If a numeric argument is supplied, the markis set to that position.
exchange-point-and-mark (C-x C-x)
Swap the point with the mark. The current cursor position is set to the savedposition, and the old cursor position is saved as the mark.
character-search (C-])A character is read and point is moved to the next occurrence of that character.A negative count searches for previous occurrences.
character-search-backward (M-C-])
A character is read and point is moved to the previous occurrence of thatcharacter. A negative count searches for subsequent occurrences.
insert-comment (M-#)
The value of the comment-begin variable is inserted at the beginning of the
current line, and the line is accepted as if a newline had been typed.dump-functions ()
Print all of the functions and their key bindings to the Readline output stream.If a numeric argument is supplied, the output is formatted in such a way thatit can be made part of an inputrc file. This command is unbound by default.
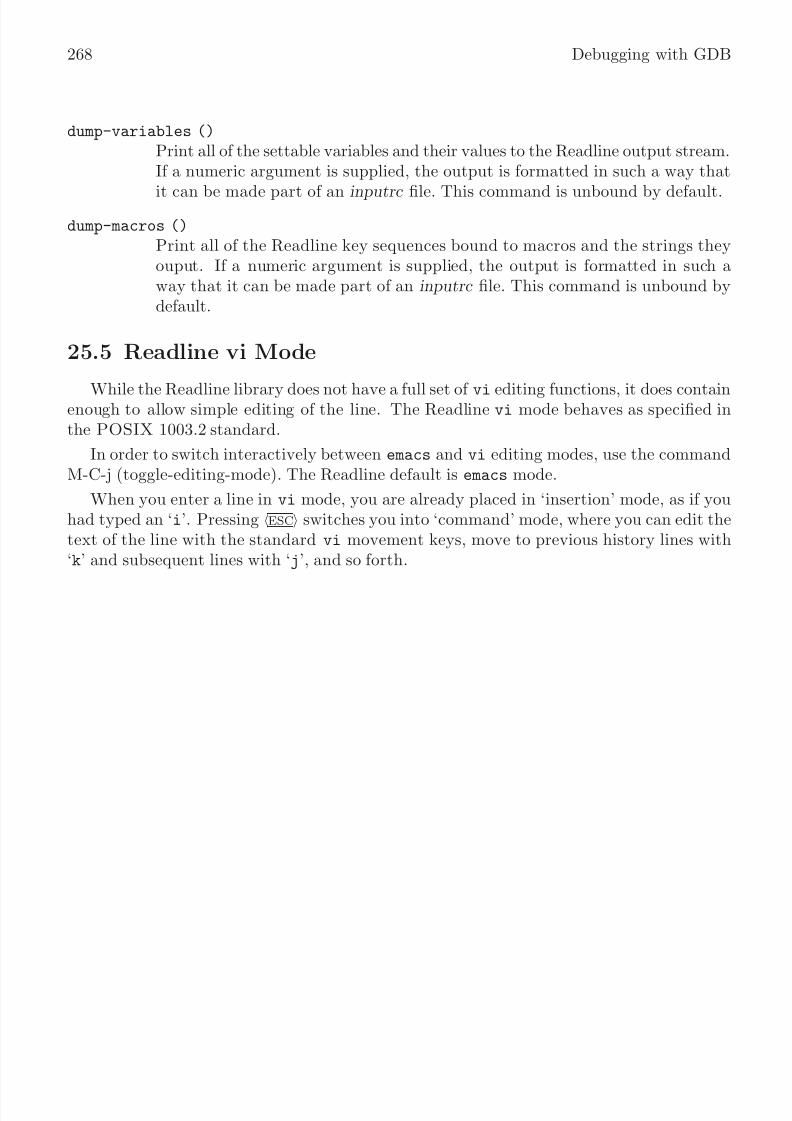
8/14/2019 Debugging With GDB - The GNU Source-Level Debugger
http://slidepdf.com/reader/full/debugging-with-gdb-the-gnu-source-level-debugger 279/328
268 Debugging with GDB
dump-variables ()
Print all of the settable variables and their values to the Readline output stream.If a numeric argument is supplied, the output is formatted in such a way that
it can be made part of an inputrc file. This command is unbound by default.
dump-macros ()
Print all of the Readline key sequences bound to macros and the strings theyouput. If a numeric argument is supplied, the output is formatted in such away that it can be made part of an inputrc file. This command is unbound bydefault.
25.5 Readline vi Mode
While the Readline library does not have a full set of vi editing functions, it does containenough to allow simple editing of the line. The Readline vi mode behaves as specified inthe POSIX 1003.2 standard.
In order to switch interactively between emacs and vi editing modes, use the commandM-C-j (toggle-editing-mode). The Readline default is emacs mode.
When you enter a line in vi mode, you are already placed in ‘insertion’ mode, as if youhad typed an ‘i’. Pressing ESC switches you into ‘command’ mode, where you can edit thetext of the line with the standard vi movement keys, move to previous history lines with‘k’ and subsequent lines with ‘j’, and so forth.

8/14/2019 Debugging With GDB - The GNU Source-Level Debugger
http://slidepdf.com/reader/full/debugging-with-gdb-the-gnu-source-level-debugger 280/328
Chapter 26: Using History Interactively 269
26 Using History Interactively
This chapter describes how to use the GNU History Library interactively, from a user’sstandpoint. It should be considered a user’s guide.
26.1 History Expansion
The History library provides a history expansion feature that is similar to the historyexpansion provided by csh. This section describes the syntax used to manipulate the historyinformation.
History expansions introduce words from the history list into the input stream, makingit easy to repeat commands, insert the arguments to a previous command into the currentinput line, or fix errors in previous commands quickly.
History expansion takes place in two parts. The first is to determine which line fromthe history list should be used during substitution. The second is to select portions of that line for inclusion into the current one. The line selected from the history is called theevent, and the portions of that line that are acted upon are called words . Various modifiers are available to manipulate the selected words. The line is broken into words in the samefashion that Bash does, so that several words surrounded by quotes are considered one word.History expansions are introduced by the appearance of the history expansion character,
which is ‘!’ by default.
26.1.1 Event Designators
An event designator is a reference to a command line entry in the history list.
! Start a history substitution, except when followed by a space, tab, the end of the line, ‘=’ or ‘(’.
!n Refer to command line n.!-n Refer to the command n lines back.
!! Refer to the previous command. This is a synonym for ‘!-1’.
!string Refer to the most recent command starting with string .
!?string [?]
Refer to the most recent command containing string . The trailing ‘?’ may beomitted if the string is followed immediately by a newline.
^string1^string2 ̂Quick Substitution. Repeat the last command, replacing string1 with string2 .Equivalent to !!:s/string1/string2 /.
!# The entire command line typed so far.

8/14/2019 Debugging With GDB - The GNU Source-Level Debugger
http://slidepdf.com/reader/full/debugging-with-gdb-the-gnu-source-level-debugger 281/328
270 Debugging with GDB
26.1.2 Word Designators
Word designators are used to select desired words from the event. A ‘:’ separates the
event specification from the word designator. It may be omitted if the word designatorbegins with a ‘^’, ‘$’, ‘*’, ‘-’, or ‘%’. Words are numbered from the beginning of the line,with the first word being denoted by 0 (zero). Words are inserted into the current lineseparated by single spaces.
For example,
!! designates the preceding command. When you type this, the preceding com-mand is repeated in toto.
!!:$ designates the last argument of the preceding command. This may be shortenedto !$.
!fi:2 designates the second argument of the most recent command starting with theletters fi.
Here are the word designators:
0 (zero) The 0th word. For many applications, this is the command word.
n The nth word.
^ The first argument; that is, word 1.
$ The last argument.
% The word matched by the most recent ‘?string ?’ search.
x - y A range of words; ‘- y ’ abbreviates ‘0- y ’.
* All of the words, except the 0th. This is a synonym for ‘1-$’. It is not an errorto use ‘*’ if there is just one word in the event; the empty string is returned inthat case.
x * Abbreviates ‘x -$’
x - Abbreviates ‘x -$’ like ‘x *’, but omits the last word.
If a word designator is supplied without an event specification, the previous commandis used as the event.
26.1.3 Modifiers
After the optional word designator, you can add a sequence of one or more of the followingmodifiers, each preceded by a ‘:’.
h Remove a trailing pathname component, leaving only the head.
t Remove all leading pathname components, leaving the tail.r Remove a trailing suffix of the form ‘.suffix ’, leaving the basename.
e Remove all but the trailing suffix.
p Print the new command but do not execute it.
8/14/2019 Debugging With GDB - The GNU Source-Level Debugger
http://slidepdf.com/reader/full/debugging-with-gdb-the-gnu-source-level-debugger 282/328
Chapter 26: Using History Interactively 271
s/old /new /Substitute new for the first occurrence of old in the event line. Any delimitermay be used in place of ‘/’. The delimiter may be quoted in old and new with a
single backslash. If ‘&’ appears in new , it is replaced by old . A single backslashwill quote the ‘&’. The final delimiter is optional if it is the last character onthe input line.
& Repeat the previous substitution.
g Cause changes to be applied over the entire event line. Used in conjunctionwith ‘s’, as in gs/old /new /, or with ‘&’.

8/14/2019 Debugging With GDB - The GNU Source-Level Debugger
http://slidepdf.com/reader/full/debugging-with-gdb-the-gnu-source-level-debugger 283/328
272 Debugging with GDB

8/14/2019 Debugging With GDB - The GNU Source-Level Debugger
http://slidepdf.com/reader/full/debugging-with-gdb-the-gnu-source-level-debugger 284/328
Appendix A: Formatting Documentation 273
Appendix A Formatting Documentation
The GDB 4 release includes an already-formatted reference card, ready for printing
with PostScript or Ghostscript, in the ‘gdb’ subdirectory of the main source directory1
. If you can use PostScript or Ghostscript with your printer, you can print the reference cardimmediately with ‘refcard.ps’.
The release also includes the source for the reference card. You can format it, usingTEX, by typing:
make refcard.dvi
The GDB reference card is designed to print in landscape mode on US “letter” sizepaper; that is, on a sheet 11 inches wide by 8.5 inches high. You will need to specify thisform of printing as an option to your dvi output program.
All the documentation for GDB comes as part of the machine-readable distribution. Thedocumentation is written in Texinfo format, which is a documentation system that uses asingle source file to produce both on-line information and a printed manual. You can useone of the Info formatting commands to create the on-line version of the documentationand TEX (or texi2roff) to typeset the printed version.
GDB includes an already formatted copy of the on-line Info version of this manual inthe ‘gdb’ subdirectory. The main Info file is ‘gdb-5.2.1/gdb/gdb.info’, and it refers tosubordinate files matching ‘gdb.info*’ in the same directory. If necessary, you can printout these files, or read them with any editor; but they are easier to read using the info
subsystem in gnu Emacs or the standalone info program, available as part of the gnuTexinfo distribution.
If you want to format these Info files yourself, you need one of the Info formattingprograms, such as texinfo-format-buffer or makeinfo.
If you have makeinfo installed, and are in the top level GDB source directory(‘gdb-5.2.1’, in the case of version 5.2.1), you can make the Info file by typing:
cd gdb make gdb.info
If you want to typeset and print copies of this manual, you need TEX, a program to print
its dvi output files, and ‘texinfo.tex’, the Texinfo definitions file.TEX is a typesetting program; it does not print files directly, but produces output files
called dvi files. To print a typeset document, you need a program to print dvi files. If yoursystem has TEX installed, chances are it has such a program. The precise command to usedepends on your system; lpr -d is common; another (for PostScript devices) is dvips. Thedvi print command may require a file name without any extension or a ‘.dvi’ extension.
TEX also requires a macro definitions file called ‘texinfo.tex’. This file tells TEX howto typeset a document written in Texinfo format. On its own, TEX cannot either reador typeset a Texinfo file. ‘texinfo.tex’ is distributed with GDB and is located in the‘gdb-version-number /texinfo’ directory.
If you have TEX and a dvi printer program installed, you can typeset and print thismanual. First switch to the the ‘gdb’ subdirectory of the main source directory (for example,to ‘gdb-5.2.1/gdb’) and type:
1 In ‘gdb-5.2.1/gdb/refcard.ps’ of the version 5.2.1 release.

8/14/2019 Debugging With GDB - The GNU Source-Level Debugger
http://slidepdf.com/reader/full/debugging-with-gdb-the-gnu-source-level-debugger 285/328
274 Debugging with GDB
make gdb.dvi
Then give ‘gdb.dvi’ to your dvi printing program.
8/14/2019 Debugging With GDB - The GNU Source-Level Debugger
http://slidepdf.com/reader/full/debugging-with-gdb-the-gnu-source-level-debugger 286/328
Appendix B: Installing GDB 275
Appendix B Installing GDB
GDB comes with a configure script that automates the process of preparing GDB for
installation; you can then use make to build the gdb program.1
The GDB distribution includes all the source code you need for GDB in a single directory,whose name is usually composed by appending the version number to ‘gdb’.
For example, the GDB version 5.2.1 distribution is in the ‘gdb-5.2.1’ directory. Thatdirectory contains:
gdb-5.2.1/configure (and supporting files)script for configuring GDB and all its supporting libraries
gdb-5.2.1/gdb
the source specific to GDB itself gdb-5.2.1/bfd
source for the Binary File Descriptor library
gdb-5.2.1/include
gnu include files
gdb-5.2.1/libiberty
source for the ‘-liberty’ free software library
gdb-5.2.1/opcodes
source for the library of opcode tables and disassemblers
gdb-5.2.1/readline
source for the gnu command-line interface
gdb-5.2.1/glob
source for the gnu filename pattern-matching subroutine
gdb-5.2.1/mmalloc
source for the gnu memory-mapped malloc package
The simplest way to configure and build GDB is to run configure from the ‘gdb-version-number ’ source directory, which in this example is the ‘gdb-5.2.1’ directory.
First switch to the ‘gdb-version-number ’ source directory if you are not already in it;then run configure. Pass the identifier for the platform on which GDB will run as anargument.
For example:
cd gdb-5.2.1./configure host make
where host is an identifier such as ‘sun4’ or ‘decstation’, that identifies the platform whereGDB will run. (You can often leave off host; configure tries to guess the correct value byexamining your system.)
1 If you have a more recent version of GDB than 5.2.1, look at the ‘README’ file in the sources; we mayhave improved the installation procedures since publishing this manual.

8/14/2019 Debugging With GDB - The GNU Source-Level Debugger
http://slidepdf.com/reader/full/debugging-with-gdb-the-gnu-source-level-debugger 287/328
276 Debugging with GDB
Running ‘configure host’ and then running make builds the ‘bfd’, ‘readline’,‘ mmalloc’, and ‘libiberty’ libraries, then gdb itself. The configured source files, and thebinaries, are left in the corresponding source directories.
configure is a Bourne-shell (/bin/sh) script; if your system does not recognize thisautomatically when you run a different shell, you may need to run sh on it explicitly:
sh configure host
If you run configure from a directory that contains source directories for multiplelibraries or programs, such as the ‘gdb-5.2.1’ source directory for version 5.2.1, configure
creates configuration files for every directory level underneath (unless you tell it not to,with the ‘--norecursion’ option).
You can run the configure script from any of the subordinate directories in the GDB
distribution if you only want to configure that subdirectory, but be sure to specify a pathto it.
For example, with version 5.2.1, type the following to configure only the bfd subdirectory:
cd gdb-5.2.1/bfd../configure host
You can install gdb anywhere; it has no hardwired paths. However, you should makesure that the shell on your path (named by the ‘SHELL’ environment variable) is publiclyreadable. Remember that GDB uses the shell to start your program—some systems refuseto let GDB debug child processes whose programs are not readable.
B.1 Compiling GDB in another directory
If you want to run GDB versions for several host or target machines, you need a differentgdb compiled for each combination of host and target. configure is designed to make thiseasy by allowing you to generate each configuration in a separate subdirectory, rather thanin the source directory. If your make program handles the ‘VPATH’ feature (gnu make does),running make in each of these directories builds the gdb program specified there.
To build gdb in a separate directory, run configure with the ‘--srcdir’ option to
specify where to find the source. (You also need to specify a path to find configure itself from your working directory. If the path to configure would be the same as the argumentto ‘--srcdir’, you can leave out the ‘--srcdir’ option; it is assumed.)
For example, with version 5.2.1, you can build GDB in a separate directory for a Sun 4like this:
cd gdb-5.2.1 mkdir ../gdb-sun4cd ../gdb-sun4../gdb-5.2.1/configure sun4
make
When configure builds a configuration using a remote source directory, it creates atree for the binaries with the same structure (and using the same names) as the tree underthe source directory. In the example, you’d find the Sun 4 library ‘libiberty.a’ in thedirectory ‘gdb-sun4/libiberty’, and GDB itself in ‘gdb-sun4/gdb’.

8/14/2019 Debugging With GDB - The GNU Source-Level Debugger
http://slidepdf.com/reader/full/debugging-with-gdb-the-gnu-source-level-debugger 288/328
Appendix B: Installing GDB 277
One popular reason to build several GDB configurations in separate directories is toconfigure GDB for cross-compiling (where GDB runs on one machine—the host—while de-bugging programs that run on another machine—the target). You specify a cross-debugging
target by giving the ‘--target=target’ option to configure.When you run make to build a program or library, you must run it in a configured
directory—whatever directory you were in when you called configure (or one of its subdi-rectories).
The Makefile that configure generates in each source directory also runs recursively.If you type make in a source directory such as ‘gdb-5.2.1’ (or in a separate configureddirectory configured with ‘--srcdir=dirname /gdb-5.2.1’), you will build all the requiredlibraries, and then build GDB.
When you have multiple hosts or targets configured in separate directories, you can run
make on them in parallel (for example, if they are NFS-mounted on each of the hosts); theywill not interfere with each other.
B.2 Specifying names for hosts and targets
The specifications used for hosts and targets in the configure script are based on athree-part naming scheme, but some short predefined aliases are also supported. The fullnaming scheme encodes three pieces of information in the following pattern:
architecture -vendor -os
For example, you can use the alias sun4 as a host argument, or as the value for targetin a --target=target option. The equivalent full name is ‘sparc-sun-sunos4’.
The configure script accompanying GDB does not provide any query facility to listall supported host and target names or aliases. configure calls the Bourne shell scriptconfig.sub to map abbreviations to full names; you can read the script, if you wish, oryou can use it to test your guesses on abbreviations—for example:
% sh config.sub i386-linuxi386-pc-linux-gnu% sh config.sub alpha-linuxalpha-unknown-linux-gnu
% sh config.sub hp9k700hppa1.1-hp-hpux% sh config.sub sun4sparc-sun-sunos4.1.1% sh config.sub sun3 m68k-sun-sunos4.1.1% sh config.sub i986vInvalid configuration ‘i986v’: machine ‘i986v’ not recognized
config.sub is also distributed in the GDB source directory (‘gdb-5.2.1’, for version 5.2.1).
B.3 configure options
Here is a summary of the configure options and arguments that are most often usefulfor building GDB. configure also has several other options not listed here. See Info file‘configure.info’, node ‘What Configure Does’, for a full explanation of configure.

8/14/2019 Debugging With GDB - The GNU Source-Level Debugger
http://slidepdf.com/reader/full/debugging-with-gdb-the-gnu-source-level-debugger 289/328
278 Debugging with GDB
configure [--help][--prefix=dir ][--exec-prefix=dir ]
[--srcdir=dirname ][--norecursion] [--rm][--target=target]host
You may introduce options with a single ‘-’ rather than ‘--’ if you prefer; but you mayabbreviate option names if you use ‘--’.
--help Display a quick summary of how to invoke configure.
--prefix=dir Configure the source to install programs and files under directory ‘dir ’.
--exec-prefix=dir Configure the source to install programs under directory ‘dir ’.
--srcdir=dirname Warning: using this option requires gnu make, or another make that imple-ments the VPATH feature.Use this option to make configurations in directories separate from the GDBsource directories. Among other things, you can use this to build (or maintain)several configurations simultaneously, in separate directories. configure writesconfiguration specific files in the current directory, but arranges for them to use
the source in the directory dirname . configure creates directories under theworking directory in parallel to the source directories below dirname .
--norecursion
Configure only the directory level where configure is executed; do not propa-gate configuration to subdirectories.
--target=targetConfigure GDB for cross-debugging programs running on the specified target.Without this option, GDB is configured to debug programs that run on thesame machine (host) as GDB itself.
There is no convenient way to generate a list of all available targets.
host ... Configure GDB to run on the specified host.
There is no convenient way to generate a list of all available hosts.
There are many other options available as well, but they are generally needed for specialpurposes only.

8/14/2019 Debugging With GDB - The GNU Source-Level Debugger
http://slidepdf.com/reader/full/debugging-with-gdb-the-gnu-source-level-debugger 290/328
Appendix C: Maintenance Commands 279
Appendix C Maintenance Commands
In addition to commands intended for GDB users, GDB includes a number of commands
intended for GDB developers. These commands are provided here for reference.
maint info breakpoints
Using the same format as ‘info breakpoints’, display both the breakpointsyou’ve set explicitly, and those GDB is using for internal purposes. Internalbreakpoints are shown with negative breakpoint numbers. The type columnidentifies what kind of breakpoint is shown:
breakpoint
Normal, explicitly set breakpoint.
watchpointNormal, explicitly set watchpoint.
longjmp Internal breakpoint, used to handle correctly stepping throughlongjmp calls.
longjmp resume
Internal breakpoint at the target of a longjmp.
until Temporary internal breakpoint used by the GDB until command.
finish Temporary internal breakpoint used by the GDB finish command.
shlib events
Shared library events.

8/14/2019 Debugging With GDB - The GNU Source-Level Debugger
http://slidepdf.com/reader/full/debugging-with-gdb-the-gnu-source-level-debugger 291/328
280 Debugging with GDB

8/14/2019 Debugging With GDB - The GNU Source-Level Debugger
http://slidepdf.com/reader/full/debugging-with-gdb-the-gnu-source-level-debugger 292/328
Appendix D: GDB Remote Serial Protocol 281
Appendix D GDB Remote Serial Protocol
There may be occasions when you need to know something about the protocol—for
example, if there is only one serial port to your target machine, you might want yourprogram to do something special if it recognizes a packet meant for GDB.
In the examples below, ‘<-’ and ‘->’ are used to indicate transmitted and received datarespectfully.
All GDB commands and responses (other than acknowledgments) are sent as a packet.A packet is introduced with the character ‘$’, the actual packet-data , and the terminatingcharacter ‘#’ followed by a two-digit checksum:
$ packet-data #checksum
The two-digit checksum is computed as the modulo 256 sum of all characters between theleading ‘$’ and the trailing ‘#’ (an eight bit unsigned checksum).
Implementors should note that prior to GDB 5.0 the protocol specification also includedan optional two-digit sequence-id :
$sequence-id : packet-data #checksum
That sequence-id was appended to the acknowledgment. GDB has never output sequence-id s. Stubs that handle packets added since GDB 5.0 must not accept sequence-id .
When either the host or the target machine receives a packet, the first response expected
is an acknowledgment: either ‘+’ (to indicate the package was received correctly) or ‘-’ (torequest retransmission):
<- $ packet-data #checksum-> +
The host (GDB) sends command s, and the target (the debugging stub incorporated inyour program) sends a response . In the case of step and continue command s, the responseis only sent when the operation has completed (the target has again stopped).
packet-data consists of a sequence of characters with the exception of ‘#’ and ‘$’ (see ‘X’packet for additional exceptions).
Fields within the packet should be separated using ‘,’ ‘;’ or ‘:’. Except where otherwisenoted all numbers are represented in HEX with leading zeros suppressed.
Implementors should note that prior to GDB 5.0, the character ‘:’ could not appear asthe third character in a packet (as it would potentially conflict with the sequence-id ).
Response data can be run-length encoded to save space. A ‘*’ means that the nextcharacter is an ascii encoding giving a repeat count which stands for that many repetitionsof the character preceding the ‘*’. The encoding is n+29, yielding a printable characterwhere n >=3 (which is where rle starts to win). The printable characters ‘$’, ‘#’, ‘+’ and ‘-’
or with a numeric value greater than 126 should not be used.Some remote systems have used a different run-length encoding mechanism loosely ref-
ered to as the cisco encoding. Following the ‘*’ character are two hex digits that indicatethe size of the packet.
So:
8/14/2019 Debugging With GDB - The GNU Source-Level Debugger
http://slidepdf.com/reader/full/debugging-with-gdb-the-gnu-source-level-debugger 293/328
282 Debugging with GDB
"0* "
means the same as "0000".
The error response returned for some packets includes a two character error number.
That number is not well defined.
For any command not supported by the stub, an empty response (‘$#00’) should bereturned. That way it is possible to extend the protocol. A newer GDB can tell if a packetis supported based on that response.
A stub is required to support the ‘g’, ‘G’, ‘ m’, ‘M’, ‘c’, and ‘s’ command s. All othercommand s are optional.
Below is a complete list of all currently defined command s and their correspondingresponse data :

8/14/2019 Debugging With GDB - The GNU Source-Level Debugger
http://slidepdf.com/reader/full/debugging-with-gdb-the-gnu-source-level-debugger 294/328
Appendix D: GDB Remote Serial Protocol 283
Packet Request Description
extended mode ! Enable extended mode. In ex-tended mode, the remote server ismade persistent. The ‘R’ packet isused to restart the program beingdebugged.
reply ‘OK’ The remote target both supportsand has enabled extended mode.
last signal ? Indicate the reason the targethalted. The reply is the same asfor step and continue.
reply see below
reserved a Reserved for future use
set program arguments(reserved)
Aarglen,argnum,arg ,...
Initialized ‘argv[]’ array passedinto program. arglen specifiesthe number of bytes in the hexencoded byte stream arg . See‘gdbserver’ for more details.
reply OK
reply ENN
set baud (deprecated) bbaud Change the serial line speed tobaud . JTC: When does the trans-port layer state change? When it’s received, or after the ACK is transmitted. In either case,there are problems if the command or the acknowledgment packet is dropped. Stan: If people really
wanted to add something like this,and get it working for the first time, they ought to modify ser-unix.c to send some kind of out-of-band message to a specially-setupstub and have the switch happen "in between " packets, so that from remote protocol’s point of view,nothing actually happened.
set breakpoint(deprecated)
Baddr ,mode Set (mode is ‘S’) or clear (mode is ‘C’) a breakpoint at addr . This has been replaced by the ‘ Z’ and ‘ z’ packets.

8/14/2019 Debugging With GDB - The GNU Source-Level Debugger
http://slidepdf.com/reader/full/debugging-with-gdb-the-gnu-source-level-debugger 295/328
284 Debugging with GDB
continue caddr addr is address to resume. If addr is omitted, resume at currentaddress.
reply see below
continue with signal Csig ;addr Continue with signal sig (hex sig-nal number). If ;addr is omitted,resume at same address.
reply see below
toggle debug (deprecated) d toggle debug flag.
detach D Detach GDB from the remote sys-tem. Sent to the remote target be-fore GDB disconnects.
reply no response GDB does not check for any re-sponse after sending this packet.
reserved e Reserved for future use
reserved E Reserved for future use
reserved f Reserved for future use
reserved F Reserved for future use
read registers g Read general registers.
reply XX... Each byte of register data isdescribed by two hex digits.The bytes with the register aretransmitted in target byte or-der. The size of each reg-ister and their position withinthe ‘g’ packet are determined bythe GDB internal macros REG-ISTER RAW SIZE and REGIS-TER NAME macros. The specifi-cation of several standard g pack-ets is specified below.
ENN for an error.
write regs GXX... See ‘g’ for a description of theXX... data.
reply OK for successreply ENN for an error
reserved h Reserved for future use
8/14/2019 Debugging With GDB - The GNU Source-Level Debugger
http://slidepdf.com/reader/full/debugging-with-gdb-the-gnu-source-level-debugger 296/328
Appendix D: GDB Remote Serial Protocol 285
set thread Hct... Set thread for subsequent opera-tions (‘ m’, ‘M’, ‘g’, ‘G’, et.al.). c =‘c’ for thread used in step and con-
tinue; t... can be -1 for all threads.c = ‘g’ for thread used in otheroperations. If zero, pick a thread,any thread.
reply OK for successreply ENN for an error
cycle step (draft) iaddr ,nnn Step the remote target by a sin-gle clock cycle. If ,nnn is present,cycle step nnn cycles. If addr is
present, cycle step starting at thataddress.
signal then cycle step(reserved)
I See ‘i’ and ‘S’ for likely syntaxand semantics.
reserved j Reserved for future use
reserved J Reserved for future use
kill request k FIXME: There is no description of how to operate when a spe-
cific thread context has been se-lected (i.e. does ’k’ kill only that thread?).
reserved l Reserved for future use
reserved L Reserved for future use
read memory maddr ,length Read length bytes of memorystarting at address addr . Nei-ther GDB nor the stub assume
that sized memory transfers areassumed using word alligned ac-cesses. FIXME: A word aligned memory transfer mechanism is needed.
reply XX... XX... is mem contents. Canbe fewer bytes than requested if able to read only part of the data.Neither GDB nor the stub as-sume that sized memory trans-fers are assumed using word al-ligned accesses. FIXME: A word aligned memory transfer mecha-nism is needed.

8/14/2019 Debugging With GDB - The GNU Source-Level Debugger
http://slidepdf.com/reader/full/debugging-with-gdb-the-gnu-source-level-debugger 297/328
286 Debugging with GDB
reply ENN NN is errno
write mem Maddr ,length:XX... Write length bytes of memorystarting at address addr . XX... isthe data.
reply OK for successreply ENN for an error (this includes the case
where only part of the data waswritten).
reserved n Reserved for future use
reserved N Reserved for future use
reserved o Reserved for future use
reserved O Reserved for future use
read reg (reserved) pn... See write register.return r.... The hex encoded value of the reg-
ister in target byte order.
write reg Pn...=r... Write register n... with value r...,which contains two hex digits foreach byte in the register (targetbyte order).
reply OK for successreply ENN for an error
general query q query Request info about query . In gen-eral GDB queries have a leadingupper case letter. Custom vendorqueries should use a company pre-fix (in lower case) ex: ‘qfsf.var’.query may optionally be followedby a ‘,’ or ‘;’ separated list. Stubs
must ensure that they match thefull query name.
reply XX... Hex encoded data from query.The reply can not be empty.
reply ENN error replyreply ‘’ Indicating an unrecognized query .
general set Qvar =val Set value of var to val . See ‘q ’ for adiscussing of naming conventions.
reset (deprecated) r Reset the entire system.
remote restart RXX Restart the program being de-bugged. XX , while needed, is ig-nored. This packet is only avail-able in extended mode.
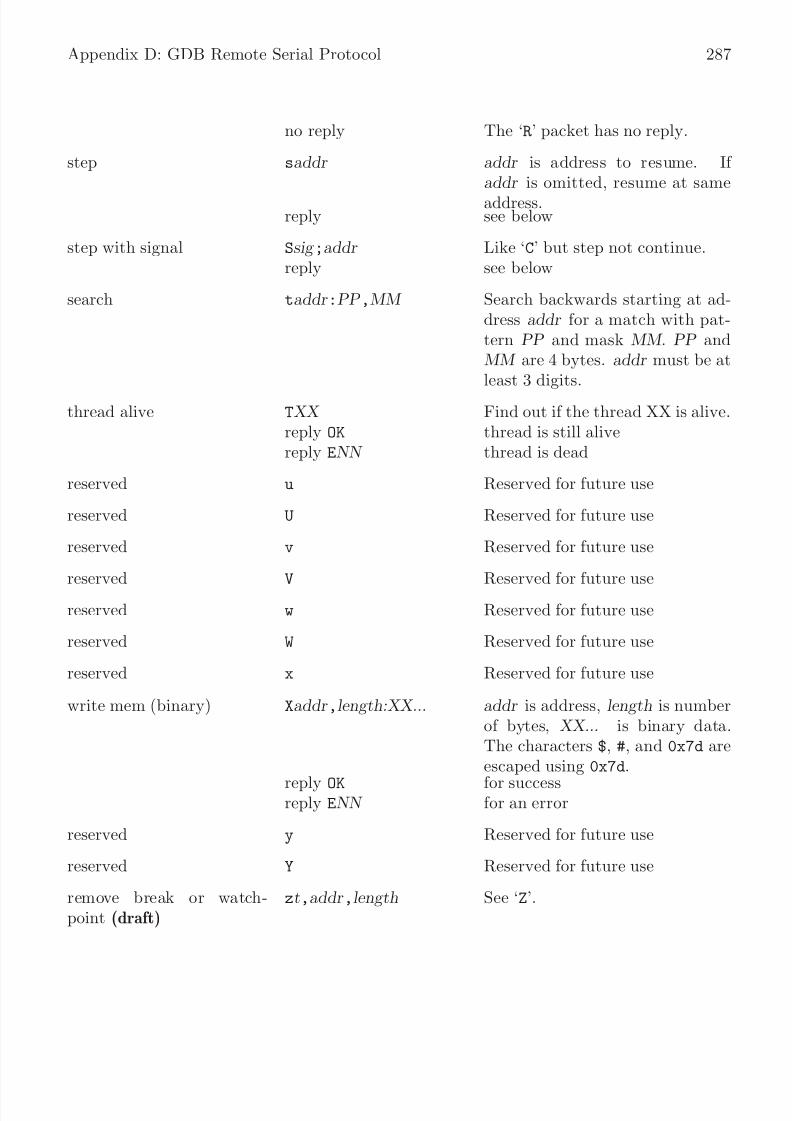
8/14/2019 Debugging With GDB - The GNU Source-Level Debugger
http://slidepdf.com/reader/full/debugging-with-gdb-the-gnu-source-level-debugger 298/328
Appendix D: GDB Remote Serial Protocol 287
no reply The ‘R’ packet has no reply.
step saddr addr is address to resume. If addr is omitted, resume at sameaddress.
reply see below
step with signal Ssig ;addr Like ‘C’ but step not continue.reply see below
search taddr :PP ,MM Search backwards starting at ad-dress addr for a match with pat-tern PP and mask MM . PP andMM are 4 bytes. addr must be at
least 3 digits.thread alive TXX Find out if the thread XX is alive.
reply OK thread is still alivereply ENN thread is dead
reserved u Reserved for future use
reserved U Reserved for future use
reserved v Reserved for future use
reserved V Reserved for future usereserved w Reserved for future use
reserved W Reserved for future use
reserved x Reserved for future use
write mem (binary) Xaddr ,length:XX... addr is address, length is numberof bytes, XX... is binary data.The characters $, #, and 0x7d areescaped using 0x7d.
reply OK for successreply ENN for an error
reserved y Reserved for future use
reserved Y Reserved for future use
remove break or watch-point (draft)
zt,addr ,length See ‘Z’.

8/14/2019 Debugging With GDB - The GNU Source-Level Debugger
http://slidepdf.com/reader/full/debugging-with-gdb-the-gnu-source-level-debugger 299/328
288 Debugging with GDB
insert break or watchpoint(draft)
Zt,addr ,length t is type: ‘0’ - software break-point, ‘1’ - hardware breakpoint,‘2’ - write watchpoint, ‘3’ - read
watchpoint, ‘4’ - access watch-point; addr is address; length is inbytes. For a software breakpoint,length specifies the size of the in-struction to be patched. For hard-ware breakpoints and watchpointslength specifies the memory regionto be monitored. To avoid poten-tial problems with duplicate pack-ets, the operations should be im-
plemented in an idempotent way.reply ENN for an errorreply OK for success‘’ If not supported.
reserved <other> Reserved for future use
The ‘C’, ‘c’, ‘S’, ‘s’ and ‘?’ packets can receive any of the below as a reply. In the caseof the ‘C’, ‘c’, ‘S’ and ‘s’ packets, that reply is only returned when the target halts. In thebelow the exact meaning of ‘signal number’ is poorly defined. In general one of the UNIX
signal numbering conventions is used.
SAA AA is the signal number
TAAn...:r...;n...:r...;n...:r...; AA = two hex digit signal number; n... = registernumber (hex), r... = target byte ordered registercontents, size defined by REGISTER_RAW_SIZE; n...= ‘thread’, r... = thread process ID, this is a hexinteger; n... = other string not starting with valid
hex digit. GDB should ignore this n..., r... pairand go on to the next. This way we can extend theprotocol.
WAA The process exited, and AA is the exit status. Thisis only applicable for certains sorts of targets.
XAA The process terminated with signal AA.
NAA;t...;d...;b... (obsolete) AA = signal number; t... = address of symbol" start"; d... = base of data section; b... = base
of bss section. Note: only used by Cisco Systems targets. The difference between this reply and the "qOffsets " query is that the ’N’ packet may arrive spontaneously whereas the ’qOffsets’ is a query ini-tiated by the host debugger.
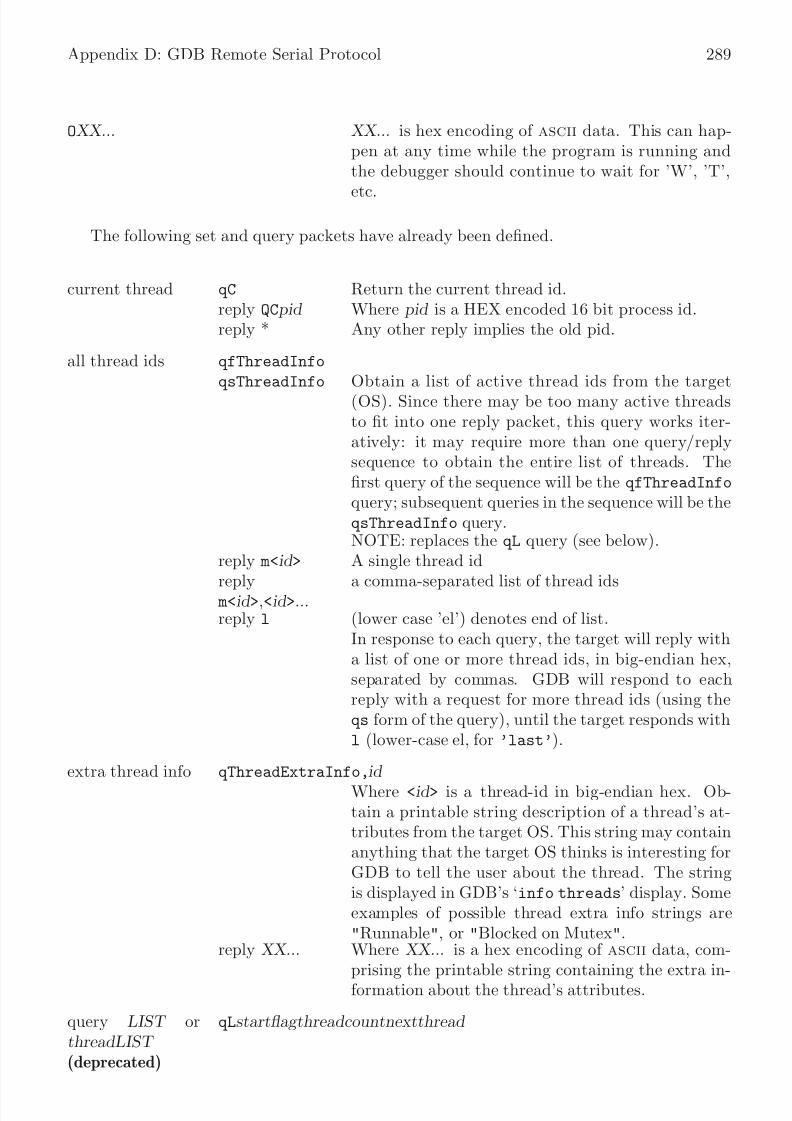
8/14/2019 Debugging With GDB - The GNU Source-Level Debugger
http://slidepdf.com/reader/full/debugging-with-gdb-the-gnu-source-level-debugger 300/328
Appendix D: GDB Remote Serial Protocol 289
OXX... XX... is hex encoding of ascii data. This can hap-pen at any time while the program is running andthe debugger should continue to wait for ’W’, ’T’,
etc.
The following set and query packets have already been defined.
current thread qC Return the current thread id.reply QC pid Where pid is a HEX encoded 16 bit process id.reply * Any other reply implies the old pid.
all thread ids qfThreadInfo
qsThreadInfo Obtain a list of active thread ids from the target(OS). Since there may be too many active threadsto fit into one reply packet, this query works iter-atively: it may require more than one query/replysequence to obtain the entire list of threads. Thefirst query of the sequence will be the qfThreadInfo
query; subsequent queries in the sequence will be theqsThreadInfo query.NOTE: replaces the qL query (see below).
reply m<id > A single thread id
reply m<id >,<id >...
a comma-separated list of thread ids
reply l (lower case ’el’) denotes end of list.In response to each query, the target will reply witha list of one or more thread ids, in big-endian hex,separated by commas. GDB will respond to eachreply with a request for more thread ids (using theqs form of the query), until the target responds withl (lower-case el, for ’last’).
extra thread info qThreadExtraInfo,id Where <id > is a thread-id in big-endian hex. Ob-tain a printable string description of a thread’s at-tributes from the target OS. This string may containanything that the target OS thinks is interesting forGDB to tell the user about the thread. The stringis displayed in GDB’s ‘info threads’ display. Someexamples of possible thread extra info strings are"Runnable", or "Blocked on Mutex".
reply XX... Where XX... is a hex encoding of ascii data, com-
prising the printable string containing the extra in-formation about the thread’s attributes.
query LIST orthreadLIST (deprecated)
qLstartflagthreadcountnextthread

8/14/2019 Debugging With GDB - The GNU Source-Level Debugger
http://slidepdf.com/reader/full/debugging-with-gdb-the-gnu-source-level-debugger 301/328
290 Debugging with GDB
Obtain thread information from RTOS. Where:startflag (one hex digit) is one to indicate the firstquery and zero to indicate a subsequent query;
threadcount (two hex digits) is the maximum num-ber of threads the response packet can contain; andnextthread (eight hex digits), for subsequent queries(startflag is zero), is returned in the response asargthread .NOTE: this query is replaced by the qfThreadInfo
query (see above).replyqMcountdoneargthreadthread...
Where: count (two hex digits) is the number of
threads being returned; done (one hex digit) is zeroto indicate more threads and one indicates no fur-ther threads; argthreadid (eight hex digits) is next-thread from the request packet; thread... is a se-quence of thread IDs from the target. threadid (eighthex digits). See remote.c:parse_threadlist_
response().
compute CRC of memory block
qCRC:addr ,length
reply ENN An error (such as memory fault)reply CCRC32 A 32 bit cyclic redundancy check of the specifiedmemory region.
query sect offs qOffsets Get section offsets that the target used when re-locating the downloaded image. Note: while a Bss
offset is included in the response, GDB ignores this and instead applies the Data offset to the Bss sec-tion.
replyText=xxx ;Data= yyy ;Bss=zzz
thread inforequest
qPmodethreadid
Returns information on threadid . Where: mode is ahex encoded 32 bit mode; threadid is a hex encoded64 bit thread ID.
reply * See remote.c:remote_unpack_thread_info_
response().
remote command qRcmd,COMMAND

8/14/2019 Debugging With GDB - The GNU Source-Level Debugger
http://slidepdf.com/reader/full/debugging-with-gdb-the-gnu-source-level-debugger 302/328
Appendix D: GDB Remote Serial Protocol 291
COMMAND (hex encoded) is passed to the localinterpreter for execution. Invalid commands shouldbe reported using the output string. Before the fi-
nal result packet, the target may also respond witha number of intermediate OOUTPUT console out-put packets. Implementors should note that provid-ing access to a stubs’s interpreter may have security implications .
reply OK A command response with no output.replyOUTPUT
A command response with the hex encoded outputstring OUTPUT .
reply ENN Indicate a badly formed request.
reply ‘’ When ‘q ’‘Rcmd’ is not recognized.
symbol lookup qSymbol:: Notify the target that GDB is prepared to serve sym-bol lookup requests. Accept requests from the targetfor the values of symbols.
reply OK The target does not need to look up any (more)symbols.
replyqSymbol:sym name
The target requests the value of symbol sym name (hex encoded). GDB may provide the value by us-ing the qSymbol:sym value :sym name message, de-scribed below.
symbol value qSymbol:sym value :sym name
Set the value of SYM NAME to SYM VALUE.sym name (hex encoded) is the name of a symbolwhose value the target has previously requested.sym value (hex) is the value for symbol sym name .If GDB cannot supply a value for sym name , then
this field will be empty.reply OK The target does not need to look up any (more)
symbols.replyqSymbol:sym name
The target requests the value of a new symbolsym name (hex encoded). GDB will continue to sup-ply the values of symbols (if available), until the tar-get ceases to request them.
The following ‘g’/‘G’ packets have previously been defined. In the below, some thirty-twobit registers are transferred as sixty-four bits. Those registers should be zero/sign extended(which?) to fill the space allocated. Register bytes are transfered in target byte order. Thetwo nibbles within a register byte are transfered most-significant - least-significant.

8/14/2019 Debugging With GDB - The GNU Source-Level Debugger
http://slidepdf.com/reader/full/debugging-with-gdb-the-gnu-source-level-debugger 303/328
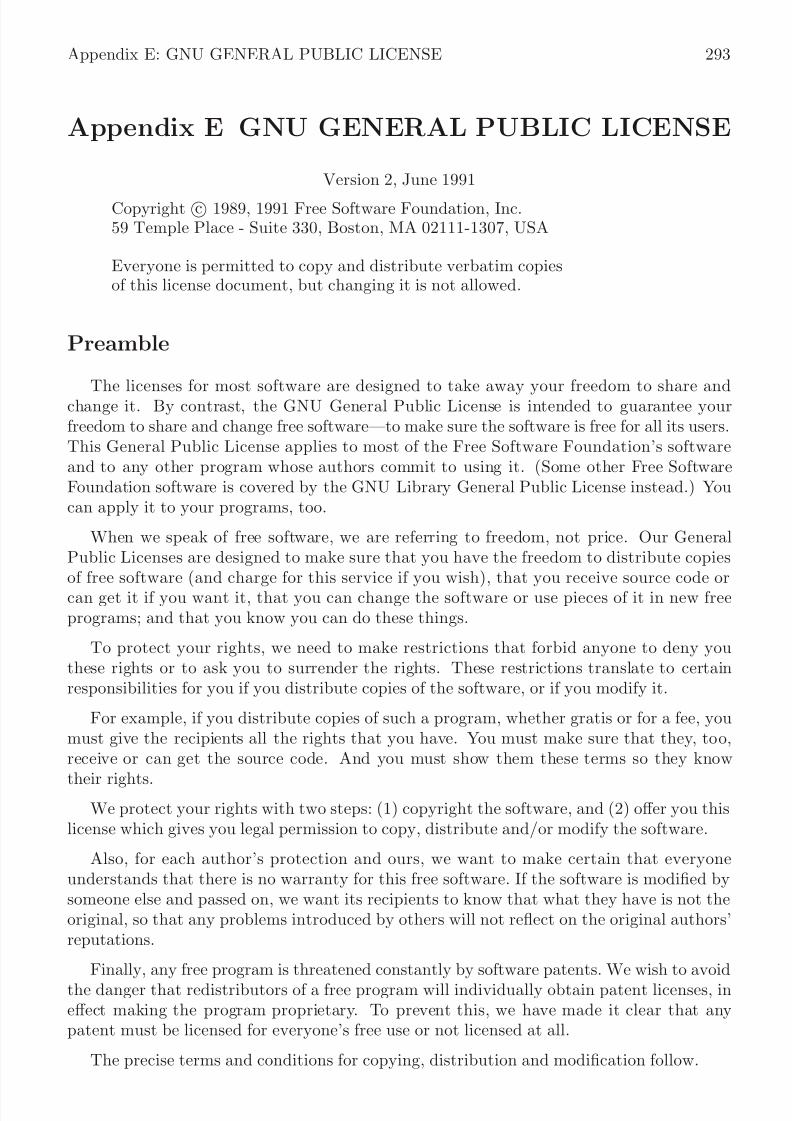
8/14/2019 Debugging With GDB - The GNU Source-Level Debugger
http://slidepdf.com/reader/full/debugging-with-gdb-the-gnu-source-level-debugger 304/328
Appendix E: GNU GENERAL PUBLIC LICENSE 293
Appendix E GNU GENERAL PUBLIC LICENSE
Version 2, June 1991
Copyright c 1989, 1991 Free Software Foundation, Inc.59 Temple Place - Suite 330, Boston, MA 02111-1307, USA
Everyone is permitted to copy and distribute verbatim copiesof this license document, but changing it is not allowed.
Preamble
The licenses for most software are designed to take away your freedom to share andchange it. By contrast, the GNU General Public License is intended to guarantee yourfreedom to share and change free software—to make sure the software is free for all its users.This General Public License applies to most of the Free Software Foundation’s softwareand to any other program whose authors commit to using it. (Some other Free SoftwareFoundation software is covered by the GNU Library General Public License instead.) Youcan apply it to your programs, too.
When we speak of free software, we are referring to freedom, not price. Our GeneralPublic Licenses are designed to make sure that you have the freedom to distribute copies
of free software (and charge for this service if you wish), that you receive source code orcan get it if you want it, that you can change the software or use pieces of it in new freeprograms; and that you know you can do these things.
To protect your rights, we need to make restrictions that forbid anyone to deny youthese rights or to ask you to surrender the rights. These restrictions translate to certainresponsibilities for you if you distribute copies of the software, or if you modify it.
For example, if you distribute copies of such a program, whether gratis or for a fee, youmust give the recipients all the rights that you have. You must make sure that they, too,receive or can get the source code. And you must show them these terms so they know
their rights.
We protect your rights with two steps: (1) copyright the software, and (2) offer you thislicense which gives you legal permission to copy, distribute and/or modify the software.
Also, for each author’s protection and ours, we want to make certain that everyoneunderstands that there is no warranty for this free software. If the software is modified bysomeone else and passed on, we want its recipients to know that what they have is not theoriginal, so that any problems introduced by others will not reflect on the original authors’reputations.
Finally, any free program is threatened constantly by software patents. We wish to avoidthe danger that redistributors of a free program will individually obtain patent licenses, ineffect making the program proprietary. To prevent this, we have made it clear that anypatent must be licensed for everyone’s free use or not licensed at all.
The precise terms and conditions for copying, distribution and modification follow.
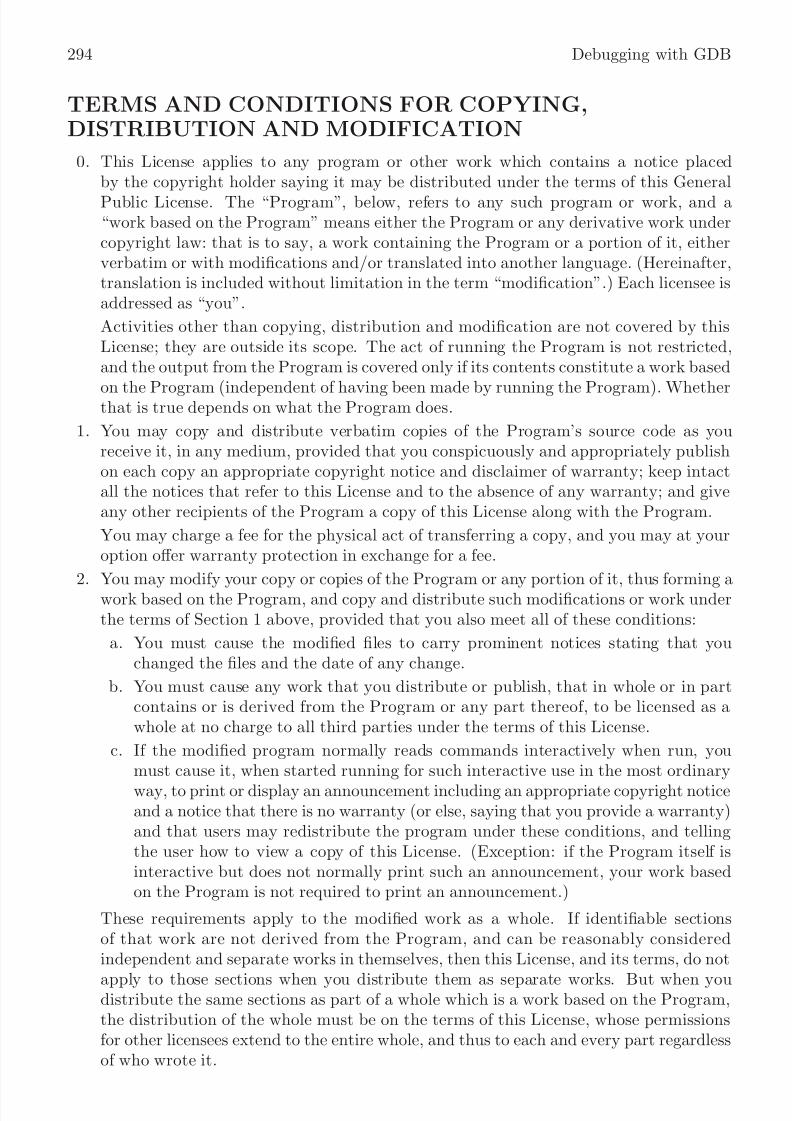
8/14/2019 Debugging With GDB - The GNU Source-Level Debugger
http://slidepdf.com/reader/full/debugging-with-gdb-the-gnu-source-level-debugger 305/328
294 Debugging with GDB
TERMS AND CONDITIONS FOR COPYING,DISTRIBUTION AND MODIFICATION
0. This License applies to any program or other work which contains a notice placedby the copyright holder saying it may be distributed under the terms of this GeneralPublic License. The “Program”, below, refers to any such program or work, and a“work based on the Program” means either the Program or any derivative work undercopyright law: that is to say, a work containing the Program or a portion of it, eitherverbatim or with modifications and/or translated into another language. (Hereinafter,translation is included without limitation in the term “modification”.) Each licensee isaddressed as “you”.
Activities other than copying, distribution and modification are not covered by thisLicense; they are outside its scope. The act of running the Program is not restricted,and the output from the Program is covered only if its contents constitute a work based
on the Program (independent of having been made by running the Program). Whetherthat is true depends on what the Program does.
1. You may copy and distribute verbatim copies of the Program’s source code as youreceive it, in any medium, provided that you conspicuously and appropriately publishon each copy an appropriate copyright notice and disclaimer of warranty; keep intactall the notices that refer to this License and to the absence of any warranty; and giveany other recipients of the Program a copy of this License along with the Program.
You may charge a fee for the physical act of transferring a copy, and you may at youroption offer warranty protection in exchange for a fee.
2. You may modify your copy or copies of the Program or any portion of it, thus forming awork based on the Program, and copy and distribute such modifications or work underthe terms of Section 1 above, provided that you also meet all of these conditions:
a. You must cause the modified files to carry prominent notices stating that youchanged the files and the date of any change.
b. You must cause any work that you distribute or publish, that in whole or in partcontains or is derived from the Program or any part thereof, to be licensed as awhole at no charge to all third parties under the terms of this License.
c. If the modified program normally reads commands interactively when run, you
must cause it, when started running for such interactive use in the most ordinaryway, to print or display an announcement including an appropriate copyright noticeand a notice that there is no warranty (or else, saying that you provide a warranty)and that users may redistribute the program under these conditions, and tellingthe user how to view a copy of this License. (Exception: if the Program itself isinteractive but does not normally print such an announcement, your work basedon the Program is not required to print an announcement.)
These requirements apply to the modified work as a whole. If identifiable sectionsof that work are not derived from the Program, and can be reasonably consideredindependent and separate works in themselves, then this License, and its terms, do not
apply to those sections when you distribute them as separate works. But when youdistribute the same sections as part of a whole which is a work based on the Program,the distribution of the whole must be on the terms of this License, whose permissionsfor other licensees extend to the entire whole, and thus to each and every part regardlessof who wrote it.

8/14/2019 Debugging With GDB - The GNU Source-Level Debugger
http://slidepdf.com/reader/full/debugging-with-gdb-the-gnu-source-level-debugger 306/328
Appendix E: GNU GENERAL PUBLIC LICENSE 295
Thus, it is not the intent of this section to claim rights or contest your rights towork written entirely by you; rather, the intent is to exercise the right to control thedistribution of derivative or collective works based on the Program.
In addition, mere aggregation of another work not based on the Program with theProgram (or with a work based on the Program) on a volume of a storage or distributionmedium does not bring the other work under the scope of this License.
3. You may copy and distribute the Program (or a work based on it, under Section 2)in object code or executable form under the terms of Sections 1 and 2 above providedthat you also do one of the following:
a. Accompany it with the complete corresponding machine-readable source code,which must be distributed under the terms of Sections 1 and 2 above on a mediumcustomarily used for software interchange; or,
b. Accompany it with a written offer, valid for at least three years, to give any thirdparty, for a charge no more than your cost of physically performing source distri-bution, a complete machine-readable copy of the corresponding source code, to bedistributed under the terms of Sections 1 and 2 above on a medium customarilyused for software interchange; or,
c. Accompany it with the information you received as to the offer to distribute cor-responding source code. (This alternative is allowed only for noncommercial dis-tribution and only if you received the program in object code or executable formwith such an offer, in accord with Subsection b above.)
The source code for a work means the preferred form of the work for making modifi-cations to it. For an executable work, complete source code means all the source codefor all modules it contains, plus any associated interface definition files, plus the scriptsused to control compilation and installation of the executable. However, as a spe-cial exception, the source code distributed need not include anything that is normallydistributed (in either source or binary form) with the major components (compiler,kernel, and so on) of the operating system on which the executable runs, unless thatcomponent itself accompanies the executable.
If distribution of executable or object code is made by offering access to copy from
a designated place, then offering equivalent access to copy the source code from thesame place counts as distribution of the source code, even though third parties are notcompelled to copy the source along with the object code.
4. You may not copy, modify, sublicense, or distribute the Program except as expresslyprovided under this License. Any attempt otherwise to copy, modify, sublicense ordistribute the Program is void, and will automatically terminate your rights under thisLicense. However, parties who have received copies, or rights, from you under thisLicense will not have their licenses terminated so long as such parties remain in fullcompliance.
5. You are not required to accept this License, since you have not signed it. However,
nothing else grants you permission to modify or distribute the Program or its derivativeworks. These actions are prohibited by law if you do not accept this License. Therefore,by modifying or distributing the Program (or any work based on the Program), youindicate your acceptance of this License to do so, and all its terms and conditions forcopying, distributing or modifying the Program or works based on it.

8/14/2019 Debugging With GDB - The GNU Source-Level Debugger
http://slidepdf.com/reader/full/debugging-with-gdb-the-gnu-source-level-debugger 307/328
296 Debugging with GDB
6. Each time you redistribute the Program (or any work based on the Program), therecipient automatically receives a license from the original licensor to copy, distributeor modify the Program subject to these terms and conditions. You may not impose
any further restrictions on the recipients’ exercise of the rights granted herein. You arenot responsible for enforcing compliance by third parties to this License.
7. If, as a consequence of a court judgment or allegation of patent infringement or for anyother reason (not limited to patent issues), conditions are imposed on you (whether bycourt order, agreement or otherwise) that contradict the conditions of this License, theydo not excuse you from the conditions of this License. If you cannot distribute so asto satisfy simultaneously your obligations under this License and any other pertinentobligations, then as a consequence you may not distribute the Program at all. Forexample, if a patent license would not permit royalty-free redistribution of the Programby all those who receive copies directly or indirectly through you, then the only wayyou could satisfy both it and this License would be to refrain entirely from distributionof the Program.
If any portion of this section is held invalid or unenforceable under any particularcircumstance, the balance of the section is intended to apply and the section as awhole is intended to apply in other circumstances.
It is not the purpose of this section to induce you to infringe any patents or otherproperty right claims or to contest validity of any such claims; this section has thesole purpose of protecting the integrity of the free software distribution system, whichis implemented by public license practices. Many people have made generous contri-butions to the wide range of software distributed through that system in reliance onconsistent application of that system; it is up to the author/donor to decide if he orshe is willing to distribute software through any other system and a licensee cannotimpose that choice.
This section is intended to make thoroughly clear what is believed to be a consequenceof the rest of this License.
8. If the distribution and/or use of the Program is restricted in certain countries eitherby patents or by copyrighted interfaces, the original copyright holder who places theProgram under this License may add an explicit geographical distribution limitation
excluding those countries, so that distribution is permitted only in or among countriesnot thus excluded. In such case, this License incorporates the limitation as if writtenin the body of this License.
9. The Free Software Foundation may publish revised and/or new versions of the GeneralPublic License from time to time. Such new versions will be similar in spirit to thepresent version, but may differ in detail to address new problems or concerns.
Each version is given a distinguishing version number. If the Program specifies aversion number of this License which applies to it and “any later version”, you havethe option of following the terms and conditions either of that version or of any later
version published by the Free Software Foundation. If the Program does not specify aversion number of this License, you may choose any version ever published by the FreeSoftware Foundation.
10. If you wish to incorporate parts of the Program into other free programs whose distri-bution conditions are different, write to the author to ask for permission. For software
8/14/2019 Debugging With GDB - The GNU Source-Level Debugger
http://slidepdf.com/reader/full/debugging-with-gdb-the-gnu-source-level-debugger 308/328
Appendix E: GNU GENERAL PUBLIC LICENSE 297
which is copyrighted by the Free Software Foundation, write to the Free Software Foun-dation; we sometimes make exceptions for this. Our decision will be guided by the twogoals of preserving the free status of all derivatives of our free software and of promoting
the sharing and reuse of software generally.
NO WARRANTY
11. BECAUSE THE PROGRAM IS LICENSED FREE OF CHARGE, THERE IS NOWARRANTY FOR THE PROGRAM, TO THE EXTENT PERMITTED BY APPLI-CABLE LAW. EXCEPT WHEN OTHERWISE STATED IN WRITING THE COPY-RIGHT HOLDERS AND/OR OTHER PARTIES PROVIDE THE PROGRAM “ASIS” WITHOUT WARRANTY OF ANY KIND, EITHER EXPRESSED OR IMPLIED,INCLUDING, BUT NOT LIMITED TO, THE IMPLIED WARRANTIES OF MER-
CHANTABILITY AND FITNESS FOR A PARTICULAR PURPOSE. THE ENTIRERISK AS TO THE QUALITY AND PERFORMANCE OF THE PROGRAM IS WITHYOU. SHOULD THE PROGRAM PROVE DEFECTIVE, YOU ASSUME THE COSTOF ALL NECESSARY SERVICING, REPAIR OR CORRECTION.
12. IN NO EVENT UNLESS REQUIRED BY APPLICABLE LAW OR AGREED TO INWRITING WILL ANY COPYRIGHT HOLDER, OR ANY OTHER PARTY WHOMAY MODIFY AND/OR REDISTRIBUTE THE PROGRAM AS PERMITTEDABOVE, BE LIABLE TO YOU FOR DAMAGES, INCLUDING ANY GENERAL,SPECIAL, INCIDENTAL OR CONSEQUENTIAL DAMAGES ARISING OUT OF
THE USE OR INABILITY TO USE THE PROGRAM (INCLUDING BUT NOTLIMITED TO LOSS OF DATA OR DATA BEING RENDERED INACCURATE ORLOSSES SUSTAINED BY YOU OR THIRD PARTIES OR A FAILURE OF THEPROGRAM TO OPERATE WITH ANY OTHER PROGRAMS), EVEN IF SUCHHOLDER OR OTHER PARTY HAS BEEN ADVISED OF THE POSSIBILITY OFSUCH DAMAGES.
END OF TERMS AND CONDITIONS

8/14/2019 Debugging With GDB - The GNU Source-Level Debugger
http://slidepdf.com/reader/full/debugging-with-gdb-the-gnu-source-level-debugger 309/328
298 Debugging with GDB
How to Apply These Terms to Your New Programs
If you develop a new program, and you want it to be of the greatest possible use to
the public, the best way to achieve this is to make it free software which everyone canredistribute and change under these terms.
To do so, attach the following notices to the program. It is safest to attach them to thestart of each source file to most effectively convey the exclusion of warranty; and each fileshould have at least the “copyright” line and a pointer to where the full notice is found.
one line to give the program’s name and a brief idea of what it does.Copyright (C) year name of author
This program is free software; you can redistribute it and/or modifyit under the terms of the GNU General Public License as published by
the Free Software Foundation; either version 2 of the License, or(at your option) any later version.
This program is distributed in the hope that it will be useful,but WITHOUT ANY WARRANTY; without even the implied warranty ofMERCHANTABILITY or FITNESS FOR A PARTICULAR PURPOSE. See theGNU General Public License for more details.
You should have received a copy of the GNU General Public Licensealong with this program; if not, write to the Free Software
Foundation, Inc., 59 Temple Place - Suite 330,Boston, MA 02111-1307, USA.
Also add information on how to contact you by electronic and paper mail.
If the program is interactive, make it output a short notice like this when it starts in aninteractive mode:
Gnomovision version 69, Copyright (C) year name of author Gnomovision comes with ABSOLUTELY NO WARRANTY; for detailstype ‘show w’.This is free software, and you are welcome to redistribute itunder certain conditions; type ‘show c’ for details.
The hypothetical commands ‘show w’ and ‘show c’ should show the appropriate parts of the General Public License. Of course, the commands you use may be called somethingother than ‘show w’ and ‘show c’; they could even be mouse-clicks or menu items—whateversuits your program.
You should also get your employer (if you work as a programmer) or your school, if any,to sign a “copyright disclaimer” for the program, if necessary. Here is a sample; alter thenames:
Yoyodyne, Inc., hereby disclaims all copyright interest in the program‘Gnomovision’ (which makes passes at compilers) written by James Hacker.
signature of Ty Coon, 1 April 1989Ty Coon, President of Vice
This General Public License does not permit incorporating your program into proprietaryprograms. If your program is a subroutine library, you may consider it more useful to permit

8/14/2019 Debugging With GDB - The GNU Source-Level Debugger
http://slidepdf.com/reader/full/debugging-with-gdb-the-gnu-source-level-debugger 310/328
Appendix E: GNU GENERAL PUBLIC LICENSE 299
linking proprietary applications with the library. If this is what you want to do, use theGNU Library General Public License instead of this License.

8/14/2019 Debugging With GDB - The GNU Source-Level Debugger
http://slidepdf.com/reader/full/debugging-with-gdb-the-gnu-source-level-debugger 311/328
300 Debugging with GDB

8/14/2019 Debugging With GDB - The GNU Source-Level Debugger
http://slidepdf.com/reader/full/debugging-with-gdb-the-gnu-source-level-debugger 312/328
Appendix F: GNU Free Documentation License 301
Appendix F GNU Free Documentation License
Version 1.1, March 2000
Copyright (C) 2000 Free Software Foundation, Inc.59 Temple Place, Suite 330, Boston, MA 02111-1307 USA
Everyone is permitted to copy and distribute verbatim copiesof this license document, but changing it is not allowed.
0. PREAMBLE
The purpose of this License is to make a manual, textbook, or other written document“free” in the sense of freedom: to assure everyone the effective freedom to copy and
redistribute it, with or without modifying it, either commercially or noncommercially.Secondarily, this License preserves for the author and publisher a way to get credit fortheir work, while not being considered responsible for modifications made by others.
This License is a kind of “copyleft”, which means that derivative works of the documentmust themselves be free in the same sense. It complements the GNU General PublicLicense, which is a copyleft license designed for free software.
We have designed this License in order to use it for manuals for free software, becausefree software needs free documentation: a free program should come with manualsproviding the same freedoms that the software does. But this License is not limited to
software manuals; it can be used for any textual work, regardless of subject matter orwhether it is published as a printed book. We recommend this License principally forworks whose purpose is instruction or reference.
1. APPLICABILITY AND DEFINITIONS
This License applies to any manual or other work that contains a notice placed bythe copyright holder saying it can be distributed under the terms of this License. The“Document”, below, refers to any such manual or work. Any member of the public isa licensee, and is addressed as “you.”
A “Modified Version” of the Document means any work containing the Document ora portion of it, either copied verbatim, or with modifications and/or translated intoanother language.
A “Secondary Section” is a named appendix or a front-matter section of the Documentthat deals exclusively with the relationship of the publishers or authors of the Documentto the Document’s overall subject (or to related matters) and contains nothing thatcould fall directly within that overall subject. (For example, if the Document is in part atextbook of mathematics, a Secondary Section may not explain any mathematics.) Therelationship could be a matter of historical connection with the subject or with related
matters, or of legal, commercial, philosophical, ethical or political position regardingthem.
The “Invariant Sections” are certain Secondary Sections whose titles are designated, asbeing those of Invariant Sections, in the notice that says that the Document is releasedunder this License.

8/14/2019 Debugging With GDB - The GNU Source-Level Debugger
http://slidepdf.com/reader/full/debugging-with-gdb-the-gnu-source-level-debugger 313/328
302 Debugging with GDB
The “Cover Texts” are certain short passages of text that are listed, as Front-CoverTexts or Back-Cover Texts, in the notice that says that the Document is released underthis License.
A “Transparent” copy of the Document means a machine-readable copy, representedin a format whose specification is available to the general public, whose contents canbe viewed and edited directly and straightforwardly with generic text editors or (forimages composed of pixels) generic paint programs or (for drawings) some widely avail-able drawing editor, and that is suitable for input to text formatters or for automatictranslation to a variety of formats suitable for input to text formatters. A copy madein an otherwise Transparent file format whose markup has been designed to thwart ordiscourage subsequent modification by readers is not Transparent. A copy that is not“Transparent” is called “Opaque.”
Examples of suitable formats for Transparent copies include plain ASCII withoutmarkup, Texinfo input format, LaTeX input format, SGML or XML using a publiclyavailable DTD, and standard-conforming simple HTML designed for human modifica-tion. Opaque formats include PostScript, PDF, proprietary formats that can be readand edited only by proprietary word processors, SGML or XML for which the DTDand/or processing tools are not generally available, and the machine-generated HTMLproduced by some word processors for output purposes only.
The “Title Page” means, for a printed book, the title page itself, plus such followingpages as are needed to hold, legibly, the material this License requires to appear in the
title page. For works in formats which do not have any title page as such, “Title Page”means the text near the most prominent appearance of the work’s title, preceding thebeginning of the body of the text.
2. VERBATIM COPYING
You may copy and distribute the Document in any medium, either commercially ornoncommercially, provided that this License, the copyright notices, and the licensenotice saying this License applies to the Document are reproduced in all copies, andthat you add no other conditions whatsoever to those of this License. You may not usetechnical measures to obstruct or control the reading or further copying of the copies
you make or distribute. However, you may accept compensation in exchange for copies.If you distribute a large enough number of copies you must also follow the conditionsin section 3.
You may also lend copies, under the same conditions stated above, and you may publiclydisplay copies.
3. COPYING IN QUANTITY
If you publish printed copies of the Document numbering more than 100, and theDocument’s license notice requires Cover Texts, you must enclose the copies in covers
that carry, clearly and legibly, all these Cover Texts: Front-Cover Texts on the frontcover, and Back-Cover Texts on the back cover. Both covers must also clearly andlegibly identify you as the publisher of these copies. The front cover must present thefull title with all words of the title equally prominent and visible. You may add othermaterial on the covers in addition. Copying with changes limited to the covers, as long
8/14/2019 Debugging With GDB - The GNU Source-Level Debugger
http://slidepdf.com/reader/full/debugging-with-gdb-the-gnu-source-level-debugger 314/328
Appendix F: GNU Free Documentation License 303
as they preserve the title of the Document and satisfy these conditions, can be treatedas verbatim copying in other respects.
If the required texts for either cover are too voluminous to fit legibly, you should put
the first ones listed (as many as fit reasonably) on the actual cover, and continue therest onto adjacent pages.
If you publish or distribute Opaque copies of the Document numbering more than 100,you must either include a machine-readable Transparent copy along with each Opaquecopy, or state in or with each Opaque copy a publicly-accessible computer-networklocation containing a complete Transparent copy of the Document, free of added ma-terial, which the general network-using public has access to download anonymously atno charge using public-standard network protocols. If you use the latter option, youmust take reasonably prudent steps, when you begin distribution of Opaque copies
in quantity, to ensure that this Transparent copy will remain thus accessible at thestated location until at least one year after the last time you distribute an Opaquecopy (directly or through your agents or retailers) of that edition to the public.
It is requested, but not required, that you contact the authors of the Document wellbefore redistributing any large number of copies, to give them a chance to provide youwith an updated version of the Document.
4. MODIFICATIONS
You may copy and distribute a Modified Version of the Document under the conditionsof sections 2 and 3 above, provided that you release the Modified Version under preciselythis License, with the Modified Version filling the role of the Document, thus licensingdistribution and modification of the Modified Version to whoever possesses a copy of it. In addition, you must do these things in the Modified Version:
A. Use in the Title Page (and on the covers, if any) a title distinct from that of theDocument, and from those of previous versions (which should, if there were any, belisted in the History section of the Document). You may use the same title as a previousversion if the original publisher of that version gives permission.B. List on the Title Page, as authors, one or more persons or entities responsible forauthorship of the modifications in the Modified Version, together with at least five of
the principal authors of the Document (all of its principal authors, if it has less thanfive).C. State on the Title page the name of the publisher of the Modified Version, as thepublisher.D. Preserve all the copyright notices of the Document.E. Add an appropriate copyright notice for your modifications adjacent to the othercopyright notices.F. Include, immediately after the copyright notices, a license notice giving the publicpermission to use the Modified Version under the terms of this License, in the formshown in the Addendum below.
G. Preserve in that license notice the full lists of Invariant Sections and required CoverTexts given in the Document’s license notice.H. Include an unaltered copy of this License.I. Preserve the section entitled “History”, and its title, and add to it an item stating atleast the title, year, new authors, and publisher of the Modified Version as given on the

8/14/2019 Debugging With GDB - The GNU Source-Level Debugger
http://slidepdf.com/reader/full/debugging-with-gdb-the-gnu-source-level-debugger 315/328
304 Debugging with GDB
Title Page. If there is no section entitled “History” in the Document, create one statingthe title, year, authors, and publisher of the Document as given on its Title Page, thenadd an item describing the Modified Version as stated in the previous sentence.
J. Preserve the network location, if any, given in the Document for public access toa Transparent copy of the Document, and likewise the network locations given in theDocument for previous versions it was based on. These may be placed in the “History”section. You may omit a network location for a work that was published at least fouryears before the Document itself, or if the original publisher of the version it refers togives permission.K. In any section entitled “Acknowledgements” or “Dedications”, preserve the section’stitle, and preserve in the section all the substance and tone of each of the contributoracknowledgements and/or dedications given therein.L. Preserve all the Invariant Sections of the Document, unaltered in their text and in
their titles. Section numbers or the equivalent are not considered part of the sectiontitles.M. Delete any section entitled “Endorsements.” Such a section may not be included inthe Modified Version.N. Do not retitle any existing section as “Endorsements” or to conflict in title with anyInvariant Section.
If the Modified Version includes new front-matter sections or appendices that qualify
as Secondary Sections and contain no material copied from the Document, you may atyour option designate some or all of these sections as invariant. To do this, add theirtitles to the list of Invariant Sections in the Modified Version’s license notice. Thesetitles must be distinct from any other section titles.
You may add a section entitled “Endorsements”, provided it contains nothing butendorsements of your Modified Version by various parties–for example, statements of peer review or that the text has been approved by an organization as the authoritativedefinition of a standard.
You may add a passage of up to five words as a Front-Cover Text, and a passage of up
to 25 words as a Back-Cover Text, to the end of the list of Cover Texts in the ModifiedVersion. Only one passage of Front-Cover Text and one of Back-Cover Text may beadded by (or through arrangements made by) any one entity. If the Document alreadyincludes a cover text for the same cover, previously added by you or by arrangementmade by the same entity you are acting on behalf of, you may not add another; butyou may replace the old one, on explicit permission from the previous publisher thatadded the old one.
The author(s) and publisher(s) of the Document do not by this License give permissionto use their names for publicity for or to assert or imply endorsement of any ModifiedVersion.
5. COMBINING DOCUMENTS
You may combine the Document with other documents released under this License,under the terms defined in section 4 above for modified versions, provided that youinclude in the combination all of the Invariant Sections of all of the original documents,
8/14/2019 Debugging With GDB - The GNU Source-Level Debugger
http://slidepdf.com/reader/full/debugging-with-gdb-the-gnu-source-level-debugger 316/328
Appendix F: GNU Free Documentation License 305
unmodified, and list them all as Invariant Sections of your combined work in its licensenotice.
The combined work need only contain one copy of this License, and multiple identical
Invariant Sections may be replaced with a single copy. If there are multiple InvariantSections with the same name but different contents, make the title of each such sectionunique by adding at the end of it, in parentheses, the name of the original author orpublisher of that section if known, or else a unique number. Make the same adjustmentto the section titles in the list of Invariant Sections in the license notice of the combinedwork.
In the combination, you must combine any sections entitled “History” in the variousoriginal documents, forming one section entitled “History”; likewise combine any sec-tions entitled “Acknowledgements”, and any sections entitled “Dedications.” You must
delete all sections entitled “Endorsements.”
6. COLLECTIONS OF DOCUMENTS
You may make a collection consisting of the Document and other documents releasedunder this License, and replace the individual copies of this License in the variousdocuments with a single copy that is included in the collection, provided that youfollow the rules of this License for verbatim copying of each of the documents in allother respects.
You may extract a single document from such a collection, and distribute it individu-
ally under this License, provided you insert a copy of this License into the extracteddocument, and follow this License in all other respects regarding verbatim copying of that document.
7. AGGREGATION WITH INDEPENDENT WORKS
A compilation of the Document or its derivatives with other separate and independentdocuments or works, in or on a volume of a storage or distribution medium, does notas a whole count as a Modified Version of the Document, provided no compilationcopyright is claimed for the compilation. Such a compilation is called an “aggregate”,and this License does not apply to the other self-contained works thus compiled withthe Document, on account of their being thus compiled, if they are not themselvesderivative works of the Document.
If the Cover Text requirement of section 3 is applicable to these copies of the Document,then if the Document is less than one quarter of the entire aggregate, the Document’sCover Texts may be placed on covers that surround only the Document within theaggregate. Otherwise they must appear on covers around the whole aggregate.
8. TRANSLATION
Translation is considered a kind of modification, so you may distribute translations
of the Document under the terms of section 4. Replacing Invariant Sections withtranslations requires special permission from their copyright holders, but you mayinclude translations of some or all Invariant Sections in addition to the original versionsof these Invariant Sections. You may include a translation of this License provided thatyou also include the original English version of this License. In case of a disagreement

8/14/2019 Debugging With GDB - The GNU Source-Level Debugger
http://slidepdf.com/reader/full/debugging-with-gdb-the-gnu-source-level-debugger 317/328
306 Debugging with GDB
between the translation and the original English version of this License, the originalEnglish version will prevail.
9. TERMINATIONYou may not copy, modify, sublicense, or distribute the Document except as expresslyprovided for under this License. Any other attempt to copy, modify, sublicense ordistribute the Document is void, and will automatically terminate your rights underthis License. However, parties who have received copies, or rights, from you under thisLicense will not have their licenses terminated so long as such parties remain in fullcompliance.
10. FUTURE REVISIONS OF THIS LICENSE
The Free Software Foundation may publish new, revised versions of the GNU FreeDocumentation License from time to time. Such new versions will be similar in spiritto the present version, but may differ in detail to address new problems or concerns.See http://www.gnu.org/copyleft/.
Each version of the License is given a distinguishing version number. If the Documentspecifies that a particular numbered version of this License “or any later version”applies to it, you have the option of following the terms and conditions either of thatspecified version or of any later version that has been published (not as a draft) bythe Free Software Foundation. If the Document does not specify a version number of this License, you may choose any version ever published (not as a draft) by the Free
Software Foundation.
ADDENDUM: How to use this License for your documents
To use this License in a document you have written, include a copy of the License in thedocument and put the following copyright and license notices just after the title page:
Copyright (C) year your name .Permission is granted to copy, distribute and/or modify this documentunder the terms of the GNU Free Documentation License, Version 1.1
or any later version published by the Free Software Foundation;with the Invariant Sections being list their titles , with theFront-Cover Texts being list, and with the Back-Cover Texts being list.A copy of the license is included in the section entitled "GNUFree Documentation License."
If you have no Invariant Sections, write “with no Invariant Sections” instead of sayingwhich ones are invariant. If you have no Front-Cover Texts, write “no Front-Cover Texts”instead of “Front-Cover Texts being list”; likewise for Back-Cover Texts.
If your document contains nontrivial examples of program code, we recommend releasingthese examples in parallel under your choice of free software license, such as the GNU
General Public License, to permit their use in free software.

8/14/2019 Debugging With GDB - The GNU Source-Level Debugger
http://slidepdf.com/reader/full/debugging-with-gdb-the-gnu-source-level-debugger 318/328
Index 307
Index
## (a comment) . . . . . . . . . . . . . . . . . . . . . . . . . . . . . . . 17# in Modula-2 . . . . . . . . . . . . . . . . . . . . . . . . . . . . . . 112
$$ . . . . . . . . . . . . . . . . . . . . . . . . . . . . . . . . . . . . . . . . . . . 75$$ . . . . . . . . . . . . . . . . . . . . . . . . . . . . . . . . . . . . . . . . . . 75$_ and info breakpoints . . . . . . . . . . . . . . . . . . . . 36$_ and info line . . . . . . . . . . . . . . . . . . . . . . . . . . . . 60$_, $__, and value history . . . . . . . . . . . . . . . . . . . . 68$_, convenience variable . . . . . . . . . . . . . . . . . . . . . . 76
$__, convenience variable. . . . . . . . . . . . . . . . . . . . .
76$_exitcode, convenience variable . . . . . . . . . . . . . 76$bpnum, convenience variable . . . . . . . . . . . . . . . . . . 34$cdir, convenience variable . . . . . . . . . . . . . . . . . . . 59$cwdr, convenience variable . . . . . . . . . . . . . . . . . . . 59$tpnum . . . . . . . . . . . . . . . . . . . . . . . . . . . . . . . . . . . . . . 82$trace_file . . . . . . . . . . . . . . . . . . . . . . . . . . . . . . . . 88$trace_frame . . . . . . . . . . . . . . . . . . . . . . . . . . . . . . . 88$trace_func . . . . . . . . . . . . . . . . . . . . . . . . . . . . . . . . 88$trace_line . . . . . . . . . . . . . . . . . . . . . . . . . . . . . . . . 88$tracepoint . . . . . . . . . . . . . . . . . . . . . . . . . . . . . . . . 88
---annotate . . . . . . . . . . . . . . . . . . . . . . . . . . . . . . . . . 14--args . . . . . . . . . . . . . . . . . . . . . . . . . . . . . . . . . . . . . . 14--async . . . . . . . . . . . . . . . . . . . . . . . . . . . . . . . . . . . . . 14--batch . . . . . . . . . . . . . . . . . . . . . . . . . . . . . . . . . . . . . 13--baud . . . . . . . . . . . . . . . . . . . . . . . . . . . . . . . . . . . . . . 14--cd . . . . . . . . . . . . . . . . . . . . . . . . . . . . . . . . . . . . . . . . 14--command . . . . . . . . . . . . . . . . . . . . . . . . . . . . . . . . . . 12--core . . . . . . . . . . . . . . . . . . . . . . . . . . . . . . . . . . . . . . 12--directory . . . . . . . . . . . . . . . . . . . . . . . . . . . . . . . . 12--epoch . . . . . . . . . . . . . . . . . . . . . . . . . . . . . . . . . . . . . 14--exec
. . . . . . . . . . . . . . . . . . . . . . . . . . . . . . . . . . . . . .
12--fullname . . . . . . . . . . . . . . . . . . . . . . . . . . . . . . . . . 14--interpreter . . . . . . . . . . . . . . . . . . . . . . . . . . . . . . 15--mapped. . . . . . . . . . . . . . . . . . . . . . . . . . . . . . . . . . . . 12--noasync . . . . . . . . . . . . . . . . . . . . . . . . . . . . . . . . . . 14--nowindows . . . . . . . . . . . . . . . . . . . . . . . . . . . . . . . . 13--nx . . . . . . . . . . . . . . . . . . . . . . . . . . . . . . . . . . . . . . . . 13--pid . . . . . . . . . . . . . . . . . . . . . . . . . . . . . . . . . . . . . . . 12--quiet . . . . . . . . . . . . . . . . . . . . . . . . . . . . . . . . . . . . . 13--readnow . . . . . . . . . . . . . . . . . . . . . . . . . . . . . . . . . . 13--se . . . . . . . . . . . . . . . . . . . . . . . . . . . . . . . . . . . . . . . . 12--silent. . . . . . . . . . . . . . . . . . . . . . . . . . . . . . . . . . . . 13--statistics
. . . . . . . . . . . . . . . . . . . . . . . . . . . . . . .
15--symbols . . . . . . . . . . . . . . . . . . . . . . . . . . . . . . . . . . 12--tty . . . . . . . . . . . . . . . . . . . . . . . . . . . . . . . . . . . . . . . 14--tui . . . . . . . . . . . . . . . . . . . . . . . . . . . . . . . . . . . . . . . 14--version . . . . . . . . . . . . . . . . . . . . . . . . . . . . . . . . . . 15--windows . . . . . . . . . . . . . . . . . . . . . . . . . . . . . . . . . . 13
--write. . . . . . . . . . . . . . . . . . . . . . . . . . . . . . . . . . . . .
15-b . . . . . . . . . . . . . . . . . . . . . . . . . . . . . . . . . . . . . . . . . . 14-break-after . . . . . . . . . . . . . . . . . . . . . . . . . . . . . . 197-break-condition . . . . . . . . . . . . . . . . . . . . . . . . . . 197-break-delete . . . . . . . . . . . . . . . . . . . . . . . . . . . . . 198-break-disable . . . . . . . . . . . . . . . . . . . . . . . . . . . . 199-break-enable . . . . . . . . . . . . . . . . . . . . . . . . . . . . . 199-break-info . . . . . . . . . . . . . . . . . . . . . . . . . . . . . . . 200-break-insert . . . . . . . . . . . . . . . . . . . . . . . . . . . . . 200-break-list . . . . . . . . . . . . . . . . . . . . . . . . . . . . . . . 201-break-watch . . . . . . . . . . . . . . . . . . . . . . . . . . . . . . 203-c . . . . . . . . . . . . . . . . . . . . . . . . . . . . . . . . . . . . . . . . . . 12
-d. . . . . . . . . . . . . . . . . . . . . . . . . . . . . . . . . . . . . . . . . .
12-data-disassemble . . . . . . . . . . . . . . . . . . . . . . . . . 205-data-evaluate-expression . . . . . . . . . . . . . . . . 207-data-list-changed-registers . . . . . . . . . . . . . 208-data-list-register-names . . . . . . . . . . . . . . . . 208-data-list-register-values . . . . . . . . . . . . . . . 209-data-read-memory . . . . . . . . . . . . . . . . . . . . . . . . . 211-display-delete . . . . . . . . . . . . . . . . . . . . . . . . . . . 212-display-disable . . . . . . . . . . . . . . . . . . . . . . . . . . 213-display-enable . . . . . . . . . . . . . . . . . . . . . . . . . . . 213-display-insert . . . . . . . . . . . . . . . . . . . . . . . . . . . 213-display-list . . . . . . . . . . . . . . . . . . . . . . . . . . . . . 214
-e. . . . . . . . . . . . . . . . . . . . . . . . . . . . . . . . . . . . . . . . . .
12-environment-cd . . . . . . . . . . . . . . . . . . . . . . . . . . . 214-environment-directory . . . . . . . . . . . . . . . . . . . 214-environment-path . . . . . . . . . . . . . . . . . . . . . . . . . 215-environment-pwd . . . . . . . . . . . . . . . . . . . . . . . . . . 215-exec-abort . . . . . . . . . . . . . . . . . . . . . . . . . . . . . . . 216-exec-arguments . . . . . . . . . . . . . . . . . . . . . . . . . . . 216-exec-continue . . . . . . . . . . . . . . . . . . . . . . . . . . . . 217-exec-finish . . . . . . . . . . . . . . . . . . . . . . . . . . . . . . 217-exec-interrupt . . . . . . . . . . . . . . . . . . . . . . . . . . . 218-exec-next . . . . . . . . . . . . . . . . . . . . . . . . . . . . . . . . 219-exec-next-instruction . . . . . . . . . . . . . . . . . . . 219-exec-return . . . . . . . . . . . . . . . . . . . . . . . . . . . . . . 220-exec-run
. . . . . . . . . . . . . . . . . . . . . . . . . . . . . . . . .220
-exec-show-arguments. . . . . . . . . . . . . . . . . . . . . . 221-exec-step . . . . . . . . . . . . . . . . . . . . . . . . . . . . . . . . 221-exec-step-instruction . . . . . . . . . . . . . . . . . . . 222-exec-until . . . . . . . . . . . . . . . . . . . . . . . . . . . . . . . 222-f . . . . . . . . . . . . . . . . . . . . . . . . . . . . . . . . . . . . . . . . . . 14-file-exec-and-symbols . . . . . . . . . . . . . . . . . . . 223-file-exec-file . . . . . . . . . . . . . . . . . . . . . . . . . . . 223-file-list-exec-sections . . . . . . . . . . . . . . . . . 224-file-list-exec-source-files . . . . . . . . . . . . . 224-file-list-shared-libraries . . . . . . . . . . . . . . 224-file-list-symbol-files . . . . . . . . . . . . . . . . . . 225-file-symbol-file
. . . . . . . . . . . . . . . . . . . . . . . . .
225-gdb-exit . . . . . . . . . . . . . . . . . . . . . . . . . . . . . . . . . 225-gdb-set . . . . . . . . . . . . . . . . . . . . . . . . . . . . . . . . . . 226-gdb-show . . . . . . . . . . . . . . . . . . . . . . . . . . . . . . . . . 226-gdb-version . . . . . . . . . . . . . . . . . . . . . . . . . . . . . . 227-m . . . . . . . . . . . . . . . . . . . . . . . . . . . . . . . . . . . . . . . . . . 12

8/14/2019 Debugging With GDB - The GNU Source-Level Debugger
http://slidepdf.com/reader/full/debugging-with-gdb-the-gnu-source-level-debugger 319/328
308 Debugging with GDB
-n . . . . . . . . . . . . . . . . . . . . . . . . . . . . . . . . . . . . . . . . . . 13-nw . . . . . . . . . . . . . . . . . . . . . . . . . . . . . . . . . . . . . . . . . 13-p . . . . . . . . . . . . . . . . . . . . . . . . . . . . . . . . . . . . . . . . . . 12-q . . . . . . . . . . . . . . . . . . . . . . . . . . . . . . . . . . . . . . . . . . 13
-r. . . . . . . . . . . . . . . . . . . . . . . . . . . . . . . . . . . . . . . . . .
13-s . . . . . . . . . . . . . . . . . . . . . . . . . . . . . . . . . . . . . . . . . . 12-stack-info-depth . . . . . . . . . . . . . . . . . . . . . . . . . 227-stack-info-frame . . . . . . . . . . . . . . . . . . . . . . . . . 227-stack-list-arguments . . . . . . . . . . . . . . . . . . . . 228-stack-list-frames . . . . . . . . . . . . . . . . . . . . . . . . 230-stack-list-locals . . . . . . . . . . . . . . . . . . . . . . . . 231-stack-select-frame. . . . . . . . . . . . . . . . . . . . . . . 232-symbol-info-address. . . . . . . . . . . . . . . . . . . . . . 232-symbol-info-file . . . . . . . . . . . . . . . . . . . . . . . . . 232-symbol-info-function . . . . . . . . . . . . . . . . . . . . 233-symbol-info-line . . . . . . . . . . . . . . . . . . . . . . . . . 233
-symbol-info-symbol. . . . . . . . . . . . . . . . . . . . . . .
233-symbol-list-functions . . . . . . . . . . . . . . . . . . . 234-symbol-list-types . . . . . . . . . . . . . . . . . . . . . . . . 234-symbol-list-variables . . . . . . . . . . . . . . . . . . . 234-symbol-locate . . . . . . . . . . . . . . . . . . . . . . . . . . . . 234-symbol-type . . . . . . . . . . . . . . . . . . . . . . . . . . . . . . 235-t . . . . . . . . . . . . . . . . . . . . . . . . . . . . . . . . . . . . . . . . . . 14-target-attach . . . . . . . . . . . . . . . . . . . . . . . . . . . . 235-target-compare-sections . . . . . . . . . . . . . . . . . 235-target-detach . . . . . . . . . . . . . . . . . . . . . . . . . . . . 236-target-download . . . . . . . . . . . . . . . . . . . . . . . . . . 236-target-exec-status. . . . . . . . . . . . . . . . . . . . . . . 238
-target-list-available-targets. . . . . . . . . . .
238-target-list-current-targets . . . . . . . . . . . . . 239-target-list-parameters . . . . . . . . . . . . . . . . . . 239-target-select . . . . . . . . . . . . . . . . . . . . . . . . . . . . 239-thread-info . . . . . . . . . . . . . . . . . . . . . . . . . . . . . . 240-thread-list-all-threads . . . . . . . . . . . . . . . . . 240-thread-list-ids . . . . . . . . . . . . . . . . . . . . . . . . . . 240-thread-select . . . . . . . . . . . . . . . . . . . . . . . . . . . . 241-var-assign . . . . . . . . . . . . . . . . . . . . . . . . . . . . . . . 245-var-create . . . . . . . . . . . . . . . . . . . . . . . . . . . . . . . 243-var-delete . . . . . . . . . . . . . . . . . . . . . . . . . . . . . . . 243-var-evaluate-expression . . . . . . . . . . . . . . . . . 245-var-info-expression
. . . . . . . . . . . . . . . . . . . . . .
245-var-info-num-children . . . . . . . . . . . . . . . . . . . 244-var-info-type . . . . . . . . . . . . . . . . . . . . . . . . . . . . 244-var-list-children . . . . . . . . . . . . . . . . . . . . . . . . 244-var-set-format . . . . . . . . . . . . . . . . . . . . . . . . . . . 244-var-show-attributes. . . . . . . . . . . . . . . . . . . . . . 245-var-show-format . . . . . . . . . . . . . . . . . . . . . . . . . . 244-var-update . . . . . . . . . . . . . . . . . . . . . . . . . . . . . . . 245-w . . . . . . . . . . . . . . . . . . . . . . . . . . . . . . . . . . . . . . . . . . 13-x . . . . . . . . . . . . . . . . . . . . . . . . . . . . . . . . . . . . . . . . . . 12
.
., Modula-2 scope operator . . . . . . . . . . . . . . . . . . 111‘.esgdbinit’ . . . . . . . . . . . . . . . . . . . . . . . . . . . . . . . 173‘.gdbinit’ . . . . . . . . . . . . . . . . . . . . . . . . . . . . . . . . . 173‘.o’ files, reading symbols from . . . . . . . . . . . . . . 129‘.os68gdbinit’ . . . . . . . . . . . . . . . . . . . . . . . . . . . . . 173
‘.vxgdbinit’ . . . . . . . . . . . . . . . . . . . . . . . . . . . . . . . 173
//proc
. . . . . . . . . . . . . . . . . . . . . . . . . . . . . . . . . . . . . .
147
:::, context for variables/functions . . . . . . . . . . . . 64::, in Modula-2 . . . . . . . . . . . . . . . . . . . . . . . . . . . . 111
@@, referencing memory as an array . . . . . . . . . . . . . 65
^^done . . . . . . . . . . . . . . . . . . . . . . . . . . . . . . . . . . . . . . 195^error . . . . . . . . . . . . . . . . . . . . . . . . . . . . . . . . . . . . . 195^running . . . . . . . . . . . . . . . . . . . . . . . . . . . . . . . . . . 195
‘“No symbol "foo" in current context” . . . . . . . . . 65
{{type }
. . . . . . . . . . . . . . . . . . . . . . . . . . . . . . . . . . . . . .
64
Aa.out and C++ . . . . . . . . . . . . . . . . . . . . . . . . . . . . . . 104abbreviation. . . . . . . . . . . . . . . . . . . . . . . . . . . . . . . . . 17abort (C-g) . . . . . . . . . . . . . . . . . . . . . . . . . . . . . . . . 267accept-line (Newline, Return) . . . . . . . . . . . . . 262acknowledgment, for GDB remote . . . . . . . . . . . . 281actions . . . . . . . . . . . . . . . . . . . . . . . . . . . . . . . . . . . . . 83active targets . . . . . . . . . . . . . . . . . . . . . . . . . . . . . . . 135add-shared-symbol-file . . . . . . . . . . . . . . . . . . . 130add-symbol-file
. . . . . . . . . . . . . . . . . . . . . . . . . . .
129address of a symbol . . . . . . . . . . . . . . . . . . . . . . . . . 119Alpha stack . . . . . . . . . . . . . . . . . . . . . . . . . . . . . . . . 163AMD 29K register stack . . . . . . . . . . . . . . . . . . . . . 163annotations . . . . . . . . . . . . . . . . . . . . . . . . . . . . . . . . 183annotations for breakpoints . . . . . . . . . . . . . . . . . . 188annotations for display . . . . . . . . . . . . . . . . . . . . . . 187annotations for errors, warnings and interrupts
. . . . . . . . . . . . . . . . . . . . . . . . . . . . . . . . . . . . . . . 188annotations for frames . . . . . . . . . . . . . . . . . . . . . . 185annotations for invalidation messages . . . . . . . . . 189annotations for prompts . . . . . . . . . . . . . . . . . . . . . 187annotations for running programs
. . . . . . . . . . . .
189annotations for source display . . . . . . . . . . . . . . . 190annotations for values . . . . . . . . . . . . . . . . . . . . . . . 184apropos . . . . . . . . . . . . . . . . . . . . . . . . . . . . . . . . . . . . . 20arg-begin . . . . . . . . . . . . . . . . . . . . . . . . . . . . . . . . . 184arg-end. . . . . . . . . . . . . . . . . . . . . . . . . . . . . . . . . . . . 184
8/14/2019 Debugging With GDB - The GNU Source-Level Debugger
http://slidepdf.com/reader/full/debugging-with-gdb-the-gnu-source-level-debugger 320/328
Index 309
arg-name-end . . . . . . . . . . . . . . . . . . . . . . . . . . . . . . 184
arg-value . . . . . . . . . . . . . . . . . . . . . . . . . . . . . . . . . 184
arguments (to your program) . . . . . . . . . . . . . . . . . 24
array-section-end . . . . . . . . . . . . . . . . . . . . . . . . . 185
artificial array . . . . . . . . . . . . . . . . . . . . . . . . . . . . . . . 65
assembly instructions . . . . . . . . . . . . . . . . . . . . . . . . 60
assignment . . . . . . . . . . . . . . . . . . . . . . . . . . . . . . . . . 123
async output in gdb/mi . . . . . . . . . . . . . . . . . . . . . 193
AT&T disassembly flavor . . . . . . . . . . . . . . . . . . . . . 60
attach . . . . . . . . . . . . . . . . . . . . . . . . . . . . . . . . . . . . . . 27
automatic display . . . . . . . . . . . . . . . . . . . . . . . . . . . . 68
automatic overlay debugging . . . . . . . . . . . . . . . . . . 94
automatic thread selection. . . . . . . . . . . . . . . . . . . . 30
awatch . . . . . . . . . . . . . . . . . . . . . . . . . . . . . . . . . . . . . . 37
Bb (break) . . . . . . . . . . . . . . . . . . . . . . . . . . . . . . . . . . . 34
backtrace . . . . . . . . . . . . . . . . . . . . . . . . . . . . . . . . . . 54
backtraces. . . . . . . . . . . . . . . . . . . . . . . . . . . . . . . . . . . 54
backward-char (C-b) . . . . . . . . . . . . . . . . . . . . . . . 262
backward-delete-char (Rubout) . . . . . . . . . . . . 264
backward-kill-line (C-x Rubout) . . . . . . . . . . 264
backward-kill-word (M-DEL) . . . . . . . . . . . . . . . 265
backward-word (M-b) . . . . . . . . . . . . . . . . . . . . . . . 262
beginning-of-history (M-<). . . . . . . . . . . . . . .
263
beginning-of-line (C-a) . . . . . . . . . . . . . . . . . . . 262
bell-style . . . . . . . . . . . . . . . . . . . . . . . . . . . . . . . . 254
break . . . . . . . . . . . . . . . . . . . . . . . . . . . . . . . . . . . . . . . 34
break ... thread threadno . . . . . . . . . . . . . . . . . . . 50
break in overloaded functions . . . . . . . . . . . . . . . . 106
breakpoint . . . . . . . . . . . . . . . . . . . . . . . . . . . . . . . . 190
breakpoint commands . . . . . . . . . . . . . . . . . . . . . . . . 43
breakpoint commands for gdb/mi . . . . . . . . . . . . 197
breakpoint conditions . . . . . . . . . . . . . . . . . . . . . . . . 42
breakpoint numbers. . . . . . . . . . . . . . . . . . . . . . . . . .
33breakpoint on events . . . . . . . . . . . . . . . . . . . . . . . . . 33
breakpoint on memory address . . . . . . . . . . . . . . . . 33
breakpoint on variable modification . . . . . . . . . . . 33
breakpoint ranges . . . . . . . . . . . . . . . . . . . . . . . . . . . . 33
breakpoint subroutine, remote . . . . . . . . . . . . . . 142
breakpoints . . . . . . . . . . . . . . . . . . . . . . . . . . . . . . . . . 33
breakpoints and threads . . . . . . . . . . . . . . . . . . . . . . 50
breakpoints in overlays . . . . . . . . . . . . . . . . . . . . . . . 94
breakpoints-headers. . . . . . . . . . . . . . . . . . . . . . . 188
breakpoints-invalid. . . . . . . . . . . . . . . . . . . . . . . 189
breakpoints-table. . . . . . . . . . . . . . . . . . . . . . . . .
188breakpoints-table-end . . . . . . . . . . . . . . . . . . . . 189
bt (backtrace) . . . . . . . . . . . . . . . . . . . . . . . . . . . . . . 54
bug criteria . . . . . . . . . . . . . . . . . . . . . . . . . . . . . . . . 247
bug reports . . . . . . . . . . . . . . . . . . . . . . . . . . . . . . . . 247
bugs in GDB . . . . . . . . . . . . . . . . . . . . . . . . . . . . . . . 247
Cc (continue) . . . . . . . . . . . . . . . . . . . . . . . . . . . . . . . . 46C and C++ . . . . . . . . . . . . . . . . . . . . . . . . . . . . . . . . . 102C and C++ checks . . . . . . . . . . . . . . . . . . . . . . . . . . . 105C and C++ constants
. . . . . . . . . . . . . . . . . . . . . . . .
104C and C++ defaults . . . . . . . . . . . . . . . . . . . . . . . . . 105C and C++ operators . . . . . . . . . . . . . . . . . . . . . . . . 102C++ . . . . . . . . . . . . . . . . . . . . . . . . . . . . . . . . . . . . . . . 102C++ and object formats . . . . . . . . . . . . . . . . . . . . . 104C++ exception handling . . . . . . . . . . . . . . . . . . . . . 106C++ scope resolution . . . . . . . . . . . . . . . . . . . . . . . . . 64C++ support, not in coff . . . . . . . . . . . . . . . . . . . 104C++ symbol decoding style . . . . . . . . . . . . . . . . . . . 73C++ symbol display . . . . . . . . . . . . . . . . . . . . . . . . . 106C-L . . . . . . . . . . . . . . . . . . . . . . . . . . . . . . . . . . . . . . . . 178C-o (operate-and-get-next) . . . . . . . . . . . . . . . . . . . 17C-x 1
. . . . . . . . . . . . . . . . . . . . . . . . . . . . . . . . . . . . . .
178C-x 2 . . . . . . . . . . . . . . . . . . . . . . . . . . . . . . . . . . . . . . 178C-x a . . . . . . . . . . . . . . . . . . . . . . . . . . . . . . . . . . . . . . 178C-x A . . . . . . . . . . . . . . . . . . . . . . . . . . . . . . . . . . . . . . 178C-x C-a . . . . . . . . . . . . . . . . . . . . . . . . . . . . . . . . . . . . 177call . . . . . . . . . . . . . . . . . . . . . . . . . . . . . . . . . . . . . . . 126call overloaded functions . . . . . . . . . . . . . . . . . . . . 104call stack . . . . . . . . . . . . . . . . . . . . . . . . . . . . . . . . . . . . 53call-last-kbd-macro (C-x e) . . . . . . . . . . . . . . . 266calling functions . . . . . . . . . . . . . . . . . . . . . . . . . . . . 126calling make . . . . . . . . . . . . . . . . . . . . . . . . . . . . . . . . . 16capitalize-word (M-c) . . . . . . . . . . . . . . . . . . . . . 264casts, to view memory
. . . . . . . . . . . . . . . . . . . . . . .
64catch . . . . . . . . . . . . . . . . . . . . . . . . . . . . . . . . . . . . . . . 39catch catch . . . . . . . . . . . . . . . . . . . . . . . . . . . . . . . . . 39catch exceptions, list active handlers . . . . . . . . . . 56catch exec . . . . . . . . . . . . . . . . . . . . . . . . . . . . . . . . . . 39catch fork . . . . . . . . . . . . . . . . . . . . . . . . . . . . . . . . . . 39catch load . . . . . . . . . . . . . . . . . . . . . . . . . . . . . . . . . . 39catch throw . . . . . . . . . . . . . . . . . . . . . . . . . . . . . . . . . 39catch unload . . . . . . . . . . . . . . . . . . . . . . . . . . . . . . . . 39catch vfork . . . . . . . . . . . . . . . . . . . . . . . . . . . . . . . . . 39catchpoints. . . . . . . . . . . . . . . . . . . . . . . . . . . . . . . . . . 33catchpoints, setting . . . . . . . . . . . . . . . . . . . . . . . . . . 39cd
. . . . . . . . . . . . . . . . . . . . . . . . . . . . . . . . . . . . . . . . . .
26cdir . . . . . . . . . . . . . . . . . . . . . . . . . . . . . . . . . . . . . . . . 59character-search (C-]) . . . . . . . . . . . . . . . . . . . . 267character-search-backward (M-C-]) . . . . . . . . 267checks, range . . . . . . . . . . . . . . . . . . . . . . . . . . . . . . . 100checks, type . . . . . . . . . . . . . . . . . . . . . . . . . . . . . . . . . 99checksum, for GDB remote . . . . . . . . . . . . . . . . . . 281Chill . . . . . . . . . . . . . . . . . . . . . . . . . . . . . . . . . . . . . . . . . 1choosing target byte order . . . . . . . . . . . . . . . . . . . 137clear . . . . . . . . . . . . . . . . . . . . . . . . . . . . . . . . . . . . . . . 40clear-screen (C-l) . . . . . . . . . . . . . . . . . . . . . . . . 262clearing breakpoints, watchpoints, catchpoints . . 40coff versus C++
. . . . . . . . . . . . . . . . . . . . . . . . . . . .
104collect (tracepoints) . . . . . . . . . . . . . . . . . . . . . . . . 83collected data discarded . . . . . . . . . . . . . . . . . . . . . . 85colon, doubled as scope operator . . . . . . . . . . . . . 111colon-colon, context for variables/functions . . . . 64command editing . . . . . . . . . . . . . . . . . . . . . . . . . . . 251

8/14/2019 Debugging With GDB - The GNU Source-Level Debugger
http://slidepdf.com/reader/full/debugging-with-gdb-the-gnu-source-level-debugger 321/328
310 Debugging with GDB
command files . . . . . . . . . . . . . . . . . . . . . . . . . . . . . . 173command hooks . . . . . . . . . . . . . . . . . . . . . . . . . . . . 172command line editing . . . . . . . . . . . . . . . . . . . . . . . 165commands . . . . . . . . . . . . . . . . . . . . . . . . . . . . . . . 43, 187
commands for C++. . . . . . . . . . . . . . . . . . . . . . . . . .
106commands to STDBUG (ST2000) . . . . . . . . . . . . 162comment . . . . . . . . . . . . . . . . . . . . . . . . . . . . . . . . . . . . 17comment-begin . . . . . . . . . . . . . . . . . . . . . . . . . . . . . 254compatibility, gdb/mi and CLI . . . . . . . . . . . . . . 195compilation directory . . . . . . . . . . . . . . . . . . . . . . . . 59compiling, on Sparclet . . . . . . . . . . . . . . . . . . . . . . 160complete. . . . . . . . . . . . . . . . . . . . . . . . . . . . . . . . . . . . 20complete (TAB) . . . . . . . . . . . . . . . . . . . . . . . . . . . . 266completion . . . . . . . . . . . . . . . . . . . . . . . . . . . . . . . . . . 17completion of quoted strings . . . . . . . . . . . . . . . . . . 18completion-query-items . . . . . . . . . . . . . . . . . . . 255
condition. . . . . . . . . . . . . . . . . . . . . . . . . . . . . . . . . .
42conditional breakpoints . . . . . . . . . . . . . . . . . . . . . . 42configuring GDB . . . . . . . . . . . . . . . . . . . . . . . . . . . 275confirmation . . . . . . . . . . . . . . . . . . . . . . . . . . . . . . . 168connect (to STDBUG) . . . . . . . . . . . . . . . . . . . . . . 162console output in gdb/mi . . . . . . . . . . . . . . . . . . . 193continue. . . . . . . . . . . . . . . . . . . . . . . . . . . . . . . . . . . . 46continuing . . . . . . . . . . . . . . . . . . . . . . . . . . . . . . . . . . . 45continuing threads . . . . . . . . . . . . . . . . . . . . . . . . . . . 50control C, and remote debugging . . . . . . . . . . . . . 143controlling terminal . . . . . . . . . . . . . . . . . . . . . . . . . . 26convenience variables . . . . . . . . . . . . . . . . . . . . . . . . . 76
convenience variables for tracepoints. . . . . . . . . .
88convert-meta . . . . . . . . . . . . . . . . . . . . . . . . . . . . . . 255copy-backward-word () . . . . . . . . . . . . . . . . . . . . . 265copy-forward-word () . . . . . . . . . . . . . . . . . . . . . . 265copy-region-as-kill () . . . . . . . . . . . . . . . . . . . . 265core . . . . . . . . . . . . . . . . . . . . . . . . . . . . . . . . . . . . . . . 128core dump file . . . . . . . . . . . . . . . . . . . . . . . . . . . . . . 127core-file . . . . . . . . . . . . . . . . . . . . . . . . . . . . . . . . . 128crash of debugger . . . . . . . . . . . . . . . . . . . . . . . . . . . 247current directory . . . . . . . . . . . . . . . . . . . . . . . . . . . . . 59current stack frame . . . . . . . . . . . . . . . . . . . . . . . . . . 54current thread . . . . . . . . . . . . . . . . . . . . . . . . . . . . . . . 28
cwd. . . . . . . . . . . . . . . . . . . . . . . . . . . . . . . . . . . . . . . . .
59Cygwin-specific commands . . . . . . . . . . . . . . . . . . 149
Dd (delete) . . . . . . . . . . . . . . . . . . . . . . . . . . . . . . . . . . 40data manipulation, in gdb/mi . . . . . . . . . . . . . . . 205debugger crash . . . . . . . . . . . . . . . . . . . . . . . . . . . . . 247debugging optimized code . . . . . . . . . . . . . . . . . . . . 23debugging stub, example . . . . . . . . . . . . . . . . . . . . 141debugging target . . . . . . . . . . . . . . . . . . . . . . . . . . . 135define . . . . . . . . . . . . . . . . . . . . . . . . . . . . . . . . . . . . . 171delete
. . . . . . . . . . . . . . . . . . . . . . . . . . . . . . . . . . . . . .
40delete breakpoints . . . . . . . . . . . . . . . . . . . . . . . . . . . 40delete display . . . . . . . . . . . . . . . . . . . . . . . . . . . . . 69delete mem . . . . . . . . . . . . . . . . . . . . . . . . . . . . . . . . . . 78delete tracepoint . . . . . . . . . . . . . . . . . . . . . . . . . . 82delete-char (C-d) . . . . . . . . . . . . . . . . . . . . . . . . . 263
delete-char-or-list () . . . . . . . . . . . . . . . . . . . . 266
delete-horizontal-space () . . . . . . . . . . . . . . . 265
deleting breakpoints, watchpoints, catchpoints. . . . . . . . . . . . . . . . . . . . . . . . . . . . . . . . . . . . . . . . 40
demangling. . . . . . . . . . . . . . . . . . . . . . . . . . . . . . . . . .
73
descriptor tables display . . . . . . . . . . . . . . . . . . . . . 147
detach . . . . . . . . . . . . . . . . . . . . . . . . . . . . . . . . . . . . . . 27
device . . . . . . . . . . . . . . . . . . . . . . . . . . . . . . . . . . . . . 153
digit-argument (M-0, M-1, ... M--) . . . . . . . . 265
dir . . . . . . . . . . . . . . . . . . . . . . . . . . . . . . . . . . . . . . . . . 59
direct memory access (DMA) on MS-DOS . . . . 148
directories for source files . . . . . . . . . . . . . . . . . . . . . 59
directory . . . . . . . . . . . . . . . . . . . . . . . . . . . . . . . . . . 59
directory, compilation . . . . . . . . . . . . . . . . . . . . . . . . 59
directory, current . . . . . . . . . . . . . . . . . . . . . . . . . . . . 59
dis (disable) . . . . . . . . . . . . . . . . . . . . . . . . . . . . . . . 41
disable . . . . . . . . . . . . . . . . . . . . . . . . . . . . . . . . . . . . . 41
disable breakpoints . . . . . . . . . . . . . . . . . . . . . . . . 41
disable display . . . . . . . . . . . . . . . . . . . . . . . . . . . . 69
disable mem . . . . . . . . . . . . . . . . . . . . . . . . . . . . . . . . . 78
disable tracepoint . . . . . . . . . . . . . . . . . . . . . . . . . 82
disable-completion. . . . . . . . . . . . . . . . . . . . . . . . 255
disassemble . . . . . . . . . . . . . . . . . . . . . . . . . . . . . . . . 60
display . . . . . . . . . . . . . . . . . . . . . . . . . . . . . . . . . . . . . 69
display of expressions . . . . . . . . . . . . . . . . . . . . . . . . 68
display-begin. . . . . . . . . . . . . . . . . . . . . . . . . . . . .
187display-end . . . . . . . . . . . . . . . . . . . . . . . . . . . . . . . 187
display-expression. . . . . . . . . . . . . . . . . . . . . . . . 187
display-expression-end . . . . . . . . . . . . . . . . . . . 187
display-format . . . . . . . . . . . . . . . . . . . . . . . . . . . . 187
display-number-end. . . . . . . . . . . . . . . . . . . . . . . . 187
display-value . . . . . . . . . . . . . . . . . . . . . . . . . . . . . 187
djgpp debugging . . . . . . . . . . . . . . . . . . . . . . . . . . . 147
dll-symbols . . . . . . . . . . . . . . . . . . . . . . . . . . . . . . . 149
do (down) . . . . . . . . . . . . . . . . . . . . . . . . . . . . . . . . . . . 55
do-uppercase-version (M-a, M-b, M-x , ...). . . . . . . . . . . . . . . . . . . . . . . . . . . . . . . . . . . . . . .
267document . . . . . . . . . . . . . . . . . . . . . . . . . . . . . . . . . . 171
documentation . . . . . . . . . . . . . . . . . . . . . . . . . . . . . 273
down . . . . . . . . . . . . . . . . . . . . . . . . . . . . . . . . . . . . . . . . 55
Down . . . . . . . . . . . . . . . . . . . . . . . . . . . . . . . . . . . . . . . 178
down-silently . . . . . . . . . . . . . . . . . . . . . . . . . . . . . . 55
downcase-word (M-l) . . . . . . . . . . . . . . . . . . . . . . . 264
download to H8/300 or H8/500 . . . . . . . . . . . . . . 153
download to Hitachi SH . . . . . . . . . . . . . . . . . . . . . 153
download to Nindy-960 . . . . . . . . . . . . . . . . . . . . . . 155
download to Sparclet . . . . . . . . . . . . . . . . . . . . . . . . 161
download to VxWorks. . . . . . . . . . . . . . . . . . . . . . .
151dump all data collected at tracepoint . . . . . . . . . . 87
dump-functions () . . . . . . . . . . . . . . . . . . . . . . . . . 267
dump-macros () . . . . . . . . . . . . . . . . . . . . . . . . . . . . 268
dump-variables () . . . . . . . . . . . . . . . . . . . . . . . . . 268
dynamic linking . . . . . . . . . . . . . . . . . . . . . . . . . . . . 129

8/14/2019 Debugging With GDB - The GNU Source-Level Debugger
http://slidepdf.com/reader/full/debugging-with-gdb-the-gnu-source-level-debugger 322/328
Index 311
Eecho . . . . . . . . . . . . . . . . . . . . . . . . . . . . . . . . . . . . . . . 174ecoff and C++ . . . . . . . . . . . . . . . . . . . . . . . . . . . . . 104editing . . . . . . . . . . . . . . . . . . . . . . . . . . . . . . . . . . . . . 165editing command lines
. . . . . . . . . . . . . . . . . . . . . .
251editing-mode . . . . . . . . . . . . . . . . . . . . . . . . . . . . . . 255elf/dwarf and C++ . . . . . . . . . . . . . . . . . . . . . . . . 104elf/stabs and C++. . . . . . . . . . . . . . . . . . . . . . . . . . 104else . . . . . . . . . . . . . . . . . . . . . . . . . . . . . . . . . . . . . . . 171elt . . . . . . . . . . . . . . . . . . . . . . . . . . . . . . . . . . . . . . . . 185elt-rep. . . . . . . . . . . . . . . . . . . . . . . . . . . . . . . . . . . . 185elt-rep-end . . . . . . . . . . . . . . . . . . . . . . . . . . . . . . . 185Emacs . . . . . . . . . . . . . . . . . . . . . . . . . . . . . . . . . . . . . 181enable . . . . . . . . . . . . . . . . . . . . . . . . . . . . . . . . . . . . . . 41enable breakpoints . . . . . . . . . . . . . . . . . . . . . . . . . 41enable display . . . . . . . . . . . . . . . . . . . . . . . . . . . . . 69enable mem
. . . . . . . . . . . . . . . . . . . . . . . . . . . . . . . . . .
79enable tracepoint . . . . . . . . . . . . . . . . . . . . . . . . . . 82enable-keypad . . . . . . . . . . . . . . . . . . . . . . . . . . . . . 255end . . . . . . . . . . . . . . . . . . . . . . . . . . . . . . . . . . . . . . . . . 43end-kbd-macro (C-x )) . . . . . . . . . . . . . . . . . . . . . 266end-of-history (M->) . . . . . . . . . . . . . . . . . . . . . . 263end-of-line (C-e) . . . . . . . . . . . . . . . . . . . . . . . . . 262entering numbers . . . . . . . . . . . . . . . . . . . . . . . . . . . 167environment (of your program) . . . . . . . . . . . . . . . 25error . . . . . . . . . . . . . . . . . . . . . . . . . . . . . . . . . . . . . . 188error on valid input . . . . . . . . . . . . . . . . . . . . . . . . . 247error-begin . . . . . . . . . . . . . . . . . . . . . . . . . . . . . . . 188event designators
. . . . . . . . . . . . . . . . . . . . . . . . . . .
269event handling . . . . . . . . . . . . . . . . . . . . . . . . . . . . . . . 39examining data . . . . . . . . . . . . . . . . . . . . . . . . . . . . . . 63examining memory . . . . . . . . . . . . . . . . . . . . . . . . . . . 67exception handlers . . . . . . . . . . . . . . . . . . . . . . . . . . . 39exception handlers, how to list . . . . . . . . . . . . . . . . 56exceptionHandler . . . . . . . . . . . . . . . . . . . . . . . . . . 143exchange-point-and-mark (C-x C-x) . . . . . . . . 267exec-file . . . . . . . . . . . . . . . . . . . . . . . . . . . . . . . . . 127executable file . . . . . . . . . . . . . . . . . . . . . . . . . . . . . . 127exited . . . . . . . . . . . . . . . . . . . . . . . . . . . . . . . . . . . . . 189exiting GDB . . . . . . . . . . . . . . . . . . . . . . . . . . . . . . . . 15expand-tilde
. . . . . . . . . . . . . . . . . . . . . . . . . . . . . .
255expressions . . . . . . . . . . . . . . . . . . . . . . . . . . . . . . . . . . 63expressions in C or C++ . . . . . . . . . . . . . . . . . . . . . 102expressions in C++ . . . . . . . . . . . . . . . . . . . . . . . . . . 104expressions in Modula-2 . . . . . . . . . . . . . . . . . . . . . 107
Ff (frame) . . . . . . . . . . . . . . . . . . . . . . . . . . . . . . . . . . . 55fatal signal . . . . . . . . . . . . . . . . . . . . . . . . . . . . . . . . . 247fatal signals . . . . . . . . . . . . . . . . . . . . . . . . . . . . . . . . . 48fg (resume foreground execution) . . . . . . . . . . . . . 46field
. . . . . . . . . . . . . . . . . . . . . . . . . . . . . . . . . . . . . .
188field-begin . . . . . . . . . . . . . . . . . . . . . . . . . . . . . . . 184field-end . . . . . . . . . . . . . . . . . . . . . . . . . . . . . . . . . 184field-name-end . . . . . . . . . . . . . . . . . . . . . . . . . . . . 184field-value . . . . . . . . . . . . . . . . . . . . . . . . . . . . . . . 184file . . . . . . . . . . . . . . . . . . . . . . . . . . . . . . . . . . . . . . . 127
find trace snapshot . . . . . . . . . . . . . . . . . . . . . . . . . . . 85finish . . . . . . . . . . . . . . . . . . . . . . . . . . . . . . . . . . . . . . 47flinching . . . . . . . . . . . . . . . . . . . . . . . . . . . . . . . . . . . 168floating point . . . . . . . . . . . . . . . . . . . . . . . . . . . . . . . . 78
floating point registers. . . . . . . . . . . . . . . . . . . . . . .
77floating point, MIPS remote . . . . . . . . . . . . . . . . . 158flush_i_cache . . . . . . . . . . . . . . . . . . . . . . . . . . . . . 143focus . . . . . . . . . . . . . . . . . . . . . . . . . . . . . . . . . . . . . . 179focus of debugging . . . . . . . . . . . . . . . . . . . . . . . . . . . 28foo . . . . . . . . . . . . . . . . . . . . . . . . . . . . . . . . . . . . . . . . 133fork, debugging programs which call . . . . . . . . . . . 30format options . . . . . . . . . . . . . . . . . . . . . . . . . . . . . . . 70formatted output . . . . . . . . . . . . . . . . . . . . . . . . . . . . 66Fortran . . . . . . . . . . . . . . . . . . . . . . . . . . . . . . . . . . . . . . 1forward-backward-delete-char () . . . . . . . . . . 264forward-char (C-f) . . . . . . . . . . . . . . . . . . . . . . . . 262
forward-search. . . . . . . . . . . . . . . . . . . . . . . . . . . . .
58forward-search-history (C-s) . . . . . . . . . . . . . 263forward-word (M-f) . . . . . . . . . . . . . . . . . . . . . . . . 262frame number . . . . . . . . . . . . . . . . . . . . . . . . . . . . . . . 53frame pointer . . . . . . . . . . . . . . . . . . . . . . . . . . . . . . . . 53frame, command . . . . . . . . . . . . . . . . . . . . . . . . . . . . . 54frame, definition . . . . . . . . . . . . . . . . . . . . . . . . . . . . . 53frame, selecting . . . . . . . . . . . . . . . . . . . . . . . . . . . . . . 55frame-address . . . . . . . . . . . . . . . . . . . . . . . . . . . . . 186frame-address-end . . . . . . . . . . . . . . . . . . . . . . . . . 186frame-args . . . . . . . . . . . . . . . . . . . . . . . . . . . . . . . . 186frame-begin . . . . . . . . . . . . . . . . . . . . . . . . . . . . . . . 185
frame-end. . . . . . . . . . . . . . . . . . . . . . . . . . . . . . . . .
185frame-function-name. . . . . . . . . . . . . . . . . . . . . . . 186frame-source-begin. . . . . . . . . . . . . . . . . . . . . . . . 186frame-source-end . . . . . . . . . . . . . . . . . . . . . . . . . . 186frame-source-file . . . . . . . . . . . . . . . . . . . . . . . . . 186frame-source-file-end . . . . . . . . . . . . . . . . . . . . 186frame-source-line . . . . . . . . . . . . . . . . . . . . . . . . . 186frame-where . . . . . . . . . . . . . . . . . . . . . . . . . . . . . . . 186frameless execution . . . . . . . . . . . . . . . . . . . . . . . . . . 53frames-invalid . . . . . . . . . . . . . . . . . . . . . . . . . . . . 189free memory information (MS-DOS). . . . . . . . . . 147Fujitsu . . . . . . . . . . . . . . . . . . . . . . . . . . . . . . . . . . . . . 142
function-call. . . . . . . . . . . . . . . . . . . . . . . . . . . . .
185functions without line info, and stepping . . . . . . . 47
Gg++, gnu C++ compiler . . . . . . . . . . . . . . . . . . . . . . 102garbled pointers . . . . . . . . . . . . . . . . . . . . . . . . . . . . 148GDB bugs, reporting . . . . . . . . . . . . . . . . . . . . . . . . 247GDB reference card . . . . . . . . . . . . . . . . . . . . . . . . . 273‘gdb.ini’ . . . . . . . . . . . . . . . . . . . . . . . . . . . . . . . . . . 173gdb/mi, breakpoint commands . . . . . . . . . . . . . . 197gdb/mi, compatibility with CLI . . . . . . . . . . . . . 195gdb/mi, data manipulation
. . . . . . . . . . . . . . . . . .
205gdb/mi, input syntax . . . . . . . . . . . . . . . . . . . . . . . 191gdb/mi, its purpose. . . . . . . . . . . . . . . . . . . . . . . . . 191gdb/mi, out-of-band records . . . . . . . . . . . . . . . . . 196gdb/mi, output syntax . . . . . . . . . . . . . . . . . . . . . . 192gdb/mi, result records . . . . . . . . . . . . . . . . . . . . . . 195
8/14/2019 Debugging With GDB - The GNU Source-Level Debugger
http://slidepdf.com/reader/full/debugging-with-gdb-the-gnu-source-level-debugger 323/328
312 Debugging with GDB
gdb/mi, simple examples . . . . . . . . . . . . . . . . . . . . 194gdb/mi, stream records . . . . . . . . . . . . . . . . . . . . . 195GDBHISTFILE . . . . . . . . . . . . . . . . . . . . . . . . . . . . . . . 165gdbserve.nlm . . . . . . . . . . . . . . . . . . . . . . . . . . . . . . 140
gdbserver. . . . . . . . . . . . . . . . . . . . . . . . . . . . . . . . .
139GDT . . . . . . . . . . . . . . . . . . . . . . . . . . . . . . . . . . . . . . 147getDebugChar . . . . . . . . . . . . . . . . . . . . . . . . . . . . . . 143gnu C++ . . . . . . . . . . . . . . . . . . . . . . . . . . . . . . . . . . . 102gnu Emacs . . . . . . . . . . . . . . . . . . . . . . . . . . . . . . . . . 181
Hh (help) . . . . . . . . . . . . . . . . . . . . . . . . . . . . . . . . . . . . 19H8/300 or H8/500 download . . . . . . . . . . . . . . . . . 153handle . . . . . . . . . . . . . . . . . . . . . . . . . . . . . . . . . . . . . . 49handle_exception . . . . . . . . . . . . . . . . . . . . . . . . . . 142
handling signals. . . . . . . . . . . . . . . . . . . . . . . . . . . . .
49hardware watchpoints . . . . . . . . . . . . . . . . . . . . . . . . 37hbreak . . . . . . . . . . . . . . . . . . . . . . . . . . . . . . . . . . . . . . 35help . . . . . . . . . . . . . . . . . . . . . . . . . . . . . . . . . . . . . . . . 19help target . . . . . . . . . . . . . . . . . . . . . . . . . . . . . . . . 135help user-defined . . . . . . . . . . . . . . . . . . . . . . . . . 171heuristic-fence-post (Alpha, MIPS) . . . . . . . 163history events . . . . . . . . . . . . . . . . . . . . . . . . . . . . . . 269history expansion . . . . . . . . . . . . . . . . . . . . . . 166, 269history file . . . . . . . . . . . . . . . . . . . . . . . . . . . . . . . . . 165history number . . . . . . . . . . . . . . . . . . . . . . . . . . . . . . 75history save . . . . . . . . . . . . . . . . . . . . . . . . . . . . . . . . 166
history size. . . . . . . . . . . . . . . . . . . . . . . . . . . . . . . . .
166history substitution . . . . . . . . . . . . . . . . . . . . . . . . . 165history-search-backward () . . . . . . . . . . . . . . . 263history-search-forward () . . . . . . . . . . . . . . . . 263Hitachi . . . . . . . . . . . . . . . . . . . . . . . . . . . . . . . . . . . . 142Hitachi SH download. . . . . . . . . . . . . . . . . . . . . . . . 153hook . . . . . . . . . . . . . . . . . . . . . . . . . . . . . . . . . . . . . . . 172hook- . . . . . . . . . . . . . . . . . . . . . . . . . . . . . . . . . . . . . . 172hookpost . . . . . . . . . . . . . . . . . . . . . . . . . . . . . . . . . . 172hookpost- . . . . . . . . . . . . . . . . . . . . . . . . . . . . . . . . . 172hooks, for commands . . . . . . . . . . . . . . . . . . . . . . . . 172hooks, post-command . . . . . . . . . . . . . . . . . . . . . . . 172hooks, pre-command
. . . . . . . . . . . . . . . . . . . . . . . .
172horizontal-scroll-mode . . . . . . . . . . . . . . . . . . . 255
Ii (info) . . . . . . . . . . . . . . . . . . . . . . . . . . . . . . . . . . . . 20i/o . . . . . . . . . . . . . . . . . . . . . . . . . . . . . . . . . . . . . . . . . 26i386 . . . . . . . . . . . . . . . . . . . . . . . . . . . . . . . . . . . . . . . 141‘i386-stub.c’ . . . . . . . . . . . . . . . . . . . . . . . . . . . . . . 141i960 . . . . . . . . . . . . . . . . . . . . . . . . . . . . . . . . . . . . . . . 155IDT . . . . . . . . . . . . . . . . . . . . . . . . . . . . . . . . . . . . . . . 147if . . . . . . . . . . . . . . . . . . . . . . . . . . . . . . . . . . . . . . . . . 171ignore
. . . . . . . . . . . . . . . . . . . . . . . . . . . . . . . . . . . . . .
43ignore count (of breakpoint) . . . . . . . . . . . . . . . . . . 43INCLUDE_RDB . . . . . . . . . . . . . . . . . . . . . . . . . . . . . . . 151info . . . . . . . . . . . . . . . . . . . . . . . . . . . . . . . . . . . . . . . . 20info address. . . . . . . . . . . . . . . . . . . . . . . . . . . . . . . 119info all-registers . . . . . . . . . . . . . . . . . . . . . . . . . 77
info args . . . . . . . . . . . . . . . . . . . . . . . . . . . . . . . . . . . 56info breakpoints . . . . . . . . . . . . . . . . . . . . . . . . . . . 36info catch . . . . . . . . . . . . . . . . . . . . . . . . . . . . . . . . . . 56info display . . . . . . . . . . . . . . . . . . . . . . . . . . . . . . . . 69
info dll. . . . . . . . . . . . . . . . . . . . . . . . . . . . . . . . . . .
149info dos . . . . . . . . . . . . . . . . . . . . . . . . . . . . . . . . . . . 147info extensions . . . . . . . . . . . . . . . . . . . . . . . . . . . . 99info f (info frame) . . . . . . . . . . . . . . . . . . . . . . . . . 56info files . . . . . . . . . . . . . . . . . . . . . . . . . . . . . . . . . 130info float . . . . . . . . . . . . . . . . . . . . . . . . . . . . . . . . . . 78info frame . . . . . . . . . . . . . . . . . . . . . . . . . . . . . . . . . . 56info frame, show the source language . . . . . . . . . 98info functions . . . . . . . . . . . . . . . . . . . . . . . . . . . . 120info line . . . . . . . . . . . . . . . . . . . . . . . . . . . . . . . . . . . 60info locals . . . . . . . . . . . . . . . . . . . . . . . . . . . . . . . . . 56info mem . . . . . . . . . . . . . . . . . . . . . . . . . . . . . . . . . . . . 79
info proc. . . . . . . . . . . . . . . . . . . . . . . . . . . . . . . . . .
147info proc mappings . . . . . . . . . . . . . . . . . . . . . . . . 147info program . . . . . . . . . . . . . . . . . . . . . . . . . . . . . . . . 33info registers . . . . . . . . . . . . . . . . . . . . . . . . . . . . . 77info s (info stack) . . . . . . . . . . . . . . . . . . . . . . . . . 54info scope . . . . . . . . . . . . . . . . . . . . . . . . . . . . . . . . . 120info set . . . . . . . . . . . . . . . . . . . . . . . . . . . . . . . . . . . . 21info share . . . . . . . . . . . . . . . . . . . . . . . . . . . . . . . . . 132info sharedlibrary . . . . . . . . . . . . . . . . . . . . . . . . 132info signals . . . . . . . . . . . . . . . . . . . . . . . . . . . . . . . . 49info source . . . . . . . . . . . . . . . . . . . . . . . . . . . . . . . . 120info source, show the source language . . . . . . . . 98
info sources. . . . . . . . . . . . . . . . . . . . . . . . . . . . . . .
120info stack . . . . . . . . . . . . . . . . . . . . . . . . . . . . . . . . . . 54info symbol . . . . . . . . . . . . . . . . . . . . . . . . . . . . . . . . 119info target . . . . . . . . . . . . . . . . . . . . . . . . . . . . . . . . 130info terminal. . . . . . . . . . . . . . . . . . . . . . . . . . . . . . . 26info threads . . . . . . . . . . . . . . . . . . . . . . . . . . . . . . . . 29info tracepoints . . . . . . . . . . . . . . . . . . . . . . . . . . . 84info types . . . . . . . . . . . . . . . . . . . . . . . . . . . . . . . . . 120info variables . . . . . . . . . . . . . . . . . . . . . . . . . . . . 121info w32 . . . . . . . . . . . . . . . . . . . . . . . . . . . . . . . . . . . 149info watchpoints . . . . . . . . . . . . . . . . . . . . . . . . . . . 37information about tracepoints . . . . . . . . . . . . . . . . 84inheritance
. . . . . . . . . . . . . . . . . . . . . . . . . . . . . . . . .
106init file. . . . . . . . . . . . . . . . . . . . . . . . . . . . . . . . . . . . . 173init file name . . . . . . . . . . . . . . . . . . . . . . . . . . . . . . . 173initial frame . . . . . . . . . . . . . . . . . . . . . . . . . . . . . . . . . 53initialization file, readline. . . . . . . . . . . . . . . . . . . . 254innermost frame . . . . . . . . . . . . . . . . . . . . . . . . . . . . . 53input syntax for gdb/mi . . . . . . . . . . . . . . . . . . . . 191input-meta . . . . . . . . . . . . . . . . . . . . . . . . . . . . . . . . 255insert-comment (M-#) . . . . . . . . . . . . . . . . . . . . . . 267insert-completions (M-*) . . . . . . . . . . . . . . . . . . 266inspect . . . . . . . . . . . . . . . . . . . . . . . . . . . . . . . . . . . . . 63installation . . . . . . . . . . . . . . . . . . . . . . . . . . . . . . . . . 275instructions, assembly
. . . . . . . . . . . . . . . . . . . . . . . .
60Intel . . . . . . . . . . . . . . . . . . . . . . . . . . . . . . . . . . . . . . . 141Intel disassembly flavor . . . . . . . . . . . . . . . . . . . . . . . 60interaction, readline . . . . . . . . . . . . . . . . . . . . . . . . . 251internal commands . . . . . . . . . . . . . . . . . . . . . . . . . . 279internal GDB breakpoints . . . . . . . . . . . . . . . . . . . . 36

8/14/2019 Debugging With GDB - The GNU Source-Level Debugger
http://slidepdf.com/reader/full/debugging-with-gdb-the-gnu-source-level-debugger 324/328
Index 313
interrupt . . . . . . . . . . . . . . . . . . . . . . . . . . . . . . . . . . . . 15interrupting remote programs . . . . . . . . . . . . . . . . 145interrupting remote targets . . . . . . . . . . . . . . . . . . 143invalid input . . . . . . . . . . . . . . . . . . . . . . . . . . . . . . . 247
isearch-terminators. . . . . . . . . . . . . . . . . . . . . . .
255
Jjump . . . . . . . . . . . . . . . . . . . . . . . . . . . . . . . . . . . . . . . 124
Kkernel object . . . . . . . . . . . . . . . . . . . . . . . . . . . . . . . 138kernel object display . . . . . . . . . . . . . . . . . . . . . . . . 138keymap . . . . . . . . . . . . . . . . . . . . . . . . . . . . . . . . . . . . . 256kill . . . . . . . . . . . . . . . . . . . . . . . . . . . . . . . . . . . . . . . . 28kill ring
. . . . . . . . . . . . . . . . . . . . . . . . . . . . . . . . . . . .
253kill-line (C-k) . . . . . . . . . . . . . . . . . . . . . . . . . . . 264kill-region () . . . . . . . . . . . . . . . . . . . . . . . . . . . . 265kill-whole-line () . . . . . . . . . . . . . . . . . . . . . . . . 265kill-word (M-d) . . . . . . . . . . . . . . . . . . . . . . . . . . . 265killing text . . . . . . . . . . . . . . . . . . . . . . . . . . . . . . . . . 252KOD . . . . . . . . . . . . . . . . . . . . . . . . . . . . . . . . . . . . . . 138
Ll (list) . . . . . . . . . . . . . . . . . . . . . . . . . . . . . . . . . . . . 57languages . . . . . . . . . . . . . . . . . . . . . . . . . . . . . . . . . . . 97
last tracepoint number. . . . . . . . . . . . . . . . . . . . . . .
82latest breakpoint . . . . . . . . . . . . . . . . . . . . . . . . . . . . 34layout asm . . . . . . . . . . . . . . . . . . . . . . . . . . . . . . . . . 178layout next . . . . . . . . . . . . . . . . . . . . . . . . . . . . . . . . 178layout prev . . . . . . . . . . . . . . . . . . . . . . . . . . . . . . . . 178layout regs . . . . . . . . . . . . . . . . . . . . . . . . . . . . . . . . 179layout split. . . . . . . . . . . . . . . . . . . . . . . . . . . . . . . 179layout src . . . . . . . . . . . . . . . . . . . . . . . . . . . . . . . . . 178LDT . . . . . . . . . . . . . . . . . . . . . . . . . . . . . . . . . . . . . . . 147leaving GDB . . . . . . . . . . . . . . . . . . . . . . . . . . . . . . . . 15Left . . . . . . . . . . . . . . . . . . . . . . . . . . . . . . . . . . . . . . . 178linespec . . . . . . . . . . . . . . . . . . . . . . . . . . . . . . . . . . . . . 57
list. . . . . . . . . . . . . . . . . . . . . . . . . . . . . . . . . . . . . . . .
57list output in gdb/mi . . . . . . . . . . . . . . . . . . . . . . . 194listing machine instructions . . . . . . . . . . . . . . . . . . . 60listing mapped overlays . . . . . . . . . . . . . . . . . . . . . . 93load address, overlay’s . . . . . . . . . . . . . . . . . . . . . . . . 91load filename . . . . . . . . . . . . . . . . . . . . . . . . . . . . . . 137local variables . . . . . . . . . . . . . . . . . . . . . . . . . . . . . . 120locate address . . . . . . . . . . . . . . . . . . . . . . . . . . . . . . . 66log output in gdb/mi . . . . . . . . . . . . . . . . . . . . . . . 194
Mm680x0
. . . . . . . . . . . . . . . . . . . . . . . . . . . . . . . . . . . .
142‘ m68k-stub.c’ . . . . . . . . . . . . . . . . . . . . . . . . . . . . . . 142machine instructions . . . . . . . . . . . . . . . . . . . . . . . . . 60
maint info breakpoints . . . . . . . . . . . . . . . . . . . . 279 maint info sections . . . . . . . . . . . . . . . . . . . . . . . 130 maint print psymbols . . . . . . . . . . . . . . . . . . . . . . 121
maint print symbols . . . . . . . . . . . . . . . . . . . . . . . 121maintenance commands . . . . . . . . . . . . . . . . . . . . . 279
make . . . . . . . . . . . . . . . . . . . . . . . . . . . . . . . . . . . . . . . . 16manual overlay debugging . . . . . . . . . . . . . . . . . . . . 93
map an overlay. . . . . . . . . . . . . . . . . . . . . . . . . . . . . .
93 mapped . . . . . . . . . . . . . . . . . . . . . . . . . . . . . . . . . . . . . 128mapped address . . . . . . . . . . . . . . . . . . . . . . . . . . . . . 91mapped overlays . . . . . . . . . . . . . . . . . . . . . . . . . . . . . 91
mark-modified-lines. . . . . . . . . . . . . . . . . . . . . . . 256 mem . . . . . . . . . . . . . . . . . . . . . . . . . . . . . . . . . . . . . . . . . 78member functions . . . . . . . . . . . . . . . . . . . . . . . . . . . 104memory models, H8/500 . . . . . . . . . . . . . . . . . . . . 155memory region attributes. . . . . . . . . . . . . . . . . . . . . 78memory tracing. . . . . . . . . . . . . . . . . . . . . . . . . . . . . . 33memory, viewing as typed object . . . . . . . . . . . . . . 64memory-mapped symbol file . . . . . . . . . . . . . . . . . 128
memset. . . . . . . . . . . . . . . . . . . . . . . . . . . . . . . . . . . . .
143 menu-complete () . . . . . . . . . . . . . . . . . . . . . . . . . . 266 meta-flag . . . . . . . . . . . . . . . . . . . . . . . . . . . . . . . . . 255MIPS boards . . . . . . . . . . . . . . . . . . . . . . . . . . . . . . . 157MIPS remote floating point . . . . . . . . . . . . . . . . . . 158MIPS remotedebug protocol . . . . . . . . . . . . . . . . . 159MIPS stack . . . . . . . . . . . . . . . . . . . . . . . . . . . . . . . . 163Modula-2 . . . . . . . . . . . . . . . . . . . . . . . . . . . . . . . . . . . . 1Modula-2 built-ins . . . . . . . . . . . . . . . . . . . . . . . . . . 109Modula-2 checks . . . . . . . . . . . . . . . . . . . . . . . . . . . . 111Modula-2 constants . . . . . . . . . . . . . . . . . . . . . . . . . 110Modula-2 defaults . . . . . . . . . . . . . . . . . . . . . . . . . . 110
Modula-2 operators. . . . . . . . . . . . . . . . . . . . . . . . .
107Modula-2, deviations from. . . . . . . . . . . . . . . . . . . 110Modula-2, GDB support . . . . . . . . . . . . . . . . . . . . 107Motorola 680x0 . . . . . . . . . . . . . . . . . . . . . . . . . . . . . 142MS Windows debugging . . . . . . . . . . . . . . . . . . . . . 149MS-DOS system info . . . . . . . . . . . . . . . . . . . . . . . . 147MS-DOS-specific commands . . . . . . . . . . . . . . . . . 147multiple processes . . . . . . . . . . . . . . . . . . . . . . . . . . . 30multiple targets . . . . . . . . . . . . . . . . . . . . . . . . . . . . 135multiple threads . . . . . . . . . . . . . . . . . . . . . . . . . . . . . 28
Nn (next) . . . . . . . . . . . . . . . . . . . . . . . . . . . . . . . . . . . . 47names of symbols . . . . . . . . . . . . . . . . . . . . . . . . . . . 119namespace in C++ . . . . . . . . . . . . . . . . . . . . . . . . . . 104native Cygwin debugging . . . . . . . . . . . . . . . . . . . . 149native djgpp debugging . . . . . . . . . . . . . . . . . . . . . 147negative breakpoint numbers . . . . . . . . . . . . . . . . . 36New systag message . . . . . . . . . . . . . . . . . . . . . . . . . . 28New systag message, on HP-UX . . . . . . . . . . . . . . . 29next . . . . . . . . . . . . . . . . . . . . . . . . . . . . . . . . . . . . . . . . 47next-history (C-n) . . . . . . . . . . . . . . . . . . . . . . . . 262nexti . . . . . . . . . . . . . . . . . . . . . . . . . . . . . . . . . . . . . . . 48ni (nexti)
. . . . . . . . . . . . . . . . . . . . . . . . . . . . . . . . . .
48Nindy . . . . . . . . . . . . . . . . . . . . . . . . . . . . . . . . . . . . . 155non-incremental-forward-search-history (M-n)
. . . . . . . . . . . . . . . . . . . . . . . . . . . . . . . . . . . . . . . 263non-incremental-reverse-search-history (M-p)
. . . . . . . . . . . . . . . . . . . . . . . . . . . . . . . . . . . . . . . 263

8/14/2019 Debugging With GDB - The GNU Source-Level Debugger
http://slidepdf.com/reader/full/debugging-with-gdb-the-gnu-source-level-debugger 325/328
314 Debugging with GDB
notation, readline . . . . . . . . . . . . . . . . . . . . . . . . . . . 251notational conventions, for gdb/mi . . . . . . . . . . . 191notify output in gdb/mi. . . . . . . . . . . . . . . . . . . . . 193number representation . . . . . . . . . . . . . . . . . . . . . . 167
numbers for breakpoints. . . . . . . . . . . . . . . . . . . . . .
33
Oobject files, relocatable, reading symbols from
. . . . . . . . . . . . . . . . . . . . . . . . . . . . . . . . . . . . . . . 129object formats and C++ . . . . . . . . . . . . . . . . . . . . . 104online documentation . . . . . . . . . . . . . . . . . . . . . . . . 19optimized code, debugging. . . . . . . . . . . . . . . . . . . . 23out-of-band records in gdb/mi . . . . . . . . . . . . . . . 196outermost frame . . . . . . . . . . . . . . . . . . . . . . . . . . . . . 53output . . . . . . . . . . . . . . . . . . . . . . . . . . . . . . . . . . . . . 174
output formats. . . . . . . . . . . . . . . . . . . . . . . . . . . . . .
66output syntax of gdb/mi . . . . . . . . . . . . . . . . . . . . 192output-meta . . . . . . . . . . . . . . . . . . . . . . . . . . . . . . . 256overlay area . . . . . . . . . . . . . . . . . . . . . . . . . . . . . . . . . 91overlay auto . . . . . . . . . . . . . . . . . . . . . . . . . . . . . . . . 93overlay example program . . . . . . . . . . . . . . . . . . . . . 95overlay load-target . . . . . . . . . . . . . . . . . . . . . . . . 93overlay manual . . . . . . . . . . . . . . . . . . . . . . . . . . . . . 93overlay map-overlay . . . . . . . . . . . . . . . . . . . . . . . . 93overlay off . . . . . . . . . . . . . . . . . . . . . . . . . . . . . . . . . 93overlay unmap-overlay . . . . . . . . . . . . . . . . . . . . . . 93overlays . . . . . . . . . . . . . . . . . . . . . . . . . . . . . . . . . . . . . 91
overlays, setting breakpoints in. . . . . . . . . . . . . . .
94overload-choice . . . . . . . . . . . . . . . . . . . . . . . . . . . 187overloaded functions, calling . . . . . . . . . . . . . . . . . 104overloaded functions, overload resolution . . . . . 107overloading. . . . . . . . . . . . . . . . . . . . . . . . . . . . . . . . . . 44overloading in C++ . . . . . . . . . . . . . . . . . . . . . . . . . . 106
Ppackets, reporting on stdout . . . . . . . . . . . . . . . . . 169page tables display (MS-DOS) . . . . . . . . . . . . . . . 148partial symbol dump . . . . . . . . . . . . . . . . . . . . . . . . 121Pascal
. . . . . . . . . . . . . . . . . . . . . . . . . . . . . . . . . . . . . . .
1passcount . . . . . . . . . . . . . . . . . . . . . . . . . . . . . . . . . . 82patching binaries . . . . . . . . . . . . . . . . . . . . . . . . . . . 126path . . . . . . . . . . . . . . . . . . . . . . . . . . . . . . . . . . . . . . . . 25pauses in output . . . . . . . . . . . . . . . . . . . . . . . . . . . . 167PgDn . . . . . . . . . . . . . . . . . . . . . . . . . . . . . . . . . . . . . . . 178PgUp . . . . . . . . . . . . . . . . . . . . . . . . . . . . . . . . . . . . . . . 178physical address from linear address . . . . . . . . . . 148pipes . . . . . . . . . . . . . . . . . . . . . . . . . . . . . . . . . . . . . . . 24pointer, finding referent . . . . . . . . . . . . . . . . . . . . . . 71possible-completions (M-?) . . . . . . . . . . . . . . . 266post-commands . . . . . . . . . . . . . . . . . . . . . . . . . . . . . 187post-overload-choice
. . . . . . . . . . . . . . . . . . . . . .
187post-prompt . . . . . . . . . . . . . . . . . . . . . . . . . . . . . . . 187post-prompt-for-continue . . . . . . . . . . . . . . . . . 188post-query . . . . . . . . . . . . . . . . . . . . . . . . . . . . . . . . 188pre-commands . . . . . . . . . . . . . . . . . . . . . . . . . . . . . . 187pre-overload-choice. . . . . . . . . . . . . . . . . . . . . . . 187
pre-prompt . . . . . . . . . . . . . . . . . . . . . . . . . . . . . . . . 187pre-prompt-for-continue . . . . . . . . . . . . . . . . . . 188pre-query . . . . . . . . . . . . . . . . . . . . . . . . . . . . . . . . . 188prefix-meta (ESC) . . . . . . . . . . . . . . . . . . . . . . . . . 267
previous-history (C-p). . . . . . . . . . . . . . . . . . . .
262print . . . . . . . . . . . . . . . . . . . . . . . . . . . . . . . . . . . . . . . 63print settings . . . . . . . . . . . . . . . . . . . . . . . . . . . . . . . . 70printf . . . . . . . . . . . . . . . . . . . . . . . . . . . . . . . . . . . . . 174printing data . . . . . . . . . . . . . . . . . . . . . . . . . . . . . . . . 63process image . . . . . . . . . . . . . . . . . . . . . . . . . . . . . . 147processes, multiple . . . . . . . . . . . . . . . . . . . . . . . . . . . 30prompt . . . . . . . . . . . . . . . . . . . . . . . . . . . . . . . . . . . . 165prompt . . . . . . . . . . . . . . . . . . . . . . . . . . . . . . . . . . . . . 187prompt-for-continue. . . . . . . . . . . . . . . . . . . . . . . 188protocol, GDB remote serial . . . . . . . . . . . . . . . . . 281ptype . . . . . . . . . . . . . . . . . . . . . . . . . . . . . . . . . . . . . . 119
putDebugChar. . . . . . . . . . . . . . . . . . . . . . . . . . . . . .
143pwd . . . . . . . . . . . . . . . . . . . . . . . . . . . . . . . . . . . . . . . . . 26
Qq (quit) . . . . . . . . . . . . . . . . . . . . . . . . . . . . . . . . . . . . 15query . . . . . . . . . . . . . . . . . . . . . . . . . . . . . . . . . . . . . . 188quit . . . . . . . . . . . . . . . . . . . . . . . . . . . . . . . . . . . . . . . 188quit [expression] . . . . . . . . . . . . . . . . . . . . . . . . . . . . 15quoted-insert (C-q, C-v) . . . . . . . . . . . . . . . . . . 264quotes in commands . . . . . . . . . . . . . . . . . . . . . . . . . 18quoting names . . . . . . . . . . . . . . . . . . . . . . . . . . . . . . 119
Rr (run). . . . . . . . . . . . . . . . . . . . . . . . . . . . . . . . . . . . . . 23raise exceptions . . . . . . . . . . . . . . . . . . . . . . . . . . . . . . 39range checking. . . . . . . . . . . . . . . . . . . . . . . . . . . . . . 100ranges of breakpoints . . . . . . . . . . . . . . . . . . . . . . . . 33rbreak . . . . . . . . . . . . . . . . . . . . . . . . . . . . . . . . . . . . . . 35re-read-init-file (C-x C-r) . . . . . . . . . . . . . . . 267reading symbols from relocatable object files . . 129reading symbols immediately . . . . . . . . . . . . . . . . 128readline . . . . . . . . . . . . . . . . . . . . . . . . . . . . . . . . . . . . 165readnow
. . . . . . . . . . . . . . . . . . . . . . . . . . . . . . . . . . . .128
recent tracepoint number . . . . . . . . . . . . . . . . . . . . . 82record . . . . . . . . . . . . . . . . . . . . . . . . . . . . . . . . . . . . . 188redirection . . . . . . . . . . . . . . . . . . . . . . . . . . . . . . . . . . 26redraw-current-line () . . . . . . . . . . . . . . . . . . . . 262reference card . . . . . . . . . . . . . . . . . . . . . . . . . . . . . . 273reference declarations . . . . . . . . . . . . . . . . . . . . . . . 105refresh. . . . . . . . . . . . . . . . . . . . . . . . . . . . . . . . . . . . 179register stack, AMD29K . . . . . . . . . . . . . . . . . . . . . 163registers . . . . . . . . . . . . . . . . . . . . . . . . . . . . . . . . . . . . . 77regular expression. . . . . . . . . . . . . . . . . . . . . . . . . . . . 35reloading symbols . . . . . . . . . . . . . . . . . . . . . . . . . . . 121reloading the overlay table
. . . . . . . . . . . . . . . . . . . .
93relocatable object files, reading symbols from . . 129remote connection without stubs . . . . . . . . . . . . . 139remote debugging . . . . . . . . . . . . . . . . . . . . . . . . . . . 137remote programs, interrupting . . . . . . . . . . . . . . . 145remote serial debugging summary . . . . . . . . . . . . 144
8/14/2019 Debugging With GDB - The GNU Source-Level Debugger
http://slidepdf.com/reader/full/debugging-with-gdb-the-gnu-source-level-debugger 326/328
Index 315
remote serial debugging, overview . . . . . . . . . . . . 141remote serial protocol . . . . . . . . . . . . . . . . . . . . . . . 281remote serial stub . . . . . . . . . . . . . . . . . . . . . . . . . . . 142remote serial stub list . . . . . . . . . . . . . . . . . . . . . . . 141
remote serial stub, initialization. . . . . . . . . . . . . .
142remote serial stub, main routine . . . . . . . . . . . . . 142remote stub, example . . . . . . . . . . . . . . . . . . . . . . . 141remote stub, support routines . . . . . . . . . . . . . . . . 142remotedebug, MIPS protocol . . . . . . . . . . . . . . . . 159remotetimeout . . . . . . . . . . . . . . . . . . . . . . . . . . . . . 160remove actions from a tracepoint . . . . . . . . . . . . . . 83repeating command sequences . . . . . . . . . . . . . . . . 17repeating commands . . . . . . . . . . . . . . . . . . . . . . . . . 17reporting bugs in GDB . . . . . . . . . . . . . . . . . . . . . . 247reset . . . . . . . . . . . . . . . . . . . . . . . . . . . . . . . . . . . . . . 156response time, MIPS debugging . . . . . . . . . . . . . . 163
result records in gdb/mi. . . . . . . . . . . . . . . . . . . .
195resuming execution . . . . . . . . . . . . . . . . . . . . . . . . . . 45RET (repeat last command) . . . . . . . . . . . . . . . . . . . 17retransmit-timeout, MIPS protocol . . . . . . . . . 159return . . . . . . . . . . . . . . . . . . . . . . . . . . . . . . . . . . . . . 125returning from a function . . . . . . . . . . . . . . . . . . . 125reverse-search . . . . . . . . . . . . . . . . . . . . . . . . . . . . . 58reverse-search-history (C-r) . . . . . . . . . . . . . 263revert-line (M-r) . . . . . . . . . . . . . . . . . . . . . . . . . 267Right . . . . . . . . . . . . . . . . . . . . . . . . . . . . . . . . . . . . . . 178run . . . . . . . . . . . . . . . . . . . . . . . . . . . . . . . . . . . . . . . . . 23running . . . . . . . . . . . . . . . . . . . . . . . . . . . . . . . . . . . . . 23
running and debugging Sparclet programs. . . .
161running VxWorks tasks . . . . . . . . . . . . . . . . . . . . . 152running, on Sparclet . . . . . . . . . . . . . . . . . . . . . . . . 160rwatch . . . . . . . . . . . . . . . . . . . . . . . . . . . . . . . . . . . . . . 37
Ss (step) . . . . . . . . . . . . . . . . . . . . . . . . . . . . . . . . . . . . 46save tracepoints for future sessions . . . . . . . . . . . . 88save-tracepoints . . . . . . . . . . . . . . . . . . . . . . . . . . . 88saving symbol table . . . . . . . . . . . . . . . . . . . . . . . . . 128scope . . . . . . . . . . . . . . . . . . . . . . . . . . . . . . . . . . . . . . 111search
. . . . . . . . . . . . . . . . . . . . . . . . . . . . . . . . . . . . . .
58searching . . . . . . . . . . . . . . . . . . . . . . . . . . . . . . . . . . . . 58section. . . . . . . . . . . . . . . . . . . . . . . . . . . . . . . . . . . . 130segment descriptor tables. . . . . . . . . . . . . . . . . . . . 147select trace snapshot . . . . . . . . . . . . . . . . . . . . . . . . . 85select-frame . . . . . . . . . . . . . . . . . . . . . . . . . . . . . . . 54selected frame . . . . . . . . . . . . . . . . . . . . . . . . . . . . . . . 53selecting frame silently . . . . . . . . . . . . . . . . . . . . . . . 54self-insert (a, b, A, 1, !, ...) . . . . . . . . . . . 264sequence-id, for GDB remote . . . . . . . . . . . . . . . . 281serial connections, debugging . . . . . . . . . . . . . . . . 169serial device, Hitachi micros . . . . . . . . . . . . . . . . . 153serial line speed, Hitachi micros
. . . . . . . . . . . . . .
153serial line, target remote . . . . . . . . . . . . . . . . . . . 144serial protocol, GDB remote . . . . . . . . . . . . . . . . . 281server prefix for annotations . . . . . . . . . . . . . . . . . 183set . . . . . . . . . . . . . . . . . . . . . . . . . . . . . . . . . . . . . . . . . 20set args . . . . . . . . . . . . . . . . . . . . . . . . . . . . . . . . . . . . 25
set auto-solib-add . . . . . . . . . . . . . . . . . . . . . . . . 131set auto-solib-limit . . . . . . . . . . . . . . . . . . . . . . 132set check range . . . . . . . . . . . . . . . . . . . . . . . . . . . . 101set check type . . . . . . . . . . . . . . . . . . . . . . . . . . . . . 100
set check, range. . . . . . . . . . . . . . . . . . . . . . . . . . .
101set check, type . . . . . . . . . . . . . . . . . . . . . . . . . . . . 100set complaints . . . . . . . . . . . . . . . . . . . . . . . . . . . . 168set confirm . . . . . . . . . . . . . . . . . . . . . . . . . . . . . . . . 168set debug arch . . . . . . . . . . . . . . . . . . . . . . . . . . . . . 169set debug event . . . . . . . . . . . . . . . . . . . . . . . . . . . . 169set debug expression . . . . . . . . . . . . . . . . . . . . . . 169set debug overload . . . . . . . . . . . . . . . . . . . . . . . . 169set debug remote . . . . . . . . . . . . . . . . . . . . . . . . . . . 169set debug serial . . . . . . . . . . . . . . . . . . . . . . . . . . . 169set debug target . . . . . . . . . . . . . . . . . . . . . . . . . . . 169set debug varobj . . . . . . . . . . . . . . . . . . . . . . . . . . . 169
set debugevents. . . . . . . . . . . . . . . . . . . . . . . . . . .
150set debugexceptions . . . . . . . . . . . . . . . . . . . . . . . 150set debugexec . . . . . . . . . . . . . . . . . . . . . . . . . . . . . 150set debugmemory . . . . . . . . . . . . . . . . . . . . . . . . . . . 150set demangle-style . . . . . . . . . . . . . . . . . . . . . . . . . 73set disassembly-flavor . . . . . . . . . . . . . . . . . . . . . 60set editing . . . . . . . . . . . . . . . . . . . . . . . . . . . . . . . . 165set endian auto . . . . . . . . . . . . . . . . . . . . . . . . . . . . 137set endian big . . . . . . . . . . . . . . . . . . . . . . . . . . . . . 137set endian little. . . . . . . . . . . . . . . . . . . . . . . . . . 137set environment . . . . . . . . . . . . . . . . . . . . . . . . . . . . 25set extension-language . . . . . . . . . . . . . . . . . . . . . 99
set follow-fork-mode. . . . . . . . . . . . . . . . . . . . . . .
31set gnutarget . . . . . . . . . . . . . . . . . . . . . . . . . . . . . 136set height . . . . . . . . . . . . . . . . . . . . . . . . . . . . . . . . . 167set history expansion . . . . . . . . . . . . . . . . . . . . . 166set history filename . . . . . . . . . . . . . . . . . . . . . . 165set history save . . . . . . . . . . . . . . . . . . . . . . . . . . . 166set history size . . . . . . . . . . . . . . . . . . . . . . . . . . . 166set input-radix . . . . . . . . . . . . . . . . . . . . . . . . . . . 167set language . . . . . . . . . . . . . . . . . . . . . . . . . . . . . . . . 98set listsize . . . . . . . . . . . . . . . . . . . . . . . . . . . . . . . . 57set machine . . . . . . . . . . . . . . . . . . . . . . . . . . . . . . . . 155set memory mod . . . . . . . . . . . . . . . . . . . . . . . . . . . . 155set mipsfpu
. . . . . . . . . . . . . . . . . . . . . . . . . . . . . . . .
158set new-console . . . . . . . . . . . . . . . . . . . . . . . . . . . 149set new-group . . . . . . . . . . . . . . . . . . . . . . . . . . . . . 149set opaque-type-resolution . . . . . . . . . . . . . . . 121set output-radix . . . . . . . . . . . . . . . . . . . . . . . . . . 167set overload-resolution . . . . . . . . . . . . . . . . . . . 107set print address . . . . . . . . . . . . . . . . . . . . . . . . . . . 70set print array . . . . . . . . . . . . . . . . . . . . . . . . . . . . . 71set print asm-demangle . . . . . . . . . . . . . . . . . . . . . 73set print demangle . . . . . . . . . . . . . . . . . . . . . . . . . 73set print elements . . . . . . . . . . . . . . . . . . . . . . . . . 71set print max-symbolic-offset . . . . . . . . . . . . . . 71set print null-stop
. . . . . . . . . . . . . . . . . . . . . . . .
72set print object . . . . . . . . . . . . . . . . . . . . . . . . . . . . 74set print pretty . . . . . . . . . . . . . . . . . . . . . . . . . . . . 72set print sevenbit-strings . . . . . . . . . . . . . . . . . 72set print static-members . . . . . . . . . . . . . . . . . . . 74set print symbol-filename . . . . . . . . . . . . . . . . . . 70
8/14/2019 Debugging With GDB - The GNU Source-Level Debugger
http://slidepdf.com/reader/full/debugging-with-gdb-the-gnu-source-level-debugger 327/328
316 Debugging with GDB
set print union . . . . . . . . . . . . . . . . . . . . . . . . . . . . . 72set print vtbl . . . . . . . . . . . . . . . . . . . . . . . . . . . . . . 74set processor args . . . . . . . . . . . . . . . . . . . . . . . . . 158set prompt . . . . . . . . . . . . . . . . . . . . . . . . . . . . . . . . . 165
set remotedebug, MIPS protocol. . . . . . . . . . . .
159set retransmit-timeout . . . . . . . . . . . . . . . . . . . . 159set rstack_high_address . . . . . . . . . . . . . . . . . . . 163set shell . . . . . . . . . . . . . . . . . . . . . . . . . . . . . . . . . . 150set step-mode. . . . . . . . . . . . . . . . . . . . . . . . . . . . . . . 47set symbol-reloading . . . . . . . . . . . . . . . . . . . . . . 121set timeout . . . . . . . . . . . . . . . . . . . . . . . . . . . . . . . . 159set tracepoint . . . . . . . . . . . . . . . . . . . . . . . . . . . . . . . 81set trust-readonly-sections . . . . . . . . . . . . . . 131set tui active-border-mode . . . . . . . . . . . . . . . . 179set tui border-kind . . . . . . . . . . . . . . . . . . . . . . . 179set tui border-mode . . . . . . . . . . . . . . . . . . . . . . . 179
set variable. . . . . . . . . . . . . . . . . . . . . . . . . . . . . . .
123set verbose . . . . . . . . . . . . . . . . . . . . . . . . . . . . . . . . 168set width . . . . . . . . . . . . . . . . . . . . . . . . . . . . . . . . . . 167set write . . . . . . . . . . . . . . . . . . . . . . . . . . . . . . . . . . 126set-mark (C-@) . . . . . . . . . . . . . . . . . . . . . . . . . . . . 267set_debug_traps . . . . . . . . . . . . . . . . . . . . . . . . . . . 142setting variables . . . . . . . . . . . . . . . . . . . . . . . . . . . . 123setting watchpoints . . . . . . . . . . . . . . . . . . . . . . . . . . 37SH . . . . . . . . . . . . . . . . . . . . . . . . . . . . . . . . . . . . . . . . 142‘sh-stub.c’ . . . . . . . . . . . . . . . . . . . . . . . . . . . . . . . . 142share . . . . . . . . . . . . . . . . . . . . . . . . . . . . . . . . . . . . . . 132shared libraries . . . . . . . . . . . . . . . . . . . . . . . . . . . . . 131
sharedlibrary. . . . . . . . . . . . . . . . . . . . . . . . . . . . .
132shell . . . . . . . . . . . . . . . . . . . . . . . . . . . . . . . . . . . . . . . 15shell escape . . . . . . . . . . . . . . . . . . . . . . . . . . . . . . . . . 15show . . . . . . . . . . . . . . . . . . . . . . . . . . . . . . . . . . . . . . . . 21show args . . . . . . . . . . . . . . . . . . . . . . . . . . . . . . . . . . . 25show auto-solib-add . . . . . . . . . . . . . . . . . . . . . . . 132show auto-solib-limit . . . . . . . . . . . . . . . . . . . . . 132show check range . . . . . . . . . . . . . . . . . . . . . . . . . . . 101show check type . . . . . . . . . . . . . . . . . . . . . . . . . . . . 100show complaints . . . . . . . . . . . . . . . . . . . . . . . . . . . 168show confirm. . . . . . . . . . . . . . . . . . . . . . . . . . . . . . . 168show convenience . . . . . . . . . . . . . . . . . . . . . . . . . . . 76show copying
. . . . . . . . . . . . . . . . . . . . . . . . . . . . . . . .
21show debug arch . . . . . . . . . . . . . . . . . . . . . . . . . . . . 169show debug event . . . . . . . . . . . . . . . . . . . . . . . . . . . 169show debug expression . . . . . . . . . . . . . . . . . . . . . 169show debug overload . . . . . . . . . . . . . . . . . . . . . . . 169show debug remote . . . . . . . . . . . . . . . . . . . . . . . . . . 169show debug serial . . . . . . . . . . . . . . . . . . . . . . . . . . 169show debug target . . . . . . . . . . . . . . . . . . . . . . . . . . 169show debug varobj . . . . . . . . . . . . . . . . . . . . . . . . . . 169show demangle-style . . . . . . . . . . . . . . . . . . . . . . . . 74show directories . . . . . . . . . . . . . . . . . . . . . . . . . . . 59show editing. . . . . . . . . . . . . . . . . . . . . . . . . . . . . . . 165show environment
. . . . . . . . . . . . . . . . . . . . . . . . . . .
25show gnutarget . . . . . . . . . . . . . . . . . . . . . . . . . . . . 136show height . . . . . . . . . . . . . . . . . . . . . . . . . . . . . . . . 167show history. . . . . . . . . . . . . . . . . . . . . . . . . . . . . . . 166show input-radix . . . . . . . . . . . . . . . . . . . . . . . . . . 167show language. . . . . . . . . . . . . . . . . . . . . . . . . . . . . . . 98
show listsize. . . . . . . . . . . . . . . . . . . . . . . . . . . . . . . 57show machine . . . . . . . . . . . . . . . . . . . . . . . . . . . . . . . 155show mipsfpu . . . . . . . . . . . . . . . . . . . . . . . . . . . . . . . 158show new-console . . . . . . . . . . . . . . . . . . . . . . . . . . 149
show new-group. . . . . . . . . . . . . . . . . . . . . . . . . . . .
150show opaque-type-resolution . . . . . . . . . . . . . . 121show output-radix . . . . . . . . . . . . . . . . . . . . . . . . . 168show paths . . . . . . . . . . . . . . . . . . . . . . . . . . . . . . . . . . 25show print address . . . . . . . . . . . . . . . . . . . . . . . . . 70show print array . . . . . . . . . . . . . . . . . . . . . . . . . . . . 71show print asm-demangle . . . . . . . . . . . . . . . . . . . . 73show print demangle . . . . . . . . . . . . . . . . . . . . . . . . 73show print elements . . . . . . . . . . . . . . . . . . . . . . . . 72show print max-symbolic-offset. . . . . . . . . . . . . 71show print object . . . . . . . . . . . . . . . . . . . . . . . . . . . 74show print pretty . . . . . . . . . . . . . . . . . . . . . . . . . . . 72
show print sevenbit-strings. . . . . . . . . . . . . . . .
72show print static-members . . . . . . . . . . . . . . . . . . 74show print symbol-filename . . . . . . . . . . . . . . . . . 71show print union . . . . . . . . . . . . . . . . . . . . . . . . . . . . 73show print vtbl . . . . . . . . . . . . . . . . . . . . . . . . . . . . . 74show processor . . . . . . . . . . . . . . . . . . . . . . . . . . . . 158show prompt . . . . . . . . . . . . . . . . . . . . . . . . . . . . . . . . 165show remotedebug, MIPS protocol . . . . . . . . . . . 159show retransmit-timeout . . . . . . . . . . . . . . . . . . . 159show rstack_high_address . . . . . . . . . . . . . . . . . . 163show shell . . . . . . . . . . . . . . . . . . . . . . . . . . . . . . . . . 150show symbol-reloading . . . . . . . . . . . . . . . . . . . . . 121
show timeout. . . . . . . . . . . . . . . . . . . . . . . . . . . . . . .
159show user . . . . . . . . . . . . . . . . . . . . . . . . . . . . . . . . . . 172show values . . . . . . . . . . . . . . . . . . . . . . . . . . . . . . . . . 75show verbose . . . . . . . . . . . . . . . . . . . . . . . . . . . . . . . 168show version . . . . . . . . . . . . . . . . . . . . . . . . . . . . . . . . 21show warranty. . . . . . . . . . . . . . . . . . . . . . . . . . . . . . . 21show width . . . . . . . . . . . . . . . . . . . . . . . . . . . . . . . . . 167show write . . . . . . . . . . . . . . . . . . . . . . . . . . . . . . . . . 126show-all-if-ambiguous . . . . . . . . . . . . . . . . . . . . 256shows . . . . . . . . . . . . . . . . . . . . . . . . . . . . . . . . . . . . . . 166si (stepi) . . . . . . . . . . . . . . . . . . . . . . . . . . . . . . . . . . 48signal . . . . . . . . . . . . . . . . . . . . . . . . . . . . . . . . 125, 190signal-handler-caller
. . . . . . . . . . . . . . . . . . . .
186signal-name . . . . . . . . . . . . . . . . . . . . . . . . . . . . . . . 189signal-name-end . . . . . . . . . . . . . . . . . . . . . . . . . . . 189signal-string . . . . . . . . . . . . . . . . . . . . . . . . . . . . . 189signal-string-end . . . . . . . . . . . . . . . . . . . . . . . . . 189signalled . . . . . . . . . . . . . . . . . . . . . . . . . . . . . . . . . 189signals . . . . . . . . . . . . . . . . . . . . . . . . . . . . . . . . . . . . . . 48silent . . . . . . . . . . . . . . . . . . . . . . . . . . . . . . . . . . . . . . 44sim . . . . . . . . . . . . . . . . . . . . . . . . . . . . . . . . . . . . . . . . 162simulator, Z8000 . . . . . . . . . . . . . . . . . . . . . . . . . . . . 162size of screen . . . . . . . . . . . . . . . . . . . . . . . . . . . . . . . 167software watchpoints . . . . . . . . . . . . . . . . . . . . . . . . . 37source
. . . . . . . . . . . . . . . . . . . . . . . . . . . . . . . .
173, 190source path . . . . . . . . . . . . . . . . . . . . . . . . . . . . . . . . . 59Sparc . . . . . . . . . . . . . . . . . . . . . . . . . . . . . . . . . . . . . . 142‘sparc-stub.c’ . . . . . . . . . . . . . . . . . . . . . . . . . . . . . 142‘sparcl-stub.c’ . . . . . . . . . . . . . . . . . . . . . . . . . . . . 142Sparclet . . . . . . . . . . . . . . . . . . . . . . . . . . . . . . . . . . . . 160

8/14/2019 Debugging With GDB - The GNU Source-Level Debugger
http://slidepdf.com/reader/full/debugging-with-gdb-the-gnu-source-level-debugger 328/328
Index 317
SparcLite . . . . . . . . . . . . . . . . . . . . . . . . . . . . . . . . . . 142speed . . . . . . . . . . . . . . . . . . . . . . . . . . . . . . . . . . . . . . 153ST2000 auxiliary commands . . . . . . . . . . . . . . . . . 162st2000 cmd . . . . . . . . . . . . . . . . . . . . . . . . . . . . . . . . 162
stack frame. . . . . . . . . . . . . . . . . . . . . . . . . . . . . . . . . .
53stack on Alpha . . . . . . . . . . . . . . . . . . . . . . . . . . . . . 163stack on MIPS . . . . . . . . . . . . . . . . . . . . . . . . . . . . . 163stack traces . . . . . . . . . . . . . . . . . . . . . . . . . . . . . . . . . 54stacking targets . . . . . . . . . . . . . . . . . . . . . . . . . . . . . 135start a new trace experiment . . . . . . . . . . . . . . . . . 85start-kbd-macro (C-x () . . . . . . . . . . . . . . . . . . . 266starting . . . . . . . . . . . . . . . . . . . . . . . . . . . . . . . . . . . . . 23starting . . . . . . . . . . . . . . . . . . . . . . . . . . . . . . . . . . 189status of trace data collection . . . . . . . . . . . . . . . . . 85status output in gdb/mi . . . . . . . . . . . . . . . . . . . . 193STDBUG commands (ST2000) . . . . . . . . . . . . . . 162
step. . . . . . . . . . . . . . . . . . . . . . . . . . . . . . . . . . . . . . . .
46stepi . . . . . . . . . . . . . . . . . . . . . . . . . . . . . . . . . . . . . . . 48stepping . . . . . . . . . . . . . . . . . . . . . . . . . . . . . . . . . . . . 45stepping into functions with no line info . . . . . . . 47stop a running trace experiment . . . . . . . . . . . . . . 85stop, a pseudo-command . . . . . . . . . . . . . . . . . . . . 172stopped threads . . . . . . . . . . . . . . . . . . . . . . . . . . . . . 50stopping . . . . . . . . . . . . . . . . . . . . . . . . . . . . . . . . . . 189stream records in gdb/mi . . . . . . . . . . . . . . . . . . . 195stub example, remote debugging . . . . . . . . . . . . . 141stupid questions . . . . . . . . . . . . . . . . . . . . . . . . . . . . 168switching threads . . . . . . . . . . . . . . . . . . . . . . . . . . . . 28
switching threads automatically. . . . . . . . . . . . . . .
30symbol decoding style, C++ . . . . . . . . . . . . . . . . . . . 73symbol dump . . . . . . . . . . . . . . . . . . . . . . . . . . . . . . . 121symbol from address . . . . . . . . . . . . . . . . . . . . . . . . 119symbol names . . . . . . . . . . . . . . . . . . . . . . . . . . . . . . 119symbol overloading . . . . . . . . . . . . . . . . . . . . . . . . . . 44symbol table . . . . . . . . . . . . . . . . . . . . . . . . . . . . . . . 127symbol-file . . . . . . . . . . . . . . . . . . . . . . . . . . . . . . . 127symbols, reading from relocatable object files . . 129symbols, reading immediately . . . . . . . . . . . . . . . . 128sysinfo. . . . . . . . . . . . . . . . . . . . . . . . . . . . . . . . . . . . 147
Ttab-insert (M-TAB) . . . . . . . . . . . . . . . . . . . . . . . . 264target . . . . . . . . . . . . . . . . . . . . . . . . . . . . . . . . . . . . . 135target abug . . . . . . . . . . . . . . . . . . . . . . . . . . . . . . . . 157target array. . . . . . . . . . . . . . . . . . . . . . . . . . . . . . . 158target bug . . . . . . . . . . . . . . . . . . . . . . . . . . . . . . . . . 157target byte order . . . . . . . . . . . . . . . . . . . . . . . . . . . 137target core . . . . . . . . . . . . . . . . . . . . . . . . . . . . . . . . 136target cpu32bug . . . . . . . . . . . . . . . . . . . . . . . . . . . 157target dbug . . . . . . . . . . . . . . . . . . . . . . . . . . . . . . . . 157target ddb port . . . . . . . . . . . . . . . . . . . . . . . . . . . . 158target dink32
. . . . . . . . . . . . . . . . . . . . . . . . . . . . .
159target e7000, with H8/300 . . . . . . . . . . . . . . . . . . 152target e7000, with Hitachi ICE . . . . . . . . . . . . . 154target e7000, with Hitachi SH . . . . . . . . . . . . . . 159target es1800 . . . . . . . . . . . . . . . . . . . . . . . . . . . . . 157target est . . . . . . . . . . . . . . . . . . . . . . . . . . . . . . . . . 157
target exec . . . . . . . . . . . . . . . . . . . . . . . . . . . . . . . . 136target hms, and serial protocol . . . . . . . . . . . . . . 154target hms, with H8/300 . . . . . . . . . . . . . . . . . . . . 152target hms, with Hitachi SH . . . . . . . . . . . . . . . . 159
target lsi port. . . . . . . . . . . . . . . . . . . . . . . . . . . .
158target m32r . . . . . . . . . . . . . . . . . . . . . . . . . . . . . . . . 156target mips port . . . . . . . . . . . . . . . . . . . . . . . . . . . 157target mon960 . . . . . . . . . . . . . . . . . . . . . . . . . . . . . 155target nindy . . . . . . . . . . . . . . . . . . . . . . . . . . . . . . . 155target nrom . . . . . . . . . . . . . . . . . . . . . . . . . . . . . . . . 137target op50n . . . . . . . . . . . . . . . . . . . . . . . . . . . . . . . 159target output in gdb/mi . . . . . . . . . . . . . . . . . . . . 193target pmon port . . . . . . . . . . . . . . . . . . . . . . . . . . . 158target ppcbug . . . . . . . . . . . . . . . . . . . . . . . . . . . . . 159target ppcbug1 . . . . . . . . . . . . . . . . . . . . . . . . . . . . 159target r3900 . . . . . . . . . . . . . . . . . . . . . . . . . . . . . . . 158
target rdi. . . . . . . . . . . . . . . . . . . . . . . . . . . . . . . . .
152target rdp . . . . . . . . . . . . . . . . . . . . . . . . . . . . . . . . . 152target remote . . . . . . . . . . . . . . . . . . . . . . . . . . . . . 136target rom68k . . . . . . . . . . . . . . . . . . . . . . . . . . . . . 157target rombug . . . . . . . . . . . . . . . . . . . . . . . . . . . . . 157target sds . . . . . . . . . . . . . . . . . . . . . . . . . . . . . . . . . 159target sh3, with H8/300 . . . . . . . . . . . . . . . . . . . . 152target sh3, with SH . . . . . . . . . . . . . . . . . . . . . . . . 160target sh3e, with H8/300 . . . . . . . . . . . . . . . . . . . 152target sh3e, with SH . . . . . . . . . . . . . . . . . . . . . . . 160target sim . . . . . . . . . . . . . . . . . . . . . . . . . . . . . . . . . 136target sim, with Z8000 . . . . . . . . . . . . . . . . . . . . . 162
target sparclite. . . . . . . . . . . . . . . . . . . . . . . . . .
161target vxworks . . . . . . . . . . . . . . . . . . . . . . . . . . . . 150target w89k . . . . . . . . . . . . . . . . . . . . . . . . . . . . . . . . 159tbreak . . . . . . . . . . . . . . . . . . . . . . . . . . . . . . . . . . . . . . 35TCP port, target remote . . . . . . . . . . . . . . . . . . . 144tdump . . . . . . . . . . . . . . . . . . . . . . . . . . . . . . . . . . . . . . . 87terminal . . . . . . . . . . . . . . . . . . . . . . . . . . . . . . . . . . . . 26tfind . . . . . . . . . . . . . . . . . . . . . . . . . . . . . . . . . . . . . . . 85thbreak . . . . . . . . . . . . . . . . . . . . . . . . . . . . . . . . . . . . . 35this, inside C++ member functions . . . . . . . . . . . 104thread apply . . . . . . . . . . . . . . . . . . . . . . . . . . . . . . . . 30thread breakpoints . . . . . . . . . . . . . . . . . . . . . . . . . . . 50thread identifier (GDB)
. . . . . . . . . . . . . . . . . . . . . .
29thread identifier (system) . . . . . . . . . . . . . . . . . . . . . 28thread identifier (system), on HP-UX . . . . . . . . . . 29thread number . . . . . . . . . . . . . . . . . . . . . . . . . . . . . . 29thread threadno . . . . . . . . . . . . . . . . . . . . . . . . . . . . . 30threads and watchpoints . . . . . . . . . . . . . . . . . . . . . 38threads of execution . . . . . . . . . . . . . . . . . . . . . . . . . 28threads, automatic switching . . . . . . . . . . . . . . . . . 30threads, continuing . . . . . . . . . . . . . . . . . . . . . . . . . . 50threads, stopped . . . . . . . . . . . . . . . . . . . . . . . . . . . . . 50tilde-expand (M-~) . . . . . . . . . . . . . . . . . . . . . . . . 267timeout, MIPS protocol . . . . . . . . . . . . . . . . . . . . . 159trace
. . . . . . . . . . . . . . . . . . . . . . . . . . . . . . . . . . . . . . .
81trace experiment, status of . . . . . . . . . . . . . . . . . . . 85tracebacks. . . . . . . . . . . . . . . . . . . . . . . . . . . . . . . . . . . 54tracepoint actions . . . . . . . . . . . . . . . . . . . . . . . . . . . . 83tracepoint data, display . . . . . . . . . . . . . . . . . . . . . . 87tracepoint deletion . . . . . . . . . . . . . . . . . . . . . . . . . . . 82