dec nature conservation service biodiversity standard ... · dec nature conservation service...
TRANSCRIPT

DEC Nature Conservation Service
Biodiversity
Standard Operating Procedure
Establishing Vegetation Quadrats
SOP No:6.1
Prepared by:
Vanessa Clarke, Senior Project Officer, Species and Communities Branch, Dick Perry Avenue, Kensington WA
Prepared for:
Significant Native Species and Ecological Communities – Resource Condition Monitoring Project
Version 1.0 (June 2009)

Establishing Vegetation Quadrats
Approvals
Version 1.0
Approved by: Date: 22 June 2009 Val English Principal Ecologist, DEC Species and Communities Branch
Acknowledgments
Advice for compiling the content of this standard operating procedure was sought from Bronwen Keighery, Terrestrial Ecosystems Branch, Department of Environment and Conservation.
Revision History Log Version # Revision Date Author Changes

Establishing Vegetation Quadrats
Page - 0 -
Table of Contents
1 Purpose.................................................................................... 1
2 Scope ....................................................................................... 1
3 Equipment and Materials Required ..................................... 1
4 Procedure ................................................................................ 2
5 Safety Considerations ........................................................... 6
6 Further Reading...................................................................... 6
7 References .............................................................................. 6
8 Appendices ............................................................................. 0
Appendices
Appendix A Example page from a field herbarium book. Appendix B Species accumulation curves. Figures Figure 1 An example of an established 100m2 quadrat. Figure 2 The set-up of quadrat shapes and sizes for establishing a species accumulations
curve.

Establishing Vegetation Quadrats
Page - 1 -
1 Purpose
This protocol details the methodology to study vegetation through quadrat sampling in Western Australia. The method has been used extensively in temperate regions and has been utilised across all bioregions in Western Australia. The methods described here will be used to conduct assessment in a standardised manner at all sites so that suitable comparisons between sites can be made. This method is to be adapted to suit the vegetation scale, type and bioregion in which the vegetation is to be sampled. Generally, in the more temperate Swan Coastal Plain (Gibson et al. 1994), Darling Scarp (Markey 1997), lower south-west (Gibson et al. 2000) and areas of high species diversity (George et al. 1979) vegetation is adequately sampled within 100 m2; for the wheatbelt, 20 x 20 m plots have been used for the overstorey and 10 x 10 m plots for the understorey (Keighery 2004); interzone areas can be sampled within 900 m2 (Patrick 2001); and the arid interior 2500 m2 (Hnatiuk and Kenneally 1981). However, the most accurate way to determine the appropriate quadrat size for sampling any vegetation is by establishing and analysing species accumulation curves (Appendix B). The standard method chosen for the assessment of plant diversity by DEC staff in WA involves the use of square vegetation quadrats (‘plots’). Quadrats can be used to measure most vegetation attributes in most vegetation types. They are two-dimensional sample units, typically square but can be of any size or shape. In some cases, a measuring tape may be laid out to define the quadrat, but a quadrat can also be constructed with a frame created from narrow steel or plastic piping and carried from one sampling location to the next. Additionally, relevé quadrats can be used in rapid assessments by experienced staff and use no physical markers for the quadrat boundaries. An example of the layout of a quadrat is illustrated in Figure 1. The location of these plots should be chosen randomly so as not to create a subjective bias, however its location needs to be stratified within representative vegetation of one type, placed in a representative area and not sampling ecotones. Details of how to establish these plots, collect data and specimens, and data management are presented below. Permanent quadrats are a useful technique which will allow repeated visits to re-sample the vegetation in different seasons and in subsequent years. Quadrat location may be marked by pegs or by following a grid system. Although labor-intensive to establish, the permanent siting of quadrats offers the considerable advantage of removing some of the error associated with different placement of the sample unit at each sampling event. Therefore, these techniques are most suitable for small-scale studies, but may be impractical for large-scale inventory or monitoring programs (such as departmental biological surveys). Oosting (1956) found that "the use of permanent quadrats has been advocated by many ecologists, but few have followed their own excellent advice. Whenever there is the possibility that a sampling area may again be visited for further study, the quadrats should be marked permanently, for surprisingly worthwhile results may be obtained by restudying identical areas over a period of years. Such results are often valuable out of all proportion to the effort required, especially when compared to the initial study". The key purpose of this protocol is to provide detailed methods to simply and consistently assess vegetation types, and collect baseline information for monitoring. The objective is to provide an easy to use method which can be utilised by DEC staff as a standard operating procedure which will allow for comparison with data from other surveys.
2 Scope
This standard operating procedure applies to anyone wishing to conduct a floristic survey of a vegetation community. The SOP is applicable across WA as it can be adapted for various sized quadrats in different vegetation types. Botanists will already be familiar with the establishment of quadrats and will find this information consistent with current published literature.
3 Equipment and Materials Required
• GPS unit (differential if possible) (1) • relevant maps

Establishing Vegetation Quadrats
Page - 2 -
• relevant species lists • clinometer (1) • compass (2) / optical square (1) • digital camera (1) • batteries for all electronic equipment • flagging (surveyors) tape – for marking location and access (1) • 50-100 m tape (or pre-measured quadrat rope) (1-4) • steel pickets or fence droppers (4 per quadrat) • utility tool or pliers • plant collecting permit (obtained through DEC Licensing Branch) • plants specimen collecting book • metal fence stakes (or similar) (4) • hammer – for hammering rebar/fence droppers/stakes • sighting poles – for slope measurements • fluorescent spray paint to mark posts • tags and wire • measuring tapes (4) • yellow caps – fit over the ends of each stake to increase visibility (and decrease likelihood
of injury) • data sheets (or hand held PDA for electronic recording) • plant press, newspaper and cardboard corrugates • small paper bags/envelopes (for seed and fruit collections) • tags (such as jeweller’s) • tape (and dispenser or scissors) 50mm wide Scotch tape • pencils, pens, erasers • secateurs
4 Procedure
Desktop and Pre-field Preparations The following steps will need to be completed in preparation for the field-based survey:
• gather site location information - including maps with tenure details, aerial imagery, spatial and cadastral information;
• review previous reports, flora lists, field guides and plant collections for the site and surrounding areas;
• have plant collection permits organised; • select the tentative location and placement of survey quadrats; • prepare data collection sheet (or electronic form); and • gain permission to enter and survey the study site.
Depending on the size of your quadrat, the methods used to establish the plot will vary slightly but the details of recording will be similar. For establishing 10 by 10 metre quadrats, an excellent resource published by the Wildflower Society of WA (Inc.) already exists (Keighery 1994), that details the methods for establishing and recording 100m2 quadrats. The Wildflower Society of WA (Inc.) can supply this reference and can provide training to new practioners. The reference is available through the following website: http://members.ozemail.com.au/~wildflowers/ebooks-sorted.html#Bushland%20Surveys
Field-based methods The number of quadrats used to sample the vegetation will depend on the time available, the heterogeneity of the habitat, and number of replicates needed for statistical significance. Given the complexity of some habitats within WA, the exact number of replicate quadrats will depend on the time and resources available. It is recommended that as many plots as possible are sampled during the allotted timeframe.

Establishing Vegetation Quadrats
Page - 3 -
The botanist, aided by cartographic information, remote sensing photographs, and field verification will determine the initial siting of the plot. The exact location of these plots should be selected randomly within areas of vegetation in good condition. Selection of the plot site is crucial to the value of the research and should be based on the following criteria:
• the area should contain species representative and endemic to the ecosystem; • common or dominant species should be represented; and • the plot must be located wholly within one vegetation type to give a true representation of
the area's diversity.
Figure 1: An example of an established 100m2 quadrat (Photo: V. English DEC, Swan Coastal Plain WA) Collect Data about the Plot and its Environment It is very important that sufficient reference information about the plot and its habitat be collected so that any changes in the vegetation between sites can be explained. For example, the vegetation on a steep north facing slopes of montane regions may be quite different from a site on a south facing slope. Since the sites will vary in elevation and other features it is important that these be noted. The spatial distribution of sites can also help discern patterns in vegetation structure. The variables to be measured include:
• Latitude and Longitude information (along with UTM values): this can be obtained from the GPS unit. enter values for degrees, minutes and seconds;
• elevation: use an altimeter. Vertical values provided by the GPS unit are not as accurate. Make sure that the altimeter remains calibrated. Enter values in metres;
• slope: this is an angular measurement of how steep the ground is inclined. Units are degrees. To measure slope, use a theodolite and a surveying stick to calculate the angle of the ground. Alternatively, tie a 20m long string between two poles at the same height. Place these poles along the elevation gradient of the plot and measure the angles of the string using a compass;
• aspect: this is the compass direction that the slope faces (i.e. N, NE, E, SE, S, SW, W, NW, N); and
• soil characteristics: The percentage of sand, silt, clay and organic material in the soil. This is measured by taking a soil sample and placing it in a 1000ml glass cylinder up to the 300ml mark. Add water to almost the top and mix thoroughly so that all clumps are broken.

Establishing Vegetation Quadrats
Page - 4 -
Allow the sediment to settle (takes 30 min or longer depending on the amount of clay). The sand and gravel normally settles on the bottom, followed by the silt, then the clay and finally the organic material. These form layers that can be measured with a ruler to calculate proportional values.
Establish the Plot To establish a 10 by 10 metre quadrat, the method described in the Wildflower Society of WA (Inc.) publication ”Bushland Plant Survey, A Guide to Plant Community Survey for the Community” (Keighery 1994) is well illustrated and instructive and is available from The Wildflower Society of WA (Inc.) through: http://members.ozemail.com.au/~wildflowers/ebooks-sorted.html#Bushland%20Surveys For larger quadrats the use of measuring tapes and an optical square is recommended. Refer to SOP 4.2 “Using an optical square”, which describes the way in which the optical square guides the establishment of a quadrat using a rope or measuring tape(s). Permanently marking the plot corners It is recommended that all four corners of your quadrat are marked with some kind of permanent marker that is suitable to the area and soil substrate in which it is located. Traditionally, star pickets and fence droppers have been used but in shallow soils something such as a tent peg may be more suitable. Survey suppliers have a range of markers in a range of materials that could be utilised. It is important to consider the potential impacts of fire and salinity when selecting markers. Using a differential GPS to record the quadrat corners and drawing a detailed mud-map will assist in relocating the plot. Measure the Vegetation There are a number of features of the flora and vegetation that need to be recorded and described. These include but are not limited to:
• location description (may include site descriptor code and a sketch); • date; • recorder’s name and participants; • mud map or sketch of quadrat location within the site; • location coordinates (AMG or lat/long); • photograph numbers and time taken; • geological information (soil type, texture, colour; presence of rocks, outcropping, etc); • hydrological information (site inundation, surface flows, etc); • topographical information (position in the landscape, aspect, slope); • vegetation structure and cover description (for each vegetation stratum record dominant
life forms and cover class); • vegetation condition (using Keighery’s scale on the Swan Coastal Plain) including
comments on visible signs of disturbance or anthropogenic alteration; and • species presence (including field id, collection number, life form type).
The Wildflower Society of WA (Inc.) publication “Bushland Plant Survey, A Guide to Plant Community Survey for the Community” (Keighery 1994) contains blank field sheets which can be photocopied and used for collecting the aforementioned information. These field data sheets are a good basis for collecting consistent information. A recently modified version can also be found on the Western Australian Local Government’s website: http://www.walga.asn.au/about/policy/pbp/documents/naia_templates.pdf

Establishing Vegetation Quadrats
Page - 5 -
Figure 2 Taking measurements of vegetation within a quadrat (Photo M. Davis DEC, Lake Bryde WA) Creating a field herbarium book For all quadrats established, a field herbarium book should be created. This is a book (either loose leaf or exercise book) with a representative sample of all plants recorded from your quadrat. A small piece of material (usually no more the 5 x 10 cm) is stuck with porous 3M tape onto the page with enough space to write the collection name and number and space to write the determined name at a later date. These samples are collected in addition to voucher specimens. The book is then used each time the quadrat is visited. Appendix A has an example page from a field herbarium book to demonstrate the layout and material required. Collection of Voucher Specimens Collection of voucher specimens aids the full identification of taxa within the quadrat and if lodged at the WA Herbarium, become a permanent record with taxonomy that will remain up-to-date should a revision occur. Botanists need to ensure they have the appropriate licenses for collection of plant specimens. Botanists should discuss collection and lodgement of specimens with the WA Herbarium. Wherever possible, the botanist should identify morpho-species in the field in order to reduce the need for multiple collections. All plant taxa inventoried in the plot should have an associated small collection pressed into an exercise book (or similar) as a useful reference collection for that quadrat. In addition, the botanists can make general collections of species not inventoried within the plot. These collections should be noted as collected from adjacent areas (but still within the same vegetation type). The specimens will be initially processed in the field and then pressed in newspaper and cardboard corrugates held in a plant press. Subsequent drying of the specimens will take place on return to the office and then specimens provided to the herbarium. Refer to SOP “Collecting Herbarium Specimens” (in draft). Data management Data collected in the field should be processed according to the way in which it was collected: either in hardcopy field data sheets; or as electronic data collected from PDAs. Hardcopy datasheets should be checked and photocopied/scanned with the data sheets filed in two separate places (digital scans to be held in computer folders that are routinely backed-up).

Establishing Vegetation Quadrats
Page - 6 -
Electronic data should be downloaded, a copy printed for the file and the data saved in two places. All data, once verified can be entered into a database (e.g. Site Species (T. Griffin) database). The Site Species database enables users to efficiently manage the complex spatial and temporal data collected and to prepare a preliminary analysis. Systems Requirements:
• Windows 95 /98 or Windows NT; • 16 megabytes RAM; • megabytes of disk space with additional space required for data; and • 640 x 480 monitor.
5 Safety Considerations
It is recommended that a job safety analysis is undertaken prior to undertaking quadrat surveys at your site. This safety analysis should include the following considerations:
• exposure to sun (UV); • potential trip or fall injury; • venomous snakes, ticks; • driving (4wd or light vehicle); • dehydration; and • disorientation.
6 Further Reading
The following SOPs have been mentioned in the advice regarding Establishing Vegetation Quadrats. It is recommended that the following SOPs are also consulted when proposing to undertake quadrat based survey:
SOP 4.2 Using an optical square
SOP Collecting Herbarium Specimens (in draft)
7 References
Beeby, A. 1993. Applying Ecology. Chapman and Hall, London UK. Comiskey, J. Dallmeier F. and Mistry S. 2000 Draft Vegetation Sampling Protocols for the Selva
Maya. Monitoring and Assessment of Biodiversity Program, Smithsonian Institution, Washington DC, USA.
Dallmeier, F. 1992. Long-term monitoring of biological diversity in tropical forest areas. Methods for
establishment and inventory of permanent plots. MAB Digest Series, 11. UNESCO Paris, France. Dallmeier, F. and Comiskey, J. A. 1996 From the forest to the user: a methodology update. Manu:
The biodiversity of southeastern Peru; la biodiversidad del sureste del Peru (Wilson, D. and A. Sandoval, Eds.). Smithsonian Institution Press. Washington, DC. pp 41-56.
Elzinga, C.L., Salzer, D.W., Willoughby, J.W. and Gibbs, J.P. 2001. Monitoring Plant and Animal
Populations. Blackwell Science Inc. Massachusetts, USA. Feinsinger, P. 2001. Designing Field Studies for Biodiversity Conservation. Island Press, Washington. Gaston, K.K. (ed.) 1996 Biodiversity - a Biology of Numbers and Difference. Blackwell Science Ltd.,
Oxford. George, A. S., Hopkins, A. J. M., Marchant, N. G. 1979. The heathlands of Western Australia. In:
Ecosystems of the World Vol.9A. Heathlands and related shrublands. Descriptive Studies, ed. R.L. Specht, pp. 61-84, Elsevier, Amsterdam.

Establishing Vegetation Quadrats
Page - 7 -
Greig-Smith, P. 1984 Quantitative Plant Ecology. Blackwell Science Ltd., Oxford. Hnatiuk, R. J., Kenneally, K. F. 1981. A survey of the vegetation and flora of Mitchell Plateau,
Kimberley, Western Australia In: Biological Survey of Mitchell Plateau and Admiralty Gulf, Kimberley, Western Australia: Papers Resulting from a Joint Field Expedition by the Western Australian Museum and the Field Museum of Natural History, Chicago, 1976-1977. pp. 13-94. Western Australian Museum, Perth WA.
Keighery, B. 1994 Bushland Plant Survey: A Guide for Community Surveys. Wildflower Society of
Western Australia, Perth WA. Magurran, A.E. 2004. Measuring Biological Diversity. Blackwell Publishing, Oxford) Oosting, H.J. 1956. The study of plant communities: an introduction to plant ecology. 2nd ed. W.H.
Freeman and Company, San Francisco, USA. Patrick, S. 2001. Botanical survey with the aid of volunteers: a study of the vegetation on a
Murchison station. In: Acacia Symposium: the Conservation and Utilisation Potential of Australian Dryland Acacias: 13-14th July, 2001, Dalwallinu, Western Australia. p. 1. Shire of Dalwallinu, Dalwallinu, W.A.
Tokeshi, M. 1993. Species abundance patterns and community structure. Adv. Ecol Res. 24: 111-184. Williams, C.B. 1964 Patterns in the Balance of Nature and Related Problems in Quantitative Ecology.
Academic Press, New York.
Establishing Vegetation Quadrats
Page - 0 -
8 Appendices
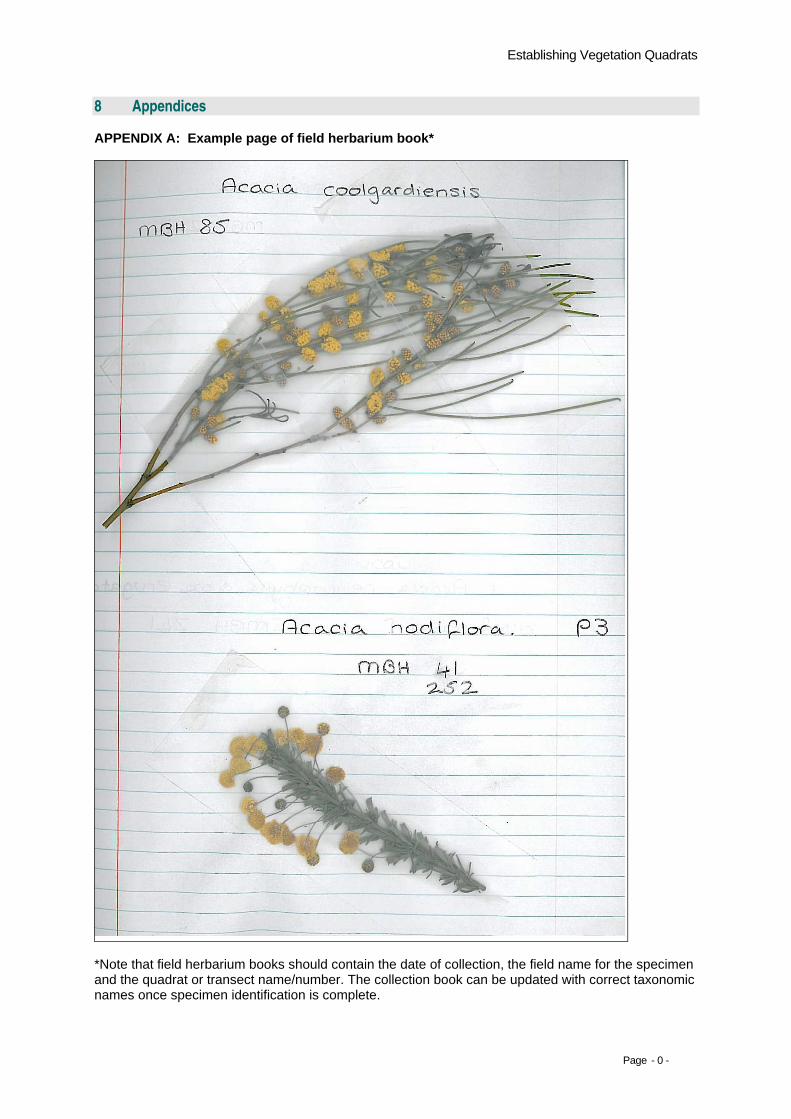
APPENDIX A: Example page of field herbarium book*
*Note that field herbarium books should contain the date of collection, the field name for the specimen and the quadrat or transect name/number. The collection book can be updated with correct taxonomic names once specimen identification is complete.

Establishing Vegetation Quadrats
Page - 1 -
APPENDIX B: SPECIES ACCUMULATION CURVES
1. Sample Size Analysis of plant communities for diversity and abundance is often based on analysis of a number of ‘plots’ or ‘quadrats’ which are sited at random and which are of a statistically significant size (e.g. containing 90% of the species within the study area) which can be determined. For species diversity we use the method of progressive doubling of sample area (see below) to determine the minimum sample area—i.e. determination of a ‘species area’ curve.
Figure 1 The set-up of quadrat shapes and sizes for establishing a species accumulation curve Hence, if you start with a quadrat 0.5x 0.5 m = 0.25 m2 and double it each time, you get: 0.25, 0.5, 1, 2, 4, 8, 16, 32, 64 m2. Commence by forming the smallest quadrat and number consecutively and sample of each of the species in your quadrat and place a small specimen of each into a field herbarium book. Record the total number of species for each quadrat size. Extend the quadrat to the size of the next biggest quadrat and continue collecting and numbering consecutively species which did not appear in the first quadrat. Continue this process as you increase the quadrat size so that eventually you will have a collection of all the species you located, with each having a number.

Establishing Vegetation Quadrats
Page - 2 -
Figure 2 (a) The rise in the number of species recorded with increasing sample size. Eventually this tails off as fewer rare species are left to be recorded. Plotted as logarithms (b), this produces a straight line (Beeby 1993). In fairly uniform habitat a plot of the total number of species (S) against the area sampled (A) produces a characteristic curve. The increase in S is initially rapid as the most abundant species are recorded but the rate of increase declines as the sample area gets larger and only the rarer species are yet to be noted. A minimum sample area would be a quadrat size containing 90% of the total species present in the plant community.