decarbonising 7+(6287+b$)5,&$1 mining sector
TRANSCRIPT
JUST TRANSITION AND CLIMATE PATHWAYS STUDY FOR SOUTH AFRICA
DECARBONISING THE SOUTH AFRICAN MINING SECTOR
IN PARTNERSHIP WITH
04C
HA
PTER

2 JUST TRANSITION AND CLIMATE PATHWAYS STUDY FOR SOUTH AFRICA
ACKNOWLEDGEMENTS
Strategic Partnerships for the Implementation of the Paris Agreement (SPIPA): Climate change is a global threat that requires a decisive and confident response from all communities, particularly from major economies that represent roughly 80% of global greenhouse gas emissions. The 2015 Paris Agreement complemented by the 2018 Katowice climate package, provides the essential framework governing global action to deal with climate change and steering the worldwide transition towards climate-neutrality and climate-resilience. In this context, policy practitioners are keen to use various platforms to learn from one another and accelerate the dissemination of good practices.
To improve a geopolitical landscape that has become more turbulent, the EU set out in 2017 to redouble its climate diplomacy efforts and policy collaborations with major emitters outside Europe in order to promote the implementation of the Paris Agreement. This resulted in the establishment of the SPIPA programme in order to mobilise European know-how to support peer-to-peer learning. The programme builds upon and complements climate policy dialogues and cooperation with major EU economies.
This publication was produced with the financial support of the European Union’s Partnership Instrument and the German Federal Ministry for the Environment, Nature Conservation, and Nuclear Safety (BMU) in the context of the International Climate Initiative (IKI). The contents of this publication are the sole responsibility of National Business Initiative (NBI) and do not necessarily reflect the views of the funders.
of the Federal Republic of Germany
Supported by:
RESEARCH SUPPORTED BY
We Mean Business: This is a global coalition of nonprofit organisations working with the world’s most influential businesses to take action on climate change. The coalition brings together seven organisations: BSR, CDP, Ceres, The B Team, The Climate Group, The Prince of Wales’s Corporate Leaders Group and the World Business Council for Sustainable Development. Together we catalyze business action to drive policy ambition and accelerate the transition to a zero-carbon economy. NBI has been a regional network partner to WMB since the beginning of 2015.
UK PACT South Africa: UK PACT has partnered with South Africa to support action on Just Transition pathways and a low-carbon economic recovery. As the third largest economy in Africa, South Africa plays a critical role in economic and policy priority setting at a continental level and across the Southern Africa region. South Africa’s long-standing participation in the United Nations Framework Convention on Climate Change (UNFCCC) processes creates a solid platform for an impactful and transformational UK PACT partnership. Moreover, UK PACT seeks to support climate action that will contribute to the realisation of other development imperatives in South Africa, such as job creation and poverty alleviation. Priority areas of focus for UK PACT in South Africa are aligned with key national priorities in the just energy transition, renewable energy, energy efficiency, sustainable transport, and sustainable finance. UK PACT projects can contribute to addressing industry-wide constraints, common metropolitan challenges, and bringing city, provincial and national level public and private partners together to address climate priorities.
3CHAPTER 4: DECARBONISING THE SOUTH AFRICAN MINING SECTOR
PARTNERS
National Business Initiative
At the National Business Initiative (NBI), we believe in collective action and collaboration to effect change; building a South African society and economy that is inclusive, resilient, sustainable and based on trust. We are an independent, business movement of around 80 of South Africa’s largest companies and institutions committed to the vision of a thriving country and society. The NBI works with our members to enhance their capacity for change, leverage the power of our collective, build trust in the role of business in society, enable action by business to transform society and create investment opportunities.
Business Unity South Africa
BUSA, formed in October 2003, is the first representative and unified organisation for business in South Africa. Through its extensive membership base, BUSA represents the private sector, being the largest federation of business organisations in terms of GDP and employment contribution. BUSA’s work is largely focused around influencing policy and legislative development for an enabling environment for inclusive growth and employment.
Boston Consulting Group
BCG partners with leaders in business and society to tackle their most important challenges and capture their greatest opportunities. BCG, the pioneer in business strategy when it was founded in 1963, today works closely with clients to embrace a transformational approach aimed at benefitting all stakeholders — empowering organisations to grow, build sustainable competitive advantage, and drive positive societal impact. Their diverse global teams are passionate about unlocking potential and making change happen, and delivering integrated solutions.

4 JUST TRANSITION AND CLIMATE PATHWAYS STUDY FOR SOUTH AFRICA
TERMINOLOGIES
AFOLU Agriculture, Forestry and Other Land UseARENA Australian Renewable Energy Agency
BEV Battery Electric VehicleBF Blast Furnace
BOF Basic Oxygen FurnaceCAPEX Capital Expenditure
CCUS Carbon Capture Utilisation and StorageCO2e Carbon dioxide equivalentCRD Collaborative Regional DevelopmentCSIR Council for Scientific and Industrial ResearchCTL Coal to liquid
DACCS Direct Air Carbon Capture and StorageDHESI Department of Higher Education, Science and
InnovationDMRE Department of Mineral Resources and Energy
DRC Democratic Republic of CongoDRI Direct Reduced IronDSI Department of Science and Innovation
EAF Electric Arc FurnaceEIA United States Energy Information AdministrationETI Energy Transitions InitiativeEU European UnionEV Electric Vehicle
FCEV Fuel Cell Electric VehicleFFI Fortescue Future Industries
GDP Gross Domestic ProductGHGI Greenhouse Gas National Inventory
GJ GigajouleGreen
HydrogenHydrogen produced from renewable energy resources
Gt Gigatonne (one thousand million tonnes)GW Gigawatt
H2 HydrogenHDV Heavy-duty vehicle
ICE Internal Combustion EngineIEA International Energy Agency
IPCC Intergovernmental Panel on Climate ChangeIPP Independent Power Producer
K Thousandkg Kilogram
Minerals Council
Minerals Council South Africa
MCUS Methane Capture, Utilisation and Storage
Mt Megatonne (one million tonnes)MW Megawattn/a Not applicable
NDC Nationally Determined ContributionNERSA National Energy Regulator of South Africa
NPV Net Present ValueOCGT Open Cycle Gas TurbineOEM Original Equipment Manufacturer
OPEX Operational ExpenditureP2X Power-to-X
Peak load Maximum of electrical power demandPGMs Platinum Group Metals
PPA Power Purchase AgreementPV Solar photovoltaic technology
RCP Representative Concentration PathwayRE Renewable Energy
REIPPPP Renewable Energy Independent Power Producer Procurement Programme
SA South AfricaScope 1
emissionsAll direct emissions from activities of an organisation under their control, including on-site fuel combustion for fleet vehicles, stationary machinery and heating process and fugitive emissions from drilling or spontaneous combustion of coal
Scope 2 emissions
Indirect emissions from electricity and steam purchased and used by the organisation. Emissions are created during the production of the electricity or steam that are used by the organisation
Scope 3 emissions
All indirect emissions (not included in Scope 2) that occur in the value chain of the respective organisation, including both upstream and downstream emissions (e.g., emissions linked to use of the organisation’s products)
SDS IEA Sustainable Development ScenarioSSA Sub-Saharan Africa
STEPS IEA Stated Policies ScenarioTWh Terawatt-hour
UNFCCC United Nations Framework Convention on Climate Change
US United StatesWACC Weighted Average Cost of Capital
ZEV Zero Emissions Vehicle
5CHAPTER 4: DECARBONISING THE SOUTH AFRICAN MINING SECTOR
JUST TRANSITION AND CLIMATE PATHWAYS STUDY FOR SOUTH AFRICA
SERIES INCLUDES:
01 Decarbonising South Africa’s power system
02 Decarbonising the South African petrochemicals and chemicals sector
03 The role of gas in South Africa’s transition
04 Decarbonising the South African mining sector
05 Decarbonising the agriculture, forestry and land use sector in South Africa
06 Decarbonising the South African transport sector
07 South Africa’s green hydrogen opportunity
08 Challenges and opportunities for a Just Transition
CONTENTS
Acknowledgements 2
Terminologies 4
Overview of CEO Champions 6
1. FOREWORD 8
2. INTRODUCTION 10
2.1 The purpose of this report 10
2.2 The case for change 10
2.3 Objective and approach 14
3. KEY FINDINGS OF THE MINING SECTOR ANALYSIS 20
3.1 Scope and approach of the mining sector analysis 22
3.2 Moving the South African mining sector towards net-zero 22
3.3 Emerging pathways for South Africa’s mining sector 56
3.4 How to enable the net-zero transition for South Africa’s mining sector 59
4. OUTLOOK 62

6 JUST TRANSITION AND CLIMATE PATHWAYS STUDY FOR SOUTH AFRICA
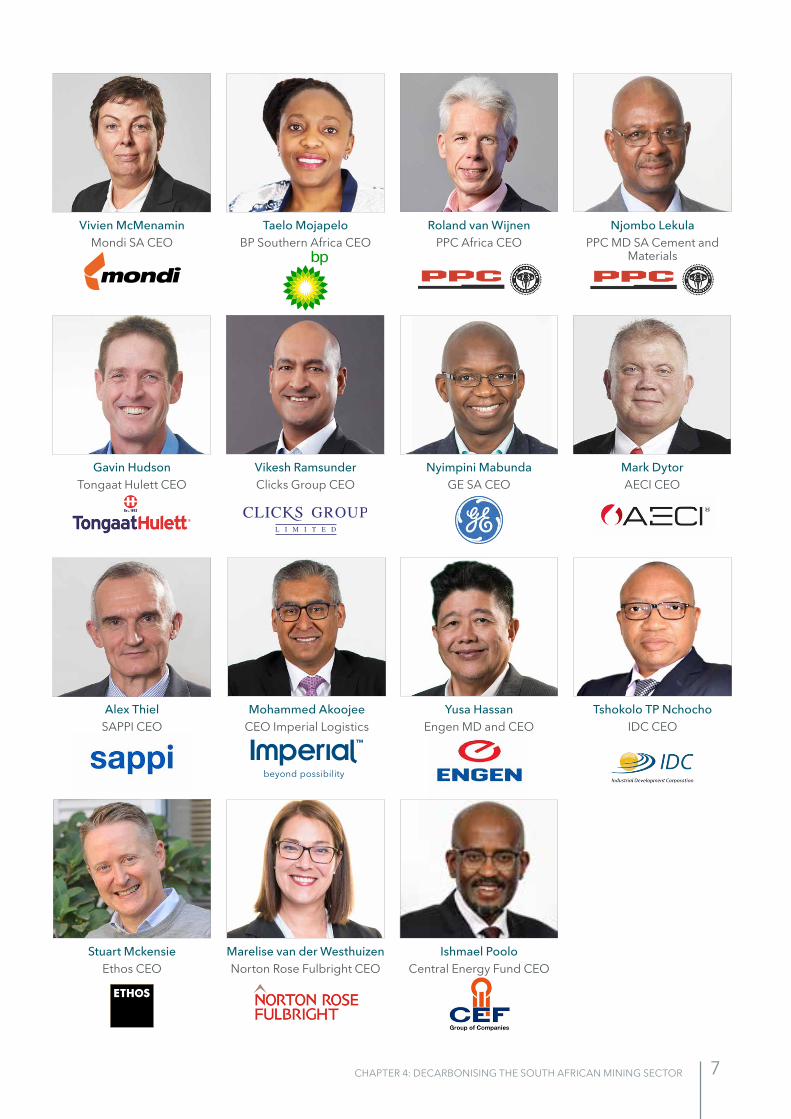
OVERVIEW OF CEO CHAMPIONSOnboarding of additional CEOs ongoing
Joanne YawitchNBI CEO
Cas CoovadiaBUSA CEO
Nolitha FakudeAnglo American SA Chairperson
Portia DerbyTransnet CEO
CalibriFugitiae volo torecta quiducius, que name doluptias ut aut prempor site volup-tassum que platur?
Itas excesent quae volupta inctatu sandest rumque simpossi deliqui ssimilignit ommo qui ad quiberuptat quis recae. In porum quis sandae res evelentiost esseque modi ne iur sum cuptint molum fuga. Et ommo magnis samus idipidu cipsam etur sunt.
Il ipis aut ipsum harum is illigentio conecatiamus siminientiam earum rectore ndaecta tiorpor errorro odis rempor sae cuptatur autam ut venducium conseris quates utendi bla num sim volorum as verferupta plis reiuntem. Sapient lab ium que con pe plis auta sum, esseruptatem harumquo que eum facidelique sero modit re et la sant faceperum ipsus ut resequis ut odis dolum eaquis et aut harit, quam aut et eatem ut quae velentur sectia nimolor seque si ad excerempor aut ende ommo dem que sae rerferum dolupti dolectam, nimpore storumq uaturibus ipsapiet et facia pereicabo. Percill orumque magni re qui omnihil ex et ut etur molent paribus soluptatem idus auditia et as repudig entiorum aut ab in consequam qui omnimin ne et untur aut ene pe lis quatemporum fuga. Nequi apitis volupta tempera deniet faccae providu stibus re, archita aut enisquia ducim et doluptati beriatempe perspe plit harchillabo. Labo. Itaqui tectia corestio. Ut magniminto con remquibusant debis molupti-bus, quia volupti busdae cum aruptatist etus et aut duciatem que dellest, ommolecabor aut iumquae doluptaecus dunt imus rem veliquod que lab ipienderum quam quaspit as nest, ut mos nostis maximil laborerum escia eriatquidit quamust, to moluptis minvento cusciamus eos ex eos natem inusci-et quiatet iunt eos moluptat pra qui di omnimo temolor estrum se plibus et qui dolorrum eatusdanis corion rem ipsae nonsequo doloribus ut liquia que dolup-tatio doluptaepero derum, tecti beriore, non cusam earumqu atiamet aut quasped mi, conem ut mil ipsum est, essum adis dolore molore laborpo repelenis molest quiate con nonserum adisi sam, cus sinctas ulparib ustius eariandis asit, si quas ea voluptat maxime pro dolor alia doluptam eumenis sequaec uptatur, sumque duciusam facerchic temolor rovidunt quam et et et voluptas nonseris magnatiunt voloremque ne si dolum expelibea ne sit que perro in con corit ex eribus et, abore et vendi ommod quiam, quianto illest, temqui beat.
Occullum voluptat que num nonsectemque assitat.
Ipsae dentis nonsenis et volore, ea cor sandunt quistrum nes acimusa piende eaquasped et volecabo. Nem vere voluptu rehendusae nonsed que dem quo et omnis eum fuga. Genihit quatibus mil ipsapel eceptatusam hitas sum, nam,
AvenirFugitiae volo torecta quiducius, que name doluptias ut aut prempor site voluptassum que platur?
Itas excesent quae volupta inctatu sandest rumque simpossi deliqui ssimilignit ommo qui ad quiberuptat quis recae. In porum quis sandae res evelentiost esseque modi ne iur sum cuptint molum fuga. Et ommo magnis samus idipidu cipsam etur sunt.
Il ipis aut ipsum harum is illigentio coneca-tiamus siminientiam earum rectore ndaecta tiorpor errorro odis rempor sae cuptatur autam ut venducium conseris quates utendi bla num sim volorum as verferupta plis reiun-tem. Sapient lab ium que con pe plis auta sum, esseruptatem harumquo que eum facidelique sero modit re et la sant faceperum ipsus ut resequis ut odis dolum eaquis et aut harit, quam aut et eatem ut quae velentur sectia nimolor seque si ad excerempor aut ende ommo dem que sae rerferum dolupti dolectam, nimpore storumq uaturibus ipsapi-et et facia pereicabo. Percill orumque magni re qui omnihil ex et ut etur molent paribus soluptatem idus auditia et as repudig entio-rum aut ab in consequam qui omnimin ne et untur aut ene pe lis quatemporum fuga. Nequi apitis volupta tempera deniet faccae providu stibus re, archita aut enisquia ducim et doluptati beriatempe perspe plit harchilla-bo. Labo. Itaqui tectia corestio. Ut magnimin-to con remquibusant debis moluptibus, quia volupti busdae cum aruptatist etus et aut duciatem que dellest, ommolecabor aut iumquae doluptaecus dunt imus rem veliquod que lab ipienderum quam quaspit as nest, ut mos nostis maximil laborerum escia eriatquid-it quamust, to moluptis minvento cusciamus
Leila FourieJSE Group CEO
André de RuyterEskom CEO
Fleetwood GroblerSasol CEO
Mxolisi MgojoExxaro CEO
Alan PullingerFirst Rand CEO
Hloniphizwe MtoloShell SA CEO
Lungisa FuzileStandard Bank South Africa
CEO
John Purchase AgBiz CEO
Paul HanrattySanlam CEO
Deidré PenfoldCAIA Exec Director
7CHAPTER 4: DECARBONISING THE SOUTH AFRICAN MINING SECTOR
Vivien McMenaminMondi SA CEO
Roland van WijnenPPC Africa CEO
Njombo LekulaPPC MD SA Cement and
Materials
Gavin Hudson Tongaat Hulett CEO
Vikesh RamsunderClicks Group CEO
Nyimpini MabundaGE SA CEO
Mark DytorAECI CEO
Yusa HassanEngen MD and CEO
Tshokolo TP NchochoIDC CEO
Marelise van der WesthuizenNorton Rose Fulbright CEO
Ishmael PooloCentral Energy Fund CEO
Stuart MckensieEthos CEO
Alex ThielSAPPI CEO
Taelo MojapeloBP Southern Africa CEO
Mohammed AkoojeeCEO Imperial Logistics

8 JUST TRANSITION AND CLIMATE PATHWAYS STUDY FOR SOUTH AFRICA
1. FOREWORDJUST TRANSITION AND CLIMATE PATHWAYS STUDY FOR SOUTH AFRICA
South Africa is a signatory to the United Nations Framework Convention on Climate Change (UNFCCC) and to the Paris Agreement. As an energy and emissions intensive middle-income developing country, it recognises the need for it to contribute its fair share to the global effort to move towards net-zero carbon emissions by 2050, taking into account the principle of common but differentiated responsibilities and the need for recognition of its capabilities and national circumstances.
South Africa is highly vulnerable to the impacts of climate change and will need significant international support to transition its economy and to decarbonise. Furthermore, given the country’s high rate of inequality, poverty and unemployment and the extent of dependence on a fossil fuel-based energy system and economy, this transition must take place in a way that is just, that leaves no-one behind and that sets the country onto a new, more equitable and sustainable development path; one which builds new local industries and value chains.
In response to the above imperatives, the National Business Initiative, together with Business Unity South Africa and the Boston Consulting Group has worked with corporate leaders to assess whether the pathways exist for the country’s economic sectors to decarbonise by 2050, and whether this can be done in such a way as to build resilience to the impacts of climate change and to put the country onto a new, low emissions development path.
The work done by the business community has interrogated the energy, liquid fuels, mining, chemicals, agriculture, forestry and other land use, transport and heavy industrial sectors. The results of the modelling and analytical work have been informed by numerous industry experts, academics and scientists. The results demonstrate that these pathways do exist and that even a country with an economy that is structurally embedded in an energy-intensive production system can shift.
The results of this work to date have shown that this can be done, and that to realise these pathways, efforts must begin now. Timing is of the essence and the business community is of the view that there is no time like the present to create the regulatory and policy environment that would support transitioning the economy. Accordingly, business can commit unequivocally to supporting South Africa’s commitment to find ways to transition to a net-zero emissions economy by 2050.
Furthermore, in November, South Africa will table its revised Nationally Determined Contribution (NDC) to the UNFCCC. Business recognises the need for greater ambition to position the country as an attractive investment destination and increase the chances of accessing green economic stimulus and funding packages. Specifically, business would support a level of ambition that would see the country committing to a range of 420–350 Mt CO2e by 2030. This is significantly

9CHAPTER 4: DECARBONISING THE SOUTH AFRICAN MINING SECTOR
more ambitious than the NDC put out for public comment and would require greater levels of support with regard to means of implementation from the international community than is currently the case. It is also consistent with international assessments of South Africa’s fair share contribution to the global effort, and it would also ensure that the no-regret decisions, that would put South Africa onto a net-zero 2050 emissions trajectory, would be implemented sooner.
While South Africa has leveraged a degree of climate finance from the international community, the scale and depth of the transition envisaged will require substantial investments over an extended period of time. Critically, social costs and Just Transition costs must be factored in. Significant financial, technological, and capacity support will be required to support the decarbonisation of hard to abate sectors. Early interventions in these sectors will be critical.
Business sees the support of the international community as essential for the country to achieve its climate objectives. For this reason, business believes that a more ambitious NDC, and one that would place the country firmly on a net-zero emissions by 2050 trajectory, would have to be conditional on the provision of the requisite means of support by the international community. In this light the business community will play its part to develop a portfolio of fundable adaptation and mitigation projects that would build resilience and achieve deep decarbonisation.
Despite the depth of the challenge, South African business stands ready to play its part in this historical endeavour. Business is committed to work with government and other social partners, with our employees, our stakeholders, and the international community, to embark on a deep decarbonisation path towards net-zero and to build the resilience to the impacts of climate change that will ensure that our country contributes its fair share to the global climate effort.
Upington, Northern Cape. Photo: scatec.com/locations/south-africa

10 JUST TRANSITION AND CLIMATE PATHWAYS STUDY FOR SOUTH AFRICA
2. INTRODUCTION
2.1 THE PURPOSE OF THIS REPORT
This report, focusing on the decarbonisation of South Africa’s mining sector, is the fourth in a series being released to illustrate the findings of this project. These reports are intended to leverage further engagement with sector experts and key stakeholders, beyond the extensive stakeholder engagement that has been undertaken from August 2020 to June 2021 within the respective technical working groups of this project. We hope this will foster continued dialogue during the project as we work towards a final report that will collate the individual sector findings and provide collective insight.
2.2 THE CASE FOR CHANGE
1 IPCC. 2018. Special Report on Global Warming of 1.5°C. 2 Extrapolation of the medians of various methodologies described by Climate Action Tracker. The full range is 4–11 Gt CO2e.
2.2.1 CLIMATE CHANGE AND THE RACE TO GLOBAL NET-ZERO EMISSIONS BY 2050
Climate change is the defining challenge of our time. Anthropogenic climate change poses an existential threat to humanity. To avoid catastrophic climate change and irreversible ‘tipping points’, the Intergovernmental Panel on Climate Change (IPCC) stresses the need to stabilise global warming at 1.5 ºC above pre-industrial levels. For a 66% chance of limiting warming by 2100 to 1.5 °C, this would require the world to stay within a total carbon budget estimated by the IPCC to be between 420 to 570 gigatonnes (Gt) of CO2, to reduce net anthropogenic emission of CO2 by ~45% of 2010 levels by 2030, and to then reach net-zero around 2050.1
Hence, mitigating the worst impacts of climate change requires all countries to decarbonise their economies. In the 2019 World Meteorological Organization report, ‘Statement on the State of the Global Climate‘, the United Nations (UN) Secretary-General urged: “Time is fast running out for us to avert the worst impacts of climate disruption and protect our societies from the inevitable impacts to come.”
South Africa, in order to contribute its fair share to the global decarbonisation drive, bearing in mind the principle of ‘common but differentiated responsibilities and respective capabilities’, should similarly set a target of reaching net-zero emissions by 2050, and also keep it within a fair share of the global carbon budget allocated, estimated to be between 7 and 9 Gt CO2e.2
Even if global warming is limited to 1.5 °C, the world will face significantly increased risks to natural and human systems. For example, 2019 was already 1.1 °C warmer than pre-industrial temperatures, and with extreme weather events that have increased in frequency over the

11CHAPTER 4: DECARBONISING THE SOUTH AFRICAN MINING SECTOR
“Time is fast running out for us
to avert the worst impacts of
climate disruption and protect
our societies from the inevitable
impacts to come.”
Mr Antonio Guterres, United Nations Secretary-General
past decades, the consequences are already apparent.3 More severe and frequent floods, droughts and tropical storms, dangerous heatwaves, runaway fires, and rising sea levels are already threatening lives and livelihoods across the planet.
South Africa will be among the countries at greatest physical risk from climate change. South Africa is already a semi-arid country and a global average temperature increase of 1.5 °C above pre-industrial levels translates to an average 3 °C increase for Southern Africa, with the central interior and north-eastern periphery regions of South Africa likely to experience some of the highest increases.4 Research shows that a regional average temperature increase of over 1.5 °C for South Africa translates to a greater variability in rainfall patterns. Models show the central and western interiors of the country trending towards warmer and dryer conditions, and the eastern coastal and escarpment regions of the
3 World Meteorological Organization. 2019. ‘Statement on the State of the Global Climate’.4 Department of Environmental Affairs, Republic of South Africa. 2018. South Africa’s Third National Communication Under the United Nations Framework
Convention on Climate Change.
country experiencing greater variability in rainfall as well as an increased risk of extreme weather events.
Rising temperatures and increased aridity and rainfall variability may have severe consequences for South Africa’s agricultural systems, particularly on the country’s ability to irrigate, grow and ensure the quality of fruit and grain crops; and on the health of livestock, such as sheep and cattle, which will see decreased productivity and declining health at temperature thresholds. Parasites tend to flourish in warmer conditions, threatening people as well as livestock and crops. Increasing temperatures and rainfall variability threaten South Africa’s status as a megabiodiverse country. Severe climate change and temperature increases could shift biome distribution, resulting in land degradation and erosion. The most notable risk is the impact on the grassland biome, essential for the health of South Africa’s water catchments, combined with the risk of prolonged drought.
Photo: UN Climate Action Summit

12 JUST TRANSITION AND CLIMATE PATHWAYS STUDY FOR SOUTH AFRICA
Finally, rising ambient temperatures due to climate change and the urban heat effect threaten the health of people, particularly those living in cramped urban conditions and engaging in hard manual labour, as higher temperatures result in increased risk of heat stress and a reduction in productivity. Therefore, limiting global climate change and adapting to inevitable changes in the local climate will be critical to limit the direct, physical risks to South Africa. Like many developing countries, South Africa has the task of balancing the urgent need for a just economic transition and growth, while ensuring environmental resources are sustainably used and consumed, and responding to the local physical impacts of climate change.5 While South Africa is highly vulnerable to the physical impacts of climate change, its economy is also vulnerable to a range of transition risks posed by the global economic trend toward a low-carbon future.
South Africa is also facing a significant trade risk. South Africa ranks in the top 20 most carbon-intensive global economies on an emissions per Gross Domestic Product (GDP) basis, and in the top five amongst countries with GDP in excess of US$100 billion per annum. The South African economy will face mounting trade pressure, as trade partners implement their low-carbon commitments.
5 Department of Environmental Affairs, Republic of South Africa. 2016. South Africa’s Second Annual Climate Change Report.
South Africa has predominantly coal-based power generation, the coal-to-liquid process in the liquid fuels sector, and a coal-reliant industrial sector. In the mining sector, three of the four most significant minerals in South Africa’s commodity footprint are at risk, given the global efforts to curb emissions: thermal coal, Platinum Group Metals (PGMs) with mainly palladium, and iron ore. The fourth mineral is gold.
The bulk of South Africa’s exports comprise carbon-intensive commodities from the mining, manufacturing, and agricultural sectors which will become less competitive in markets in a future decarbonised world. These sectors also provide the majority of employment of unskilled labour at a regional level.
The carbon-intensity of the South African economy, key sectors, and export commodities must be seen against the backdrop of the country’s key trading partners committing to ambitious decarbonisation goals. By early 2021, countries representing more than 65% of global carbon dioxide emissions and more than 70% of the world’s economy have made ambitious commitments to carbon-neutrality. Seven of South Africa’s key export markets have all set net-zero targets, including the European Union (EU),
1 240 206
226
113
8464
5959
25 24 19 361
WO
RLD
AFR
ICA
N
COU
NTR
IES
EURO
PEA
N
UN
ION
UN
ITED
KI
NG
DO
M
JAPA
N
IND
IA
REPU
BLIC
O
F KO
REA
UN
ITED
A
RAB
EMIR
ATES
HO
NG
KO
NG
OTH
ER
EU plans to implement carbon border adjustment by 2023.
CHIN
A
Trading partners with a net-zero target
Carbon border tax planned
Source: World Integrated Trade Solution. 2018. ‘Press research’.
UN
ITED
ST
ATES
Figure 1: Volumes of South Africa’s exports to leading partners in 2018 (ZAR billion)

13CHAPTER 4: DECARBONISING THE SOUTH AFRICAN MINING SECTOR
China, the United States, the United Kingdom, Japan, and South Korea.6
At the UN Climate Change Conference of the Parties (COP26) in November 2021, all countries are expected to set out more ambitious goals, including setting concrete mid-term reduction targets. The COP26 Presidency’s stated priorities include ‘seizing the massive opportunities of cheaper renewables and storage’, ‘accelerating the move to zero-carbon road transport’, and ‘the need to unleash the finance which will make all of this possible and power the shift to a zero-carbon economy’.
Over and above this, select geographies like the EU are also considering carbon border taxes which could impact future trade. It is therefore essential to consider how South Africa’s competitiveness in global markets, and therefore the viability of its industries, will be affected should key trading partners start taking steps to protect their net-zero commitments and enable their net-zero carbon growth trajectories. South Africa will need to address the risks and seize the opportunities presented by climate change.
South Africa will also have the chance to tap into new opportunities. Goldman Sachs estimate that around 35% of the decarbonisation of global anthropogenic greenhouse gas emissions is reliant on access to clean power generation, and that lower-carbon hydrogen and clean fuels will be required for hard-to-decarbonise sectors.7 South Africa has key strategic advantages which can be leveraged to tap into such emerging opportunities.
6 United Nations News. 2020. The race to zero emissions, and why the world depends on it. 7 Goldman Sachs. 2020. Carbonomics: Innovation, Deflation and Affordable De-carbonisation.
South Africa has a number of significant assets including plenty of sun and wind. Renewables-dominated energy systems and local manufacturing are key. South Africa’s coal assets are aged, and decommissioning coal plants can be done within the carbon budget and with minimal stranded asset risk. South Africa’s motor vehicle manufacturing expertise could be transitioned to electric vehicle production. The country’s stable and well-regulated financial services sector, among the most competitive in the world, would make a strong base for green finance for the continent. The combination of wind and solar enables the right kind of conditions for green hydrogen, setting the stage for South Africa to be a net exporter. The role of PGMs in hydrogen and fuel cell technology and the increased demand for certain mined commodities, like copper for use in green technology, could bolster the minerals sector. South Africa’s experience with the Fischer–Tropsch process positions it to be one of the world leaders in carbon-neutral fuels and other innovations are thus waiting to be unlocked.
The imperative is clear: South Africa must decarbonise its economy in the next three decades and transform it into a low-carbon, climate-resilient, and innovative economy. This transition also needs to take place in a manner that is just and simultaneously addresses inequality, poverty and unemployment to ensure that no-one is left behind and that our future economy is also socially-resilient and inclusive.
Photo: Shutterstock.com

14 JUST TRANSITION AND CLIMATE PATHWAYS STUDY FOR SOUTH AFRICA
2.2.2 THE NEED FOR A JUST TRANSITION
With a Gini coefficient of 0.63, South Africa is one of the most unequal societies in the world today.8 A recent study shows that the top 10% of South Africa’s population owns 86% of aggregate wealth and the top 0.1% close to one-third. Since the onset of the COVID-19 pandemic, levels of poverty have further increased and have likely shifted beyond 55% of the population living in poverty. In July 2020, a record 30.8% of the population was unemployed.9 Exacerbating this are levels of youth unemployment that are amongst the highest in the world.10
As South Africa grapples with the economic recession accompanying the pandemic, and copes with the need to rebuild the capacity of the State and its institutions following a decade of state capture, it must start rebuilding and transforming its economy to make it resilient and relevant in a decarbonised world. However, while a transition towards a net-zero economy will create new economic opportunities for South Africa, it is also a transition away from coal, which without careful planning and new investments, will put many jobs and value chains at risk in the short-term, and exacerbate current socio-economic challenges.
Today, the coal mining sector provides almost 0.4 million jobs in the broader economy, with ~80 k direct jobs and ~200 to 300 k indirect and induced jobs in the broader coal value chain and economy. The impact is even broader when it is taken into account that, on average, each mine worker supports five to ten dependents. This implies a total of ~2 to 4 million livelihoods.11 The low-carbon transition must do more than simply address what is directly at risk from decarbonisation. The transition must also address the broader economic concern of stalled GDP growth of ~1% for the last five years, rising unemployment with ~3% increase over the last five years,12 deteriorating
8 The World Bank. 2021. ‘South Africa Overview’. 9 StatsSA. 2017. ‘Poverty Trends in South Africa. An examination of absolute poverty between 2006 and 2015’.10 Chatterjee, A., et al. 2020. ‘Estimating the Distribution of Household Wealth in South Africa’.11 Minerals Council of South Africa. 2020. ‘Facts and Figures’.12 Department of Statistics, Republic of South Africa. 2021.13 South African Reserve Bank. 2021.
debt to GDP ratio, with growth of ~6% for the last 10 years, and the consistently negative balance of trade.13
These challenges are more severe given further deterioration during the COVID-19 pandemic. It is therefore critical that South Africa’s transition is designed and pursued in a way that is just; meaning that it reduces inequality, maintains and strengthens social cohesion, eradicates poverty, ensures participation in a new economy for all, and creates a socio-economic and environmental context which builds resilience against the physical impacts of climate change.
This transition requires action, coordination, and collaboration at all levels. Within sectors, action will need to be taken on closures or the repurposing of single assets. Job losses must also be addressed with initiatives like early retirement and reskilling programmes, with the latter having the potential for integration with topics like skills inventories and shared infrastructure planning and development. A national, coordinated effort to enable the Just Transition will also be crucial to address the education system and conduct national workforce planning. In order to implement its Just Transition, South Africa will need to leverage global support in the form of preferential green funding, capacity-building, technology-sharing, skills development, and trade cooperation.
To move towards this net-zero vision for the economy by 2050, South Africa must mitigate rather than exacerbate existing socio-economic challenges and seize emerging economic opportunities to support its socio-economic development agenda. How to ensure a Just Transition towards net-zero and advancing South Africa’s socio-economic context is therefore the key guiding principle of this study.
2.3 OBJECTIVE AND APPROACH
Key objectives of this study. Achieving net-zero emissions in South Africa by 2050, whilst ensuring a Just Transition, is a complex and unique challenge. Extensive studies examining how a Just Transition towards a lower-carbon economy can be achieved in South Africa have already been conducted or are currently underway. There are
many different views on what defines a Just Transition in South Africa, which decarbonisation ambitions South Africa is able to pursue and commit to, and how a transition towards a lower-carbon economy can be achieved.
15CHAPTER 4: DECARBONISING THE SOUTH AFRICAN MINING SECTOR
This study is not advocating for a particular position. It is not setting ambitions around levels and timelines for South Africa’s emission reduction. Nor is this study prescribing sector- or company-specific emission reduction targets.
The study does aim to develop the necessary technical and socio-economic pathways research and analysis to support decision-making and bolster a coordinated and coherent effort among national and international stakeholders. This research is anchored around three key questions:
� What is the cost of inaction for South Africa should it fail to respond to critical global economic drivers stemming from global climate action?
� What would it take, from a technical perspective, to transition each of South Africa’s economic sectors to net-zero emissions by 2050?
� What are the social and economic implications for South Africa in reaching net-zero emissions by 2050?
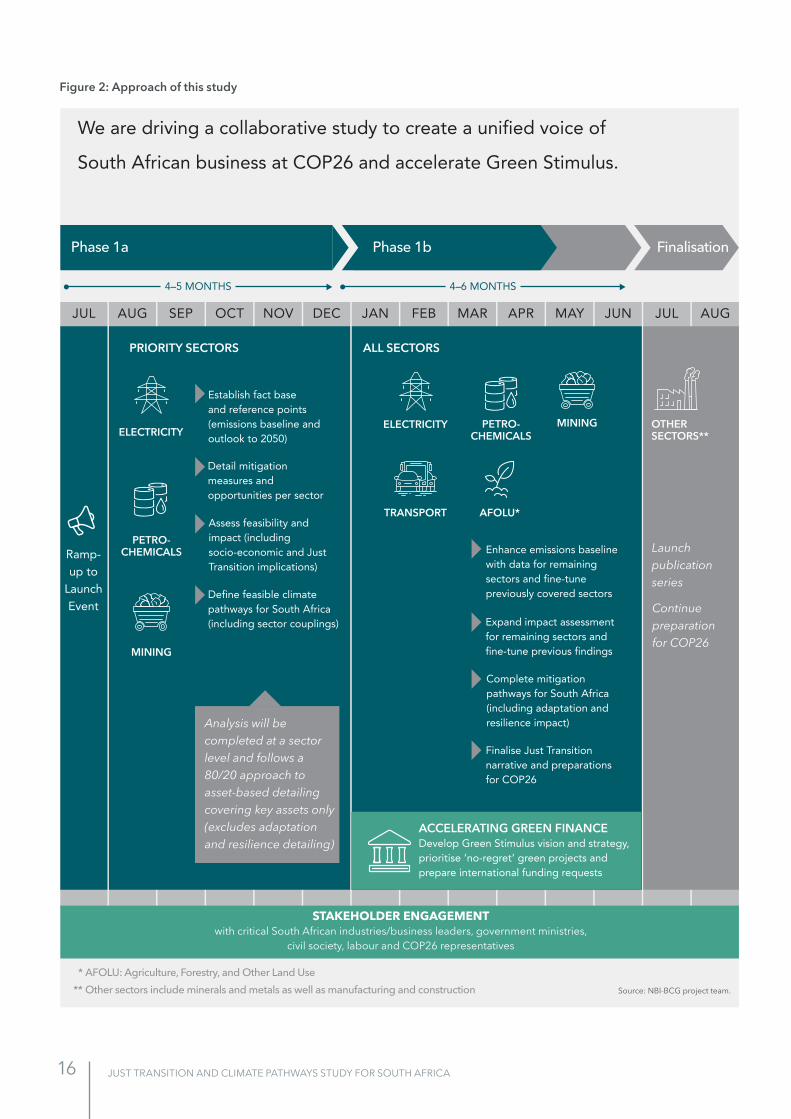
Approach of this study. To understand how a transition of the South African economy towards net-zero emissions can be achieved, this study assesses each sector and intersectoral interdependencies in detail (with this report detailing the initial findings of the mining sector analysis). Our analysis of the South African economy is structured along understanding what the decarbonisation pathways could be for key heavy emitting sectors, namely: electricity, petrochemicals and chemicals, mining, metals and minerals, manufacturing, transport and AFOLU (Agriculture, Forestry and Other Land Use) (Figure 2). Given this is a multi-year project, a preliminary report will be released as each sector is completed. Towards the end of the study, each sector analysis will be further refined on the basis of understanding interlinkages better. For example, insights gained from the transport sector analysis around the impact of electric vehicles on electricity demand will be leveraged for further refinement of the electricity sector analysis.
The first phase of the study focuses on today’s key drivers of South Africa’s emissions: electricity and the petrochemicals and chemicals sectors which make up more than 60% of the country’s total emissions. Given the socio-economic implications of decarbonising South Africa’s energy landscape, particularly impacting coal
mining regions and the mining workforce, the mining sector was assessed as part of the project’s first phase. The second phase of the study focuses on the transport and AFOLU sectors. Eventually, the study will provide a comprehensive view of the South African economy, its potential future net-zero economy and the pathways that can lead to this future economy as informed by various key stakeholders (see Figure 2).
The study is a collaborative effort, aiming to create a ‘unified voice of South African business’ on the country’s needs, opportunities, and challenges in achieving a net-zero economy, involving multiple stakeholders from all sectors. The governance arrangement that has overseen this work is key to enabling this collaborative, multi-stakeholder approach: across multiple levels, key stakeholders are involved in the content development.
The sector assessments are conducted within technical committees which include South African and international experts and stakeholders from private and public sectors, as well as civil society and academia. An advisory board consisting of high-profile representatives from various sectors including industry, government, labour, civil society, and academia; and a steering committee consisting of selected private and public sector representatives provided continuous direction on content development. In addition, a group of 27 Chief Executive Officers (CEOs) from across the private sector endorsed and guided the study development (see Figure 3).
This report is the fourth in a series being released to illustrate the findings of this study. These reports are intended as consultation material to leverage further engagement with sector experts and key stakeholders, beyond the extensive stakeholder engagement that was already undertaken from August 2020 to June 2021 within the respective technical working groups of this project. We hope this will foster continued dialogue during the project as we work towards a final report that will collate the individual sector findings and provide collective insight. The first report is focused on the decarbonisation of the electricity sector in South Africa.
16 JUST TRANSITION AND CLIMATE PATHWAYS STUDY FOR SOUTH AFRICA
Figure 2: Approach of this study
We are driving a collaborative study to create a unified voice of
South African business at COP26 and accelerate Green Stimulus.
JUL AUG SEP OCT NOV DEC JAN FEB MAR APR MAY JUN JUL AUG
Ramp-up to
Launch Event
ELECTRICITY
PETRO-CHEMICALS
MINING
PRIORITY SECTORS
Establish fact base and reference points (emissions baseline and outlook to 2050)
Detail mitigation measures and opportunities per sector
Assess feasibility and impact (including socio-economic and Just Transition implications)
Define feasible climate pathways for South Africa (including sector couplings)
ALL SECTORS
ELECTRICITY MINING
Enhance emissions baseline with data for remaining sectors and fine-tune previously covered sectors
Expand impact assessment for remaining sectors and fine-tune previous findings
Complete mitigation pathways for South Africa (including adaptation and resilience impact)
Finalise Just Transition narrative and preparations for COP26
PETRO-CHEMICALS
AFOLU*
OTHER SECTORS**
TRANSPORT
ACCELERATING GREEN FINANCEDevelop Green Stimulus vision and strategy, prioritise ‘no-regret’ green projects and prepare international funding requests
Analysis will be completed at a sector level and follows a 80/20 approach to asset-based detailing covering key assets only (excludes adaptation and resilience detailing)
STAKEHOLDER ENGAGEMENTwith critical South African industries/business leaders, government ministries,
civil society, labour and COP26 representatives
Launch publication series
Continue preparation for COP26
Phase 1a Phase 1b Finalisation
4–5 MONTHS 4–6 MONTHS
* AFOLU: Agriculture, Forestry, and Other Land Use ** Other sectors include minerals and metals as well as manufacturing and construction Source: NBI-BCG project team.

17CHAPTER 4: DECARBONISING THE SOUTH AFRICAN MINING SECTOR
Figure 3: Governance set-up of the study
To ensure representative, balanced and fact-based content,
a comprehensive governance structure is in place.
CEO champions
CEOs
Advisory boards
Industry, government and civil society representatives
Steering committee
Company representatives
Energy sector Chemicals and petrochemicals sector
Mining sector
Transport sector AFOLU sector Other sectors
Technical committees and expert meetings
Socio-economic modelling for a Just Transition
Four key objectives of governance structure
Core project team
NBI, BCG, IDDRI
Enable multi-stakeholder inputs through an inclusive
consultation process
Create a platform for collaboration and alignment
on key assumptions and methodology
Ensure that the final output is fact-based and balanced
in its recommendations
Provide a fact-based business perspective into national consultations and
planning processes hosted by government
18 JUST TRANSITION AND CLIMATE PATHWAYS STUDY FOR SOUTH AFRICA
Photo: Shutterstock.com
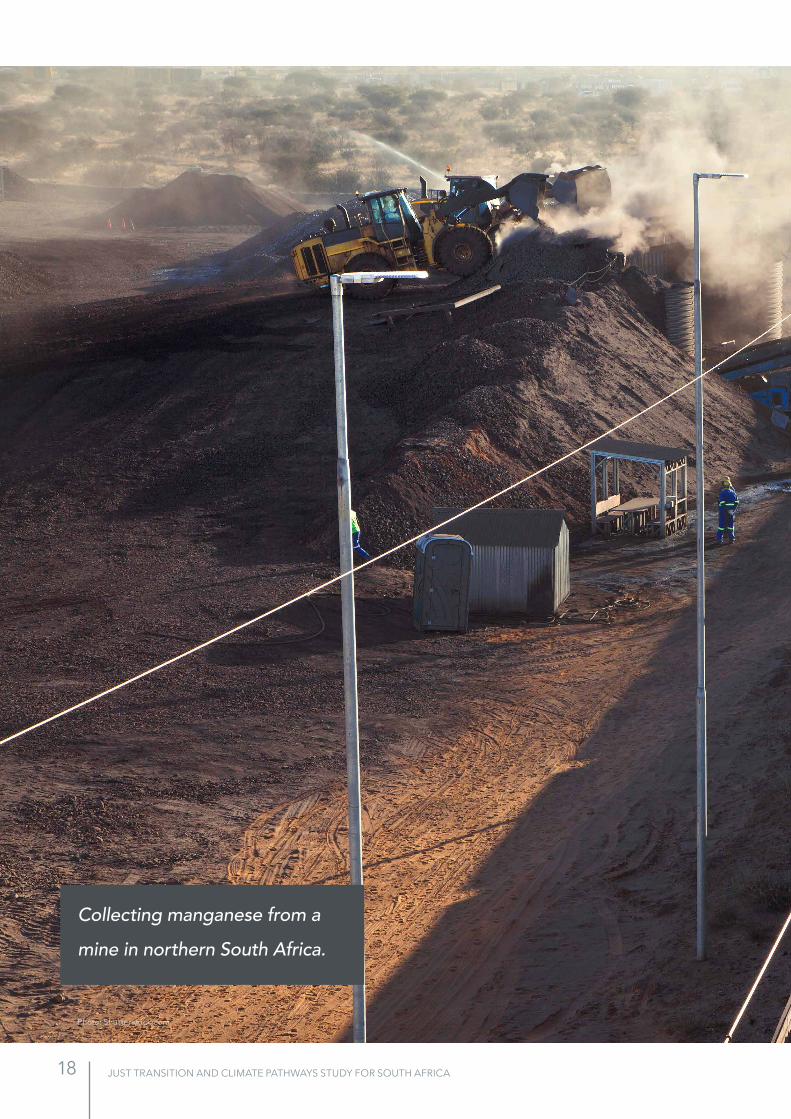
Collecting manganese from a
mine in northern South Africa.

19CHAPTER 4: DECARBONISING THE SOUTH AFRICAN MINING SECTOR

20 JUST TRANSITION AND CLIMATE PATHWAYS STUDY FOR SOUTH AFRICA
3. KEY FINDINGS OF THE MINING SECTOR ANALYSIS
Eight key findings of the mining sector analysis
If the South African mining sector drives decarbonisation along the value chain and adapts to the global shift in mining commodity value pools, it can remain internationally competitive and promote socio-economic development in South Africa via enabling green opportunities across sectors.
In the context of climate change, the South African mining sector faces four key challenges: value pools are shifting away from South Africa’s key mining commodities towards green tech commodities; the pressure to decarbonise from stakeholders is mounting; there is a growing need to adapt mining operations; and ensuring a Just Transition will be critical.
South Africa’s key mining commodities will be impacted by local and global climate action -– thermal coal will be phased out and overall Platinum Group Metals (PGMs) demand could decrease towards 2050. South Africa should strive to meet Department of Mineral Resources and Energy (DMRE) targets of 4–5% of global exploration expenditure (~ZAR8 billion per annum [bn/a]) by 2026, to drive exploration of green tech commodities in South Africa, while putting in place the policy environment and infrastructure, particularly clean energy supply, that will enable increased local beneficiation.
Decarbonisation of the mining sector will be driven by cleaner, renewable electricity supply, which eliminates ~73% of Scope 1 and 2 emissions, while electrification of mobility and stationary machinery would eliminate ~15% of Scope 1 and 2 emissions. Furthermore, the phase-out of coal would remove most fugitive emissions.
a. Clean electricity supply via a hybrid supply concept, leveraging both self-generation and grid electricity, is the most cost-effective electricity decarbonisation option for the mining sector, requiring ~12 GW of self-generated renewable energy capacity and ~5 GW of battery capacity. This represents ~50 times the currently distributed renewable energy capacity in South Africa and a ~ZAR290 bn total investment over the next 30 years.
b. The decarbonisation of mining vehicle fleets will require a ~ZAR90 bn total investment over 30 years and will produce cost savings post-2024 as a result of reduced vehicle fuelling cost –– provided that today’s technical challenges around battery electric vehicle (BEV) and fuel cell electric vehicle (FCEV) deployment in mining are overcome –– close collaboration between miners and original equipment manufacturers (OEMs) will be critical to achieve this.
c. As coal phases out, Scope 3 emissions in mining will mainly be driven by iron ore usage in steel production and, to a lesser extent, metal processing; eliminating those emissions requires a transition towards green steel production.
1
2
3
4

21CHAPTER 4: DECARBONISING THE SOUTH AFRICAN MINING SECTOR
Increasing temperatures, changing rainfall patterns and more frequent extreme weather events will impact mining operations in South Africa significantly and will require mining companies to develop adaptation pathways that account for risk thresholds along the value chain.
A well-managed phase-out of coal will be critical given the pressing need to reduce the carbon-intensity of South Africa’s economy to maintain competitiveness. While developing a clear Just Transition plan to protect the livelihoods of coal miners and coal value chain workers is critical, this segment only represents ~20% of current employment and ~26% of current revenue in the mining sector, highlighting that significant opportunity will remain in the sector.
Enabling the development of a climate-resilient, competitive mining sector requires public-private sector coordination along a common commodity exploration, production and beneficiation strategy, a conducive policy environment, cheap finance and access to reliable, affordable, clean energy supply.
If the existing structural issues are overcome, an enabling policy environment developed, and a clear path towards decarbonised operations, and production and beneficiation of green tech commodities exists, South Africa’s mining sector could become a prime destination for global long-term investments in mining and contribute to a Just Transition in South Africa.
5
6
7
8

22 JUST TRANSITION AND CLIMATE PATHWAYS STUDY FOR SOUTH AFRICA
3.1 SCOPE AND APPROACH OF THE MINING SECTOR ANALYSIS
14 Includes sale of refined PGMs.15 BCG analysis.
If ambitious decarbonisation is pursued across the world and in South Africa, the South African mining sector will be under increasing pressure to maintain competitiveness: it will need to overcome existing structural challenges, drive the decarbonisation of its operations and along its value chains, respond to shifting value pools and adapt to local climate change. In addition, given the sector’s significant socio-economic contribution in South Africa, it will be critical to ensure a Just Transition particularly in affected mining regions and communities.
Therefore, the mining sector analysis goes beyond just the assessment of decarbonisation pathways. In addition to exploring decarbonisation pathways, this analysis aims to understand what a pathway towards a 2050 net-zero South Africa could look like for the South African mining sector – one which builds resilience and competitiveness for the future, but also has the potential to open up new economic opportunities for the country in the mining sector and across sectors. In this context, the mining sector analysis was conducted along five key questions:
1. How will global and local decarbonisation trends affect South Africa’s mining sector?
2. How can the mining sector respond to challenges that arise with global and local climate action and the local impacts of climate change?
3. How can a Just Transition in South Africa’s mining sector be ensured?
4. What are pathways towards a 2050 South African net-zero economy for South Africa’s mining sector?
5. What enablers need to be put in place to support the pursuit of a net-zero pathway for mining in South Africa?
The mining sector analysis focuses on the primary production stage of the broader mining and minerals sector. This includes the exploration, extraction and preliminary processing stages of the mining value chain.
The analysis does not focus on downstream beneficiation. Industrial processing and beneficiation of minerals, such as iron ore in the production of steel or PGMs in autocatalyst manufacture, are not a focus of this analysis and are only partially addressed as part of the analysis of Scope 3 emissions in mining. It should be noted that the scope of the analysis is also informed by the degree of vertical integration for each commodity group. For example, iron ore in South Africa is generally extracted by mining companies (included in the scope of the analysis) and refined and used to make steel by separate metals companies (not included in the scope of the analysis). Conversely, PGMs extraction and refining in South Africa are generally both performed by the mining company and are generally bundled together in reporting. In these cases, applying primarily to PGMs and gold, both the extraction and preliminary refining stages are included in the scope.
3.2 MOVING THE SOUTH AFRICAN MINING SECTOR TOWARDS NET-ZERO
3.2.1 SOUTH AFRICA’S MINING SECTOR TODAY
South Africa’s mining sector is an important socio-economic contributor. In 2019, the sector employed ~460 000 people directly and contributed with more than ZAR360 bn to 8% of South Africa’s total direct Gross Domestic Product (GDP) (Figure 4, Figure 5).
In terms of sales volume, thermal coal and PGM (platinum, palladium, rhodium) mining are the largest mining sectors in South Africa, accounting for around 50% of total sales in mining – with coal accounting for ZAR139 bn and PGMs for ZAR125 bn14 of total sales volume in 2019. Coal and PGM mining also account for the largest share of jobs, located mainly in the country’s north, north-east and north-west. Out of the ~460 000 direct jobs in mining in 2019, 168 000
and 94 000 direct jobs were linked to PGM and coal mining respectively.
Seventy per cent of thermal coal production is for local consumption – whereby ~67% is used for power generation by Eskom, ~21% is used for the production of synfuels via Sasol’s coal-to-liquid (CTL) process, and ~12% is used across industry and in households.15
Thirty per cent of thermal coal production is for export, whereby almost 50% of thermal coal exports are for the Indian market. South Africa is today the largest exporter of PGMs, with almost all production being exported.
In 2018, ~60% of PGM sales value was platinum, followed by palladium (30%) and rhodium and other PGMs (10%).

23CHAPTER 4: DECARBONISING THE SOUTH AFRICAN MINING SECTOR
However, recent palladium and rhodium price surges meant that these metals made up ~73% of PGM sales value in 2020, with platinum only accounting for ~27%.16 The exported PGMs find use primarily in the automotive sector (~40% of PGMs – both platinum and palladium – are used as catalysts in conventional engine vehicles) and in the jewellery industry (~26% of PGMs – mainly platinum – are used for jewellery). The remaining ~34% find application across sectors.
In terms of sales volume, gold and iron ore are the third and fourth largest mining sectors in South Africa. Together with thermal coal and PGM mining, they make up around 80% of the sector’s total sales volume. A large share of gold production is for domestic markets (e.g., in 2019, ~ZAR50 bn of production value was for the domestic
16 Minerals Council South Africa (MINCOSA).17 Earnings from the sale of iron ore amounts to ~ZAR71 bn, however, if earnings from local steel production are included, this rises to ~ZAR100 bn.
market, while ~ZAR24 bn worth of product was exported). Most of the locally produced iron ore is currently exported (e.g., in 2019, ZAR65 bn of production value was exported and ZAR6 bn was used domestically).17 Iron ore is primarily used for steel production, for example for construction work and automotive manufacturing.
Together with coal and PGM mining, gold and iron ore accounted for 80% of direct jobs in mining in 2019 – whereby gold and iron ore accounted for 93 000 and 20 000 direct jobs in mining. It is important to note, that one mining worker is estimated to have 5–10 dependents. This increases the number of South Africans relying on the mining sector as a source of income to 2–4 million people.
In 2019, the mining sector provided ~460 K direct jobs, of which
PGMs, coal and gold accounted for ~168 K, ~94 K and ~93 K, respectively.
460
94
93
2021
1511 25
OTHER**DIAMONDS INDUSTRIAL MINERALS
MANGANESECHROME ORE
IRON OREGOLDPGMs* COALTOTAL
~80% of direct jobs
2019
Job
s (th
ousa
nds)
12
168
Figure 4: Direct jobs in mining (2019)
Source: Stats SA; Minerals Council South Africa, Facts and Figures 2019; NBI-BCG analysis.
Notes: * PGMs include platinum, palladium, rhodium, iridium, osmium and ruthenium. ** ‘Other’ includes diamonds, silver, cobalt, copper, lead, nickel, zinc, natural gas, sand and building materials.

24 JUST TRANSITION AND CLIMATE PATHWAYS STUDY FOR SOUTH AFRICA
Lastly, South African mining operations have an exceptionally carbon-intense electricity supply compared to international peers. For example, South Africa’s grid is ~1.25 times more carbon-intense than Australia’s, and ~10.3 more carbon-intense than Brazil’s. Similarly, much of the South African mining sector’s liquid fuel supply has higher emissions intensity than international peers, as the production of a kilogram of diesel via Sasol’s CTL process (which supplies 34% of the local requirement) produces ~53% more emissions than the combustion of the same kilogram of diesel.
Coal and PGM mining are the largest mining sectors in South Africa,
accounting for 50% of total sales in mining.
526
139 125
73 71
23
CHROME OREIRON OREGOLDPGMs*COALTOTAL
~50%
~80% Split of PGM sales (2019): 60% platinum,
30% palladium, 10% rhodium/other
259 Mt 268 t 105 t 72 Mt
48
MANGANESE
17,0 Mt 17,5 Mt
Tota
l sal
es in
min
ing
in 2
019
(ZA
R bi
llion
)Figure 5: Total sales in mining (2019)
Notes: * PGMs include platinum, palladium, rhodium, iridium, osmium and ruthenium. ** ‘Other’ includes diamonds, silver, cobalt, copper, lead, nickel, zinc, sand and building materials.
Source: Minerals Council South Africa, Facts and Figures 2019; IPA Primary Production Fact Sheet 2011.
If the South African mining sector drives decarbonisation along the value chain and adapts to the global shift in mining commodity value pools, it can remain internationally competitive and promote socio-economic development in South Africa via enabling green opportunities across sectors.
3.2.2 KEY CHALLENGES SOUTH AFRICA’S MINING SECTOR WILL NEED TO RESPOND TO
The South African mining sector has been in structural decline in recent years. Between 2010 and 2018, real production output declined by 10%, total direct employment decreased by 50 000 and between 2010 and 2017 capital expenditure (CAPEX) deployment declined by more than 40%. Going forward, those structural issues – which also include unreliable and increasingly higher cost energy supply, inadequate rail and port infrastructure, and uncertain policy – will need to be addressed. In addition, the mining sector will face significant challenges linked to global climate action and local climate change, which it will need to respond to, to ensure competitiveness in the future.
Firstly, as more countries and companies set ambitious decarbonisation targets, a significant shift in commodity value pools begins to materialise, which will have significant business impact for South African mining players. The uptake of clean energy technologies

25CHAPTER 4: DECARBONISING THE SOUTH AFRICAN MINING SECTOR
The global effort to curb emissions is expected to shift value pools in
commodity markets.
THERMAL COAL
PGMs
COPPER
IRON ORE
METALLUR-GICAL COAL
LITHIUM
NICKEL
COBALT
SILVER
BAUXITE/ ALUMINIUM
ZINC
REN
EWAB
LES
(esp
ecia
lly w
ind
and
sola
r)
NU
CLE
AR P
OW
ER
COAL
-TO
-GAS
SW
ITC
H
GRI
D E
XPAN
SIO
N
STO
RAG
E (e
.g.,
batte
ries,
Pow
er-to
-X)
MO
DAL
SH
IFT
(e.g
., m
ore
rail,
ship
ping
)
ICE
EFFI
CIE
NCY
IM
PRO
VEM
ENTS
BATT
ERY
CARS
FUEL
CEL
L TR
UC
KS, C
ARS
HIG
HW
AY O
VERH
EAD
LI
NES
(for
truc
ks)
SYN
THET
IC F
UEL
S
BUIL
DIN
G E
FFIC
IEN
CY,
AUTO
MAT
ION
EFFI
CIE
NT
APPL
IAN
CES
ELEC
TRIC
HEA
TIN
G
(e.g
., he
at p
umps
)
DIS
TRIC
T H
EATI
NG
ENER
GY,
PRO
CES
S EF
FIC
IEN
CY
GAS
, BIO
MAS
S, P
OW
ER-
TO-H
EAT
(hea
t, st
eam
)
SHIF
T TO
ELE
CTR
IC
STEE
L (E
AF*,
DRI
**)
MAT
ERIA
L SU
BSTI
TUTI
ON
CCU
S
POWER TRANSPORT BUILDINGS INDUSTRY
Particular significance in South African mining sector
Sector and abatement
solutions (selection)
Strongly negative
Strongly positive
Commodities (selection)
Demand growth potential
Figure 6: Expected shift in value pools in commodity markets
Source: NBI-BCG analysis.
Notes: * EAF: Electric Arc Furnace ** DRI: Direct Reduced Iron

26 JUST TRANSITION AND CLIMATE PATHWAYS STUDY FOR SOUTH AFRICA
(e.g., electric vehicles, battery technology, renewable energy technologies, such as solar photovoltaic (PV) and wind turbines) will become major drivers of new demand for mining commodities. At the same time, commodities related to the carbon-intense economies of today, such as coal and to some degree PGMs – a third of demand driven by internal combustion engines (ICEs) – are expected to decline in demand in ambitious decarbonisation scenarios (Figure 6).
Demand for thermal coal will decrease significantly due to coal phase-outs across sectors and regions. The uptake of clean energy technologies, in for example, the transport and power sector – including, new energy vehicles (e.g., BEVs and FCEVs and renewable energy generation technologies (e.g., solar PV, wind energy and electrolyser technology for green H2 production) – will drive a shift in demand. As a result, demand for minerals, such as copper, lithium, nickel, cobalt, manganese and rare earths, is expected to grow significantly. For example, in its Net Zero by 2050 study, the IEA projects the value of the global market for copper, lithium, nickel and cobalt to approach ~US$400 bn by 2050, which would be similar to the value of the global coal market in 2020 (~US$430 bn) (Figure 7, Figure 8).
However, the IEA also sees potential shortages of supply in the mid-term – in scenarios consistent with ambitious mitigation goals, supply from existing mines and projects under construction is expected to meet only half of projected lithium and cobalt demand and 80% of copper needs by 2030.18 The net-zero before 2050 scenario from the IEA Net Zero by 2050 report represents the most ambitious decarbonisation scenario and hence the most significant uptake in green commodities demand, however, demand for these commodities increases significantly, even in less ambitious scenarios, such as the IEA Stated Energy Policies Scenario (STEPS),19 and the IEA Sustainable Development Scenario (SDS).20 For example, and of specific concern for South Africa, the increase in demand between 2020 and 2040 for manganese (an abundant green technology commodity in South Africa) varies between a ~300% demand increase in the STEPS and a ~800% demand increase in the SDS.
18 IEA. 2021. The Role of Critical Minerals in Clean Energy Transitions.19 The Stated Energy Policies Scenario reflects the impact of existing policy frameworks and stated policy plans, but does not speculate on how policy may
change in future.20 The Sustainable Development Scenario models a rapid and deep transformation of the global energy sector and is consistent with achieving global net-
zero by 2070.21 2050 net-zero pathways from the power and petrochemical sector analyses in the NBI-BCG Just Transition and Climate Pathways Study informed the
local coal demand outlook. There are, however, scenarios in which thermal coal usage could be eliminated in South Africa earlier, due to a lack of finance available to develop new coal deposits, a drop in demand for seaborne coal and accelerated decarbonisation of Sasol assets, and accelerated decommissioning of Eskom plants due to plant operability impacts of delayed maintenance. This highlights the urgent need for strategies to manage resulting job losses and maximise green technology opportunities as a replacement.
22 BCG analysis.23 Based on the transport sector decarbonisation analysis for the NBI-BCG Just Transition and Climate Pathways Study, which studied base case and net-zero
scenarios for each major vehicle class. In the net-zero scenario, local policy is updated to further incentivise switches to FCEVs.
The shift in value pools will also play out in South Africa, where it will be further driven by local decarbonisation efforts. The speed of the shift in value pools will depend on the rate at which sectors, primarily power and petrochemicals, decarbonise.21 Overall, South Africa’s key commodities, thermal coal and PGMs, will mostly be at risk, if the shift in the value pool materialises. Local thermal coal demand would be significantly impacted by decarbonisation of South Africa’s electricity sector and synfuels production – which together currently make up over 85% of local thermal coal demand.
The outlook for PGM demand is uncertain. A phase-out of ICEs, which would be needed to decarbonise the transport sector, would reduce demand in particular for palladium, which is currently mainly used in autocatalysts. A production decline around ~10% is projected by 2035, however further PGM production shifts are less certain.22 New sources of PGMs demand may arise from, for example, electrolysers used to produce green H2 or in fuel cells for FCEVs. The scale of PGMs demand related to electrolyser and FCEV production would depend on the uptake of a green H2 economy. For example, even though FCEV penetration in the local passenger vehicle market is projected to be less than 1% by 2050, local FCEV uptake for heavy commercial vehicles (such as mining haul trucks) is projected to range from ~16% to ~45% by 2050.23 Hence, the decline in demand for PGMs could be partially compensated for by the emergence of a local H2 economy. Unrelated to climate change, gold production is expected to decline with increasing mine depth, decreasing ore grades and weakening cost position. Given the large socio-economic importance linked to thermal coal, PGMs and gold, it will be critical for South Africa to mitigate the socio-economic risk arising with the globally shifting value pools.
Demand for commodities such as iron ore, copper and battery and renewable energy technology materials (e.g., nickel, lithium, zinc) is expected to increase locally with increased deployment of green technologies across the power, transport and industry sector in particular. Demand for iron ore, which currently accounts for ~14% of local mining earnings, is expected to increase locally to meet

27CHAPTER 4: DECARBONISING THE SOUTH AFRICAN MINING SECTOR
ELECTRIC CAR
CONVENTIONALCAR
OFFSHOREWIND
ONSHOREWIND
SOLAR PV
NUCLEAR
COAL
NATURAL GAS
Clean energy technologies will become major drivers of new demand
for mining commodities.
Transport (kg/vehicle)0 100 20015050
Power generation (kg/MW)0 5,000 10,000 15,000 20,000
Copper Lithium Nickel Manganese Cobalt Graphite
Chromium Molybdenum Zinc Rare earths Silicon
Minerals used in selected clean energy technologies
The rapid deployment of these technologies as part of clean energy transitions implies a significant increase in demand for selected minerals.
Figure 7: The growth of clean energy technologies will drive the demand for minerals
Source: IEA Report, Net Zero by 2050 A Roadmap for the Global Energy Sector.
Note: The values for vehicles are for the entire vehicle, including batteries, motor and glider. The intensities for an electric car are based on a 75 kWh NMC (nickel manganese cobalt) 622 cathode and graphite-based anode. The values for offshore wind are based on the direct-drive permanent magnet synchronous generator system (including array cable) and the doubly-fed induction generator system, respectively. The values for coal and natural gas are based on ultra-supercritical plants and combined-cycle gas turbines. Actual consumption can vary by project depending on technology choice, project size and installation environment.
steel requirements for local large-scale infrastructure projects, particularly linked to the power sector where large-scale renewables capacity will need to be installed (installed renewable energy capacity in South Africa is expected to increase from ~6 GW currently to ~120 GW by 2050).24 Globally, total steel demand is also expected
24 NBI-BCG. 2021. Just Transition and Climate Pathways Project Study for South Africa: Decarbonising South Africa’s power system.25 IEA. 2021. Net Zero by 2050 – A Roadmap for the Global Energy Sector.
to increase, however, conventional steel will gradually be replaced by decarbonised, green steel products.25 For South Africa to remain competitive and maintain its global steel exports, sufficient local supply of iron ore and ability to produce green steel will be required.

28 JUST TRANSITION AND CLIMATE PATHWAYS STUDY FOR SOUTH AFRICA
In the context of climate change, the South African mining sector faces four key challenges: value pools are shifting away from South Africa’s key mining commodities towards green tech commodities; the pressure to decarbonise from stakeholders is mounting; there is a growing need to adapt mining operations; and ensuring a Just Transition will be critical.
Secondly, despite the relatively small overall Scope 1 and Scope 2 emissions footprint of the South African mining sector (Figure 9), local mining players will need to push for decarbonisation to maintain their license to operate and remain competitive in future markets demanding net-zero commodities. Recognising this, investors are starting to increase pressure on carbon-intense and unsustainable investments and increasingly value ‘green’ companies – whereby the carbon-intensity of mining companies has in recent times visibly impacted the companies’ valuation multiples, with impacts ranging from +12% for the lowest emissions intensity mining companies, to -10% for the highest emitters.26 Pressure is building not just from
26 Difference in valuation (Price:Sales) from median, all else equal.27 Company reporting.
investors, but also from civil society and from government via stricter regulations.
While Scope 1 and Scope 2 emissions of mining players are mostly under scrutiny and already addressed by many players via clear decarbonisation targets, Scope 3 emissions are now receiving increasing attention.
The Scope 3 emissions of mining companies are linked primarily to the processing and the use of their specific commodities and sold products. A few mining companies are already starting to address their Scope 3 emissions. For example, Glencore and BHP are involved in Carbon Capture Utilisation and Storage (CCUS) and Direct Air Carbon Capture and Storage (DACCS) projects and Rio Tinto is involved in the development of carbon-free aluminium smelting processes.27
Thirdly, the South African mining sector will need to adapt to local climate change impacts. South Africa will be among the countries at greatest physical risk from climate change. South Africa is already a semi-arid country and a global average temperature increase of 1.5 °C
Critical materials:
As a result of increasing
deployment of green
technologies,
opportunities in “‘new
high in demand’
commodities” emerge.
Demand for minerals, such as copper, lithium, nickel, cobalt and rare earths, grows significantly, driven by green tech growth.
By the 2040s, the size of the global market for green tech commodities will have reached that of coal today.
2020 2030 2040 20500
100
200
300
400
500
USD
(B) (
2019
)
Coal NickelCopper
Graphite
Lithium
Cobalt Rare earthsManganese
Figure 8: Global value of coal and selected critical minerals in the IEA Net Zero by 2050 emission scenario
Source: IEA Report, Net Zero by 2050 A Roadmap for the Global Energy Sector.
Note: Includes total revenue for coal and for selected critical minerals used in clean energy technologies. The prices of critical minerals are based on conservative assumptions about cost increases (around a 10–20% increase from current levels to 2050).

29CHAPTER 4: DECARBONISING THE SOUTH AFRICAN MINING SECTOR
above pre-industrial levels translates to an average 3 °C increase for Southern Africa, with the central interior and north-eastern periphery regions of South Africa likely to experience some of the highest increases. Research shows that a regional average temperature increase of over 1.5 °C for South Africa translates to a greater variability in rainfall patterns. Models show the northern, western and eastern regions of the country trending towards warmer and dryer conditions, with parts of the eastern coastal and escarpment regions of the country experiencing greater
variability in rainfall, as well as an increased risk of extreme weather events.
Mining companies will need to adapt to those physical changes in their operating environment and along the value chain. Mining infrastructure is vulnerable to physical risks from climate change. As a comparison, water shortages increased CAPEX and risk of stranded mining assets in South America – where Chile has become the first country to require mines to use desalinated water. Mines that did not invest in desalination, experienced
215
6334 7
2231
55
5221 500
-30
ELEC
TRIC
ITY
PRO
DU
CTIO
N
PETR
O-
CHEM
ICAL
S &
CH
EMIC
ALS
AGRI
CULT
URE
&
FO
REST
RY
MIN
ING
MAN
UFA
CTU
RIN
G&
CO
NST
RUCT
ION
MIN
ERAL
& M
ETAL
PR
OD
UCT
ION
COM
MER
CIAL
& R
ESID
ENTI
AL
WAS
TE
TRAN
SPO
RT
AFO
LU
SIN
KS
GRO
SS T
OTA
L
NET
TO
TAL
OVERVIEW OF EMISSIONS IN SOUTH AFRICA (Mt CO2e)
Direct emissions from the mining sector are responsible for 1–2% of
South Africa's total gross emissions (as per latest Department of Forestry,
Fisheries and the Environment estimate).
1 2 43 5
471
1–2% of total emissions
Figure 9: Mining sector contribution to South Africa’s emissions baseline
1. Greenhouse Gas National Inventory Emission (GHGI) figures based on view of Electricity & Heat Production of which electricity production contributes >97% of emissions.
2. GHGI does not explicitly state estimate for mining emissions so this has been estimated. Assumed Scope 1 emissions share of top 12 companies is same as
their market share (80%) and use this to gross up to 100%.
3. Agriculture (~47 Mt, labelled as ‘AFOLU excluding. FOLU’ in GHGI) and energy emissions in Agriculture/Forestry/Fishing (~4 Mt).
4. Gross total excludes categories 1A5 as it is not linked to any sectors and 1B1 to avoid the double counting of fugitive
emissions from coal, gold, and PGMs mining which are included in the mining sector emissions approximation.
5. AFOLU sinks: FOLU (labelled as ‘Land’ in GHGI) + Other (‘harvested wood products’).
Sources: GHGI. 2017; IEA. 2015; WEO. 2019; CDP. 2015; GHGI. 2015; CAT; NBI-BCG project team.

30 JUST TRANSITION AND CLIMATE PATHWAYS STUDY FOR SOUTH AFRICA
interruptions in operations due to water shortages. Building resilience against the physical risk of local climate change will be critical for mining players active in South Africa.
Fourthly, given the critical socio-economic role the mining sector plays in South Africa, it will be important to respond to these challenges while ensuring a Just Transition across the sector’s value chain and in key mining regions in particular. In 2019, the sector employed more than 450 000 people directly, almost 60% of those jobs were linked to thermal coal and PGM mining in the north, north-east and north-west of the country (Figure 10). As mentioned earlier, on average, one mining worker is estimated to have 5–10 dependents. This means, that 2–4 million South Africans rely on the mining sector as a source of income. Of those, ~1.3 to ~2.6 million livelihoods are linked to coal and PGM mining and are therefore at particular risk from shifting value pools away from coal.
28 Minerals Council South Africa. 2019. The extent, nature and economic impact of the junior and emerging mining sector in South Africa.
However, junior miners in the coal mining sector will also require support in responding to the various challenges, from adaptation needs, to the need to decarbonise and manage the phase-out of coal. Junior miners make up ~63% of all coal mining licenses being operated in South Africa, compared to PGMs where only ~23% of South African licenses are operated by junior miners. The coal sector also makes up ~55% of junior miner mining licenses in South Africa amongst the top four highest earning commodities (coal, PGMs, gold and iron ore). Although the junior mining sector in South Africa only makes up ~8% of total mining industry revenues, a survey by the Minerals Council South Africa (Minerals Council) of 25 junior mining companies found that 37% viewed coal as the most attractive commodity for success as a junior miner – indicating its importance to the junior mining sector and the need for a concerted effort to support these players in the coal phase-out.28
No coal and PGMs employment
Concentrated coal and PGMs employment
The shift in value pools puts significant socio-economic risk on today's
mining regions in South Africa.
Size of bubbles indicates regional number
of jobs in coal and platinum respectively –
proportional to regional mining
jobs in other commodities.
PGMs
COAL
Northern Cape
Western Cape
Eastern Cape
KwaZulu-Natal
Free State
North West(Klerksdorp)
North West(Rustenburg)
Gauteng
Limpopo
Mpumalanga
Figure 10: Potential socio-economic risks in mining regions and communities in South Africa
Source: Stats SA; Minerals Council South Africa, Facts and Figures 2019; NBI-BCG analysis.
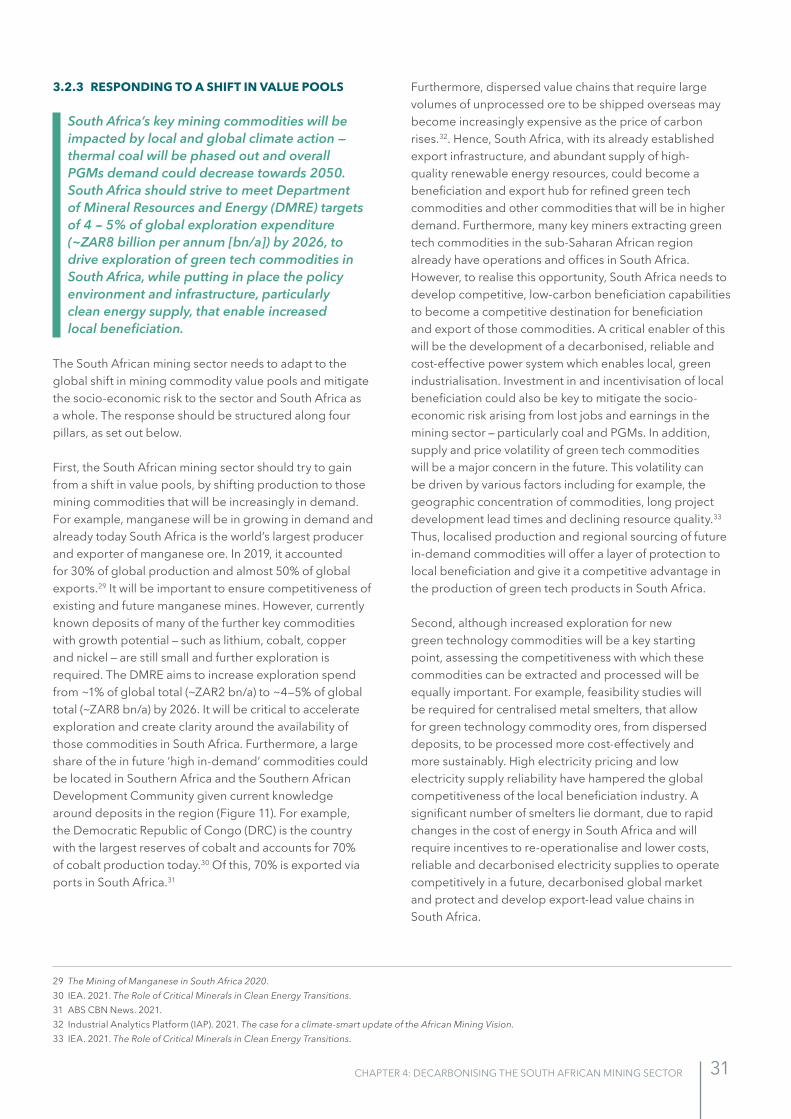
31CHAPTER 4: DECARBONISING THE SOUTH AFRICAN MINING SECTOR
3.2.3 RESPONDING TO A SHIFT IN VALUE POOLS
South Africa’s key mining commodities will be impacted by local and global climate action –– thermal coal will be phased out and overall PGMs demand could decrease towards 2050. South Africa should strive to meet Department of Mineral Resources and Energy (DMRE) targets of 4 –– 5% of global exploration expenditure (~ZAR8 billion per annum [bn/a]) by 2026, to drive exploration of green tech commodities in South Africa, while putting in place the policy environment and infrastructure, particularly clean energy supply, that enable increased local beneficiation.
The South African mining sector needs to adapt to the global shift in mining commodity value pools and mitigate the socio-economic risk to the sector and South Africa as a whole. The response should be structured along four pillars, as set out below.
First, the South African mining sector should try to gain from a shift in value pools, by shifting production to those mining commodities that will be increasingly in demand. For example, manganese will be in growing in demand and already today South Africa is the world’s largest producer and exporter of manganese ore. In 2019, it accounted for 30% of global production and almost 50% of global exports.29 It will be important to ensure competitiveness of existing and future manganese mines. However, currently known deposits of many of the further key commodities with growth potential – such as lithium, cobalt, copper and nickel – are still small and further exploration is required. The DMRE aims to increase exploration spend from ~1% of global total (~ZAR2 bn/a) to ~4–5% of global total (~ZAR8 bn/a) by 2026. It will be critical to accelerate exploration and create clarity around the availability of those commodities in South Africa. Furthermore, a large share of the in future ‘high in-demand’ commodities could be located in Southern Africa and the Southern African Development Community given current knowledge around deposits in the region (Figure 11). For example, the Democratic Republic of Congo (DRC) is the country with the largest reserves of cobalt and accounts for 70% of cobalt production today.30 Of this, 70% is exported via ports in South Africa.31
29 The Mining of Manganese in South Africa 2020.30 IEA. 2021. The Role of Critical Minerals in Clean Energy Transitions.31 ABS CBN News. 2021.32 Industrial Analytics Platform (IAP). 2021. The case for a climate-smart update of the African Mining Vision.33 IEA. 2021. The Role of Critical Minerals in Clean Energy Transitions.
Furthermore, dispersed value chains that require large volumes of unprocessed ore to be shipped overseas may become increasingly expensive as the price of carbon rises.32. Hence, South Africa, with its already established export infrastructure, and abundant supply of high-quality renewable energy resources, could become a beneficiation and export hub for refined green tech commodities and other commodities that will be in higher demand. Furthermore, many key miners extracting green tech commodities in the sub-Saharan African region already have operations and offices in South Africa. However, to realise this opportunity, South Africa needs to develop competitive, low-carbon beneficiation capabilities to become a competitive destination for beneficiation and export of those commodities. A critical enabler of this will be the development of a decarbonised, reliable and cost-effective power system which enables local, green industrialisation. Investment in and incentivisation of local beneficiation could also be key to mitigate the socio-economic risk arising from lost jobs and earnings in the mining sector – particularly coal and PGMs. In addition, supply and price volatility of green tech commodities will be a major concern in the future. This volatility can be driven by various factors including for example, the geographic concentration of commodities, long project development lead times and declining resource quality.33 Thus, localised production and regional sourcing of future in-demand commodities will offer a layer of protection to local beneficiation and give it a competitive advantage in the production of green tech products in South Africa.
Second, although increased exploration for new green technology commodities will be a key starting point, assessing the competitiveness with which these commodities can be extracted and processed will be equally important. For example, feasibility studies will be required for centralised metal smelters, that allow for green technology commodity ores, from dispersed deposits, to be processed more cost-effectively and more sustainably. High electricity pricing and low electricity supply reliability have hampered the global competitiveness of the local beneficiation industry. A significant number of smelters lie dormant, due to rapid changes in the cost of energy in South Africa and will require incentives to re-operationalise and lower costs, reliable and decarbonised electricity supplies to operate competitively in a future, decarbonised global market and protect and develop export-lead value chains in South Africa.

32 JUST TRANSITION AND CLIMATE PATHWAYS STUDY FOR SOUTH AFRICA
Third, the mining sector should drive market development related to the use of green tech commodities. This could be of particular value for maintaining demand for PGMs, where demand for PGMs for production of electric vehicles and stationary applications, batteries and electrolysers for H2 production (for example, for the production of green steel), could partially compensate
for the decline in demand due to a shrinking conventional internal combustion vehicles market. Anglo American drives such an approach and has invested more than US$100 million to drive PGMs market development to offset potential demand reduction in the automotive sector (see Case Study 1). In this context, the Minerals Council has highlighted the need for commitment from
Figure 11: Shift to high demand commodities
Known green technology commodity deposits in sub-Saharan Africa.
Battery supply chain reserves in Southern Africa (metric tonnes)
INDICATIVE (not exhaustive)
Zimbabwe Li 70 000 C 2 000 Ni 4.5 million Cu 5.2 million
Democratic Republic of Congo Li 1 million (resources) Co 3.5 million Cu 20 million
Namibia Li 9 000 C 2 200 Co 112 400
BotswanaLi resources unknown
TanzaniaC 17 000
Mozambique Li resources unknown C 81.4 million
ZambiaCo 270 000Cu 19 million
South AfricaLi resources unknown V 3 500 Mn 230 000 Co 29 000 Ni 3.7 millionCu resources unknown
SA currently has little or no access to deposits that contain the materials expected to benefit from climate change — particularly copper and battery metals (lithium, cobalt and nickel).
Madagascar C 1 600 Co 150 000 Ni 1.6 million
Source: DMRE, NBI-BCG analysis.
Note: Li = Lithium, Co = Cobalt, Cu = Copper, V = Vanadium, Mn = Manganese, Ni = Nickel, C=Coal

33CHAPTER 4: DECARBONISING THE SOUTH AFRICAN MINING SECTOR
government to match funding by the PGM sector on market development in jewellery, investment and fuel cells. The Minerals Council also calls for the development of a national platinum reserve asset strategy and national strategies to drive investment and fuel cell demand for platinum. However, recent increases in energy costs pose a threat to the South African mining sector’s ability to reap the benefits of PGMs market development. Actions must be taken to ensure more reliable, lower cost and cleaner electricity supplies for local PGMs beneficiation to ensure global competitiveness of local beneficiation.
Fourth, the mining sector needs to explore new business models that can fill the gap that is created by a shift in value pools, away from thermal coal and partially also PGMs. Some mining players are already exploring new products and services linked to a green economy. In this context, materials recycling is seen as one critical activity
34 IEA. 2021. The Role of Critical Minerals in Clean Energy Transitions.
needed to mitigate supply shortages for key commodities. The IEA estimates that by 2040 recycled quantities of copper, lithium, nickel and cobalt from used batteries could reduce combined primary demand for these materials by circa 10%.34 Some companies are already shifting their business models towards the direction of materials recycling and ‘circular economy’ approaches. Umicore for example, transformed itself from a mining player into a technological leader in materials (Case Study 2).
CASE STUDY 1: ANGLO AMERICAN PLATINUM
Anglo American Platinum has invested over US$100 million to drive the PGMs market development as a means to offset the expected decline of PGMs demand from the automotive sector. This investment has been deployed along three strategic areas of action:
1. Nurturing new PGMs applications For example, Anglo American Platinum partners with the University of Warwick and Platinum Group Metals Ltd. to develop PGMs-based medical devises and vehicle battery technology.
2. Commercialising new PGMs applications For example, Anglo American Platinum invests directly in PGMs-based ventures and launched a PGM technology-focused venture capital fund in partnership with Toyota, Mitsubishi and others.
3. Communicating and advocating new and existing PGMs applications Anglo American Platinum works with the World Platinum Investment Council, Platinum Guild International and the Hydrogen Council to, for example stimulate investment in and uptake of, demand for existing and future applications that rely on PGMs (such as jewellery, green H2 and Power-to-X (P2X) production technology).
CASE STUDY 2: UMICORE
Mining of zinc and copper used to be Umicore’s core business activity. However, it has transformed from a mining player to one of the leading green materials-technology producers.
In 2005 Umicore sold off most of its existing copper and zinc smelters and acquired capability and technology centred on primary metals recycling. The company’s 2010 strategic roadmap centred around recycling of new generations of battery and photovoltaic materials, in line with the growing renewable energy trend.
Today, Umicore has developed competitive advantage in the green materials industry in three ways:
1. It runs on a closed-loop green materials business model, whereby a high volume of the metals used, come from recycled sources, such as production scraps, residues from their customers, and end-of-life materials from their own operations.
2. It has positioned itself as a market leader in recycled green mobility materials, in line with the megatrend of increasing metals scarcity despite increasing demand.
3. The company has set ambitious 2035 net-zero targets and was the first company in the battery value chain to offer materials which are certified by an independent third party as coming from an ethical source.
As a result, Umicore, operates at the frontier of the green tech economy, generating EUR2.4 bn in revenues and ranking first on the Global 100 Index of the world’s most sustainable companies.

34 JUST TRANSITION AND CLIMATE PATHWAYS STUDY FOR SOUTH AFRICA
Deep-dive: The H2 South Africa strategy –– PGMs market development in South Africa
In an effort to coordinate the Department of Science and Innovation’s Hydrogen South Africa (HySA) Strategy, the Minerals Beneficiation Strategy and the National Climate Change Response White Paper, the Department of Science and Innovation (DSI) has commenced the establishment of a ‘Platinum Valley’. The ‘valley’ will provide an industrial corridor linking PGMs mining areas in Limpopo, including the Limpopo Province Science and Technology Park, with the Johannesburg-to-Durban transport corridor (OR Tambo International Airport to King Shaka International Airport). The project will serve as an industrial cluster to bring together H2 applications in the country to develop an integrated H2 ecosystem and drive local PGMs demand.
Specifically, the ‘valley’ aims to identify projects that provide opportunities for low emissions PGMs and H2 market development to drive economic growth and job creation and maximise South Africa’s ability to extract value from its significant PGM deposit.
Currently, South Africa’s metal recycling industry is valued at between ZAR15 billion and ZAR20 billion per annum, with scrap metal exports growing from ~ZAR2 billion in 2005 to ~ZAR12 billion in 2014, driven by ferrous exports to China (e.g., steel and iron).35 South Africa will need to further expand its recycling capabilities to support competitive, lower-emissions, local production of green technologies and mitigate the risk of global green technology commodity supply shortages.
3.2.4 DECARBONISING MINING IN SOUTH AFRICA
The mining sector in South Africa contributes around 1% to national direct emissions (2017). Direct emissions (Scope 1) in mining are driven by:
1. Diesel combustion in mobile and stationary machinery including diesel generators
2. Coal combustion for heating3. Fugitive methane and carbon dioxide emissions –
primarily from the coal sector (e.g., fugitive emissions from spontaneous combustion of coal).
35 Department of Environmental Affairs (DEA). 2014. The South African metal recycling industry in focus.36 Lloyd and Cook. 2004. 37 United States Environmental Protection Agency (USEPA). 2010.
Fugitive emissions in the mining sector are difficult to measure given that most sources are low concentration and – in the case of closed mines – difficult to detect, meaning that fugitive emissions are likely higher than currently estimated. For example, in 2021, analytics company Kayrros SAS detected significant fugitive methane clouds over the coal mining region of South Africa. The methane was estimated to be leaking at a rate of ~65 tonnes/hr (~1.6 k tonnes CO2e/hr). However, major coal mining operations in the area did not report unusually high methane release during the leaking period. This points to coal mines, potentially also decommissioned mines, as a present and future high emissions source – highlighting the need to ensure stricter standards of reporting and management. Estimations of fugitive methane emissions from the South African coal industry have ranged from ~2 Mt CO2e per annum to 9 Mt CO2e per annum, whereby the range is linked to inconsistent reporting and uncertainty over the emissions factors used – for example, some local mining companies indicate that international emissions factors are too high given South Africa’s lower emissions geology.36 37
On the other hand, indirect, electricity-use related emissions (Scope 2), make up the bulk (~77%) of total Scope 1 and Scope 2 emissions in the sector. Scope 2 emissions in mining in South Africa are exceptionally high, when compared to the global average. They are more than six times the Scope 2 emissions of international peers. This is driven by the high carbon-intensity of grid electricity and the complex and relatively difficult operational context (e.g., deeper mining), which results in relatively high electricity demand by mining operations in South Africa (Figure 12).
Scope 3 emissions of the South African mining sector are substantial and are driven by the burning of thermal coal for electricity production in the power sector and emissions associated with the production of steel, hence driving Scope 3 emissions of locally produced iron ore. While Scope 3 emissions in South Africa also include emissions from metallurgical processes (e.g., smelting, refining), these sources tend to be significantly smaller contributors than the users of coal and iron ore, due to the differing natures of each downstream industry and can largely be decarbonised through renewable electricity supplies. For example, gold and PGMs major Sibanye Stillwater produced ~1.4 Mt CO2e in Scope 3 emissions from refinement of locally extracted gold and PGMs in 2019, while coal mining and iron ore mining majors Exxaro and Kumba Iron Ore produced ~74 Mt CO2e and ~111 Mt
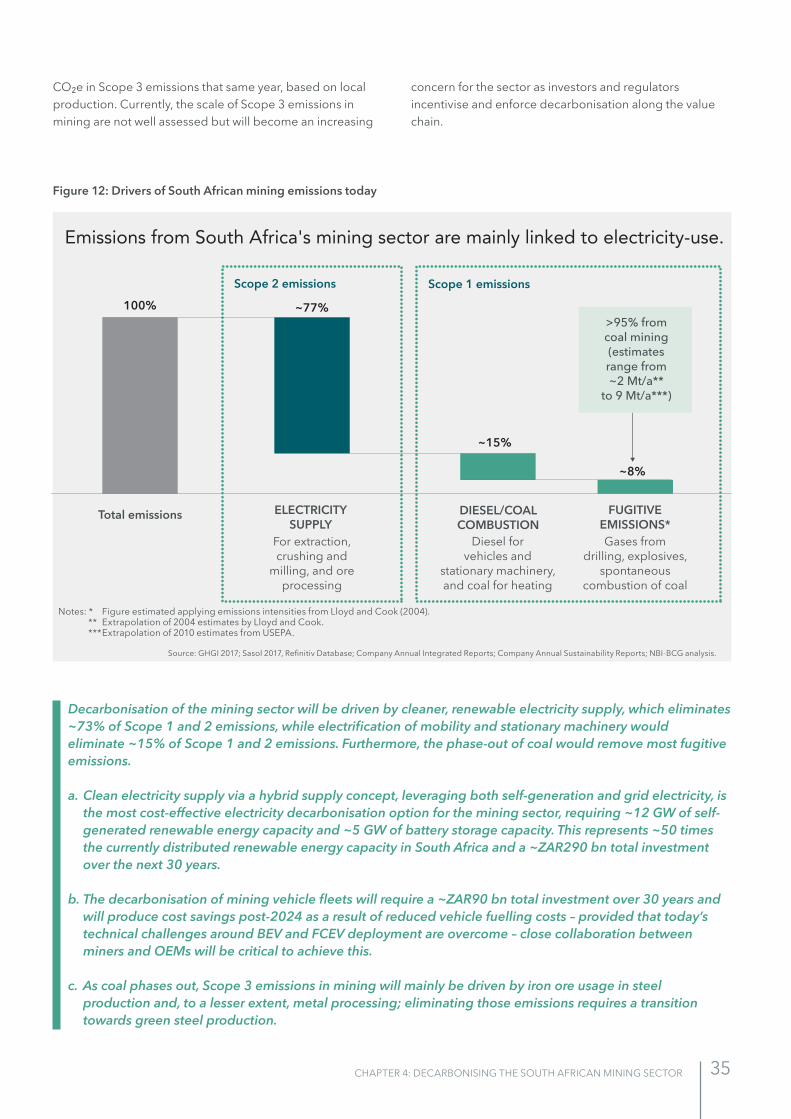
35CHAPTER 4: DECARBONISING THE SOUTH AFRICAN MINING SECTOR
CO2e in Scope 3 emissions that same year, based on local production. Currently, the scale of Scope 3 emissions in mining are not well assessed but will become an increasing
concern for the sector as investors and regulators incentivise and enforce decarbonisation along the value chain.
Emissions from South Africa's mining sector are mainly linked to electricity-use.
Scope 2 emissions
Total emissions
Scope 1 emissions
ELECTRICITY SUPPLY
DIESEL/COALCOMBUSTION
FUGITIVE EMISSIONS*
For extraction, crushing and
milling, and ore processing
Diesel for vehicles and
stationary machinery, and coal for heating
Gases from drilling, explosives,
spontaneous combustion of coal
100% ~77%
~15%
~8%
>95% from coal mining (estimates range from ~2 Mt/a**
to 9 Mt/a***)
Figure 12: Drivers of South African mining emissions today
Source: GHGI 2017; Sasol 2017, Refinitiv Database; Company Annual Integrated Reports; Company Annual Sustainability Reports; NBI-BCG analysis.
Notes: * Figure estimated applying emissions intensities from Lloyd and Cook (2004). ** Extrapolation of 2004 estimates by Lloyd and Cook. *** Extrapolation of 2010 estimates from USEPA.
Decarbonisation of the mining sector will be driven by cleaner, renewable electricity supply, which eliminates ~73% of Scope 1 and 2 emissions, while electrification of mobility and stationary machinery would eliminate ~15% of Scope 1 and 2 emissions. Furthermore, the phase-out of coal would remove most fugitive emissions.
a. Clean electricity supply via a hybrid supply concept, leveraging both self-generation and grid electricity, is the most cost-effective electricity decarbonisation option for the mining sector, requiring ~12 GW of self-generated renewable energy capacity and ~5 GW of battery storage capacity. This represents ~50 times the currently distributed renewable energy capacity in South Africa and a ~ZAR290 bn total investment over the next 30 years.
b. The decarbonisation of mining vehicle fleets will require a ~ZAR90 bn total investment over 30 years and will produce cost savings post-2024 as a result of reduced vehicle fuelling costs – provided that today’s technical challenges around BEV and FCEV deployment are overcome – close collaboration between miners and OEMs will be critical to achieve this.
c. As coal phases out, Scope 3 emissions in mining will mainly be driven by iron ore usage in steel production and, to a lesser extent, metal processing; eliminating those emissions requires a transition towards green steel production.

36 JUST TRANSITION AND CLIMATE PATHWAYS STUDY FOR SOUTH AFRICA
Addressing Scope 1 and 2 emissions of South Africa’s mining sector
Addressing Scope 1 and 2 emissions in mining requires the deployment of a set of levers which differ in their reduction potential and techno-economic feasibility (Figure 13, Figure 14).
Reducing emissions linked to electricity consumption in mining
The largest decarbonisation lever in mining is the deployment of renewable energy for meeting the sector’s electricity demand. Fully decarbonising electricity would reduce the sector’s total Scope 1 and 2 emissions by ~73%, given 73% of Scope 1 and Scope 2 emissions are driven by electricity usage. Energy-efficiency improvements could further reduce the total Scope 1 and 2 emission baseline by a conservative ~5%.
The key lever to reduce emissions from the mining sector in South Africa
is the decarbonisation of the electricity supply.
EFFI
CIEN
CIES
POW
ER
DEC
ARBO
N-
ISAT
ION
SCO
PE 1
DEC
ARBO
NIS
ATIO
NO
F RE
MAI
NIN
G O
PERA
TIO
NS
Energy and process
efficiency
Total (Scope 1 and 2)
Power decarbonisation
Scope 1 emissions
Fuel switching in
tranport
Electrification of stationary
machinery and process
Methanecapture,
utilisation and storage
Carbon capture,
utilisation and storage
Emiss
ions
from
dire
ct
use
of e
nerg
y(o
n-sit
e fu
el c
ombu
stio
n)
Fugi
tive
emiss
ions
: U
nlik
ely
to b
e fe
asib
le o
n la
rge
scal
e gi
ven
Sout
h A
frica
n ge
olog
y
5%
73%
10%
4%
5%
3%
Decreasing electricity/fuel usage and improving efficiency via circular economy approaches
Substituting carbon-intensive power with renewable energy supply, battery and other green storage
Converting diesel-powered vehicles to FCEV or BEV (depending on mine-by-mine context)
Switching diesel/coal for stationary machinery and heating for green electricity supply
Capturing methane emissions, and utilising them within mining processes (e.g., to generate electricity)
Capturing CO2 emissions from fuel/biomass combustion and storing (CCS) or using (CCU) CO2.
Figure 13: Key decarbonisation levers
Source: Company reports; NBI-BCG analysis.
Notes: * Fugitive emissions. ** Dependent on mix of efficiency levers and maturity of operation.

37CHAPTER 4: DECARBONISING THE SOUTH AFRICAN MINING SECTOR
Abatement levers vary in their techno-economic feasibility and
abatement potential.
Energy efficiency (EE)
Electrification with renewable power supply
The size of the bubbles represents the emissions abatement potential of each lever in the South African mining sector.
Renewable electricity supply
Green hydrogen
Carbon capture
Coal mining methane emissions reductions
FeasibilityCurrent technical feasibility and regulatory/social support
Abat
emen
t cos
t (ZA
R/t C
O2e
)Positive grow
th potential
Electricity for heat (replacing coal)
On the radar
Quick wins
Selective development and R&D
Technical maturation
Recycling and reuse of metals
EE in thermal/combustion processes
EE in electrical consumers (e.g. crushers, conveyors, etc.)
Renewable power:Mining and concentration
BEVs
FCEVs
Surface boreholes and use of methane for P&H generation
Synfuels
CCS
Degassing adjustments and use of fugitive methane emissions for power and heat generation
High
HighLow
Low
Figure 14: Techno-economic feasibility of abatement levers
Source: BCG report, The Economic Case for Combating Climate Change; NBI-BCG analysis.

38 JUST TRANSITION AND CLIMATE PATHWAYS STUDY FOR SOUTH AFRICA
Different supply concepts need to be considered in the cost and cumulative emission analysis of this lever. For example, a mine could either move completely off-grid and use locally produced electricity from renewables – which might enable faster decarbonisation of electricity, or it could stay connected to the grid and decarbonise its electricity usage in line with grid decarbonisation – which could delay decarbonisation due to the dependence on the speed of grid decarbonisation, or it could use a ‘hybrid’ concept that leverages both grid and off-grid electricity supply.
To understand the cost, cumulative emissions and technology requirements related to decarbonising electricity used in mining, three electricity supply concepts were compared (see deep-dive ‘Approach and key assumptions for the assessment of decarbonisation pathways for mining Scope 1 and Scope 2 emissions’ on “Deep-dive: Approach and key assumptions for the assessment of decarbonisation pathways for mining Scope 1 and Scope 2 emissions” on page 44):
1. Grid-connected: Electricity is supplied via the grid and the carbon-intensity of the electricity used is dependent on the carbon-intensity of the power grid.
2. Hybrid: Electricity is supplied via a mix of grid electricity and distributed renewable energy.
3. Off-grid: Electricity is supplied via distributed renewable energy.
The analysis shows that the hybrid concept was the least expensive over the 2020–2050 period (saving on average ~ZAR272/tonne abated versus the grid concept) and produced the second lowest cumulative emissions. Conversely, the off-grid concept was the most expensive, costing ~27% more than the cheapest, hybrid concept over the 2020–2050 period, but produced the lowest cumulative emissions. Although the hybrid supply concept appears to provide both significant cost savings and abatement potential versus the more capital intensive off-grid supply concept, this will depend on how grid tariffs evolve. If the average real tariff for mining companies (currently ~ZAR0.8–0.9/kWh) were to rise to ZAR1.68/kWh,
Figure 15: Sensitivity of hybrid electricity concepts to grid tariff increases
The hybrid concept is sensitive to grid tariff increases and reaches cost parity
with the off-grid concept if the grid tariff increases by ~70% in real terms.
Solar PV Battery Grid tariff H2 (including turbine)
HYBRID OFF-GRID (2030) OFF-GRID (2030)
Although the hybrid
concept is significantly
cheaper at current grid
tariffs, increasing the
average tariff from
~ZAR1/kWh to more
than ~ZAR1.68/kWh
makes the off-grid
concept cheaper than
the hybrid.
700
182
1 065
183
489
303
72
485
Cumulative cost of supply (2020–2050) – ZAR billion
1 349
HYBRID
1 171
183
182
489
488
485
72
1 536 1 534
+25.3%
Grid tariff = ZAR1.00/kWh Grid tariff = ZAR1.68/kWh
Source: NBI-BCG analysis.
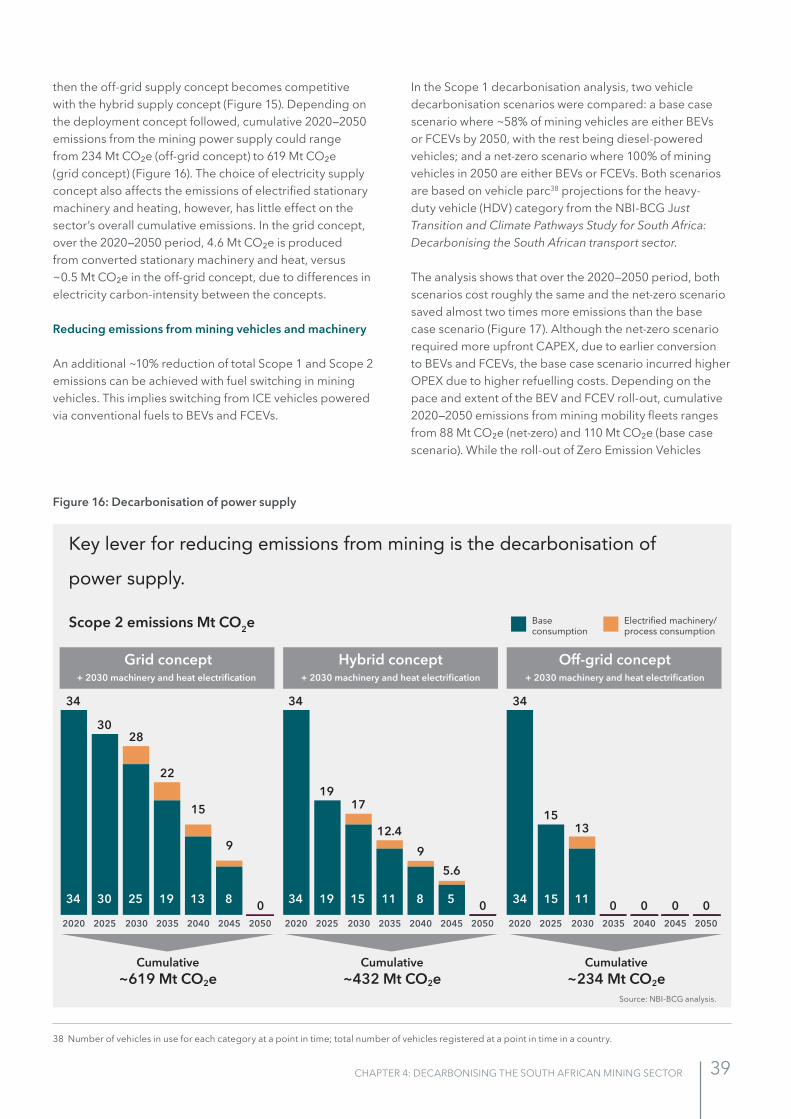
39CHAPTER 4: DECARBONISING THE SOUTH AFRICAN MINING SECTOR
then the off-grid supply concept becomes competitive with the hybrid supply concept (Figure 15). Depending on the deployment concept followed, cumulative 2020–2050 emissions from the mining power supply could range from 234 Mt CO2e (off-grid concept) to 619 Mt CO2e (grid concept) (Figure 16). The choice of electricity supply concept also affects the emissions of electrified stationary machinery and heating, however, has little effect on the sector’s overall cumulative emissions. In the grid concept, over the 2020–2050 period, 4.6 Mt CO2e is produced from converted stationary machinery and heat, versus ~0.5 Mt CO2e in the off-grid concept, due to differences in electricity carbon-intensity between the concepts.
Reducing emissions from mining vehicles and machinery
An additional ~10% reduction of total Scope 1 and Scope 2 emissions can be achieved with fuel switching in mining vehicles. This implies switching from ICE vehicles powered via conventional fuels to BEVs and FCEVs.
38 Number of vehicles in use for each category at a point in time; total number of vehicles registered at a point in time in a country.
In the Scope 1 decarbonisation analysis, two vehicle decarbonisation scenarios were compared: a base case scenario where ~58% of mining vehicles are either BEVs or FCEVs by 2050, with the rest being diesel-powered vehicles; and a net-zero scenario where 100% of mining vehicles in 2050 are either BEVs or FCEVs. Both scenarios are based on vehicle parc38 projections for the heavy-duty vehicle (HDV) category from the NBI-BCG Just Transition and Climate Pathways Study for South Africa: Decarbonising the South African transport sector.
The analysis shows that over the 2020–2050 period, both scenarios cost roughly the same and the net-zero scenario saved almost two times more emissions than the base case scenario (Figure 17). Although the net-zero scenario required more upfront CAPEX, due to earlier conversion to BEVs and FCEVs, the base case scenario incurred higher OPEX due to higher refuelling costs. Depending on the pace and extent of the BEV and FCEV roll-out, cumulative 2020–2050 emissions from mining mobility fleets ranges from 88 Mt CO2e (net-zero) and 110 Mt CO2e (base case scenario). While the roll-out of Zero Emission Vehicles
Key lever for reducing emissions from mining is the decarbonisation of
power supply.
Scope 2 emissions Mt CO2e Electrified machinery/process consumption
Base consumption
2020 2025 2030 2035 2040 2045 2050 2020 2025 2030 2035 2040 2045 2050 2020 2025 2030 2035 2040 2045 2050
Grid concept+ 2030 machinery and heat electrification
Hybrid concept+ 2030 machinery and heat electrification
Cumulative~619 Mt CO2e
Cumulative~432 Mt CO2e
Cumulative~234 Mt CO2e
Off-grid concept+ 2030 machinery and heat electrification
34
3028
22
15
9
034 30 25 19 13 8
34
1917
12.49
5.6
034 19 15 11 8 5
34
1513
000034 15 11
Figure 16: Decarbonisation of power supply
Source: NBI-BCG analysis.

40 JUST TRANSITION AND CLIMATE PATHWAYS STUDY FOR SOUTH AFRICA
(ZEVs) initially costs ~ZAR750/tonne CO2e abated versus diesel versions between 2021 and 2025, abatement costs turn into savings after 2025 as renewable energy prices continue to drop and diesel prices rise. However, despite total cost of ownership parity being reached theoretically in 2025, this does not take into account current technical feasibility challenges that will likely delay the widespread rol-out of ZEVs to 2030 and beyond. For example, BEV charging currently takes significantly longer than refuelling with diesel. This additional time away from operation is infeasible in the mining sector where constant operation is key to profitability. Greater collaboration between OEMs and mining players will be required to accelerate development of ZEVs that allow for total cost of ownership savings, without compromising mining output performance.
The electrification of stationary machinery and replacement of coal for the generation of heat with electricity and heat generated from renewable energy, respectively, enables a further 4% reduction in total Scope 1 and 2 emissions. In this analysis, all electrification of stationary machinery occurs before 2030, given the relative ease of implementation. While electrifying diesel machinery produces cost savings, due to the high cost of diesel, the electrification of coal for heat produces high abatement costs, due to the low price of coal. However, the impact of this on overall decarbonisation cost is small given the insignificant role of thermal coal burning in mining operations.
CASE STUDY 3: EXXARO
Mining players in South Africa are already beginning to shift business models to take advantage of and drive the accelerated decarbonisation of South African mining power supply. This offers an opportunity to producers of future ‘out-of-favour’ minerals, such as thermal coal, to diversify and decarbonise their businesses.
Entering the renewable energy market: Exxaro Resources Ltd. one of South Africa’s five largest coal producers by earnings, entered the renewable energy production market in 2012, with the formation of Cennergi (Pty) Ltd. Through the participation in the Renewable Energy Independent Power Producer Procurement Programme (REIPPPP), Cennergi has constructed and now operates 229 MW of wind farms, making it South Africa’s second largest locally-owned renewable Independent Power Producer (IPP).
Objectives and strategy: The Just Energy Transition is central to Cennergi’s business case, and the company aims to create sustainable impact across multiple dimensions in communities through their operations and community programmes. Cennergi’s goal is to become a leading international renewable energy solutions provider to the public and private sectors by 2030, by leveraging Exxaro’s mining experience and combining this with Cennergi’s renewables knowledge databases to create digital project assessment tools. The
company has already cross-trained mining professionals to organically grow the business and continue to upskill their employees to align with this vision.
Outlook
Self-generation and generation for other mining players: Cennergi’s near-term pipeline consists of 93 MW solar PV facilities in Limpopo and Mpumalanga for Exxaro’s own mines – to enable Scope 2 emissions reduction and Exxaro’s commitment to be carbon-neutral by 2050. It is expected that this supply will reduce emissions from Exxaro’s Grootegeluk operation (which accounts for ~50% of Exxaro’s coal production) by up to 36% at full mine production. The target generation capacity is 3 GW net additional capacity, which can be up to 6 GW gross capacity, depending on ownership structures. This target will be achieved by providing similar IPP-type solutions at other mines in South Africa and internationally, enabling their Just Energy Transitions with zero capital investment.
Additional target segments: Cennergi will also target large-scale utility generation installations, and digital disruptive value-adding services. Cennergi plans to take this model into up to five new countries in the coming decade, expecting to invest up to ZAR45 bn (debt and equity) in their projects over that period.
41CHAPTER 4: DECARBONISING THE SOUTH AFRICAN MINING SECTOR
Photo: Cennergi

42 JUST TRANSITION AND CLIMATE PATHWAYS STUDY FOR SOUTH AFRICA
Addressing fugitive emissions
Remaining emissions are linked to fugitive emissions, and based on current data represent around 8% of total Scope 1 and 2 emissions. However, this figure might be higher given uncertainties in detecting and measuring fugitive emissions. Over 95% of fugitive mining emissions in South Africa originate from coal mining and are difficult to capture given the low concentrations. Roughly 85% of these emissions will eventually be eliminated with the ongoing closure of coal mines as a result of declining thermal coal demand. However, closed mines can still pose a ‘fugitive emissions risk’ from, for example, spontaneous combustion on closed mining sites. Therefore, setting
appropriate mining site closure standards and ensuring adherence to those standards, as well as ongoing monitoring of spontaneous combustion, will be key to mitigate the risk of fugitive emission leaks at closed coal mining sites. Cumulatively, over the 2020-2050 period, the sector is projected to produce ~59 Mt CO2e of fugitive emissions, with annual fugitive emissions declining from ~3.5 Mt CO2e/annum in 2019 to ~0.45 Mt CO2e/annum in 2050, due to the coal phase-out (Figure 18). Remaining fugitive emissions are driven by low concentration streams in the gold and platinum sector and will require high-cost Methane Capture, Utilisation and Storage (MCUS) and CCUS systems to abate.
Figure 17: Assessment of cost and emissions trade-offs of decarbonisation concepts
Over the 2020–2050 period, a hybrid electricity concept that draws on
self-generated renewable energy (RE) and grid supply, is the most promising
business case for accelerated electricity decarbonisation.
640
519 5221 116 1 065
1 349
Cumulative emissions(Mt CO2e)
Abatement cost
(ZAR/tonne)
CumulativeCAPEX
(ZAR billion)
CumulativeOPEX
(ZAR billion)
Totalcumulative cost:
2020–2050(ZAR billion)
SCOPE 2
Totally decarbonise mining electricity supply by 2050 (including electricity required for machinery/process electrification)
SCOPE 1 SCOPE 2
Switch to FCEVs and BEVs and supply with RE
No ZEV switch(baseline)
Base case ZEVswitch
Net-zero ZEV switch
Decarbonise in line with grid
by 2050
Hybrid grid-RE supply
by 2030*
Off-grid RE electricity supply
by 2030**
135
N/A
0
640
110
-4 890
39
480
88
-2 505
90
432
619
N/A
0
1 116
432
-272
288
777
234
605
818
531
0 1a 1b 4 5 6
Carbon tax not included
2020–2050 period
Source: NBI-BCG analysis.
Notes: Constant grid tariff of US$65/MWh assumed; diesel and coal prices of US$75/MWh and US$4/MWh assumed for 2019 and scaled with EIA projections to 2050; Green H2 delivered cost changes from US$4.3/kg in 2025 to US$2.1/kg in 2050.
* Constant hourly supply of electricity ensured by supplementing RE and battery supply with grid electricity. ** Constant hourly supply of electricity is ensured by supplementing RE and battery supply with piped green H2 which is
fed into on-site turbines.

43CHAPTER 4: DECARBONISING THE SOUTH AFRICAN MINING SECTOR
Figure 18: Effect of coal phase-out on mining emissions
Analysis assumes significant coal mine closures and that new operations are
net-zero after 2035, reducing the sector's Scope 1 and 2 emissions by ~30%
and fugitive emissions by ~85% by 2050.
Diesel combustion Coal combustion Fugitive Electricity
2019 2030 2040 2050
Production decline
of coal will cause
decrease in sector
emissions by 2050
without considering
levers. However, other
commodity production
assumed to plateau.
-30%
34.48
3.50
45.11
6.34
32.56
2.87
5.92
28.52
1.560.78
5.05
28.33
0.470.78
4.31
Scope 1 and 2 emissions (Mt CO2e)
0.78
0.78
Source: Expert Interviews; NBI-BCG analysis.

44 JUST TRANSITION AND CLIMATE PATHWAYS STUDY FOR SOUTH AFRICA
39
39 Thermal coal use in local power, petrochemicals and industrial sectors eliminated; export demand is also eliminated by 2050, given that coal exports are driven by use in power production, which is likely to be fully decarbonised in all major economies by 2050 in an ambitious decarbonisation scenario.
Deep-dive: Approach and key assumptions for the assessment of decarbonisation pathways for mining Scope 1 and Scope 2 emissions
Overall approach to the development of the Scope 1 and Scope 2 decarbonisation pathways:
1. Identification of mitigation levers: Decarbonisation of electricity-use; fuel switching for ICEs; electrification of stationary machinery; electrification of process heat; Carbon Capture Utilisation and Storage/Methane Capture Utilisation Storage (CCUS/MCUS) not considered feasible to mitigate fugitive emissions, due to very low techno-economic feasibility in the South African geological context.
2. Development of production output projection across commodities until 2050. For coal, production decline assumed.39 For remaining commodities (PGMs, iron ore, gold and others), production assumed constant as a result of continuous investments in existing and new mining operations.
3. Estimation of 2019 mining energy consumption (electricity, diesel and coal consumption) by commodity, based on company reporting.
4. Development of energy consumption projection to 2050, based on production output projections. Projected energy consumption converted to emissions to develop an emissions baseline between 2020 and 2050, leveraging standard conversion factors.
5. Identification of key deployment concepts for the identified levers (e.g., considering different renewable energy-based electricity supply concepts and ZEV roll-out concepts). Deployment concepts are rolled-out in line with the timelines in Figure 19, which are informed by the expected techno-economic feasibility improvements across time of each lever. Calculation of technology requirements to produce workable systems for each concept, for the period 2020–2050 (Figure 20.
6. Calculation of annual CAPEX and OPEX requirements for each deployment concept, for the period between 2020 and 2050.
7. Calculation of annual emissions abatement for each lever deployment concept, by commodity, and assessment of abatement costs for each deployment concept.
Key assumptions
Development of production output projection � Coal: It is assumed that coal production declines 100%
by 2050. This is aligned to the projected decline in demand from the local power and petrochemicals sectors and import partners.
� PGM: Production may decline by ~40% by 2050, due to the projected phase-out of ICE vehicles. However, production is assumed to remain constant as a result of new demand from green tech applications (e.g., fuel cell technology, health care applications).
� Iron ore and gold: Production output assumed constant to 2050 as a result of continuous investments in existing and new mining operations.
� Other commodities: Production output of other commodities produced today (e.g., manganese, chrome, zinc) assumed constant as a result of continuous investments in existing and new mining operations. New, green tech commodities which are not mined today, or at only small-scale, are expected to only ramp-up in production by earliest ~2035.
Development of emissions from mining operations � Emissions profile from new mines: Assumed that
new mines that start operating beyond 2035, are carbon neutral.
Energy and process-efficiencyMining vehicle fuel and electricity-efficiency increases linearly by ~5% by 2030.
Power decarbonisation � Renewable energy (RE) supply: All renewable energy
supplied by solar PV, with an average load factor of 25%. � Average grid electricity tariff: ZAR1.00/kWh. � Carbon tax: No consideration of carbon tax in the cost
assessment.

45CHAPTER 4: DECARBONISING THE SOUTH AFRICAN MINING SECTOR
Figure 19: Considered decarbonisation strategies for the respective emission sources in mining
Trade-offs between different lever implementation timeline and
technology options must be analysed.
SCO
PE 1
SCO
PE 2
1a
1b
4
5
6
2
3
Switch to ZEVs in line with base case scenario HDV parc scenario
Switch to ZEVs in line with net-zero HDV parc scenario
Linear electrification of stationary machinery by 2030 (w/RE supply)
Linear electrification of heating processes by 2030 (w/RE supply)
Grid concept: Decarbonisation of electricity supply in line with power sector; all electricity supplied via grid
Hybrid concept: Portion of electricity supplied via self-generated RE by 2030; difference supplied by grid
Off-grid concept: Large portion of electricity supplied via self-generated RE by 2030; difference supplied using green H2 turbines
All commodities Gold and PGMs
Diesel/coalcombustion*
Electricityuse**
Key trade-offs
Faster phase-in means earlier elimination of
expensive diesel, whereas slower phase-in
means lower CAPEX (given learning rates)
but higher cumulative emissions
Effectiveness of electrification
in reducing cumulative
emissions dependent on
power supply decarbonisation
Low CAPEX
High cumulative emissions, load shedding, grid tariffs, carbon tax
Low cumulative emissions, no grid-related risks
High CAPEX, dependence on green H2 to meet intermittency
Low grid dependence, intermittency back-up, lower cumulative emissions
Moderate CAPEX, complexities of 'tapping into' grid
Source: NBI-BCG analysis.
Notes: * For mobility: RE and battery is modelled to provide full annual energy requirement, but not at constant hourly level (assume ‘refueling’ occurs during peak RE availability times). For stationary machinery and coal replacement for heating: RE and battery is modelled to provide full annual energy requirement, at a constant rate (constant hourly supply ensured using grid or piped green H2, depending on electricity supply concept).
** For concept 6: RE and battery is modelled to provide 60% of annual energy requirement, at a constant rate (constant hourly supply ensured using purchased green H2). For concept 5: RE and battery is modelled to provide 45% of full annual energy requirement (difference made up using grid electricity). For concept 4: Full annual energy requirement met by grid electricity (which decarbonises by 2050).
� Considered renewable energy deployment concepts (Figure 20):
� Grid connected: 100% of electricity consumption supplied via grid. Grid is assumed to reach 0 Mt CO2e/kWh emissions intensity by 2050.
� Hybrid: 45% of electricity consumption supplied via self-generated RE and battery by 2030 (linear ramp-up); grid provides 55% of consumption and manages intermittency. Electricity supply modelled hourly to ensure constant supply for all hours of the year (via solar energy, battery and grid electricity systems).
� Off-grid: 60% of electricity consumption supplied via self-generated RE and battery by 2030 (linear ramp-up); piped green H2 provides 40% of consumption and manages intermittency. Electricity supply modelled hourly to ensure constant supply for all hours of the year (via solar energy, battery and green H2 systems).

46 JUST TRANSITION AND CLIMATE PATHWAYS STUDY FOR SOUTH AFRICA
40 41
40 EIA Annual Energy Outlook – Reference Case (2020).41 NERSA 2019 recommended price.
Fuel switching in transport � Diesel price: Scales with US Energy Information
Administration (EIA) projections40 to 2050 (currently US$75/MWh).
� Renewable energy (RE) and green H2 production: All produced on-site.
� Base case scenario: By 2050: BEV parc reaches 42%; FCEV parc reaches 16%; diesel parc reaches 42% (linked to NBI-BCG transport sector decarbonisation analysis).
� Net-zero scenario: By 2050: BEV parc reaches 55%; FCEV parc reaches 45%; diesel parc reaches 0% (linked to NBI-BCG transport sector decarbonisation analysis).
Electrification of stationary machinery � Pace: Linear ramp-up in electrification of machinery
between 2025 and 2030, reaching 100% electrification of machinery in 2030.
� Diesel price: Scales with EIA projections to 2050 (currently US$75/MWh).
� Coal price: ZAR 350/tonne (20.5 GJ/tonne).41
� Electricity supply: Modelled hourly to ensure constant supply for all hours of the year (via solar energy, battery, green H2, or grid electricity systems depending on the renewable energy deployment concept).
Figure 20: Potential decarbonisation concepts for emissions linked to electricity and liquid fuel consumption in mining – technology requirements for lever implementation options highlight need for significant RE development.
Technology requirements for lever implementation options highlight
need for significant renewable energy development.
Diesel(16 TW/h)
Solar PV(12 GW)
Battery(5 GW)
Green H2
(0.4 M tonnes/a)Purchased
Grid(20 TWh/a)
Mine Mine
Solar PV
Grid(34 TWh/a)
Mine
Wind
Coal
Solar PV(32 GW)
Battery(14 GW)
Solar PV(1.1 GW)
Electrolyser(0.3 GW)
Battery(0.3 GW)
FCEV
BEV
Green H2
(17 k tonnes)
Solar PV(3.9 GW)
Electrolyser(1.7 GW)
Green H2
(105 k tonnes)
Battery(0.4 GW)
FCEV
BEV
0 1a Base case switch 1b Net-zero switch
Grid supply4 Hybrid supply5 6 Off-grid supply
2040 system view; Vehicle electrification: All archetypes meet ~16 TWh diesel-equivalent 2040 demand
2030 system view; Electricity supply decarbonisation: All archetypes meet ~34 TWh 2030 demand
2 3 Includes demand from electrified stationary machinery and heat production
Source: NBI-BCG analysis.
Notes: Average solar PV load factor of 25% assumed (based on hourly Rustenburg irradiation data); PEM electrolyser efficiency of 65% assumed; Electricity supply options modelled on an hourly basis to ensure systems are capable of providing constant hourly supply; Green H2 for mobility assumed to be produced on-site, whereas green H2 for electricity assumed to be piped from REDZ7.

47CHAPTER 4: DECARBONISING THE SOUTH AFRICAN MINING SECTOR
Addressing Scope 3 emissions of South Africa’s mining sector
Scope 3 emissions of South Africa’s mining sector are mainly driven by the consumption of thermal coal in electricity production and as a feedstock in industrial processes (mainly the production of synthetic fuels by Sasol) and iron ore in the production of steel. Scope 3 emissions linked to thermal coal usage will decline with declining production of thermal coal as a result of local decarbonisation (e.g., decarbonisation of South Africa’s power and petrochemicals sectors) and the global shift in value pools (e.g., current export markets with declining demand for South African coal). Demand for South African thermal coal is projected to be eliminated and ~80% of today’s estimated local Scope 3 emissions will be eliminated as a result of this.
42 Nature (2018).
On the other side, demand for green steel and therefore also iron ore, is expected to increase going forward. If the South African steel industry wants to remain competitive, it will need to move to net-zero compatible, green steel production processes. Enabling the production of green steel in South Africa will require an integration along the full value chain, from iron ore mining and H2 production, to the actual steelmaking processes (See Green Steel - decarbonisation of steel production). However, less than 10% of South Africa’s iron ore production is currently used locally, with most ore being exported to Asia. This means that South African iron ore producers will have to either stop selling ore to high emissions intensity smelters or will have to work with their global customers to achieve net-zero emissions targets. Furthermore, driving the development of a local green steel industry that could supply both local and export demand would allow iron ore producers to better manage their Scope 3 emissions.
Deep-dive: Green Steel – decarbonisation of steel production
Today, steel is produced either via integrated blast furnace (BF) and basic oxygen furnace (BOF) processes, or via electric arc furnace (EAF) processes fed by directly reduced iron (DRI) or scrap iron. These processes are currently highly carbon-intensive and account for ~8% of global annual CO2 emissions.42 Given the continued and growing demand for steel, it is critical to decarbonise steelmaking to enable a path towards net-zero. Several low and zero emission production processes are currently being explored, whereby only ‘zero-carbon steel’ – steel which is produced without any process emissions – represents green steel.
Decarbonising steel production via BF/BOF processes would require decarbonisation of heat generation (e.g., via replacing coal with biomass) and capturing process emissions via CCUS technology. However, the significant biomass demand and CCUS requirement could constrain the deployment of these measures.
Decarbonising steel production via EAF would require decarbonising the electricity used (e.g., via deployment of renewable energy), and on the feedstock side, the reduction of iron (e.g., via direct reduction of iron with green H2, or via reduction with natural gas coupled with CCUS). Alternatively, ferrous scrap is leveraged as feedstock into the EAF process. Green steel may potentially also be produced using a renewable energy powered electrowinning process, whereby iron ore is
placed in solution and undergoes electrolysis to produce iron metal. This iron is then fed into the EAF process (also using renewable energy) to produce steel. However, this process has not yet been tested as part of an integrated system.
Green steel via DRI, leveraging green H2, is currently the most advanced zero-carbon steelmaking process and presents an opportunity, given South Africa’s high-quality renewable energy sources and competitive advantage in production of low-cost green H2 (see report Decarbonising South Africa’s power system). Furthermore, a local green steel industry, enabled by locally produced green H2, would also form a new source of PGM demand in South Africa, which could partially compensate for the PGM demand loss linked to a declining ICE industry.
Enabling the green steel industry in South Africa will require cross-sectoral collaboration and mines will form an important part of this. In Sweden, a cross-sector joint venture, Hybrit, aims to produce DRI-green H2/EAF green steel by 2035. The Swedish government will provide funding to ensure availability of RE, allowing Vattenfall to produce the required green H2 supply. This, in turn, will allow mining company, LKAB, to produce high-quality iron ore pellets using the DRI process, enabling steelmaker, SSAB, to produce green steel using more efficient production methods.

48 JUST TRANSITION AND CLIMATE PATHWAYS STUDY FOR SOUTH AFRICA
Figure 21: Timing of deployment of decarbonisation levers
Timing and scale of lever deployment will depend on tech-economic feasibilities
and decarbonisation ambition.
Short-term (within 2 years)
Mid-term (before 2030)
Long-term (beyond 2030)
SCO
PE 1
FUEL
Drive operational excellence levers to improve process and energy-efficiency
Redesign sites to optimise vehicle
routings
Deploy hybrid vehicles and biofuels
Deploy electric trolleys for high fuel consumption routes
Switch to FCEV/BEV fleets and refueling infrastructure (FCEV vs BEV based on operational constraints)
Develop solar PV RE and green H2 production or delivery capability
Electrify stationary machinery
Replace coal for heating with RE electricity supply
FUG
ITIV
E EM
ISSI
ON
S Implement methane and CO2 capture and usage technology where feasible
Manage decommissioned coal mine spontaneous combustion emissions
SCO
PE 2
ELEC
TRIC
ITY Drive operational excellence levers to improve efficiency
Install self-generation RE to meet demand during peak load hours (solar PV)
Purchase RE where possible to replace grid supply for intermittency management in self-generation hybrid setups
SCO
PE 3
CLIE
NT/
CON
TRAC
TOR Set supplier emissions criteria; supply high-quality product to reduce
beneficiation emissions; supply green technology commodities and form joint venture projects to enable decarbonisation of downstream processes;
integrate value chains where possible
Source: Expert interviews; NBI-BCG analysis.
~0.45 Mt fugitive emissions remain in 2050 from gold and PGM production
Intermediate solution (reduces cumulative emissions) Net-zero solution (required for zero emissions)

49CHAPTER 4: DECARBONISING THE SOUTH AFRICAN MINING SECTOR
Potential decarbonisation pathways
Figure 21 summarises the outcomes required across the short-, medium- and long-term, for the mining sector in South Africa to successfully decarbonise and adapt to shifting commodity value pools.
3.2.5 ADAPTING SOUTH AFRICA’S MINING SECTOR TO CLIMATE CHANGE
Increasing temperatures, changing rainfall patterns and more frequent extreme weather events will impact mining operations in South Africa significantly and will require mining companies to develop adaptation pathways that account for risk thresholds along the value chain.
If no appropriate adaptation measures are taken, South African mining operations will be significantly impacted by local climate change (see ‘Deep-dive: The climate change risk in South Africa’ on page 50 ). The scale of impact varies across regions and mining operations. For example, underground mines are at risk of experiencing overheating due to generally increasing local temperatures and more frequently occurring extreme heat events. To further
enable underground activities, mining companies will need to invest in appropriate ventilation and cooling systems. Many mining activities are also water-intense. In an increasingly water-scarce country like South Africa, mining companies will need to find ways to reduce their water demand, improve overall water management and contribute to overall local water security. More frequent and intense weather-related hazards, such as floods and wildfires, will also pose physical risks to mining infrastructure and personnel, as well as critical external transport infrastructure, such as roads, ports and tailing dams.
Overall, South African mining companies will need to drive ongoing climate risk assessments to identify their specific vulnerabilities along the value chain and make the required investments that ensure that mining operations are climate-resilient. However, adaptation will not only be required within mining value chains. It is likely that social license to operate will also require mining companies to build the climate-resilience of their host communities. This will require more extensive climate monitoring and adaptation planning that accounts for local community risks, such as flooding and droughts.
Photo: Shutterstock.com

50 JUST TRANSITION AND CLIMATE PATHWAYS STUDY FOR SOUTH AFRICA
Deep-dive: The climate change risk in South Africa
Expected impact of climate change in South Africa
South Africa will be among the countries at greatest physical risk from climate change. South Africa is already a semi-arid country and a global average temperature increase of 1.5 °C above pre-industrial levels translates to an average 3 °C increase for Southern Africa, with the central interior and north-eastern periphery regions of South Africa likely to experience some of the highest
increases. Research shows that a regional average temperature increase of over 1.5 °C for South Africa translates to greater variability in rainfall patterns and a general drying of the region. Models show the central and western interiors of the country trending towards warmer and dryer conditions and the eastern coastal and escarpment regions of the country experiencing greater variability in rainfall, as well as an increased risk of extreme weather events.
Figure 22: Potential climatic change across climate zones in South Africa
Significant increase in hot desert zone and shift from warm to hot
temperature zones expected across both scenarios.
Koppen Geiger climate zones in South Africa (1961–1990)
RCP4.5 (eq.*) (2040–2060; 2 °C MIROC3.2-medres model)
2050 RCP8.5 (eq.**) (2040–2060; 3 °C MIROC3.2-medres model)
~48% increase*** in size of hot desert
~34% increase*** in size of hot, arid steppe
~25% increase in size of hot desert
~18% increase in size of hot, arid steppe
Cold and hot desert in the west
Cold steppe in the centre and south-west
Warm temperate replaced by hot temperate except in Lesotho. ~124% increase in size of tropical savannah (east coast) – relative to base period
Warm temperate partially replaced by hot temperate
Warm temperature regions in the east and south-east
TemperateDry winterWarm summer
AridDesertHot
AridDesertCold
AridSteppeHot
AridSteppeCold
TemperateDry and hot summer
TemperateDry winterWarm summer
TemperateDry winterHot summer
TemperateNo dry seasonHot summer
TemperateNo dry seasonWarm summer
Tropical Savannah
Temperature zones:
Source: Theoretical and Applied Climatology (2015); Agricultural Research Council and DAFF; NBI-BCG analysis.
Notes: * 2 °C mean global surface temperature increase. ** 3 °C mean global surface temperature increase. *** Relative to base period.

51CHAPTER 4: DECARBONISING THE SOUTH AFRICAN MINING SECTOR
43 44
43 [Former] Department of Environmental Affairs (DEA). 2017. South Africa’s Third National Communication under the United Nations Framework Convention on Climate Change.
44 University of the Witwatersrand, Global Change Institute (GCI). 2021. CMIP6 Ensemble Modelling.
Underlying climate scenarios that were considered for the impact analysis
The impact of climate change in South Africa was assessed for two climate scenarios (Representative Concentration Pathways – RCPs), upon which most currently existing climate change research in South Africa has been based:
� RCP 4.5: A moderate abatement scenario aligned with a 1.7–3.2 °C global mean surface temperature increase (relative to pre-industrial levels) by 2100 (~1.3 °C increase by 2050).
� RCP 8.5: A low abatement scenario aligned with a 3.2–5.4 °C global mean surface temperature increase (relative to pre-industrial levels) by 2100 (~2 °C increase by 2050).
Projected key trends across the considered scenarios
The local temperature and rainfall impact are likely to be similar across both considered scenarios before 2050, with both indicating strong temperature increases and drying of most parts of the region. Beyond 2050, the local climate change is expected to be much more significant in the high emissions (RCP 8.5) than the lower emissions (RCP 4.5) scenario.
Changing local temperature:43
� Mean temperature increases are virtually certain throughout South Africa by 2050, meaning there is a greater than 99% likelihood of occurrence.
� The highest temperature increases (~2 times the global mean surface temperature increase) will occur in the central and western interior of the country.
� Increasing frequency of very hot, heatwave and high fire danger days is virtually certain throughout the country, with greatest increases in the central and western interior of South Africa.
� Greater diurnal temperature range is likely throughout the country by 2050, meaning there is a greater than 66% likelihood of occurrence.
Changing local rainfall patterns:44
� Mean annual rainfall is likely to decline across most of South Africa by 2050.
� Greatest mean rainfall decline by 2050 is likely to occur in the northern and south-western interior regions of the country, while the south-east of the country, in and around Lesotho, may experience increased annual rainfall in the short-term (before 2030), but will also dry by 2050.
� Later onset and shorter duration of rainy seasons is likely across the country.
� Increased frequency of heavy rainfall and drought events is likely across most of South Africa.
Figure 22 highlights the potential climatic change impact across climate zones in South Africa. Increasing temperatures and shifting rainfall patterns will have a significant impact on some of South Africa’s most important climate zones.
By 2050, the hot desert region (currently restricted to the northern regions of the Northern Cape, North West and Limpopo) is projected to grow in size by ~25% in an RCP 4.5 scenario and by ~48% in an RCP 8.5 scenario, extending into agricultural regions of the Western Cape, Free State and deep into Limpopo. This would result in hot desert zones occupying 45–60% of the total land area in South Africa in an RCP 8.5 scenario by 2050.
South Africa’s most pristine grasslands, located within the warm temperature regions along the eastern escarpment, are to be almost entirely replaced with hot temperate and hot arid regions by 2050, with only parts of Lesotho retaining significant warm temperate zones – potentially resulting in the savannah biome intruding on regions currently occupied by grassland. The Western Cape’s unique fynbos regime is also likely to come under increasing pressure, with the intrusion of the hot steppe climate zone.

52 JUST TRANSITION AND CLIMATE PATHWAYS STUDY FOR SOUTH AFRICA
3.2.6 THE NEED TO ENSURE A JUST TRANSITION IN SOUTH AFRICA’S MINING SECTOR
A well-managed phase-out of coal will be critical given the pressing need to reduce the carbon-intensity of South Africa’s economy to maintain competitiveness. While developing a clear Just Transition plan to protect the livelihoods of coal miners and coal value chain workers is critical, this segment only represents ~20% of current employment and ~26% of current revenue in the mining sector, highlighting that significant opportunity will remain in the sector.
With ~460 000 direct and up to 1 million indirect jobs in adjacent value chains, the mining sector accounts for a significant share of total employment in South Africa today.45 Mining jobs offer relatively higher wages and broader compensation in terms of housing benefits, pensions and retirement and insurance compared to jobs in other sectors in South Africa. In coal mining, for example, the median wage is ZAR10 000 per month, relative to ZAR5 000 for other formal workers and under ZAR3 000 for farmworkers.
Factoring in that each mineworker supports on average five to ten dependents, the number of livelihoods supported by the mining sector is significant. For example, South Africa’s coal mining sector, with ~94 000 direct jobs, supports around 0.5 to 1 million livelihoods alone. However, the expected phase-out of coal and the potential decline in PGM demand resulting from climate action in South Africa and globally put many of those jobs – and the many dependent livelihoods linked to coal and PGM mining in particular – at risk. The vulnerability of South Africa’s miners extends to the mining communities. The private sector in these communities contributes significantly to service delivery, such as the construction of schools and clinics, the development and maintenance of road infrastructure and the provision of transportation services. This vulnerability is nationally relevant, but particularly acute in mining regions like Mpumalanga where ~80% of coal production is located.46
If South Africa decarbonises towards a net-zero economy, it will be critical to manage the socio-economic risks in the mining sector, particularly in regions like Mpumalanga, and ensure a Just Transition. A Just Transition for South Africa nationally and within the mining sector is anchored on the goals of decent work, social inclusion and the eradication
45 Quarterly Employment Survey (2019); Minerals Council Facts and Figures (2019); Oxford Economic Mining Sector Employment Multipliers for South Africa.46 TIPS. (2019). National Employment Vulnerability Assessment: Analysis of Potential Climate Change Related Impacts and Vulnerable Groups.47 ‘Sector Skills Plan for the Mining and Minerals Sector’, submitted by the Mining Qualifications Authority (MQA) to the Department of Higher Education and
Training (2019–2020).48 Schers, J., Burton, J., Bagilet, V. (2019). Managing the coal transition for workers in South Africa.
of poverty. Several dimensions need to be addressed in ensuring a Just Transition for South Africa’s mining sector and across sectors (Figure 23).
Transitioning the mining sector’s labour force will be complex, with very locally specific challenges. The transition needs to compensate for displaced jobs, but it should also unlock more high-quality jobs, especially with respect to wages and the permanence of jobs (Figure 24). Mining workers dependent on coal mining, who might see their jobs displaced, need to be redeployed. Therefore, there is a need to create new jobs in the mining sector, but also in adjacent sectors and in new green value chains. Reskilling, capacity-building and education will be key to this redeployment especially given the current skills and education levels in the mining sector in South Africa and the potential skills mismatch with future jobs. Approximately 50–70% of mining jobs are low-medium skill and the education levels in the mining sector are relatively low, with less than 20% of all employed having studied beyond Grade 12 and acquired a Higher Education Certificate.47 48 However, for those workers that cannot be reskilled and redeployed, a combination of early retirement programmes and social welfare mechanisms will be critical.
Action taken now will be critical to manage the risks, unlock the opportunities and ensure the longer-term success of South Africa’s Just Transition in mining. A well-planned, coordinated and collaborative approach will be required by all stakeholders across the mining value chain and across the private and public sector, to achieve a Just Transition in mining. At the asset or company level, a range of initiatives will be required to address the immediate, locally specific socio-economic challenges arising from mining site closures. These private sector initiatives include, but are not limited to:
� Skills mapping to develop a more granular skills inventory of the employees
� Reskilling programmes to bridge prevailing skills gaps between current and future operations
� Redeployment programmes to transition miners to new operations, with incentives and support programmes where geographic dislocation is required
� Early retirement programmes for miners who cannot be redeployed
� Rehabilitation and restoration programmes at closed mine sites.

53CHAPTER 4: DECARBONISING THE SOUTH AFRICAN MINING SECTOR
Figure 23: Vision, challenges, opportunities and building blocks for South Africa’s Just Transition
Unlocking South Africa’s vision of a Just Transition, at national and sectoral
levels, hinges on key building blocks.
Stakeholder collaboration and coordination is key to all building blocks
Job creationSocial and ecological welfare
Managing geographical and cultural dislocation
Education, capacitation and skilling
Economic inclusion and participation
Ownership Quality of work
Infrastructure planning and roll-out
Policy and governance
Funding
STAKEHOLDERS
BUILDING BLOCKS
CHALLENGES AND OPPORTUNITIES
VISION
For South Africa, the Just Transition is a shift towards environmentally-sustainable economies and societies for all. Such a transition needs to be well managed and contribute to the goals of decent work, social inclusion and the eradication of poverty for all South Africans.
ELECTRICITY MININGPETROCHEMICALS AND CHEMICALS
AGRICULTURE, FORESTRY AND
OTHER LAND USE
MANUFACTURING AND CONSTRUCTION
MINERALS AND METALSTRANSPORT
OTHER SECTORS OF TODAY AND THE
FUTURE
Source: NBI-BCG Project Team.

54 JUST TRANSITION AND CLIMATE PATHWAYS STUDY FOR SOUTH AFRICA
One of the most critical no-regret actions for the public sector is to develop a national strategic workforce plan, which takes into account the risks and opportunities a transition towards net-zero 2050 creates. As illustrated in Figure 25, this workforce planning needs to clearly map:
� Current skills supply and distribution among the workforce, including sector, age distribution, level of experience and location.
� Potential future skills demand reflecting asset closures, new assets, attrition rates and the impact of trends like mechanisation and automation.
� Skills mismatch and required training, upskilling, reskilling and education requirements.
These insights need to be used to design mid- to long-term transition programmes for South Africa looking at, for example, local content requirements, education, upskilling, reskilling and redeployment.
Figure 24: Highly granular, well-planned and coordinated approach required to address complex individual and localised challenge
AGE
GEO
GRA
PHY
WAG
E LE
VEL
SKIL
LS
TYPE
OF
WO
RK
AGE
GEO
GRA
PHY
WAG
E LE
VEL
SKIL
LS
TYPE
OF
WO
RK
100
90
80
70
60
50
40
30
20
10
0
PERM
ANEN
TPA
RT T
IME
TEM
PORA
RY
HIG
HLY
SK
ILLE
DSK
ILLE
DU
NSK
ILLE
D
HIG
H
INC
OM
EM
IDD
LEIN
CO
ME
LOW
/ M
INIM
UM
WAG
E
NEU
TRAL
/AG
NO
STIC
IN/N
EAR
AT-R
ISK
AREA
NEA
R RE
TIRE
MEN
TM
IDD
LE A
GED
NEW
LY-E
MPL
OYE
D/
YOU
TH
STARTING POINT:Labour force of today
2050:Future labour force
UN
EMPL
OYE
D
OU
TSID
E TH
E LA
BOU
R FO
RCE
PERM
ANEN
TPA
RT T
IME
TEM
PORA
RY
HIG
HLY
SK
ILLE
DSK
ILLE
DU
NSK
ILLE
D
HIG
H
INC
OM
EM
IDD
LEIN
CO
ME
LOW
/ M
INIM
UM
WAG
E
NEU
TRAL
/AG
NO
STIC
IN/N
EAR
AT-R
ISK
AREA
NEA
R RE
TIRE
MEN
TM
IDD
LE A
GED
NEW
LY-E
MPL
OYE
D/
YOU
TH
UN
-EM
PLO
YED
OU
TSID
E TH
E LA
BOU
R FO
RCEEMPLOYED EMPLOYED
KEY ENABLERS
Revision to technical and academic programmes
Relocation support programmesRelocation incentives
Redeployment Reskilling programmes
Income protection and social welfareEarly retirement
Navigating the transition, especially of the labour force, is complex and
will require a highly granular approach.
Source: NBI-BCG Project Team

55CHAPTER 4: DECARBONISING THE SOUTH AFRICAN MINING SECTOR
CASE STUDY 4: ANGLO AMERICAN DRIVING ECONOMIC DIVERSIFICATION IN ITS HOST REGIONS
Anglo American aims to support economic diversification in the regions in which they operate, as a means to mitigate socio-economic risk in regions where mining activities might decrease in the future. In this context, it drives the approach of Collaborative Regional Development (CRD), which aims to deliver systemic regional socio-economic change through partnership.
Key activities in this approach include:
� Establishing inclusive, collaborative, cross-sectoral platforms, initiatives and public-private partnerships built on a common vision
� Using spatial analysis of regional resources and value chains across a broad geographical scope to identify opportunities with the highest potential long-term impact
� Leveraging commercial and blended funding for financing value chain activities.
A core objective of this approach is to work with government to build identified opportunities into government development plans.
As an example, Anglo American has applied the CRD approach in Limpopo. The analysis showed that the province has the potential to support extensive area-based activities in diverse sectors, which will contribute to more resilient local economies and local social development.
Identified opportunities include, for example, tourism, agriculture, forestry, game ranching and agri-processing zones. The identified opportunities are translated into concrete pilot projects which are designed, managed and scaled-up in a collaborative, multi-stakeholder effort.
CASE STUDY 5: JUST TRANSITION IN MINING – GREECE
Context: Greece committed to net-zero by 2050. As part of this commitment, Greece plans to phase-out lignite coal by 2028, with major mining site shutdowns already by 2023. As a result, 23 000 workers will be affected and are at risk of losing their jobs. A Just Transition plan exists, focusing on the coal regions in Western Macedonia and Megapolis.
Governance: The government initiated a transition committee – which included national and regional government officials, labour representatives and the CEO of the national power producer – to monitor, coordinate and approve the transition plan. A steering committee oversaw the design of future perspectives and future skills assessments in affected regions. A working group drafted Greece’s transition masterplan, which focuses on the diversification of economies in the affected regions through investments in, for example, renewable energy installations, industry, SMEs, trade, agri-business, eco-tourism, high-tech and education (12 projects already announced). EUR5.5 bn has been earmarked for the transition. The funding is enabled via the EU Just Transition Fund, low-interest loans, commercial loans and private investment.
Action that was taken as part of the Just Transition planning in Greece included, for example:
Income security � Self-financed voluntary early retirement scheme
for affected workers.
Regional economic easing policies � Partially funded reskilling programmes for
affected workers � Relocation assistance to attract skilled labour,
e.g., housing subsidies, income tax impairment.
Diversification of local economies � Renewable energy and green industry
investments, e.g., solar PV parks, green H2 production and energy storage projects
� Tax, grants and subsidy incentives to attract new industries or transform existing ones.
Environmental and social sustainability � Lignite mine restoration projects � Local energy security projects � Investment in health care and solid waste service.

56 JUST TRANSITION AND CLIMATE PATHWAYS STUDY FOR SOUTH AFRICA
Figure 25: Overview of the national strategic workforce planning required
A national strategic workforce plan is a critical enabler for
South Africa's Just Transition.
Understand future demand for skills
Understand current skills supply
Design transition programmes
Identify skills gaps mismatch
Define talent segments and skills distribution within current workforce across key dimensions, for example:
� Sector � Age distribution � Level of experience � Location.
Build view of skills required in future workforce in consultation with key stakeholders in emerging sectors and advanced countries already ahead in the transition, etc.
Key considerations:
� Asset closure roadmaps � New or redefined
sectors � Assumed attrition rates � Mechanisation and
automation
Based on the skills mismatch (demand vs supply) identify upskilling or reskilling requirements as well new training requirements.
Design and roll out a suite of transition options, for example:
� Redefined local content requirements,
� Upskilling, � Reskilling, � Redeployment, � Early retirement, etc.
Source: NBI-BCG Project Team.
3.3 EMERGING PATHWAYS FOR SOUTH AFRICA’S MINING SECTOR
49 An industrial cluster bringing together various H2 applications in the country to form an integrated H2 ecosystem, increasing the valorisation of the country’s platinum reserves, and reducing its carbon footprint. The industrial corridor project will start in a PGMs mining area in Limpopo, including the Limpopo Province Science and Technology Park, and continue through the Johannesburg-to-Durban corridor.
Responding to the various climate change-related challenges the sector will increasingly be facing, requires South African mining companies and policy-makers to take concerted action across time horizons (Figure 26).
Addressing the shift in mining commodity value pools
To mitigate the socio-economic risk arising from a global shift in mining commodity value pools, it will be critical to ensure the ramp-up of exploration of commodities with growth potential, such as iron ore and other green tech commodities, by targeting a 4-5% share of global mining exploration spend within this decade. Assuming that economically viable deposits of those commodities are proven to exist in South Africa, existing mining operations would need to be ramped-up and where needed, new, climate-resilient and net-zero compatible mining operations would need to be established. If proven to exist, the earliest production of future high-in-demand commodities could be realised by 2035. Regardless
of exploration efforts, it will be critical to pursue the localisation of mining value chains in South Africa to make up for job and revenue losses in coal and PGMs. As mentioned, South Africa is well-positioned to achieve this, given that it possesses the most well-developed beneficiation and export infrastructure in Southern Africa, a strong local mining sector and abundant renewable energy resources that it can leverage. In addition, already today, South African mining companies should start to drive the market development of applications that require PGMs as a key input, to address the downside demand trend from a shift away from ICEs in the transport sector. Projects like the ‘Platinum Valley’49 driven by the DSI should be supported by the full range of stakeholders, including mining companies, OEMs, government and financial institutions, and used as a vehicle for coordinated market development and the creation of green jobs and source of export earnings. Finally, it will be critical to facilitate the appropriate closure and rehabilitation of coal mining sites as thermal coal demand declines over time.

57CHAPTER 4: DECARBONISING THE SOUTH AFRICAN MINING SECTOR
Figure 26: Decarbonisation and adaptation pathway timeline
Outcomes needed to achieve a net-zero transition of South Africa’s
mining sector.
2020–2030 2030–2040 2040–2050
Adapt to climate change
Implement location-specific climate monitoring services and assess risk thresholds along the entire value chain
Implement and drive operation-specific adaptation pathways that are tailored to operation-specific risk thresholds, timelines and value chains
Drive decarbonisation
Electrify stationary machinery and replace coal as heat source with electricity (ensuring lower carbon supply)
Upgrade mobility fleets to hybrid power trains and trolley assist systems to facilitate BEV and FCEV roll-out
Implement fleet conversion strategy and convert fleets to FCEVs and BEVs based on understanding of operation-specific requirements, risks and limitations
Procure RE energy and/or deploy large-scale RE supply on site; secure supply of required intermittency supplementation fuels/technologies (e.g., grid electricity or green H2 pipelines – depending on operational context and decarbonisation ambition)
Support technology transition in steel sector and ensure required supply of green tech commodities; provide incentives to decarbonise value chains
Enforce best practice in mining closures and ensure consistent monitoring of fugitive methane emissions and spontaneous combustion in gassy decommissioned coal mines
Respond to a shift in value pools
Ramp-up exploration for iron ore and green tech commodity deposits
Establish new net-zero mining operations for in-demand commodities (if deposits prove available and economically accessible)
Explore and launch new business opportunities (e.g., production of RE and green H2 using mining site solar resource); collaborate to decarbonise local value chains and produce green products with high export potential; develop markets for PGMs, and position South Africa as a regional hub for green technology commodity beneficiation
Ensure local players who acquire coal assets from large international companies are equipped to manage phase-out
Enable a Just Transition
Increase local manufacturing of components for solar PV and wind
Provide access to more affordable green funding, with mechanisms in place to hedge foreign exchange risks
Plan national Just Transition strategy and roadmap, with an immediate focus on displaced workers in the coal value chain
Source: NBI-BCG project team.

58 JUST TRANSITION AND CLIMATE PATHWAYS STUDY FOR SOUTH AFRICA
Decarbonising mining operations
Reaching zero emissions by 2050 will require timely implementation of levers to address Scope 1, 2 and 3 emissions along the value chain. With the lifting of the self-generation capacity limit to 100 MW by the DMRE, mining companies must pursue an ambitious roll-out and the acquisition of renewable energy before 2030, in line with the recommended hybrid power supply model. This will be crucial to enable accelerated Scope 1 and 2 emission reduction, realise cost savings versus the grid, and ensure a more stable energy supply to the sector. Mining companies must also seek clarity on how hybrid grid and self-generation systems will be structured, including the cost of renewable energy transmission on the national grid. Furthermore, strengthening the national power transmission grid to accommodate renewable energy generation from high resource density areas will be critical to grow the energy option space for mining companies.
Regarding Scope 1 emissions, mining companies must continue to drive operational excellence levers to increase energy savings, for example by redesigning sites to optimise vehicle routings. It will also be key to ensure a transition to electric hybrid and trolley-assisted vehicles within the next two years, not just to reduce cumulative emissions, but also to facilitate easier conversion of large vehicles to either FCEVs or BEVs in the mid-term. Full conversion to FCEVs and BEVs should be pursued before 2035, given both the emissions and cost savings versus the diesel alternative. Selection of BEV versus FCEV will depend on the site-specific context, however, the roll-out of FCEVs will be dependent on companies’ ability to either self-produce green H2 or purchase it from third-party suppliers. Producing a sufficient amount of green electricity and H2 to enable the decarbonisation of mining fleets will further require ~5 GW of dedicated renewable energy supply by 2040.
Electrification of stationary machinery should be pursued before 2030, given the relative ease of implementation from a techno-economic perspective. However, companies must ensure sufficient renewable energy capacity is in place to power converted machinery or forego most of the emissions abatement potential of the conversion.
Fugitive emissions abatement will largely depend on responsible decommissioning and management of decommissioned coal mines. This will require clear
regulation and support from the government to ensure that local miners who inherit coal assets from exiting international players are able to manage the decommissioning process appropriately.
Scope 3 emission reduction should become an increasing priority, particularly in iron ore mining. Within the short-term, companies can begin ensuring the supply of higher-quality ores to reduce processing requirements and setting supplier and user emissions criteria. Mining companies should investigate collaborative opportunities along the value chain to ensure the roll-out of, for example, green steel production methods. This may be in the form of the production of green H2 or simply through joint funding of green technology and process roll-out. This too will require a significant roll-out of renewable energy, dedicated to green H2 production and clean electricity supply for downstream processing of mined commodities.
Driving adaptation to climate change
Within this decade, climate monitoring systems need to be put in place and mining companies should drive climate vulnerability assessments across their value chain. This will form the basis of short-term and long-term resilience planning in mining. In the mid- to long-term, adaptation measures will need to be rolled out and climate risks assessed and addressed on a continuous basis, whereby the degree of adaptation action needed will vary across timelines, regions and types of mines.
Enabling a Just Transition in mining
The public sector will play a key role in the mining sector’s Just Transition. A national strategic workforce plan will need to be developed within the next five years. This will enable the development of a national skills inventory and the identification of critical skills gaps. The public sector and mining companies will also need to collaborate on service delivery in mining areas to bridge any prevailing gaps following expected future asset closures and on reskilling and redeployment programmes for displaced workers.

59CHAPTER 4: DECARBONISING THE SOUTH AFRICAN MINING SECTOR
3.4 HOW TO ENABLE THE NET-ZERO TRANSITION FOR SOUTH AFRICA’S MINING SECTOR
50 Boston Consulting Group. 2021. CMI Model: Commodity production forecasts for South Africa
3.4.1 KEY ENABLERS FOR DECARBONISING SOUTH AFRICA’S MINING SECTOR
Enabling the development of a climate-resilient, competitive mining sector requires public-private sector coordination along a common commodity exploration, production and beneficiation strategy, a conducive policy environment, cheap finance and access to reliable, affordable, clean power supply.
Enabling the mining sector to respond adequately to the various challenges it is facing, requires the availability of the required technology, conducive policy frameworks and cheap finance.
Ensuring decarbonised electricity supply
Decarbonising mining operations and enabling value chain localisation requires decarbonised, cost-efficient power supplies. In this regard, miners should be supported in the development of self-generation renewable energy projects and accelerated decarbonisation of the national power grid pursued, as per the findings of the NBI-BCG Just Transition and Climate Pathways Study for South Africa: Decarbonising South Africa’s power system.
Partnerships to drive technological and market development
Technology, which is critical for achieving full decarbonisation of the mining sector, is partially still very immature and costly, without sufficient incentives to warrant accelerated (pre-2030) decarbonisation. For example, significant technological development and cost improvements are still needed to enable BEV and FCEV deployment in mining. In South Africa, there is currently little engagement between OEMs and mining companies around the development of ZEV pilot projects. As a result, ZEV strategies of South African mining companies are still largely in their very early stages or do not exist at all. Going forward, it will be important that OEMs and mining companies partner to drive the technological development around ZEV solutions in mining. The scope of existing ecosystem-level initiatives to make mining mobility safer and healthier may be expanded to include electrification of mining mobility fleets. Furthermore, mining companies should also partner along the value chain for further development and research related to green steel production processes and
green tech applications that will drive future demand for PGMs. Projects such as the Mandela Mining Precinct, a collaboration between the former Department of Higher Education, Science and Innovation (DHESI), the Minerals Council and the CSIR, highlight the potential of public and private sector collaboration to rejuvenate mining research and innovation in South Africa and provide vehicles for greater collaboration between miners, academia and OEMs. Currently, the project focuses on innovation in mining extraction methods, however, innovation in green technology roll-out is becoming increasingly important. Increasingly, the sustainability of production will become a source of competitive advantage.
Enabling financing of adaptation and mitigation measures
Implementing mitigation and adaptation measures requires large investments. The high upfront cost of vehicle switching and the high capital investment required to develop significant renewable energy and battery capacity (despite the longer-term cost-saving) often do not align with the short-term investor payback terms and commodity price volatility that is often inherent to the mining sector. These factors and the life-of-mine consideration often push miners to sacrifice the long-term cost and emissions savings of renewable energy deployment for low CAPEX requirements in the short-term. This means that access to cheap finance and financial support will be key to incentivise larger players to invest and enable junior miners to access renewables – provided that the necessary support is in place. Approximately 75% of current iron ore and ~25% of current PGMs and gold operations in South Africa have less than 15 years’ worth of endowment remaining.50 In these cases, mines should still be encouraged to decarbonise their power supplies. However, this will require greater alignment between Power Purchase Agreements (PPA) terms (generally 20–30 years) and life-of-mine.
Enabling policy environment
More broadly, the mining sector in South Africa has maintained that a clearer and more predictable policy and regulatory environment is required to attract investment in increased exploration and decarbonisation. Policies and policy initiatives that should be aligned with international best practices to enable sector decarbonisation include, the regulation of carbon offset initiatives; the Carbon Tax Act of 2019 (to incentivise switches to green beneficiation

60 JUST TRANSITION AND CLIMATE PATHWAYS STUDY FOR SOUTH AFRICA
process, such as green steel production); the National Environmental Management: Air Quality Act of 2004; the draft Climate Change Bill (2018); and the Mining Charter III.
3.4.2 RECOMMENDED NO-REGRET ACTIONS
If the existing structural issues are overcome, an enabling policy environment developed and a clear path towards decarbonised operations, and production of clean commodities and technologies exists, South Africa’s mining sector could become a prime destination for global long-term investments in mining and contribute to a Just Transition in South Africa.
To kick off the mining sectors’ transformation towards a sector that is resilient and competitive for a future marked by climate change and ambitious climate mitigation efforts, action needs to be taken now. No regret-actions that the private and public sector should jointly pursue within this decade, include:
1. Accelerate the exploration of green tech commodities in the country, through better management of exploration licensing to reduce the number of dormant licenses and simplification of ownership structure requirements to attract venture capital.
2. Develop partnerships across the value chain and public and private sector, for market and technology development, in particular related to green steel and ZEV technologies for mining. This should include the development of concrete pilot projects.
3. Ensure that conducive policy, financing and technology are put in place to unlock renewable energy supply for mines. This includes for example:
� National Energy Regulator of South Africa (NERSA) releasing an updated registration procedure for larger-scale (up to 100 MW) renewable energy generation facilities.
� The development of a wheeling framework and clarification of charges that Eskom will apply for hybrid self-generation systems where dedicated renewable energy is wheeled through the grid, or grid electricity is drawn only during times when embedded renewable energy and battery supply is insufficient. Currently, bilateral engagements are required and NERSA is in the process of developing a national framework for use-of-system charges.
� The strengthening of the national power transmission grid to accommodate renewable energy generation from remote, high renewable energy-resource areas.
4. Establish refined monitoring and reporting standards related to Scope 3 emissions in active and also in closed coal mines.
5. Deploy climate monitoring infrastructure and kick-off continued climate risk assessment.
6. Unlock access to finance at sub-8% cost of capital to achieve the decarbonisation savings outlined in this report.
7. Develop an integrated, national Just Transition plan.
Furthermore, it will be critical to immediately address the existing structural challenges in the sector. Issues like incomplete and conflicting policy and unreliable, carbon-intense and increasingly costly electricity supply, will hold mining players back from investing in mining operations and localised value chains in South Africa for the long-term. Given that the global ‘future of mining’ will need to be compatible with global decarbonisation efforts, whereby cheap and abundant renewable energy will be a critical enabler for decarbonised operations, South Africa could become a prime destination for investments in mining – given its unique renewable energy endowment. However, these structural issues must be overcome, future high-in-demand commodities must prove to exist, and the country’s abundant renewable energy resources need to be unlocked efficiently and effectively.

61CHAPTER 4: DECARBONISING THE SOUTH AFRICAN MINING SECTOR
CASE STUDY 6: HOW PUBLIC-PRIVATE COORDINATION AND COLLABORATION ENABLES DECARBONISATION OF THE LOCAL MINING SECTOR
Australia’s mining sector is increasingly driving decarbonisation measures across its operations and value chain. This is enabled via close public-private collaboration and coordination across dimensions.
Setting clear targets for key technologies and products
� The Australian government released a ‘Low Emissions Technology Statement’ outlining five priority technology and economic stretch goals required to make green technologies cost competitive:
� Producing low emissions H2 at less than A$2/kg � Dispatching long duration energy storage at less
than A$100/MWh � Producing low emissions steel production at
under A$900/t and low emissions aluminium at under A$2 700/t
� CCUS and CO2 compression, hub transport and storage at less than A$20/t CO2.
� To achieve these goals, the Australian government has developed partnerships with potential off-takers of green product demand – Germany, Singapore and Japan – to accelerate the development of lower-cost green technologies.
Developing bespoke funding vehicles for each component of the transition
� The federal government in Australia is contributing to private sector investment in green projects, aligned with national goals, through the Australian Renewable Energy Agency (ARENA):
� A$11.3 million in funding was contributed to a A$28.2 million trial by aluminium producer, Alcoa Australia, to investigate using renewable energy to process bauxite into alumina.
� A$0.58 million in funding was contributed to Rio Tinto’s A$1.2 million feasibility study on H2 as a replacement for natural gas in alumina refineries.
� A$2 million in funding was contributed to the resources sector to accelerate the development and deployment of low emissions technology, with ClimateWorks Australia assisting in the next phase of the Australian Industry Energy Transitions Initiative (ETI). The ETI will focus on the iron ore and steel, alumina and aluminium and lithium, copper and nickel industries. It includes several mining and metals players, including Rio Tinto, BHP, Woodside, Fortescue and Wesfarmers.
Supporting collaboration along mining value chains
� At a mining site level, the rapid proliferation of renewable energy projects, enabled by supportive renewable energy development legislation, is allowing large players to acquire significant renewable energy supply via PPAs:
� BHP has signed PPAs to meet 50% of its electricity needs across its Queensland coal mines and its largest Western Australian refinery with renewable energy.
� Gold players, including Goldfields and Newcrest Mining, are investing in off-grid, renewable energy microgrid systems to meet significant portions of the mines’ electricity demand.
� Newmont Mining Corporation is investing US$500 million in green initiatives.
� AngloGold Ashanti is piloting the roll-out of six BEV haul trucks to replace part of its diesel haul fleet at its Tropicana operation.
� Ambitious players have developed dedicated green energy arms of their business to drive accelerated decarbonisation along the value chain. For example, iron ore producer, Fortescue Metals has established Fortescue Future Industries (FFI) to invest in renewable energy and green H2 projects in Australia and globally. FFI are already trialling a renewable energy powered ship, locomotives and haul trucks and are exploring green steel production methods.

62 JUST TRANSITION AND CLIMATE PATHWAYS STUDY FOR SOUTH AFRICA
4. OUTLOOK
As was stated in the foreword of this report, South African business commits unequivocally to supporting South Africa’s commitment to find ways to transition to a net-zero emission economy by 2050. Furthermore, business would support an enhanced level of ambition in the NDC that would see the country committing to a range of 420–350 Mt CO2e by 2030. However, this enhanced ambition would have to be conditional on the provision of the requisite means of support by the international community. In this light, the business community will play its part to work with international and local partners to develop a portfolio of fundable adaptation and mitigation projects that would build resilience and achieve deep decarbonisation.
A managed Just Transition is important, and such a transition is impossible without a broad multi-stakeholder effort. National Government, through the Presidential Climate Commission and the National Planning Commission and supported by key government ministries, are leading this effort.
In support of this national programme, the NBI membership together with BCG and BUSA are running a multi-year project to understand net-zero decarbonisation pathways, sector by sector. This will provide a solid input into national and local dialogues, as well as identify critical investment areas. Furthermore, this level of detail enables policy frameworks and engagement with providers of international support to maximise the potential to leverage concessional finance and trade support to attract local public and private finance.
This work is ongoing and is intended as a basis for further consultation and a foundation for future work. The work on each sector will be released in stages as it is completed and will form a basis on which others can build. Ultimately a final body of work of the combined sector content will be made up of reports on:
� An introduction to the project and to a managed Just Transition, including analysis from our economic modelling
� Electricity � Petrochemicals and chemicals � The role of gas � The role of green H2
� Mining � Transport � Agriculture, Forestry and Other Land Use � Construction � Heavy industry � A concluding chapter highlighting key investment
opportunities and no-regret decisions.
Each of these reports will be published via our Just Transitions Web Hub (http://jthub.nbi.org.za). Please monitor this website for the latest report versions, supporting data and presentation material, as well as news of other Just Transition initiatives and a wide range of current opinion and podcasts on a Just Transition for South Africa.
We invite you to engage with us and to provide comment and critique of any of our publications via [email protected].
63CHAPTER 4: DECARBONISING THE SOUTH AFRICAN MINING SECTOR
Photo: Shutterstock.com

5th Floor, 61 Katherine Street, Dennehof, 2196
PO Box 294, Auckland Park, Johannesburg 2006, South Africa
0861 123 624 (0861 123 NBI)
www.nbi.org.za
Reg. No. 1995/003141/08 Association Incorporated under Section 21 I Vat Number: 4070158433
Image: Shutterstock.com