december, 2003 issue no: 4 education core...
TRANSCRIPT

December, 2003 Issue No: 4
UF/IFAS Nutrient Management Education Core Group
Soil & Water Science University of Florida
PO Box 110290 Gainesville, FL 32608
PHONE:
(352) 392-1951
FAX: (352) 392-3902
Editors: Rao Mylavarapu
Susan Curry
E-MAIL: [email protected] [email protected]
Nutrient Management Education Core Group Background
Federal, state and regional agencies are working towards formulating regulations for agricultural operations to reduce nonpoint nutrient source pollution for water quality protection. Several of our IFAS faculty are currently involved with these agencies for developing Interim BMPs for various commodities. In all cases these efforts are interdisciplinary requiring frequent interaction among the UF/IFAS faculty statewide. Several of us feel the need for a stronger coordination among IFAS faculty in responding to these needs. The creation and successful functioning of the proposed Nutrient Management Core Group will enhance the credibility of UF/IFAS faculty and educational resources and create a nodal point for liaison with all the agencies and public that are interested in the issue. Several land grant institutions have formed similar core groups or self-directed teams and have developed educational material. We will interact with these institutions to benefit from their expertise and experience. In February of 2001, this group coordinated the FDEP319 Prioritization meeting in Gainesville. This meeting was attended by state agencies and water management districts, growers, many commodity organizations and IFAS faculty and administration. All comments from this meeting were compiled in an electronic newsletter and distributed to all participants throughout the state.
Program Objectives
Our research program focuses on developing management practices to improve nutrient use efficiency, plant nutrition and water quality; nutrient cycling in calcareous soils; and determining impacts of agriculture on south Florida’s natural ecosystems. The unique soils, climatic extremes, and diverse commercial crops have posed great challenges to our program.
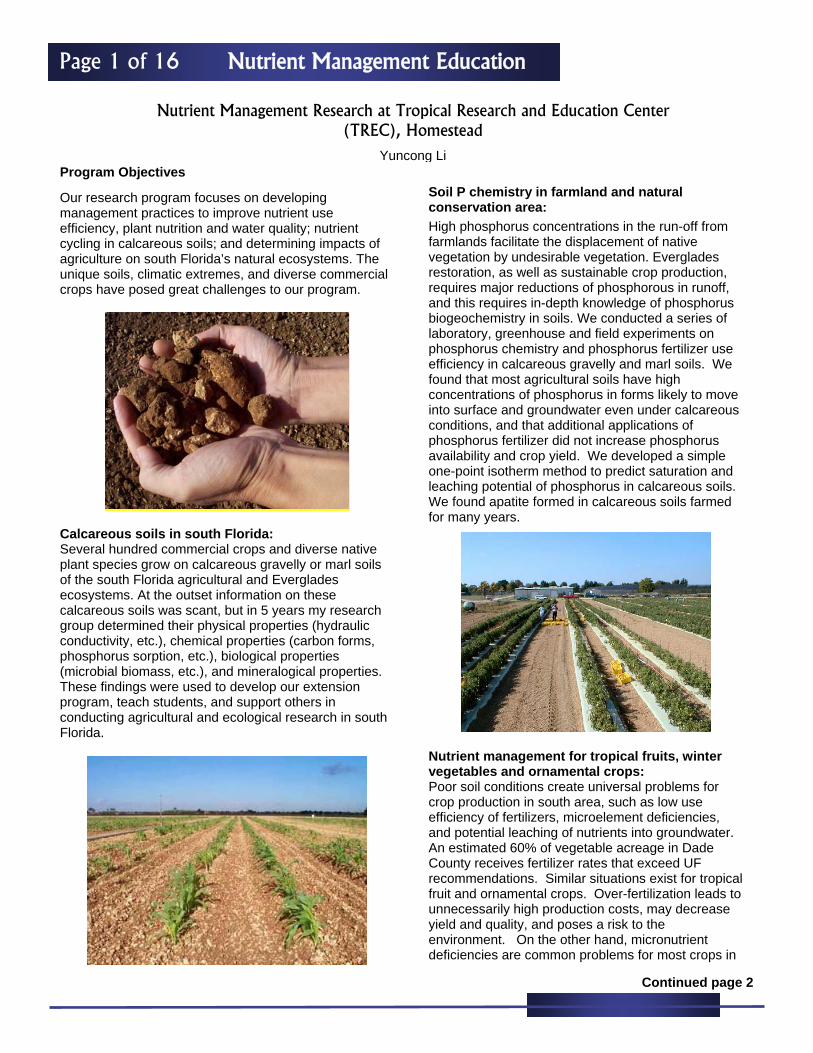
Calcareous soils in south Florida: Several hundred commercial crops and diverse native plant species grow on calcareous gravelly or marl soils of the south Florida agricultural and Everglades ecosystems. At the outset information on these calcareous soils was scant, but in 5 years my research group determined their physical properties (hydraulic conductivity, etc.), chemical properties (carbon forms, phosphorus sorption, etc.), biological properties (microbial biomass, etc.), and mineralogical properties. These findings were used to develop our extension program, teach students, and support others in conducting agricultural and ecological research in south Florida.
Continued page 2
Nutrient Management Education Page 1 of 16
Nutrient Management Research at Tropical Research and Education Center (TREC), Homestead
Yuncong Li
Soil P chemistry in farmland and natural conservation area: High phosphorus concentrations in the run-off from farmlands facilitate the displacement of native vegetation by undesirable vegetation. Everglades restoration, as well as sustainable crop production, requires major reductions of phosphorous in runoff, and this requires in-depth knowledge of phosphorus biogeochemistry in soils. We conducted a series of laboratory, greenhouse and field experiments on phosphorus chemistry and phosphorus fertilizer use efficiency in calcareous gravelly and marl soils. We found that most agricultural soils have high concentrations of phosphorus in forms likely to move into surface and groundwater even under calcareous conditions, and that additional applications of phosphorus fertilizer did not increase phosphorus availability and crop yield. We developed a simple one-point isotherm method to predict saturation and leaching potential of phosphorus in calcareous soils. We found apatite formed in calcareous soils farmed for many years.
Nutrient management for tropical fruits, winter vegetables and ornamental crops: Poor soil conditions create universal problems for crop production in south area, such as low use efficiency of fertilizers, microelement deficiencies, and potential leaching of nutrients into groundwater. An estimated 60% of vegetable acreage in Dade County receives fertilizer rates that exceed UF recommendations. Similar situations exist for tropical fruit and ornamental crops. Over-fertilization leads to unnecessarily high production costs, may decrease yield and quality, and poses a risk to the environment. On the other hand, micronutrient deficiencies are common problems for most crops in

Nutrient Management Education Page 2 of 16 NM Research at TREC Continued
the area due to high soil pH, inadequate fertilizer applications or use of improper fertilizer formulas. Moreover, excessive rates of phosphorus may induce iron chlorosis or other micronutrient deficiencies of crops grown on rocky soils.
Cover crops: Cover crops are an integral part of vegetable production practices in south Florida. We introduced a legume cover crop, sunn hemp (Crotalaria juncea L.), which produces up to 12,000 kg dry matter and fixes up to 300 kg nitrogen per ha. We evaluated mineralization rates of cover crops and effects of cover crop residues on soil organic carbon, soil microbial biomass, soil enzyme activity, and water holding capacity. We showed that tomato planted into sunn hemp plots produced more marketable and extra large fruit. Our findings provide fundamental information on enhancing the sustainability of agriculture through use of sunn hemp and other cover crops.
Soil amendments: Several projects are conducting to evaluate the effects of soil amendments (compost, biosolids, fly ash, zeolite) on crop production, soil fertility and water quality. We developed a method to quantify organic carbon in organic waste amended calcareous soils that overcomes interference of carbonate in calcareous soils. We modified fractionation methods for organic carbon and metals, to be better suited for calcareous soils. We also developed management practices to utilize biosolids or composts, which significantly increased soil organic carbon, increased soil nutrient availability and increased crop yields, but avoided trace metal accumulation in soils and nutrient leaching into groundwater. Our studies also indicated that incorporation of coal ash into biosolids and yard waste composts significantly improves their quality. Such use may be made of the 80 million tons of coal ash from power plants national wide, together with the 3 million tons of yard waste produced annually in Florida alone.

Topics presented Program location
Date program offered
Program leaders
Oral presentations
Hands-on field demonstrations
North Florida Research and Education Center-Suwannee Valley, Live Oak
11/13/01
Bob Hochmuth and Eric Simonne
Principles of nutrient management Uses of Cardy meters Drip system maintenance Troubleshooting common mistakes in irrigation design
Visualization of soil water movements with dye Delivery of chemicals through drip systems Drip system components
Miami-Dade county, Homestead
8/12/02
Teresa Olczyk and Eric Simonne
Scheduling drip irrigation Uses of Cardy meters Soil moisture measurement Drip system design and maintenance Troubleshooting common mistakes in irrigation design New farm bill
Visualization of soil water movements with dye Mobile irrigation lab Delivery of chemicals through drip systems Drip system components Soil moisture measurement
Gulf Coast Research and Education Center - Dover
11/13/02
John Duval and Eric Simonne
Irrigation scheduling Fertilizer management Regulatory update
Visualization of soil water movements with dye Soil moisture measurement
North Florida Research and Education Center-Suwannee Valley, Live Oak
12/04/02
Bob Hochmuth and Eric Simonne
Role of the Suwannee River Partnership Drip irrigation in the BMP era Drip tape selection System maintenance Fumigation with drip irrigation
Visualization of soil water movements with dye Soil moisture sensors Developing a fertilization program
Indian River Research and Education Center, Ft. Pierce
3/13/03
Elizabeth Lamb, Eric Simonne, and Ed Skvarch
System design and maintenance Fertilizer management Cost share programs Grower=s experiences with drip Water quality conservation System troubleshooting
Visualization of soil water movements with dye Chemical updates Cardy meters System components
FACTS X, Lakeland
4/30/03
Eric Simonne
Fertilizer management in the BMP era Fumigation via drip irrigation Drip system automation System maintenance
N/A
Miami-Dade county, Homestead
8/21/03
Teresa Olczyk and Eric Simonne
Water conservation survey result BMP program Flood damage Mobile irrigation lab System maintenance System components Common mistakes in irrigation design EQIP program System automation
Visualization of soil water movements with dye Deliveries of chemicals
North Florida Research and Education Center-Suwannee Valley, Live Oak
12/03/03
Bob Hochmuth and Eric Simonne
Field testing of possible BMPS for watermelon Pannel discussion: drip irrigation and BMPs Remote control for drip systems
Visualization of soil water movements with dye Building a BMP plan Maintenance and chlorination
Nutrient Management Education Learning to better manage: The Florida drip irrigation school
Eric Simonne, Horticultural Sciences, Gainesville
The Florida Drip Irrigation School (FDIS) is a one-day educational program that focuses on drip irrigation maintenance and management for commercial vegetable growers. In the past, many educational efforts have sought to teach growers about fertilizer management, irrigation management, and soil fumigation separately. With the development of best management practices (BMPs) and promising methyl-bromide alternatives that may be injected through the drip system, the drip system is now the interface of fertilization, irrigation and fumigation practices. Hence, an integrated approach to teaching drip irrigation management is needed. The FDIS goal is to offer practical, up-to-date management information on all aspects of drip irrigation.
Since its inception in 2001, the FDIS has been offered throughout Florida at County Extension Offices and IFAS Research and Education Centers. FDIS has brought together Extension personnel, members of the ag supply industry, state agencies, and producers. Research and regulatory updates are taught through combinations of classroom lectures and hands-on demonstrations in the field (Table 1). While most popular topics include fertilizer management, irrigation management, system maintenance, and visualization of water movement, each program is tailored to address the specific needs of the vegetable growers of the area.
Continued page 4
Table 1. Location, date, program leaders and educational content of the Florida Drip Irrigation Schools (2001-2003)
Page 3 of 16

Instructors
Location
Date
IFAS-County
IFAS
Specialist
State
agencies
Industry
representative
Attendance
Knowledge gainz
NFREC-SV
11/13/01
1
3
0
3
52
+17%
Miami-Dade county
8/12/02
1
4
2
3
78
+20%
GREC-Dover
11/13/02
0
3
1
3
32
+20%
NFREC-SV
12/04/02
1
4
0
2
65
n/a
IRREC
3/13/03
1
4
1
10
35
+22%
FACTS X, Lakeland
4/30/03
1
3
1
1
23
n/a
Miami-Dade county
8/21/03
1
3
1
5
75
+26%
NFREC-SV
12/03/03
1
3
2
3
35
n/a
Nutrient Management Education
Page 4 of 16
Learning to Better Manage Continued Instructors= background, experience and teaching styles are also diverse (Table 2). Attendance has been high and ranged from 23 to 78 (55 average) for the eight FDIS programs offered between 2001 and 2003. FDIS attendees are provided with supporting educational materials (EDIS publication, brochures, and copies of PowerPoint presentations). Proceedings of the FDIS were published in 2002 by Citrus & Vegetable Magazine and are available on-line at http://www.citrusandvegetable.com/home/2002_OctIrrigation.html. Electronic copies of Power Point Presentations are available to IFAS personnel only at a password-protected section of the North Florida Research and Education Center-Suwannee Valley web site accessible at http://nfrec-sv.ifas.ufl.edu. Together with CEU and CCA credits, FDIS participants receive a certificate of program completion. Knowledge increase for each participant
is measured by comparing participants= score increase in identical pre-training and post training tests. At the beginning of the day, participants are asked to answer anonymously and in writing a set of 10 to 20 questions that cover key topics of the program (pre-training test). Questions are usually provided by the instructors themselves. Participants are asked to answer the same questions again after the training. Based on these test results, knowledge gain ranged between +17% and +26% and averaged +21% (Table 2). Overall program ratings at the end of the day showed consistently that a large majority (95%) of the participants rated the FDIS as >excellent= or >very good=.
On-coming FDIS programs are regularly posted on the calendar of events of the >Vegetarian= news letter (http://www.hos.ufl.edu/vegetarian/vegetarian.htm) and the NFREC-SV web site.
Table 2. Instructors= background, attendance and knowledge gain of the Florida Drip Irrigation School (2001-2003)
z Based on pre-training and post-training test scores

Impact of P Fertilizer, Lime, and Gypsum Application on Stargrass Yield and Quality, and Water Quality
Martin B. Adjei, Jack E. Rechcigl, & Isabella S. Alcordo
Nutrient Management Education Page 5 of 16
Phosphorus (P) is the primary cause of eutrophication or algae blooms of fresh water bodies or lakes in south central Florida. Excessive P fertilization on pastures may contribute to the problem (Sumner et al. 1989). This is supported by work conducted by Dr. Jack Rechcigl and his team (Rechcigl et al., 1990; Rechcigl and Bottcher, 1995), which was funded by the South Florida Water Management District. That study also showed that P fertilizer rates on bahiagrass could be drastically reduced without any adverse effect on bahiagrass forage yield and quality. In addition, P levels in surface water runoff were reduced by 33 to 60% as P fertilizer rates were decreased from 48 to 12 kg P ha-1. Those studies led the Institute of Food and Agricultural Sciences (IFAS) of the University of Florida to adopt a zero P recommendation in 1998 for bahiagrass pastures grown in Florida south of Orlando.
The recommended P rate for other improved pasture grasses such as stargrass (Cynodon species) still ranged from zero P to 40 kg P ha-1 for high and low P soils, respectively (Kidder et al., 1998). However, as demonstrated by Rechcigl and Bottcher (1995), fertilization of pastures even at the optimum P recommended rates could cause significant elevation of P levels in surface water runoff. Hence, in addition to establishing optimum rates of P fertilization for improved pasture grasses, it became necessary to evaluate the capacity of soil amendments for tying up fertilizer-derived P.
Field studies were conducted from 1999 to 2002 at the Williamson Cattle Company in Okeechobee to: 1) re-evaluate the existing IFAS recommended P fertilizer rates for stargrass production and 2) study the effectiveness of limestone and gypsum for improving the retention capacity of soils for applied P on stargrass pastures.
The experiment was conducted on a stargrass beef pasture that was grazed rotationally at Williamson Cattle Company in the Lake Okeechobee Basin. Treatments were 0, 12.5, 25.0, 50.0 kg P ha-1 from triple super phosphate applied to 50 x 100 ft plots in the stargrass pasture every year. The amendments consisted of calcium carbonate and mined gypsum applied based on 100% CaCO3 at 0, 2, and 4 Mg ha-1 every year only to plots that received 50 kg P ha-1.
Each treatment was replicated four times in a randomized complete block design. All plots, including the control, received one application of 80 lb K2O/A as KCl and two equal applications of 90 kg N ha-1 as ammonium nitrate, yearly. Forage was sampled for dry matter yield, crude protein (CP) content, in vitro organic matter digestibility (IVOMD) and tissue mineral content once every 30-35 days. Forage was harvested seven times in 1999 and six times each in 2000 and 2001. Soil was sampled before the beginning of the experiment in March and in August 1999, March 2000, October 2000, and March 2001 from the surface down to the spodic layer at 15-cm depth interval, dried and analyzed for Mehlich 1 extractable nutrients and various P fractions.
Continued page 6

Nutrient Management Education Page 6 of 16
A fully automated weather monitoring network was set up at the site to measure rainfall, surface runoff volume, and depth of water table. Earthen berms were used do divide plots into separate hydrologic units. Water samples from surface runoff and shallow wells to 0.625 and 1.25 m depths inside plots were collected for quality analysis.
Applied Question 1: Did P and liming materials influence forage yield and quality? Phosphorus fertilizer did not increase forage yield (Fig. 1), did not improve forage crude protein content (CP) (Fig. 2) nor IVOMD (Fig. 2) throughout the 3 years. The soil Ap horizon had an initial pH of 4.4 and there was an indication that stargrass yield from the control, which received N and K fertilizer could benefit from gypsum application only in the first year (Fig. 1) but lime amendments had no effect on forage CP and IVOMD either. Applied Question 2: Did P and liming materials influence tissue macro and micro nutrients of stargrass forage? Phosphorus uptake by forage increased by 0.003% units for each kg P ha-1 applied to pasture over the three year period. Fertilizer P also increased Ca uptake by 0.001% units per kg P ha-1. Neither P nor calcium carbonate had any effect on tissue K and Mg. Both calcium carbonate and gypsum had no effect on tissue P even at the highest liming rate of 4 Mg ha-1 suggesting that the 50 kg P ha-1 that was applied was not tied up but stayed readily available for plant uptake. Gypsum linearly increased stargrass tissue Ca at the rate of 0.012% but reduced tissue Mg by 0.007% at 50 kg P ha-1. Averaged over three years, fertilizer P showed no effect on stargrass tissue Cu, Fe, Mn, and Zn. Calcium carbonate and gypsum also had no effects on stargrass tissue Cu, Fe and Zn. However, Calcium carbonate decreased whereas gypsum increased tissue Mn linearly. The ramification of these complex interactions on animal nutrition is not very clear, however, most cattle producers routinely feed mineral mix to provide adequate P and necessary minerals.
Applied Question 3: Did P and liming materials influence soil P status? Phosphorus fractionation indicated a relatively high total P in the Ap (375-495 ppm), E (28-48 ppm) and Bh (527-825 ppm) horizons of untreated Immokalee fine sand. Phosphorus fertilization resulted in further build up of soil P by 0.70 kg P for each kg of applied P ha-1 without any agronomic benefits but an increased potential for P loss through runoff. Applied Question 4: Did P application influence runoff and groundwater P concentrations on stargrass pasture? The soluble phosphorus (ortho-phosphorus, OP) content in water samples was typically 85 to 95% of total phosphorus (TP). In 2001 when sufficient rainfall occurred, the OP concentrations in shallow wells increased significantly from less than 1000 to 5000 parts per billion (ppb), in deep wells from 0 to 1500 ppb, in surface runoff from 1000 to 1500 ppb as P fertilizer rates increased from 0 to 50 kg ha-1. (Fig. 3a). Corresponding increases in TP concentrations to applied P in 2001 were: in shallow wells from 1000 to 3000 ppb, in deep wells no effect, and in surface runoff from 800 to 900 ppb (Fig. 3b). At 50 kg applied P ha-1, increasing rate of gypsum from 0 to 4 Mg ha-1 tied up the P and totally eliminated OP and TP from deep wells (Fig. 4a and 4b) while increasing rate of calcium carbonate caused a slight increase of OP in surface runoff (Fig. 5a) but a 40% decrease in TP concentration of surface runoff (Fig. 5b). Conclusions: Phosphorus fertilizer did not increase stargrass forage yield nor improved forage crude protein or in vitro organic matter digestion. Although applied P improved forage tissue P concentration, most cattle producers routinely feed a balanced mineral mix. Applied P caused a significant buildup of P in the Ap, E, and Bh horizons, increased soluble P concentrations in shallow and deep wells by 400% and 1500%, respectively, and in surface runoff by 50%. Gypsum was effective in eliminating P leachate from applied P into deep wells. Although Ca-lime significantly reduced TP in surface runoff, its long-term effect is not clear because of equilibrium tendencies. This study collaborates results from another multi-county fertilizer study (Adjei et al 2000) to provide strong evidence that current IFAS P-fertilizer recommendations for all improved grasses of up to 40 kg P ha-1 could be further reduced at no cost to forage production. Such cuts will ultimately result in tremendous savings to ranchers as well as have beneficial effects on water quality. Since this study was concluded, the current IFAS P fertilizer recommendations for stargrass has been modified to 20 kg ha-1. Acknowledgement: The authors acknowledge the South Florida Water Management District for funding the entire project.
Continued from page 5

Nutrient Management Education Page 7 of 16
Best Management Practices in the Everglades Agricultural Area Samira Daroub, University of Florida, EREC, Belle Glade, FL
The Everglades Agricultural Area (EAA) is a
280,000 ha of land comprised of organic soils. Farms in the EAA discharge their water into an extensive array of canals, which is pumped into the South Florida Water Management District main canals and eventually into the Everglades. Land use in the EAA varies from monocultures of sugarcane and vegetables to multi-cultures of vegetables, rice, sod and sugarcane. Best management practices (BMPs) are in place to reduce total phosphorus (P) loading out of the EAA.
The objectives of our research and extension program is to verify BMP effectiveness in the EAA, and identify sources, mechanisms of transport and control of particulate P in an effort to reduce total P loading into the Everglades. Training workshops and seminars are conducted to improve the wide implementation of BMPs in the EAA.
Our research has shown that water management and crop rotation BMPs have the greatest impact on total P loads and concentrations of farm discharges. Water management practices that proved most effective included making internal drainage improvements to the farm to allow more uniform drainage. Particulate P transport studies aim to identify sources and mobility characteristics of particulate P on EAA farms and to modify management practices to reduce particulate transport off the farm. Particulate P accounts for 20 to 70% of total P exported from EAA farms and is frequently the cause of spikes in total P loads. A significant fraction of particulate P in the EAA originates from in-stream biological growth, rather than from soil erosion. A major contributing factor to particulate P discharge is the “Biological Contribution Mechanism” (BCM). Sediments that contribute significantly to P exportwere postulated to be recently deposited biological material such as settled plankton, filamentous algae, and macrophyte detritus. The BCM includes bed sediment erosion as a source of exported particulate
P, and these sediments consists of a heterogeneousmixture of organic matter in various stages of decomposition, with various levels of P content, and variable transport properties.
Management practices that are recommended by our research to control particulate P in discharges include practices that reduce the first flush of P and minimize the occurrence of continued high velocities in the canals. Aggressive weed control programs in the main canals are the most productive in reducing the supply of transportable high P content biomass and thereby reducing the first flush phenomena. Relocating sediments upstream from the pump house is recommended in conjunction with irrigation events. High velocity flow can cause particulate P to be mobilized in large amounts. Velocity in farm canals is the key control parameter for reducing particulate P export. Recommended velocities in the canal are relative, in that they must be within the operating framework of the configuration of the farm. Given that, velocities should be as low as possible, and velocity excursions should be avoided. Control of canal levels is critical in avoiding extreme velocity excursions.
The IFAS research projects in the EAA confirm the effectiveness of existing BMPs as well as provide direction on areas of future focus. The IFAS recommendation is that the primary focus should turn to evaluation of the active biological and chemical interactions that flourish in the ecosystems south of the EAA so that relationships between P leaving the EAA and its eventual downstream points can be developed. Another key component to the IFAS research goals is to promote the continued, uniform, and conscientious implementation and management of BMPs. This is accomplished through an extension program consisting of numerous seminars, BMP training workshops and publications offered to the EAA community.

Nutrient Management Education Page 8 of 16
The Importance of Potassium in a Florida Citrus Nutrition Program Thomas Obreza, Soil & Water Science, Gainesville
The root zone of most soils used for Florida citrus production is dominated by quartz sand, with very little clay and organic matter. These soils are extremely low in natural fertility and water-holding capacity. Managing water and nutrients efficiently on these soils is a challenging task for citrus production managers. Typically, the nitrogen (N) fertilizer rate applied to mature citrus ranges between 150 and 250 lbs/acre. Potassium (K2O) is usually applied at 1.0 to 1.25 times the N rate. While the inefficiency of N fertilizer is well known, K is usually thought of as an immobile nutrient in most parts of the world. However, Florida sands have only a small capacity to hold K against leaching as evidenced by repeated soil testing. Many citrus grove soils do not show a substantial increase in soil test K even after fertilizer has been applied for many years. Potassium has numerous functions within the plant, and citrus fruits remove about 14 lbs of K per 100 boxes of fruit. Potassium is important in fruit formation and enhances size, flavor, and color. A shortage of K can result in lost crop yield and quality. Moderately low plant K concentrations will cause a general reduction in growth without visual deficiency symptoms. The onset of visual deficiency symptoms means that production has already been seriously impacted. In 1998, funding from the Florida Citrus Producers Research Advisory Council and the Foundation for Agronomic Research helped us initiate a K fertilizer experiment in a young southwest Florida grapefruit grove. Our objectives were to evaluate the effect of K fertilization on yield and fresh fruit quality, and to develop recommendations that will produce qualities most desired by fresh fruit consumers. We applied fertilizer rates of 0, 100, 200, or 400 lbs K2O/acre each year and measured canopy volume, fruit yield, and fruit quality factors as the trees grew and produced fruit. We also measured K concentration in leaves, since citrus response to fertilization is typically reflected in leaf tissue nutrient concentrations. We found leaf tissue K of less than 0.5% where no fertilizer was applied, 1.1% with the 100 lbs/acre rate, 1.3% with the 200 lbs/acre rate, and 1.6% with the 400 lbs/acre rate. (Interpretations for leaf K concentration are “very low”, <0.7%; “low”, 0.7 – 1.1%; “optimum”, 1.2 – 1.7%; “high”, 1.8 – 2.3%; and “very high”, >2.3%.) The response of grapefruit yield to K was
characterized by a gradual rise to a maximum followed by a slight decline (Fig. 1). Our data suggest that maximum tree size and yield will occur when fertilizer is applied yearly at 200 to 250 lbs K2O/acre. Visually, trees that received the 200 lbs/acre rate had an expanded, branching canopy compared with a tight, bushy appearance of trees that did not receive K (Figs. 2 and 3). Fruit was easy to find on trees receiving K, but finding a grapefruit on the low-K trees was a difficult task. Interestingly, the low-K trees did not show any obvious visual leaf symptoms of K deficiency like necrotic edges or off-green color; rather, the lack of K was expressed as a compact canopy and almost no fruit production.
0
20
40
60
80
100
120
140
0 100 200 300 400
Annual K2O rate (lbs/acre)
Frui
t yie
ld (l
bs/tr
ee)
Grapefruit
Figure 1 - Response of grapefruit trees planted on flatwoods soils to potassium fertilizer.
Fig. 2. 4-year-old grapefruit tree grown on a flatwoods soil with sufficient N fertilizer but no K fertilizer. (Notice tight, compact tree with no visible fruit.)
Continued page 9

Nutrient Management Education Page 9 of 16
Fruit size increased with increasing K fertilizer rate, but brix was maximized at about 200 to 250 lbs K2O/acre. Therefore, it is important to supply sufficient K for fruit sizing, but too much can perhaps cause the brix to be less than maximum. Peel thickness also increased as K fertilizer rate increased, indicating that adding K does notprovide positive results for everything. Growers must consider all factors and strike a balance between them when deciding on the rate of K fertilizer to apply.
A Improved use of root nutrient interception for groundwater protection Johan Scholberg, UF Agronomy Department, [email protected]
The relationship between temporal and spatial root uptake and crop accumulation of N and/or P as affected by temperature, growth stage, and fertilizer management practices are being investigated for citrus, corn, potato, pepper, tomato and forages. The objectives of this program are to i) to improve our understanding of root growth, crop nutrient uptake, and accumulation dynamics; ii) use this information for improved matching of crop nutrient supply, root interception capacity and crop nutrient demands; iii) provide a scientific base for enhancing nutrient uptake efficiency and thus minimizing the risk of nutrient contamination of surface and groundwater resources. Using tubular microrhizotrons maximum root depths and effective root depth (ERD, the depth at which 90% of the total root length occurs) for sweet corn under optimal conditions were determined to be 70 vs 89 cm and 30 and 55 cm at 14 and 21 days, respectively. Maximum root elongation rates were 4.7 cm/day. Under field conditions, root densities for sweet corn were greatest in the row middles and the upper 15 cm of the soil profile. Root density increased with N-rate and in-the-row root densities at 21, 35 and 56 days were 0.28, 0.90, 0.96; 0.43, 2.19, 2.68; and 0.58, 2.50, and 2.73 cm/cm3 for the 0, 133, and 266 kg N rates, respectively. Corresponding between-row root densities for the 266 N rate were 19, 47 and 82% of those in the row. Use of covercrop residue promoted root growth. Root densities showed an exponential decay pattern and densities below 30 cm and 45 cm soil were on the order of 0.2-0.4 and 0.02-0.05
Fig. 3. 4-year-old grapefruit tree grown on a flatwoods soil with sufficient N fertilizer and 200 lbs K2O per acre per year. (Notice more branching, expansive tree canopy with visible grapefruits.)
Importance of Potassium in a Florida Citrus Nutrition Program
Continued from page 8
cm/cm3, respectively. Use of subsurface irrigation placed at 23 and 33 cm increased ERD at maturity from 28 cm (surface irrigation) to 39 and 51 cm, respectively. Maximum root densities (MRD) for pepper at the 0-15, 15-30 and 30-45 cm soil depth were 2.3, 0.7 and 0.6 cm/cm3, respectively. Corresponding values for tomato were 3.0, 0.9 and 0.7 cm/cm3. For tomato MRD values outside the wetting area were 0.7 compared to 3.8 cm/cm3. For potato root concentrations for the upper 15 cm at 0, 15, 30 and 45 cm from the row-center were 1.2, 1.2, 0.2, and 0.1 cm/cm3 respectively and ERD was between 20 and 30 cm. A comprehensive literature review along with field data showed that biomass and N accumulation for annual crops generally follows logistic patterns. Maximum biomass and N accumulation rates occurred between 1/3 and 2/3 of the growth duration and N recovery for most annual crops ranges from 36-82%. Root uptake capacities of annual crops increased over time and approached maximum values at 35-56 days. Fertilizer uptake efficiency can be increased by applying nutrients in phase with crop demand and via sound irrigation practices to retain nutrients within the upper 30-45 cm of the soil profile. Root distributions for citrus followed bimodal patterns and root densities ranged between 0.1 and 1.5 cm/cm3. Daily maximum N uptake capacities increased as soil N concentration increased and were 8-10 kg N/day under optimal conditions. The above information will be integrated in PC-based management tools to facilitate more efficient N use on vulnerable soils in Florida.

The Potato Root Distribution and its Role in Nitrogen Uptake Efficiency Fernando Munoz, Rao Mylavarapu, Soil & Water Science, Chad Hutchinson, Horticultural Science
Nutrient Management Education Page 10 of 16
In order to accomplish the proposed objectives a device to get a representative sample of the potato root system was designed (Picture 1).
Potato is a shallow rooted crop that is grown on sandy well-drained soils where nitrate leaching from N fertilizers has been identified as the reason for increase of nitrate concentration in groundwater, rural wells, and streams, particularly in the St. John River watershed of northeast Florida. Part of this problem may be because farmers tend to apply higher rates of N as an insurance against yield reduction. Enhanced uptake is one of the proposed strategies to minimize nitrate leaching, reducing fertilizer rates at the same time. In the short term this could be accomplished by timely and precise placement of the fertilizer in soil regions where it could be quickly absorbed by the roots. In the long term, the development of potato cultivars with high uptake and use efficiencies by plant breeding could be a part of the solution to nitrate leaching from potato fields. In both cases a detailed knowledge of the root system is required. The precision of fertilizer placement on time and space is especially important for nutrients such as nitrate characterized by high mobility in the soil. In order to begin the collection of information about the potato root system a two-year study of the potato root distribution was initiated. The objectives of this study were: to propose and to test a new methodology to get a representative sample from the potato root system in order to study vertical and horizontal root distribution, to study the effect of three N rates on the root system of Atlantic, a potato variety used extensively by the farmers in the tri-county agricultural area located in the St. Johns River watershed and to generate information that could be used to enhance fertilizer placement in order to maximize uptake and minimize nitrate leaching.
Picture 1.
2
This device, ‘slicer’ is composed of 2 sharp-edged metal sheets. Three wooden pieces holds the sheets in place with an even separation of 4 inches. The “slicer” is buried into the soil (Picture 2) Two slices, one including a plant and another one between plants, were taken in each plot. Afterward, each slice was split in 14 sub-samples (Fig.1), weighed and labeled individually.
1
The roots were separated from the soil by washing on a screen (Picture 3) and pulled out of organic matter debris. The soil samples containing roots were stored in a cooler at 45 °F during the washing process.
3
15 cm 15 cm 15 cm 15 cm 20.8 cm 20.8 cm
12 cm
12 cm
12 cm
10.2 cm
Fig 1. Spatial distribution of the samples.

Nutrient Management Education Page 11 of 16
Continued page 12
4
Roots were kept in plastic bags containing a solution of sodium azide (0.02%) as preservative and stored in a refrigerator. Roots were scanned in translucent Plexiglas trays containing water. Root images obtained in this way were saved and further analyzed for root length and root surface area using GSRoot, specialized software for root analysis (Picture 4). Subsequently, roots were oven-dried at 105 °C and their weight recorded. Root variables studied are: -Root Length Density (RLD) cm root / cm3 soil. -Root Area Density (RAD) cm2 root surface / cm3 soil. -Specific Root Length (SpecRL) cm root / mg biomass. -Specific Root Area
(SpecRA) cm2 root surface / mg biomass. -Marketable and total tuber yield (kg/ha). Additionally bulk density and soil strength using penetrometer were also determined. Preliminary Results: The applied nitrogen rates did not show any significant effect on the root parameters evaluated – RLD and RAD were highly correlated (0.91, <0.0001), which is normal because N rates had no effect on root system traits. Furthermore, just one potato variety was evaluated. RLD was statistically different for relative position (vertically) and, slice (horizontally) at 1% and 5% respectively (Fig. 2). RLD was lower for the slice between plants than the slice including the plant (Fig. 2). RAD was statistically different both horizontal and vertical positions at 1% in both cases. RAD was lower in the slice between plants than in the slice with the plant (Fig. 3). These facts mean that the crop root system in the region of soil between plants has less capacity to explore the soil. Therefore, any nitrates in this region could be susceptible for leaching.
0.81
0.62 0.34
0.04 0.02 0.04
0.48 0.48
0.34
0.05 0.05
0.38 0.29
0.096
0.064 0.027
0.0039 0.0038 0.0039
0.047 0.047
0.027
0.0072 0.0072
0.029 0.043
Figure 2 Root Length Density (RLD) in cm root/cm3 soil. Means on distinct color are statistically different. In the slice p < 0.0001. Between slices p < 0.03
Figure 3 Root Area Density (RAD) in cm2 root/cm3 soil. Means on distinct color are statistically different. In the slice p < 0.0001. Between slices p < 0.005
Continued from page 10

Nutrient Management Education Page 12 of 16
SpecRL and SpecRA were highly correlated (0.90, <0.0001). These two parameters showed statistical differences vertically only (Fig. 4, 5). This is a foreseen response for just one variety evaluated under a fertilization regime that may not be affected root traits.
5
Root deformation due to soil compaction was observed (Picture 5.). Root swelling and increase in the root tortuosity occurred in regions with a soil strength close to 15 psi (0.1 MPa). The compacted layer was uniformly
distributed throughout the field at a depth of near 24 cm. Statistical differences (<0.0001) were observed among the average soil strength observed in each evaluated soil depth (Table ). There was no difference in marketable and total yield under the fertilization rates applied. Soil compaction could be responsible in part for the lack of yield response to increase in the fertilization rate. More detailed studies are recommended in order to estimate the effect of soil compaction on potato yield. Current assessments indicated that the performance of the root sample devise (slicer) was satisfactory, validating its use for future studies. Lack of any influence of nitrogen application rates on the evaluated parameters of the root system and yield suggests that N uptake at these application rates and under the site conditions depends more on the rate of nitrogen influx to the plant than root response in terms of length and root surface area. Root deformation by soil compaction could be limiting potato root efficiency to scavenge nitrates from the soil. Timing and precise placement of the fertilizer instead of higher N rates probably maximize N uptake and correspondingly minimize any potential for nitrate leaching.
Continued from page 11
1.76
1.081.71
1.66 1.28 1.66
1.491.49
1.71
2.28 2.28
1.51 1.71
15.27
12.2622.15
15.96 7.93 15.96
14.7614.76
22.15
16.06 16.06
14.88 14.99
Figure 4 Specific Root Length (SRL) in cm root/mg biomass. Means on distinct color are statistically different. In the slice p<0.0001. The difference was no-significant between slices.
Figure 5 Specific Root Area (SRA) in cm2 root surface/mg biomass. Means on distinct color are statistically different. In the slice p<0.0001, the difference was no-significant between slices.

Evaluating Leaching Potential for Nutrient Management Planning in Sandy Soils V.D. Nair, W.G.Harris, R.D. Rhue, D.A. Graetz, and R.S. Mylavarapu, Gainesville
Nutrient Management Education Page 13 of 16
Several Soil and Water Science faculty are involved in research projects addressing nutrient management issues in the Suwannee River Basin (SRB). These projects assess risks associated with nitrate and phosphate applications. Highlighted in this write-up are some aspects of research in the Suwannee River Basin with respect to the application of a nutrient management tool -- the Florida P-Index -- with special emphasis on the leaching potential of these sandy soils. The study involves four sites, two dairy and two poultry operations. Karst landscapes of the SRB may require further refinement of leaching criteria based on water moving preferentially through breaches in Bt horizons.
Soil profile showing redoximorphic features at the Bt horizon
The use of Ground Penetrating Radar (GPR) scans provide continuous images of subsurface interfaces and will indicate breaches in the Bt horizon through which P could move.
The GPR at work at one of the dairy sprayfields in the study
Risk assessment of P for leaching-prone soils requires that a valid and practical indicator of the affected depth be included in the assessment protocol for nutrient management using the Florida P-Index. A “P quick test” has been developed to provide a simple and practical field method for the assessment of the P-affected depth. The test involves mixing a small amount (1.0 g) of soil in a ceramic test plate with reagents used in the phosphomolybdate blue colorimetric method for P determination.
Performing the P quick test in the field
Example of the colorimetric procedure used in the P quick test

Nutrient Management Education Page 14 of 16
The above figures show depth to background P (horizontal lines) for the four sites as determined by the P quick test and their relationship to water soluble P and Mehlich 1-P concentrations. Depth to background P is the depth recorded when the blue color fades.
Soils have a finite capacity to retain P before elevated pore water concentrations occur. This finite concentration can be estimated by relating extractable P to extractable Fe and Al. That is because Fe and Al oxides correlate highly with P retention in Florida soils. The critical P saturation ratio (PSR) indicated by data collected in Florida is approximately 0.15; i.e if the molar ratio of P to Fe+Al is greater than 0.15, there is an elevated risk of P loss from the soil. We can calculate the amount of P to reach this critical PSR from the expression, (0.15-soil PSR) x (moles of Fe+Al). For details on this concept, refer to Nair et al. 2004. Journal of Environmental Quality 33:107-113. Another basis for estimating the lifespan of a soil is to calculate the degree to which a soil retards vertical P movement. Our project is comparing the prediction of P based on the retardation approach with the capacity prediction explained above. Thus far, the results of the two approaches have been comparable. This research was supported in part by a grant from the USDA-IFAFS. We take this opportunity to thank the graduate students involved in this project.
With graduate students at one of the field
sites
Continued from page 13
Water Soluble P, mg kg -1
0
20
40
60
80
100
120
140
160
180
200
0 5 10 15 20 25 30
Depth, cm
Byrd Dairy Oak Grove Dairy Barnes
Poultry Sympson Poultry
0 20 40 60 80
100 120 140 160 180 200
0 50 100 150 200
Depth, cm
Byrd Dairy Oak Grove Dairy Barnes
Poultry Sympson Poultry

The Green Industries Best Management Practices: Education Program and Future Research
L.E. Trenholm, Environmental Horticulture Department
Nutrient Management Education Page 15 of 16
It has been almost two years since the Green Industries Best Management Practices (BMP) manual was completed. This document was developed in conjunction with UF-IFAS, Florida Department of Environmental Protection, Water Management Districts, and representatives from many facets of the lawn care and fertilizer industry. The primary goal of the manual is to provide the commercial lawn and landscape industry with guidelines on how to perform their jobs with minimal impact on Florida’s environment. Preservation of both water quality and quantity are the desired outcomes. To get the educational message of the manual out to all segments of the industry, the BMP Educational Program was developed. In 2003, over 1,000 workers were trained in BMPs in training sessions held throughout the state. Training materials include copies of the manual, a summary guide, and CDs with PowerPoint presentations and other references. Survey and quiz responses to these sessions include:
97% of respondents felt that the program met their expectations
96% knew more about the topics than they previously did
87% felt prepared to teach the topics to other employees
98% felt that the training materials would be used in training programs
Average pre-test scores were 68.4%, while post-test scores averaged 86.6%
Training continues in 2004. New audiences are being targeted for this year’s programs, including city and county government officials, landscape designers and installers, irrigation specialists, and environmental specialists. A Spanish version of the manual is to be published later this year. In conjunction with development of the manual and educational program, FDEP has recently awarded a 5-year grant to turfgrass researchers to verify effectiveness of the BMPs. Beginning in 2004, research will begin in Gainesville, Jay, and Ft. Lauderdale to evaluate nutrient leaching on various home lawn turfgrass species in response to varying rates of nitrogen and irrigation during the turf establishment phase and on established grass. Ninety lysimeters will be installed in each location in year one and sampling will be conducted throughout the growing season for nitrates and phosphates. Future work in this project includes evaluating specific turfgrass P requirements and determining phosphate leaching from varying rates of P, effects of winter fertilization on leaching, and nitrogen source and timing effects on nutrient leaching. Drs. Bryan Unruh, John Cisar, George Snyder, Jerry Sartain, and Laurie Trenholm are collaborating on this state-wide project.
Figure 1. Pump used to collect leachate from turf plots Figure 2. Turfgrass BMP research

Nutrient Management Education Page 16 of 16
Animal Sciences faculty have made a concerted effort to work with dairy farmers and their nutritionists to understand that they can have a huge impact on reducing the amount of phosphorous that is excreted by cows and thus reduce the potential impacts of the farm on the environment. Through meetings, articles, and on-farm discussions, we discuss basic concepts about phosphorous: ♦ It is an element. It does not convert into anything else. ♦ It is not volatile. Unlike nitrogen, it will not volatilize. ♦ Cows have a basic requirement for phosphorous to maintain health and productivity. ♦ Like other animals, cows cannot use phosphorous with 100% efficiency so none is excreted, but efficiency may be improved. ♦ What goes in does come out: Phosphorous is used for growth to make tissue, for bone, for pregnancy, for milk, and for manure. ♦ The phosphorous content of milk is about 0.09%, and it does not change much. ♦ For milking cows, roughly, the intake of phosphorous, minus that in milk equals the amount of phosphorous in manure. In the discussions with the dairy industry, we emphasize that the best way to reduce the amount of phosphorous you have to deal with in manure is to feed less phosphorous to your cows – meet their requirements, but limit excesses. At normal dry matter intakes, Dr. Larry Satter of USDA recommends feeding phosphorous as 0.35% of ration dry matter to meet the gram requirements of the cow for phosphorous. Reaching this amount often means feeding more forage and carefully selecting the byproduct feeds you use. Many of the high protein byproduct feeds (wheat midds, distillers grains for example) tend to be high in phosphorous. Hominy contains roughly twice the phosphorous (0.65%) that ground corn does (0.30%). Often, no additional phosphorous from mineral sources needs to be added to rations to meet the animals’ phosphorous requirements. We recognize that one of the challenges to reducing phosphorous in the diet is that byproduct feeds are often a very good buy to bring needed nutrients into the diet. The dairy farmer and their advisors have to decide how to formulate to meet a variety of goals for the diet. To date, the Florida dairy industry has removed most if not all excess phosphorous mineral supplementation from the diets, with a attendant reduction in phosphorous importation onto farms.
Another topic we address with the dairy industry is that increasing feed efficiency can reduce phosphorous in manure: if the farm gets more pounds of milk out of each pound of feed the cow consumes, they can export more phosphorous off the farm. This can be done by making certain that the diet consumed by the cows is properly balanced for all nutrients, provide the cows with a comfortable environment to live in, and maintaining good animal health. Accomplish these goals, and the cow has potential to produce more milk from a fixed amount of feed. With a fixed amount of phosphorous consumed each day, each additional pound of milk the cow produces ships 0.4 grams more phosphorous off the farm. That’s a small amount, but multiply the increase in milk by the number of cows for 365 days in a year, and the additional amount adds up to a mass that matters. A topic we address with the farmers is the array of products that promise to make phosphorous disappear. Rarely say never, but if someone offers a product that reduces phosphorous in manure or in the lagoon without changing the amount of phosphorous being fed into the system, the farmers are told to inquire as to what happened to it. Even in cows, phosphorous is neither created nor destroyed. Through the discussions on phosphorous, people in the dairy industry are encouraged to rely on sound, science-based information to make decisions, and recognize that, through feeding, they can change phosphorous loading on their farms.
This newsletter was created to disseminate information on current projects in the Nutrient Management area. If you would like to submit
an article for inclusion in a future newsletter please contact:
Susan Curry
PO Box 110290 Soil & Water Science University of Florida
Gainesville, FL 32611 (352) 392-1951 [email protected]
Silver Bullets and Phosphorous Mary Beth Hall, Animal Science Department

Nutrient Management Education