december 2016 child care - gao
TRANSCRIPT

CHILD CARE
Access to Subsidies and Strategies to Manage Demand Vary Across States
Report to Congressional Committees
December 2016
GAO-17-60
United States Government Accountability Office

United States Government Accountability Office
Highlights of GAO-17-60, a report to congressional committees
December 2016
CHILD CARE
Access to Subsidies and Strategies to Manage Demand Vary Across States
What GAO Found According to GAO’s analysis of nationwide data for an average month in 2011-2012 approximately 8.6 million children under age 13 were estimated to be eligible for subsidies under the Child Care and Development Fund (CCDF) program based on policies in their states, and about 1.5 million received them. When compared with all eligible children, those receiving subsidies tended to be younger (under age 5) and poorer (in families below federal poverty guidelines). (See figure.) Some state-by-state variations existed in these and in other characteristics GAO analyzed, such as race, when comparing children eligible for and receiving subsidies.
Children Eligible for and Receiving Subsidies Based on State Policies
Notes: Percentages may not sum to 100 percent due to rounding. In the poverty graph, margins of error (MOE) are less than +/- 2 percentage points. In the age graph, eligible children have MOEs less than +/- 2 percentage points and data on subsidy recipients are population totals. Figures represent eligibility and receipt in an average month. TRIM3 data were calendar year and HHS data fiscal year.
According to various officials and stakeholders, the number of families receiving subsidies does not equate to the population of eligible families who are interested in pursuing them or who may need them. They also said that it is difficult to accurately predict the extent to which eligible families are likely to apply for and receive subsidies. For example, some eligible families may not pursue subsidies because they may not know about them or find applying burdensome.
Child care officials GAO interviewed said that they use wait lists and other strategies to manage caseloads when more families want subsidies than their states can serve. Wait lists can be challenging to manage, according to child care officials from 23 of the 32 states that GAO interviewed. Challenges included keeping lists current and accurate. Forty states also prioritize certain families for subsidies, such as recipients of the Temporary Assistance for Needy Families program and children in protective services. States also stop taking applications from all or some types of eligible families and modify eligibility policies to manage caseloads. Child care officials also noted that they leverage other programs and funds to meet the child care needs of low-income working families.
View GAO-17-60. For more information, contact Cindy Brown Barnes at (202) 512-7215 or [email protected].
Why GAO Did This Study Child care subsidies help low-income families pay for care, allowing parents to work or attend school or training. Through the CCDF, the federal government provides states funding to assist these families. Federal law sets broad subsidy eligibility requirements and allows states to establish more restrictive policies. Due to limited funds, some eligible families may not be able to get subsidies and may be placed on wait lists.
Congress included a provision in statute for GAO to review participation in the CCDF program across states. GAO examined: (1) what is known about the number and types of families eligible for child care subsidies and the extent to which they receive them; and (2) how states determine which eligible families receive subsidies when subsidy need exceeds supply. GAO used Urban Institute data from 2010-2012 to estimate eligible children (most recent at time of analysis) and U.S. Department of Health and Human Services (HHS) data on subsidy receipt (same years as Urban’s data). GAO also held interviews with child care officials from 32 states with wait list policies about subsidy need and management. GAO also interviewed HHS officials and child care stakeholders (selected by reviewing studies and websites, and obtaining suggestions); reviewed federal laws and regulations; and examined state policies in the CCDF Policies Database Book of Tables, an HHS funded project that compiles policies for the 50 states and District of Columbia.
GAO makes no recommendations in this report. HHS noted that the report provides valuable information about access to CCDF subsidies.

Page i GAO-17-60 Child Care
Letter 1
Background 4 The Estimated Number and Characteristics of Children Eligible for
and Receiving Child Care Subsidies Varies Across States 8 States Use Wait Lists and Other Methods to Help Determine
Which Eligible Families Receive Subsidies 35 Agency Comments and Our Evaluation 42
Appendix I Objectives, Scope, and Methodology 44
Appendix II Comments from the Department of Health and Human Services 52
Appendix III GAO Contact and Staff Acknowledgments 55
Tables
Table 1: Reported Child Care and Development Fund (CCDF) Expenditures and Reported Number of Children Served, Fiscal Years 2012-2014 6
Table 2: Child Care and Development Fund (CCDF) Reported Income Limits, by State, as a Percentage of 2014 Federal Poverty Guidelines 12
Table 3: Reported State Child Care and Development Fund (CCDF) Eligibility Policies for Minimum Number of Hours Worked, 2014 14
Table 4: Status of States’ Use of Wait Lists and Discussion Group Participation 50
Figures
Figure 1: Percentage of Children Meeting Federal Child Care and Development Fund Requirements Who Met Eligibility Policies in Each State and Percentage Who Received Subsidies 10
Figure 2: Eligible Children and Subsidy Recipients Nationwide, by Income to the Federal Poverty Guidelines, 2011-2012 17
Contents

Page ii GAO-17-60 Child Care
Figure 3: Eligible Children and Subsidy Recipients with Family Income Less Than 100 Percent of the Federal Poverty Guidelines, 2011-2012 19
Figure 4: Percentage of Eligible Children and Subsidy Recipients Nationwide by Age, 2010-2012 21
Figure 5: Eligible Children and Subsidy Recipients Age 2 to 4 Years Old, 2010-2012 22
Figure 6: Eligible Children and Subsidy Recipients Nationwide by Head of Household, 2011-2012 23
Figure 7: Eligible Children and Subsidy Recipients in Single-Parent Families, 2011-2012 25
Figure 8: Eligible Children and Subsidy Recipients by Race and Ethnicity, 2010-2012 26
Figure 9: Eligible Children and Subsidy Recipients Who Are Black, 2010-2012 27
Figure 10: Eligible Children and Subsidy Recipients Who Are Hispanic, 2010-2012 29
Figure 11: Eligible Children and Subsidy Recipients Who Are White, 2010-2012 31
Abbreviations ASPE Office of the Assistant Secretary for Planning and
Evaluation CCDBG Child Care and Development Block Grant CCDF Child Care and Development Fund CPS Current Population Survey HHS U.S. Department of Health and Human Services MOE margin of error NWLC National Women’s Law Center OCC Office of Child Care SMI state median income SSBG Social Services Block Grant TANF Temporary Assistance for Needy Families TRIM3 Transfer Income Model, version 3
This is a work of the U.S. government and is not subject to copyright protection in the United States. The published product may be reproduced and distributed in its entirety without further permission from GAO. However, because this work may contain copyrighted images or other material, permission from the copyright holder may be necessary if you wish to reproduce this material separately.
Page 1 GAO-17-60 Child Care
441 G St. N.W. Washington, DC 20548
December 15, 2016
The Honorable Lamar Alexander Chairman The Honorable Patty Murray Ranking Member Committee on Health, Education, Labor, and Pensions United States Senate
The Honorable John Kline Chairman The Honorable Robert C. “Bobby” Scott Ranking Member Committee on Education and the Workforce House of Representatives
Many families struggle to afford child care, particularly those who are low-income. According to Census data, poor families who pay for child care spend about 30 percent of their monthly income on care, which is well above the U.S. Department of Health and Human Services (HHS) defined level of affordable care—10 percent or less of family income.1,2 Child care subsidies help low-income families afford child care so parents can work or attend school or job training. The federal government provides funding for subsidies to states through the Child Care and Development Fund (CCDF) for improving the affordability, availability, and quality of child care. In fiscal year 2014, federal government expenditures totaled about $6.3 billion for CCDF subsidies and related services.
Under CCDF, states have substantial flexibility to establish their own eligibility criteria that determine which low-income working families will be served. However, limited funds can prevent some states from serving all applicants who are eligible and, as such, some low-income working families who could benefit from and want child care subsidies may not be able to get them. Some families may not qualify for subsidies based on eligibility policies in their state. Others may not know about the subsidies, 1U.S. Census Bureau, Who’s Minding the Kids? Child Care Arrangements: Spring 2011 (April 2013), p.17. Data represent families with mothers present and children under15 years of age. 2Council of Economic Advisers, The Economics of Early Childhood Investments, (December 2014), pp.13-14.
Letter
Page 2 GAO-17-60 Child Care
may find it difficult to apply for them, or may be wait listed because their state cannot afford to subsidize all eligible applicants. The Child Care and Development Block Grant Act of 2014 (CCDBG Act of 2014) included a provision for GAO to review the extent of participation in the CCDF program across states.3 We examined:
1. What is known about the number and types of families eligible for child care subsidies and the extent to which they receive them; and
2. How states determine which eligible families receive subsidies when subsidy need exceeds supply.
To determine what is known about families eligible for subsidies and the extent that they receive them, we estimated the number of children nationwide and state-by-state that: (1) met federal requirements for CCDF eligibility and (2) were eligible to receive CCDF subsidies based on state policies.4 We also compared the characteristics of children eligible for subsidies to children receiving subsidies. We used data from Urban Institute’s Transfer Income Model, version 3 (TRIM3) to estimate the number of children meeting federal requirements and state eligibility polices.5 We used HHS’s CCDF summary data tables from administrative records, as well as HHS’s public use sample data on CCDF recipients, to
3Pub. L. No. 113-186, § 12, 128 Stat. 1971, 2001. The CCDBG Act of 2014 authorized funding through fiscal year 2020 for the discretionary funding portion of CCDF. The Child Care and Development Fund (CCDF), a term that is not found in statute, is comprised of two funding sources: mandatory and matching funding authorized under section 418 of the Social Security Act, and discretionary funding in the form of block grants authorized under the Child Care and Development Block Grant Act of 1990, as amended. In addition, states may transfer up to 30 percent of their allotment under the Temporary Assistance for Needy Families block grant to the CCDF. To access matching funds, a state must provide a share of the matching funds based on the federal Medicaid matching rate, and meet its required maintenance of effort. 4Federal law provides general requirements regarding eligibility for CCDF benefits, including requirements concerning family income and the age of children. 42 U.S.C. § 9858n(4). States then have discretion within these broad federal parameters to set more restrictive eligibility policies. 5TRIM3 is a comprehensive microsimulation model that uses Census’ Current Population Survey (CPS) data to simulate potential eligibility in a variety of government programs, including CCDF. To improve the reliability of our estimates, we used multiple years of TRIM3 data to generate subsidy eligibility estimates for an average month. For nationwide federal and state eligibility estimates, as well as for most state-level estimates, we used data from calendar years 2011-2012, the most recent available at the time of our analysis. However, for state-level estimates of the age and race and ethnicity of eligible children we used data from calendar years 2010-2012 because the additional year increased the reliability of estimates for subgroups within states.
Page 3 GAO-17-60 Child Care
gather information on children receiving subsidies.6 We determined the statistical significance of comparisons between children eligible for subsidies and children receiving subsidies at a 95 percent confidence level. We assessed the reliability of all sources by (1) performing electronic testing of required data elements, (2) reviewing existing information about the data and systems that produced them, and (3) interviewing agency and other officials knowledgeable about the data. We determined that the data were sufficiently reliable for the purposes of this report.7
To examine how states determine which eligible families receive subsidies when need exceeds availability, we held interviews with child care administrators or their designees from 32 states that had wait list policies about how they assess need for subsidies in their states, prioritize who they serve, and manage wait lists.8 Of these 32 states, 19 used wait lists as of early 2015. The remaining 13 states served all applicants they determined eligible for the program, thus did not use wait lists. To answer both objectives, we reviewed applicable federal laws and regulations, and interviewed HHS officials, and contractors who provide technical assistance on child care subsidy eligibility and access issues. We also interviewed stakeholders from research and advocacy organizations, as well as academia. We identified interviewees through reviewing policy papers and applicable websites, attending webinars, and asking HHS officials and other interviewees to suggest additional knowledgeable individuals to contact. We selected a total of seven stakeholders and government officials to participate in a group discussion
6HHS’s public use sample data on CCDF recipients is a sample of families and children drawn from the CCDF administrative records. Throughout this report, we refer to HHS’s CCDF summary data tables from administrative records as the “HHS administrative data”, and we refer to HHS’s public use sample data on CCDF recipients as “HHS sample data”. Although we used the same years of data when analyzing HHS and TRIM3 data, HHS data are fiscal year and TRIM3 data are calendar year. 7Throughout this report, we do not report estimates that we determined to be unreliable. For TRIM3 estimated percentages, and for HHS sample data estimated percentages, we considered unreliable any estimates where the margin of error exceeded 15 percentage points. For TRIM3 and HHS sample data count estimates, we considered unreliable any estimates where the relative margin of error exceeded 15 percent. In addition, we considered counts and percentages from the HHS summary data tables to be unreliable if 15 percent or more of records have missing data for the characteristic being analyzed. 8The results from these interviews are not generalizable to all states. In the report, we refer to group interview participants as state child care officials or simply state officials. An additional state also had a wait list policy, but declined to participate in our groups.
Page 4 GAO-17-60 Child Care
about good wait list practices, which we used to inform our questions for the group interviews we held with state child care officials described above.
We also identified and reviewed applicable studies that discussed eligibility and access issues associated with child care subsidies. We identified studies through reviewing key online research repositories and consulting with interviewees. Finally, we primarily used Urban Institute’s 2014 CCDF Policies Database Book of Tables to review state policies.9
We conducted our work from May 2015 to December 2016 in accordance with generally accepted government auditing standards. Those standards require that we plan and perform the audit to obtain sufficient, appropriate evidence to provide a reasonable basis for our findings and conclusions based on our audit objectives. We believe that the evidence obtained provides a reasonable basis for our findings and conclusions based on our audit objectives. Details on our objectives, scope, and methodology can be found in appendix I.
The CCDF is a key federal funding source to states for providing child care subsidies to low-income parents so they can work, look for jobs, or participate in education and training activities. States also use CCDF funds to improve the quality and availability of child care for all families through activities such as providing training to providers or targeting funds to increase the supply of limited types of care, such as for infants. HHS’s Office of Child Care (OCC) administers the CCDF at the federal level and
9HHS funds the CCDF Policies Database project and the Urban Institute maintains it. This project includes an Excel database of CCDF policies from the 50 states and District of Columbia (DC) (which is counted as a state). Information about policies is primarily from reviews of detailed policy documents that caseworkers use to administer the program in each state. Urban Institute publishes selected policies for all states annually in its Book of Tables (see Sarah Minton, Kathryn Stevens, Lorraine Blatt, and Christin Durham (2015). The most recent available at the time of our analysis was, The CCDF Policies Database Book of Tables: Key Cross-State Variations in CCDF Policies as of October 1, 2014, OPRE Report 2015-95 (Washington, DC: Office of Planning, Research and Evaluation, Administration for Children and Families, U.S. Department of Health and Human Services). The tables created from the database were reviewed by almost all state administrators and verified for accuracy, with two states not providing verification. As noted in various places in this report, in a few states child care policies vary across sub-areas within a state and in those cases the Urban Institute’s tables show information for the most populous area. Although some caseworker manuals may include policies derived from state legal requirements, GAO did not examine state statutes and regulations nor did we independently verify the information in the Urban Institute’s tables.
Background

Page 5 GAO-17-60 Child Care
provides guidance and technical assistance to states on how to operate their subsidy programs. Federal law includes some broad eligibility requirements, such as children must generally be under the age of 13 and reside with families whose income must be at or below 85 percent of state median income (SMI).10
Within these broad federal requirements, states have substantial flexibility in establishing more restrictive eligibility criteria and other child care subsidy policies and these policies affect how resources for child care subsidies are allocated in a state. For example, the CCDBG Act requires states to give priority to very low-income families and children with special needs for subsidy receipt, but states may define “very low-income” and “special needs child” and determine how to prioritize these groups.11 Some states may establish priority groups to serve such families before other types of families and other states may use different methods, such as making it easier for these families to access care by waiving co-payments or paying higher reimbursements to providers for serving such families. States also may set any maximum family income eligibility limit at or below 85 percent of SMI for families of the same size. Other policies that may affect access to child care subsidies include whether income from all members in a household are counted toward the income limit states set for CCDF and the amount families have to pay for a portion of their child care as a condition of receiving a subsidy.
Federal law and regulations establish state reporting requirements for administering CCDF funds. Under these requirements, states must report their CCDF expenditures (e.g., direct and non-direct services, quality improvement activities, administrative expenses). States must also report data on the number of children served via CCDF subsidies, submitting it to HHS monthly (or quarterly) as well as annually. HHS uses these data to estimate the average monthly number of children served via CCDF subsidies nationally and state-by-state (see table 1).
1042 U.S.C. § 9858n(4). 1142 U.S.C. § 9858c(c)(3)(B)(i), 45 C.F.R. §§ 98.16(g), 98.46. The CCDBG Act of 2014 also includes provisions related to improving access to high quality child care for children experiencing homelessness.
Page 6 GAO-17-60 Child Care
Table 1: Reported Child Care and Development Fund (CCDF) Expenditures and Reported Number of Children Served, Fiscal Years 2012-2014
Fiscal year
Federal CCDF expendituresa
(In billions)
State CCDF expendituresb
(In billions)
Total CCDF expendituresc
(In billions)
Average monthly
number of children served
(in millions) 2012 $6.3 $2.3 $8.6 1.50 2013 $6.4 $2.2 $8.6 1.45 2014 $6.3 $2.1 $8.4 1.44
Source: U.S. Department of Health and Human Services data | GAO-17-60 aFederal expenditures are from the three federal funding streams—discretionary, mandatory, and matching—and include funds appropriated in prior fiscal years. bState expenditures include matching funds and Maintenance of Effort requirements. cReported expenditures include funds transferred from the Temporary Assistance for Needy Families (TANF) program to CCDF. States are allowed to transfer up to 30 percent of their TANF funds to CCDF and such funds are subject to the requirements of the Child Care and Development Block Grant Act, as amended.
CCDF is not an entitlement program, which means that states are not required to serve all eligible families who apply for CCDF subsidies; thus some eligible families who do apply for subsidies may not receive them. This can occur when a state does not have sufficient funds to serve all eligible applicants. Such states may wait list applicants or place limits on when families can apply for the program or which families receive subsidies. In early 2015, 30 states reported that they served all eligible applicants who applied for CCDF subsidies and 21 reported that they wait listed applicants or stopped taking applications when they could no longer serve new clients.12 Families who qualify for, but do not receive, CCDF subsidies could still receive public assistance with their child care through other federal or state programs such as Temporary Assistance for Needy Families (TANF) (accessed directly through the TANF program), Head Start, the Social Services Block Grant (SSBG), or a state’s pre-kindergarten program.13
12National Women’s Law Center, Building Blocks: State Child Care Assistance Policies 2015, p. 9. The District of Columbia is included in the 30 states. 13Head Start provides preschool children of low-income families with a comprehensive program to meet their emotional, social, health, nutritional, and psychological needs. Early Head Start provides similar services to infants and toddlers under age 3.
Page 7 GAO-17-60 Child Care
In November 2014, Congress passed the Child Care and Development Block Grant Act of 2014.14 This Act included several new provisions for the program, including: (1) permitting children to remain in the program for at least 12 months as long as their family’s income does not exceed 85 percent of SMI;15 (2) at a state’s option, terminating assistance when a parent experiences a non-temporary job loss (or cessation of education or training), but only after continuing assistance for at least 3 months in order for parents to look for work;16 and (3) requiring states to implement a graduated phase-out of assistance if, at re-determination, the family’s income exceeds state eligibility limits, but is still under 85 percent of SMI.17
14Pub. L. No. 113-186, 128 Stat. 1971. 15Pub. L. No. 113-186, § 5(b)(2)(C), 128 Stat. 1971, 1978 (adding 42 U.S.C. § 9858c(c)(2)(N)(i)(I)). 16Pub. L. No. 113-186, § 5(b)(2)(C), 128 Stat. 1971, 1978 (adding 42 U.S.C. § 9858c(c)(2)(N)(iii)). 17Pub. L. No. 113-186, § 5(b)(2)(C), 128 Stat. 1971, 1978 (adding 42 U.S.C. § 9858c(c)(2)(N)(iv)).

Page 8 GAO-17-60 Child Care
The estimated population eligible for and receiving child care subsidies varied among states. According to GAO’s analysis, out of the estimated 14.2 million children under age 13 nationwide who met federal work and income requirements for subsidies in an average month in 2011 and 2012, an estimated 8.6 million were eligible according to the eligibility policies in their states, and about 1.5 million received them.18 Children who received child care subsidies differed across a variety of characteristics when compared to the eligible population in their state.19 In particular, subsidy-recipient children were more often age 2 to 4, in very low-income families, Black, and in single-headed households than the overall population of eligible children in their state.20 The number of children in families receiving subsidies does not equate to the population of eligible children in families who are interested in pursuing subsidies or who need them, which can be difficult to predict.
18Throughout this section, we analyzed TRIM3 microsimulation data to estimate the number of eligible children. The estimated number of children who met federal CCDF eligibility requirements had a margin of error equal to +/- 2 percent of the estimate itself. The estimated number of children who met state eligibility policies had a margin of error equal to +/- 3 percent of the estimate itself. The number of children receiving subsidies is from HHS administrative data. 19We calculated our estimates of children eligible for subsidies and children receiving subsidies from three different sources. The data we present on children eligible for subsidies are estimates from TRIM3, a microsimulation model that predicts eligibility based on family characteristics and modeling state eligibility policies in each state. The data we present on children receiving subsidies—for all characteristics except age—are estimates created from HHS’s public use sample data. This sample is drawn from the administrative data HHS collects from the states on the number and characteristics of children that receive CCDF subsidies. We obtained the data we present on subsidy recipients by age from HHS’s full administrative file. 20By Black children, we mean non-Hispanic Black children. We include Hispanic black children in our Hispanic ethnic group.
The Estimated Number and Characteristics of Children Eligible for and Receiving Child Care Subsidies Varies Across States
Page 9 GAO-17-60 Child Care
States have the flexibility to establish specific eligibility policies within broad federal eligibility requirements, and generally fewer families qualify for subsidies after state policies are applied and even fewer receive them.21 According to our analysis, an estimated 14.2 million children were in families who met federal CCDF eligibility requirements for child care subsidies in an average month over calendar years 2011 and 2012.22 When state eligibility policies were applied to this population, an estimated 8.6 million (about 61 percent of the population meeting federal requirements) were eligible.23,24 Moreover, of the 14.2 million children meeting federal requirements, 1.5 million (11 percent) received them (see fig. 1).25
21Other factors, such as demographics, may also influence the size of the eligible population. For example, California and Texas were each estimated to have over a million eligible children in 2011 and 2012 based on their states’ eligibility policies. On the other end of the spectrum, smaller states, such as Montana, North Dakota, and Vermont each had fewer than an estimated 20,000 eligible children. 22The estimated number of children who met federal CCDF eligibility requirements had a margin of error equal to +/- 2 percent of the estimate itself. 23The estimated number of children who met state eligibility policies had a margin of error equal to +/- 3 percent of the estimate itself. The estimated percentage of children meeting federal requirements who met their state’s eligibility policies had a margin of error less than +/- 1.5 percentage points. 24To compare the relative size of the eligible population of children across states, we used children meeting federal eligibility requirements (as identified in the TRIM3 microsimulation model) as our comparison group. We combined average monthly data across two years, 2011 and 2012, to create these estimates. For more information on this methodology, see appendix I. 25The estimated percentage of children meeting federal requirements who received subsidies had a margin of error less than +/- 1 percentage point.
State Policies Influence the Size of the Estimated Population Eligible for Subsidies and Who Receives Them

Page 10 GAO-17-60 Child Care
Figure 1: Percentage of Children Meeting Federal Child Care and Development Fund Requirements Who Met Eligibility Policies in Each State and Percentage Who Received Subsidies
Notes: Figure represents eligibility and subsidy receipt in an average month over 2011-2012. The percentages of children meeting federal requirements who met their state’s eligibility policies are calculated by dividing, for each state, the estimated number of children eligible according to their state policies by the estimated number of children that meet federal requirements. The margins of error (MOE) for most estimates are less than +/- 10 percentage points. The following states had MOEs between 10 and 14 percentage points: AL, LA, MS, TN. The percentages of children meeting federal requirements who receive subsidies are calculated by dividing, for each state, the number of children receiving subsidies in their state by the estimated number of children that meet federal eligibility requirements. The MOEs for 37 states are less than +/- 5 percentage points and the MOEs for the remaining states are at or below +/- 10 percentage points. The nationwide percentages (61% and 11%) had MOEs less than +/- 1.5 percentage points.
Page 11 GAO-17-60 Child Care
The extent to which children meeting federal requirements also met the eligibility policies specific to their states varied widely by state. Figure 1 shows, for example, that in three states (Iowa, Nebraska, and Maryland) under 40 percent of children meeting federal requirements were estimated to be eligible based on their state’s policies; and in three others (Maine, New Mexico, and the District of Columbia), all or nearly all such children were estimated to be eligible. States such as Kansas, New Hampshire, and Pennsylvania were closer to the national percentage, with about 60 percent of children who met federal requirements meeting their state eligibility policies26. The dark portions of the state bars in figure 1 also show that fewer than 25 percent of the estimated children meeting federal eligibility requirements received subsidies in an average month in any state.27 Subsidy receipt ranged from a high of approximately 21 percent of estimated children meeting federal eligibility requirements in New Mexico to a low of approximately 5 percent in Nevada.28
States’ policies include a range of eligibility criteria related to income, employment, and educational activities, among other criteria, which can influence the size of the eligible population in each state.29 It is the
26For Iowa, Nebraska and Maryland, the percent of children meeting federal requirements that met state eligibility policies was 34 percent, 37 percent, and 38 percent, respectively. These estimated percentages each had margins of error of +/- 5 percentage points or less. For Kansas, New Hampshire and Pennsylvania, the percent of children meeting federal requirements that met state eligibility policies was 61 percent, 60 percent, and 58 percent, respectively. These estimated percentages had margins of error of +/- 5 percentage points, +/- 3 percentage points, and +/- 6 percentage points, respectively. In Maine the percent of children meeting federal requirements that met state eligibility policies was 95 percent, with a margin of error of +/- 2 percentage points. In New Mexico and D.C., the percent of children meeting federal requirements that met state eligibility policies was close to 100 percent, with margins of error of less than +/- 1 percentage point. See Appendix I for an explanation of how we calculated the margins of error for New Mexico and D.C. 27While many children who are eligible for CCDF subsidies do not receive them, some get assistance via other federal funds, such as directly from TANF or SSBG funds. 28New Mexico’s estimated percentage had a margin of error of +/- 7.2 percentage points and Nevada’s estimated percentage had a margin of error of +/- 1.9 percentage points. 29The CCDF Policies Database Book of Tables: Key Cross-State Variations in CCDF Policies as of October 1, 2014, OPRE Report 2015-95. There are other types of subsidy policies related to determining eligibility that vary across states, such as age requirements for different groups of children or who is considered part of a family unit. We focus on income, employment, and education as CCDF is dedicated to helping low-income families who are working or engaged in education or training.
Page 12 GAO-17-60 Child Care
interplay of these various policies that influences the size of the eligible population in a given state.
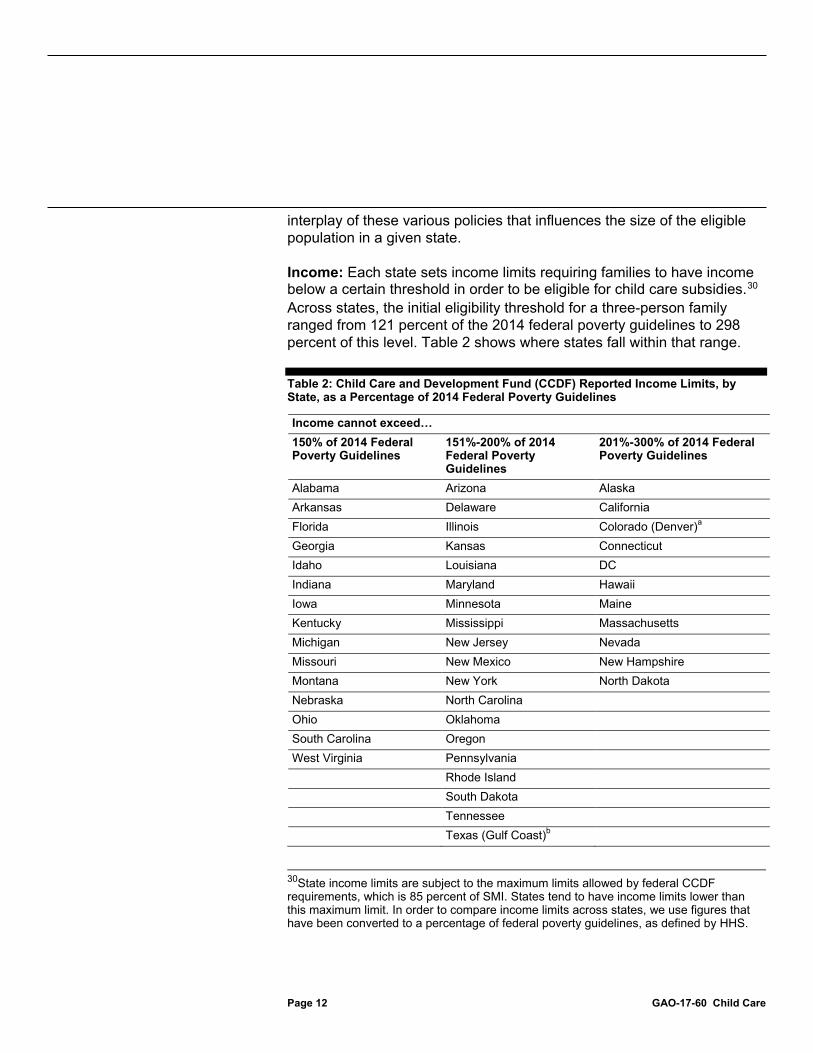
Income: Each state sets income limits requiring families to have income below a certain threshold in order to be eligible for child care subsidies.30 Across states, the initial eligibility threshold for a three-person family ranged from 121 percent of the 2014 federal poverty guidelines to 298 percent of this level. Table 2 shows where states fall within that range.
Table 2: Child Care and Development Fund (CCDF) Reported Income Limits, by State, as a Percentage of 2014 Federal Poverty Guidelines
Income cannot exceed… 150% of 2014 Federal Poverty Guidelines
151%-200% of 2014 Federal Poverty Guidelines
201%-300% of 2014 Federal Poverty Guidelines
Alabama Arizona Alaska Arkansas Delaware California Florida Illinois Colorado (Denver)a Georgia Kansas Connecticut Idaho Louisiana DC Indiana Maryland Hawaii Iowa Minnesota Maine Kentucky Mississippi Massachusetts Michigan New Jersey Nevada Missouri New Mexico New Hampshire Montana New York North Dakota Nebraska North Carolina Ohio Oklahoma South Carolina Oregon West Virginia Pennsylvania Rhode Island South Dakota Tennessee Texas (Gulf Coast)b
30State income limits are subject to the maximum limits allowed by federal CCDF requirements, which is 85 percent of SMI. States tend to have income limits lower than this maximum limit. In order to compare income limits across states, we use figures that have been converted to a percentage of federal poverty guidelines, as defined by HHS.
Page 13 GAO-17-60 Child Care
Income cannot exceed… 150% of 2014 Federal Poverty Guidelines
151%-200% of 2014 Federal Poverty Guidelines
201%-300% of 2014 Federal Poverty Guidelines
Utah Vermont Virginia (Selected
counties)c
Washington Wisconsin Wyoming 15 states 25 states 11 states
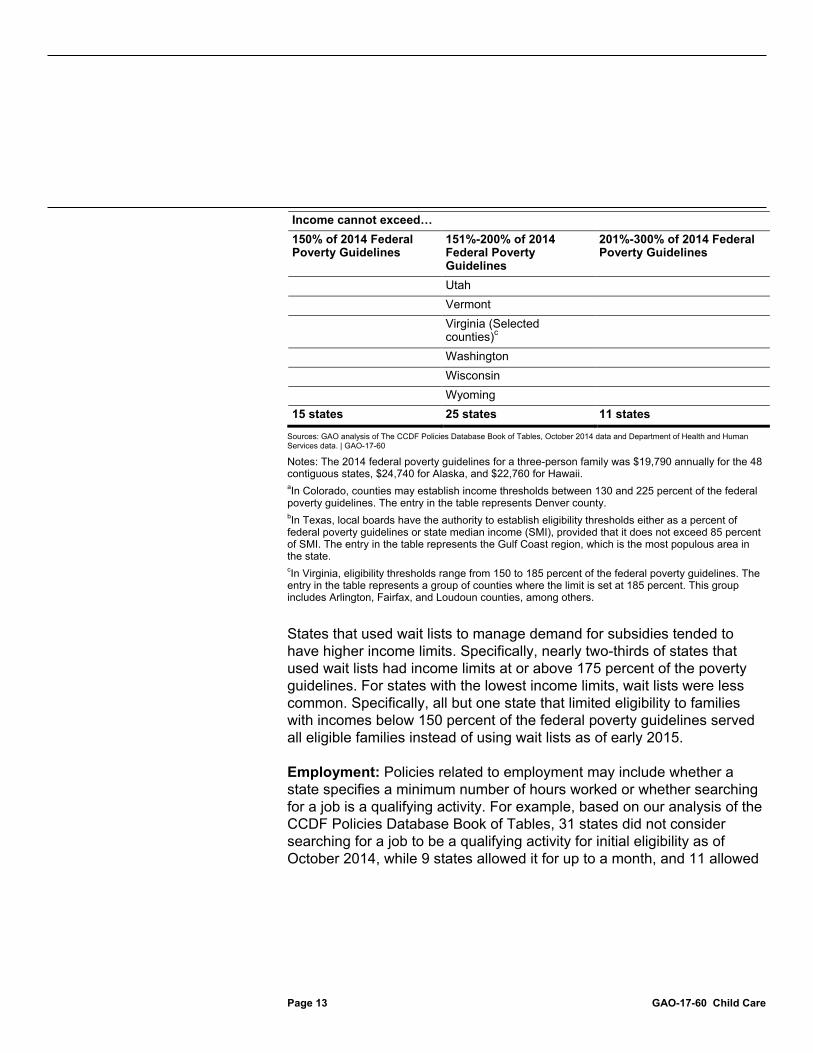
Sources: GAO analysis of The CCDF Policies Database Book of Tables, October 2014 data and Department of Health and Human Services data. | GAO-17-60
Notes: The 2014 federal poverty guidelines for a three-person family was $19,790 annually for the 48 contiguous states, $24,740 for Alaska, and $22,760 for Hawaii. aIn Colorado, counties may establish income thresholds between 130 and 225 percent of the federal poverty guidelines. The entry in the table represents Denver county. bIn Texas, local boards have the authority to establish eligibility thresholds either as a percent of federal poverty guidelines or state median income (SMI), provided that it does not exceed 85 percent of SMI. The entry in the table represents the Gulf Coast region, which is the most populous area in the state. cIn Virginia, eligibility thresholds range from 150 to 185 percent of the federal poverty guidelines. The entry in the table represents a group of counties where the limit is set at 185 percent. This group includes Arlington, Fairfax, and Loudoun counties, among others.
States that used wait lists to manage demand for subsidies tended to have higher income limits. Specifically, nearly two-thirds of states that used wait lists had income limits at or above 175 percent of the poverty guidelines. For states with the lowest income limits, wait lists were less common. Specifically, all but one state that limited eligibility to families with incomes below 150 percent of the federal poverty guidelines served all eligible families instead of using wait lists as of early 2015.
Employment: Policies related to employment may include whether a state specifies a minimum number of hours worked or whether searching for a job is a qualifying activity. For example, based on our analysis of the CCDF Policies Database Book of Tables, 31 states did not consider searching for a job to be a qualifying activity for initial eligibility as of October 2014, while 9 states allowed it for up to a month, and 11 allowed
Page 14 GAO-17-60 Child Care
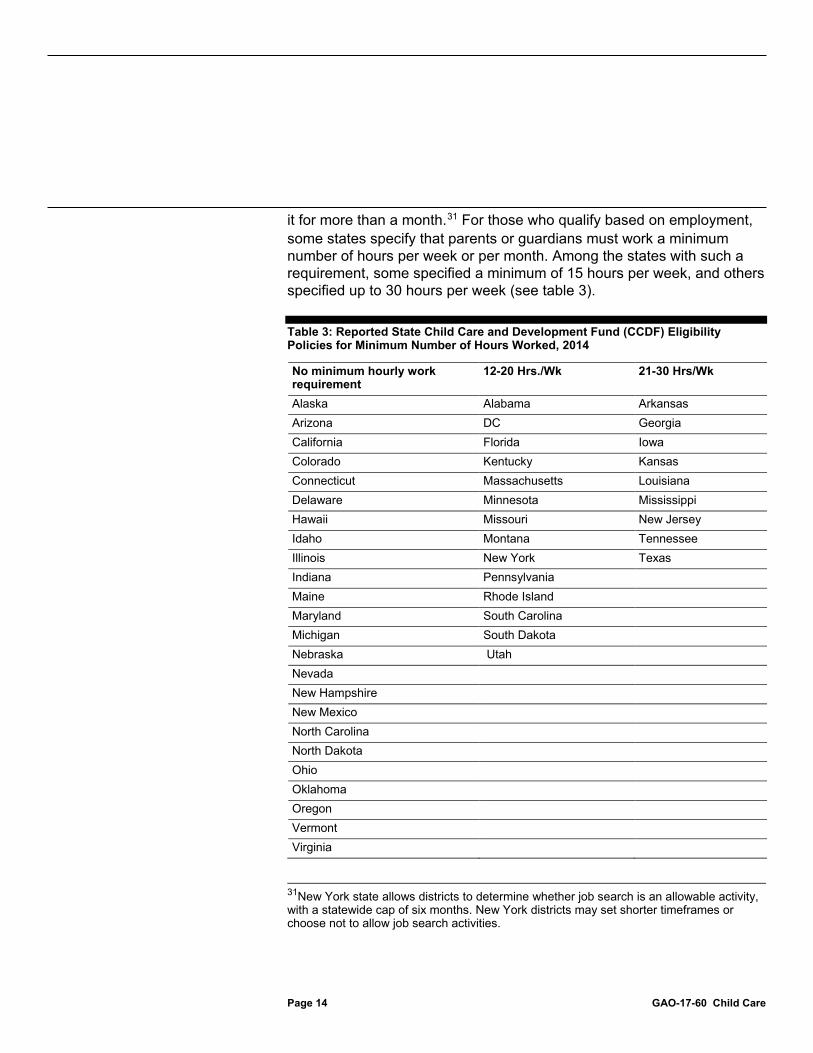
it for more than a month.31 For those who qualify based on employment, some states specify that parents or guardians must work a minimum number of hours per week or per month. Among the states with such a requirement, some specified a minimum of 15 hours per week, and others specified up to 30 hours per week (see table 3).
Table 3: Reported State Child Care and Development Fund (CCDF) Eligibility Policies for Minimum Number of Hours Worked, 2014
No minimum hourly work requirement
12-20 Hrs./Wk 21-30 Hrs/Wk
Alaska Alabama Arkansas Arizona DC Georgia California Florida Iowa Colorado Kentucky Kansas Connecticut Massachusetts Louisiana Delaware Minnesota Mississippi Hawaii Missouri New Jersey Idaho Montana Tennessee Illinois New York Texas Indiana Pennsylvania Maine Rhode Island Maryland South Carolina Michigan South Dakota Nebraska Utah Nevada New Hampshire New Mexico North Carolina North Dakota Ohio Oklahoma Oregon Vermont Virginia
31New York state allows districts to determine whether job search is an allowable activity, with a statewide cap of six months. New York districts may set shorter timeframes or choose not to allow job search activities.
Page 15 GAO-17-60 Child Care
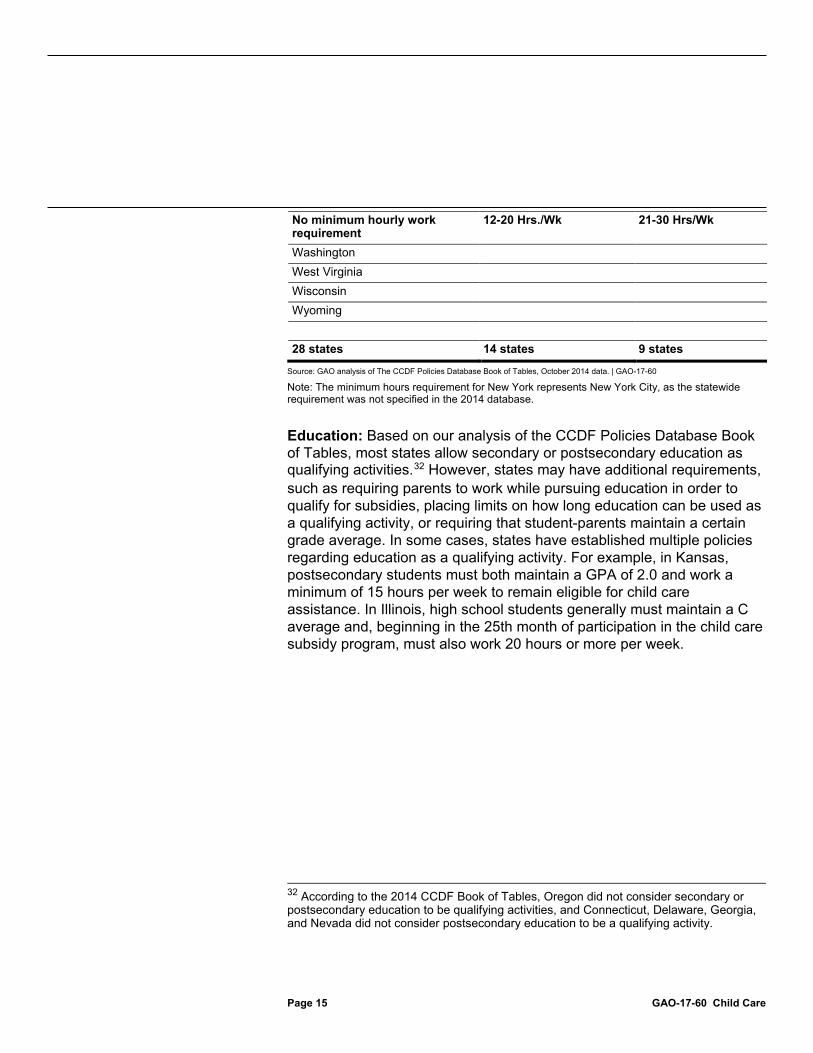
No minimum hourly work requirement
12-20 Hrs./Wk 21-30 Hrs/Wk
Washington West Virginia Wisconsin Wyoming 28 states 14 states 9 states
Source: GAO analysis of The CCDF Policies Database Book of Tables, October 2014 data. | GAO-17-60
Note: The minimum hours requirement for New York represents New York City, as the statewide requirement was not specified in the 2014 database.
Education: Based on our analysis of the CCDF Policies Database Book of Tables, most states allow secondary or postsecondary education as qualifying activities.32 However, states may have additional requirements, such as requiring parents to work while pursuing education in order to qualify for subsidies, placing limits on how long education can be used as a qualifying activity, or requiring that student-parents maintain a certain grade average. In some cases, states have established multiple policies regarding education as a qualifying activity. For example, in Kansas, postsecondary students must both maintain a GPA of 2.0 and work a minimum of 15 hours per week to remain eligible for child care assistance. In Illinois, high school students generally must maintain a C average and, beginning in the 25th month of participation in the child care subsidy program, must also work 20 hours or more per week.
32 According to the 2014 CCDF Book of Tables, Oregon did not consider secondary or postsecondary education to be qualifying activities, and Connecticut, Delaware, Georgia, and Nevada did not consider postsecondary education to be a qualifying activity.
Page 16 GAO-17-60 Child Care
According to our analysis, of the 8.6 million children estimated to be eligible for subsidies in an average month in years 2011-2012, about 1.5 million of them received subsidies.33,34 Our analysis of HHS and TRIM3 data shows that children whose families receive child care subsidies have different levels of family income and other characteristics compared to the population of children whose families are potentially eligible for subsidies based on the policies in their states.35 These differences include lower levels of family income, younger ages of children, and differences in family structure and racial composition. According to state child care officials, a difference such as lower family income may in part reflect state policies that target limited subsidies to this priority population. According to stakeholders, a difference such as lower levels of subsidy receipt among Hispanics may reflect barriers to accessing the program.
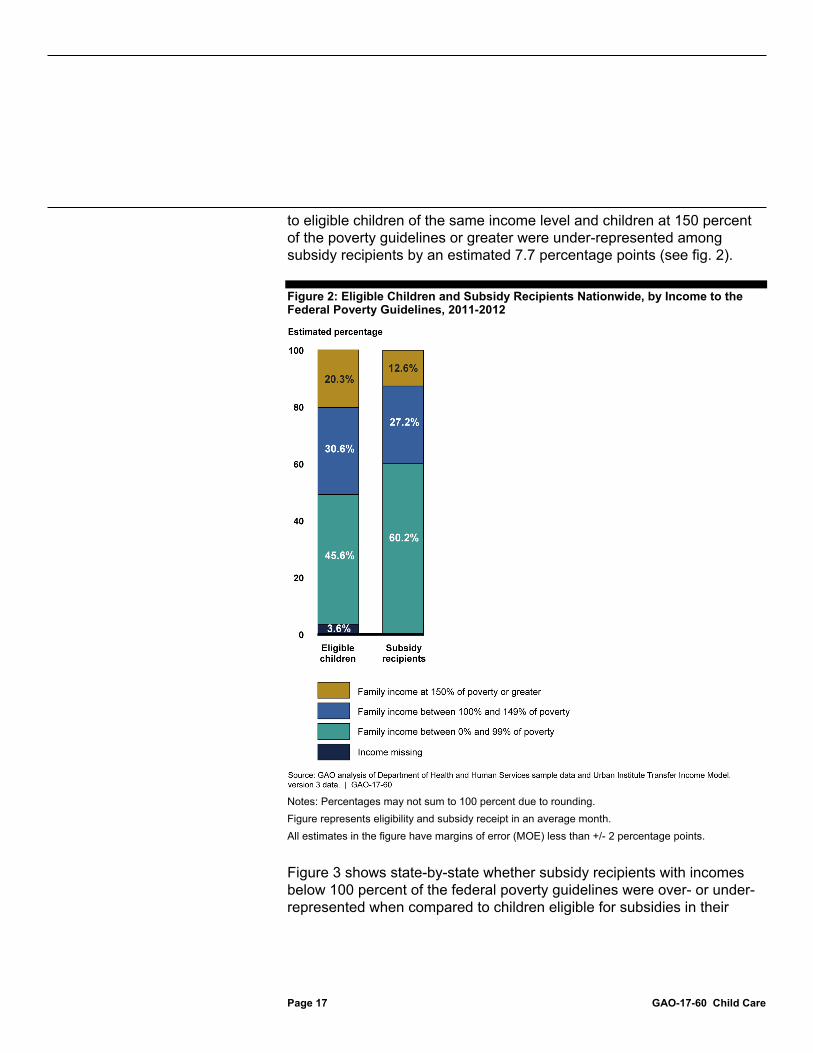
Subsidy recipients are substantially poorer than the overall population of children eligible for subsidies, according to our analysis. Nationwide, children who lived in families with incomes below 100 percent of the federal poverty guidelines were over-represented among subsidy recipients by an estimate of nearly 15 percentage points when compared to eligible children who lived in families with incomes at this same level.36 In contrast, children in families with incomes between 100 percent and 149 percent of the poverty guidelines were under-represented among subsidy recipients by an estimated 3.4 percentage points when compared
33While many children who are eligible for CCDF subsidies do not receive them, some get assistance via other federal funds, such as directly from TANF or SSBG funds. 34We calculated our estimates of children eligible for subsidies and children receiving subsidies from 3 different sources. The data we present on children eligible for subsidies are estimates from TRIM3, a microsimulation model that predicts eligibility based on family characteristics and modeling state eligibility policies in each state. The data we present on children receiving subsidies— for all characteristics except age—are estimates created from HHS’s public use sample data. This sample is drawn from the administrative data HHS collects from the states on the number and characteristics of children that receive CCDF subsidies. We obtained the data we present on subsidy recipients by age from HHS’s full administrative file. 35We refer to children in families who receive subsidies as subsidy recipients and children in families eligible for subsidies as eligible children. 36Throughout this report, when differences are statistically significant, we state that groups of children are over-represented or under-represented in the subsidy population relative to the population of eligible children. In this case, children with family incomes below 100 percent of the federal poverty guidelines are over-represented among subsidy recipients at the national level because the proportion of children at this income level is significantly higher among subsidy recipients than in the population of eligible children.
Children Eligible for Subsidies and Those Receiving Them Differ in Terms of Family Income, Family Structure, and Minority Status
Page 17 GAO-17-60 Child Care
to eligible children of the same income level and children at 150 percent of the poverty guidelines or greater were under-represented among subsidy recipients by an estimated 7.7 percentage points (see fig. 2).
Figure 2: Eligible Children and Subsidy Recipients Nationwide, by Income to the Federal Poverty Guidelines, 2011-2012
Notes: Percentages may not sum to 100 percent due to rounding. Figure represents eligibility and subsidy receipt in an average month. All estimates in the figure have margins of error (MOE) less than +/- 2 percentage points.
Figure 3 shows state-by-state whether subsidy recipients with incomes below 100 percent of the federal poverty guidelines were over- or under- represented when compared to children eligible for subsidies in their
Page 18 GAO-17-60 Child Care
states. Statistically significant results were available for 38 out of 50 states that had reliable data. 37 In 35 of these states, subsidy recipients were poorer when compared to eligible children and, in 3 states, subsidy recipients tended to have higher incomes than eligible children. The differences had a wide range. In one state, New Hampshire, an estimated 38 percentage point difference exists because an estimated 55.8 percent of subsidy recipients were below the poverty guidelines, compared to an estimated 17.5 percent of eligible children. In another, Indiana, an estimated 57 percent of subsidy recipients were below the poverty guidelines, compared to an estimated 76 percent of eligible children, resulting in a negative estimated 19 percentage point difference.
37Throughout this report, we consider HHS administrative data unreliable for a particular characteristic in a state when 15 percent or more of the values are missing. We also consider TRIM3 estimates and estimates from HHS sample data unreliable for a particular characteristic in a state when the MOE exceed 15 percentage points.

Page 19 GAO-17-60 Child Care
Figure 3: Eligible Children and Subsidy Recipients with Family Income Less Than 100 Percent of the Federal Poverty Guidelines, 2011-2012
Notes: Figure represents eligibility and subsidy receipt in an average month. Displayed state estimates for percent subsidy recipients and eligible children have margins of error (MOE) less than +/- 15 percentage points. One state was excluded from this graph because its MOE exceeded this threshold.
These differences may reflect, in part, states targeting subsidies to the lowest income families when states are unable to serve all eligible families that apply. Several state officials participating in our group interviews, for example, told us that they target their programs to those most in need, including those with the lowest income. Moreover, in their
Page 20 GAO-17-60 Child Care
Issue Brief on eligibility and receipt of CCDF subsidies, HHS suggests that states target subsidies to families with the lowest incomes.38
Subsidy recipients tended to be younger than the overall population of eligible children, according to our analysis. Nationwide, subsidy recipients age 2 to 4 years old were over-represented by an estimated 17 percentage points when compared to eligible children of the same age. Subsidy recipients under age 2 were also over-represented, but by an estimate of less than 2 percentage points. In contrast, older children were under-represented among subsidy recipients by an estimated 18 percentage points when compared to eligible children of the same age (see fig. 4).
38See Department of Health and Human Services, Office of the Assistant Secretary for Planning and Evaluation (ASPE), ASPE Issue Brief: Estimates of Child Care Eligibility and Receipt for Fiscal Year 2012 (November 2015), pp.1 and 7.
Page 21 GAO-17-60 Child Care
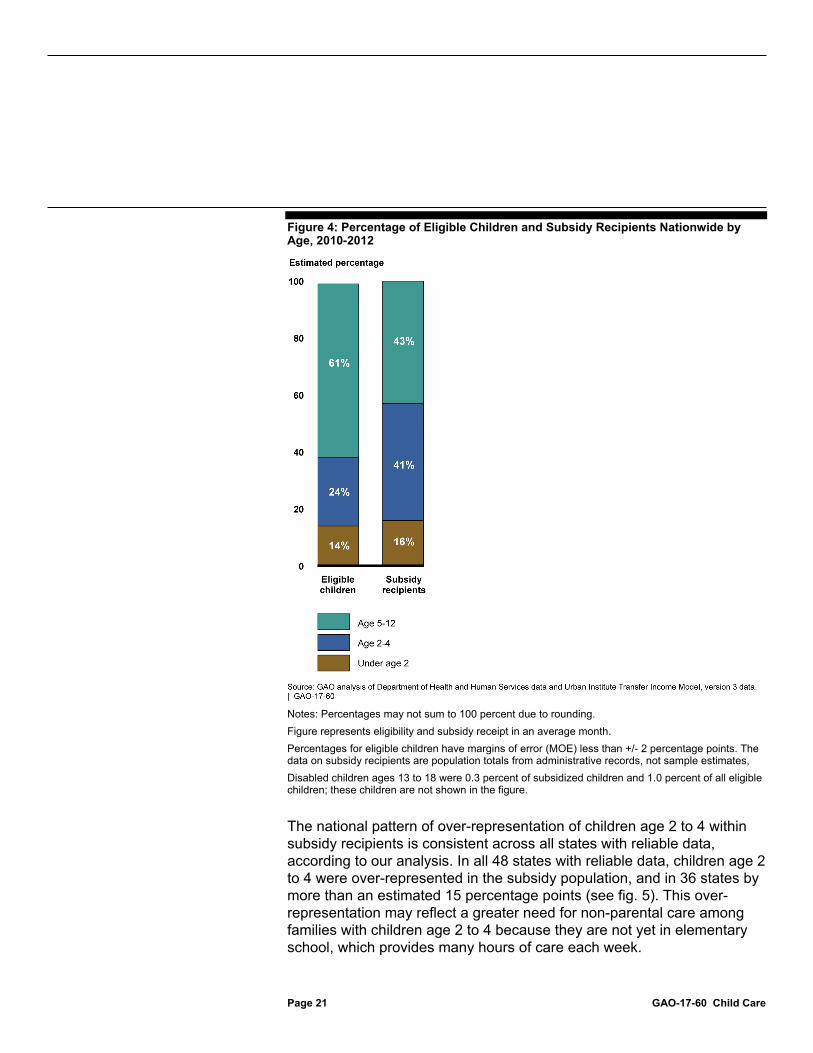
Figure 4: Percentage of Eligible Children and Subsidy Recipients Nationwide by Age, 2010-2012
Notes: Percentages may not sum to 100 percent due to rounding. Figure represents eligibility and subsidy receipt in an average month. Percentages for eligible children have margins of error (MOE) less than +/- 2 percentage points. The data on subsidy recipients are population totals from administrative records, not sample estimates, Disabled children ages 13 to 18 were 0.3 percent of subsidized children and 1.0 percent of all eligible children; these children are not shown in the figure.
The national pattern of over-representation of children age 2 to 4 within subsidy recipients is consistent across all states with reliable data, according to our analysis. In all 48 states with reliable data, children age 2 to 4 were over-represented in the subsidy population, and in 36 states by more than an estimated 15 percentage points (see fig. 5). This over-representation may reflect a greater need for non-parental care among families with children age 2 to 4 because they are not yet in elementary school, which provides many hours of care each week.

Page 22 GAO-17-60 Child Care
Figure 5: Eligible Children and Subsidy Recipients Age 2 to 4 Years Old, 2010-2012
Notes: Figure represents eligibility and subsidy receipt in an average month. Displayed state estimates for percent eligible children have margins of error (MOE) less than +/- 15 percentage points. The data on subsidy recipients are population totals from administrative records, not sample estimates.
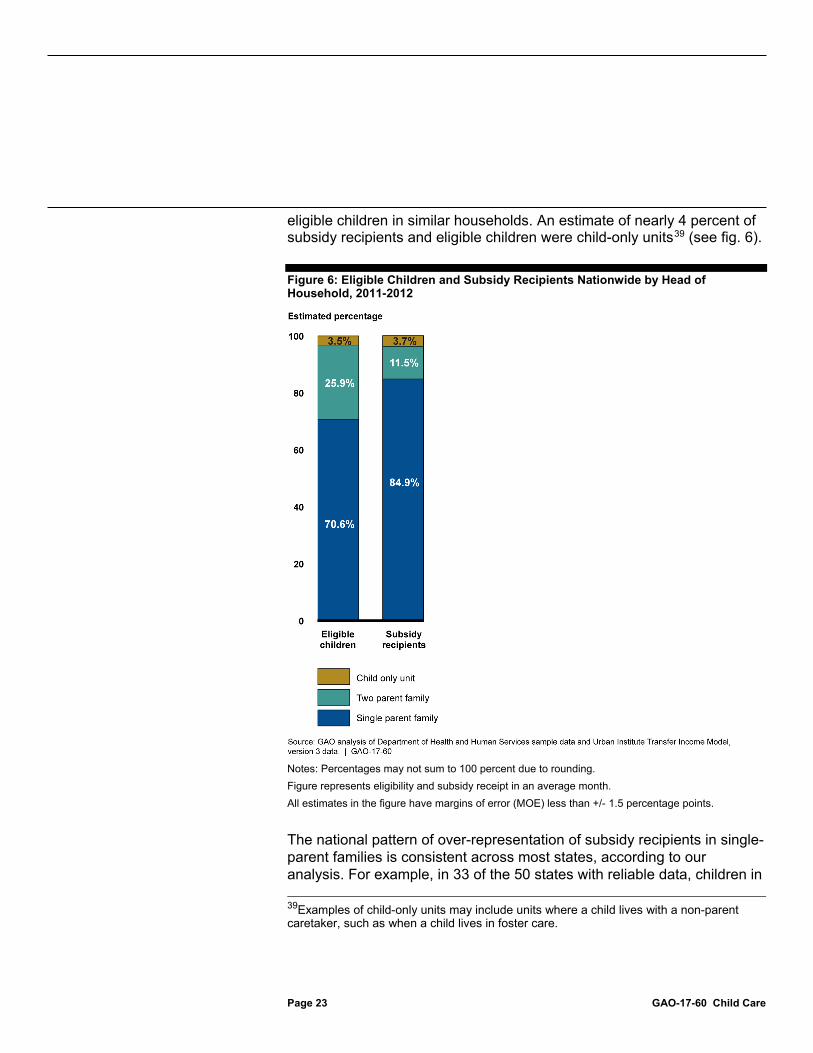
Subsidy recipients tended to live in single-parent households to a greater extent than the overall population of eligible children, according to our analysis. Nationwide, subsidy recipients who lived in single-parent households were over-represented by an estimated 14 percentage points when compared to eligible children in similar households. In contrast, subsidy recipients who lived in two parent households were under-represented by an estimated 14 percentage points when compared to
Page 23 GAO-17-60 Child Care
eligible children in similar households. An estimate of nearly 4 percent of subsidy recipients and eligible children were child-only units39 (see fig. 6).
Figure 6: Eligible Children and Subsidy Recipients Nationwide by Head of Household, 2011-2012
Notes: Percentages may not sum to 100 percent due to rounding. Figure represents eligibility and subsidy receipt in an average month. All estimates in the figure have margins of error (MOE) less than +/- 1.5 percentage points.
The national pattern of over-representation of subsidy recipients in single-parent families is consistent across most states, according to our analysis. For example, in 33 of the 50 states with reliable data, children in 39Examples of child-only units may include units where a child lives with a non-parent caretaker, such as when a child lives in foster care.
Page 24 GAO-17-60 Child Care
single-parent families were over-represented among subsidy recipients when compared to the population of eligible children, in one state they were under-represented, and in the remaining 16 states the results were not statistically significant. The differences have a wide range, but exceed an estimated 20 percentage points in 14 states. At one end of the range, Wyoming, an estimated 43 percentage point difference exists because an estimated 99 percent of subsidy recipients lived in single- parent families, compared to an estimated 56 percent of eligible children (see fig. 7). One reason single-parent households may be over-represented is that our analysis showed that such households tended to have lower incomes than two parent households40 and, as told to us by some state child care officials and reported by HHS, states often try to target their subsidy programs toward families with the lowest incomes. 41
40Our analysis showed that nationally, subsidized children in single-parent families were more likely to be in poverty than subsidized children in two-parent families. 41See Department of Health and Human Services, Office of the Assistant Secretary for Planning and Evaluation (ASPE), ASPE Issue Brief: Estimates of Child Care Eligibility and Receipt for Fiscal Year 2012 (November 2015), p.1.

Page 25 GAO-17-60 Child Care
Figure 7: Eligible Children and Subsidy Recipients in Single-Parent Families, 2011-2012
Notes: Figure represents eligibility and subsidy receipt in an average month. Displayed state estimates for percent subsidy recipients and eligible children have margins of error (MOE) less than +/- 15 percentage points. One state is excluded from this graph because its MOE exceeded this threshold.
Nationwide, our analysis showed subsidy recipients were more frequently Black, and less frequently of other racial or ethnic groups, when compared to the population of children eligible for subsidies. Black children were over-represented among subsidy recipients by an estimated 17 percentage points when compared to eligible Black children. In contrast, Hispanic children were under-represented to a large degree among subsidy recipients (an estimated 15 percentage points when compared to eligible Hispanic children) and White children were slightly

Page 26 GAO-17-60 Child Care
under-represented (an estimated 2 percentage points when compared to eligible White children)42 (see fig. 8).
Figure 8: Eligible Children and Subsidy Recipients by Race and Ethnicity, 2010-2012
Notes: Percentages may not sum to 100 percent due to rounding. Figure represents eligibility and subsidy receipt in an average month. All estimates in the figure have margins of error (MOE) less than +/- 1.5 percentage points. aAsians were 3 percent of eligible children and 1 percent of subsidy recipients; American Indians were 1 percent of eligible children and 1 percent of subsidy recipients; multi-racial children were 4 percent
42By White children, we mean non-Hispanic White children. We include Hispanic White children in our Hispanic ethnic group.
Page 27 GAO-17-60 Child Care
of eligible children and 2 percent of subsidy recipients; and Hawaiian/Pacific Islanders were less than 1 percent of eligible children and 1 percent of subsidy recipients. The MOE on all of these estimates are less than 1 percentage point.
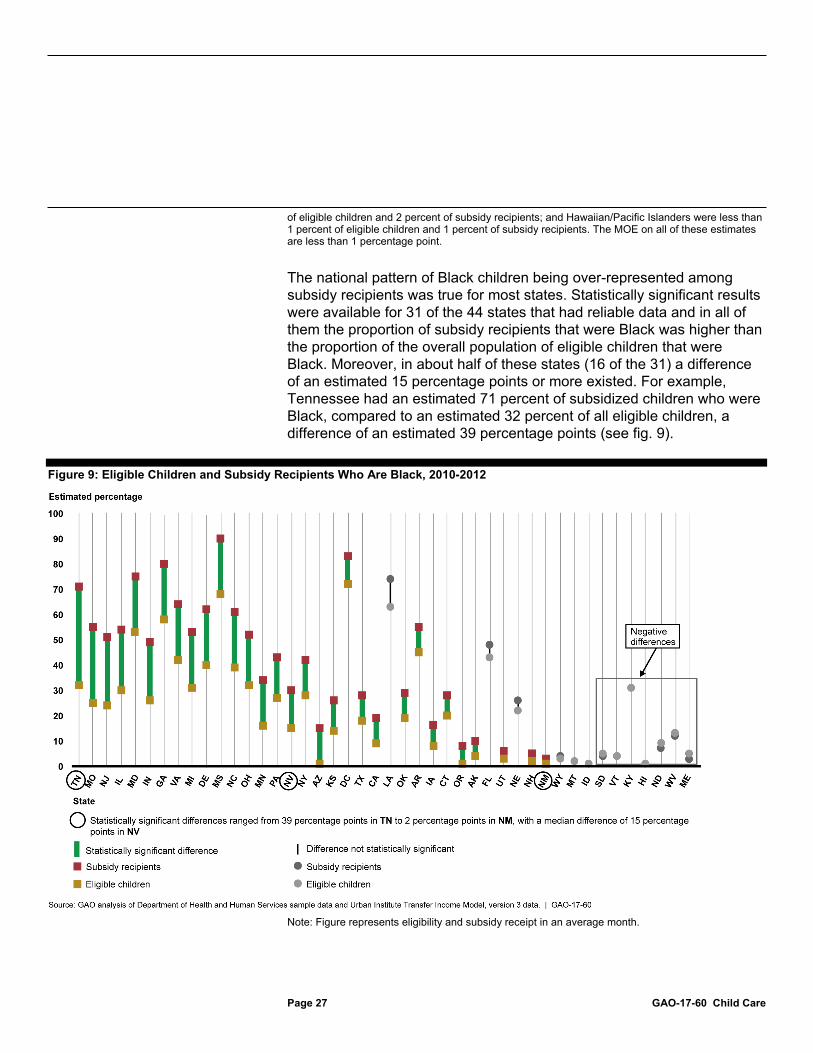
The national pattern of Black children being over-represented among subsidy recipients was true for most states. Statistically significant results were available for 31 of the 44 states that had reliable data and in all of them the proportion of subsidy recipients that were Black was higher than the proportion of the overall population of eligible children that were Black. Moreover, in about half of these states (16 of the 31) a difference of an estimated 15 percentage points or more existed. For example, Tennessee had an estimated 71 percent of subsidized children who were Black, compared to an estimated 32 percent of all eligible children, a difference of an estimated 39 percentage points (see fig. 9).
Figure 9: Eligible Children and Subsidy Recipients Who Are Black, 2010-2012
Note: Figure represents eligibility and subsidy receipt in an average month.

Page 28 GAO-17-60 Child Care
Displayed state estimates for percent subsidy recipients and eligible children have margins of error (MOE) less than +/- 15 percentage points. Seven states are excluded from this graph because their MOEs exceeded this threshold.
Nationally, Black children that received subsidies more often lived in single-parent households and in families with very low income than White and Hispanic children, according to our analysis of HHS and TRIM3 data. This may partially explain why Blacks are over-represented among subsidy recipients.
The national pattern of Hispanic children being under-represented among subsidy recipients was true in many states, according to our analysis. Statistically significant results were available for 23 out of 44 states that had reliable data and Hispanic children were under-represented among subsidy recipients in all but 1 of these 23 states. In 11 of them, the difference was about an estimated 10 percentage points or higher. In the 1 state where Hispanic children were over-represented among subsidy recipients, New Mexico, Hispanic children made up an estimated 75 percent of subsidy recipients and an estimated 63 percent of eligible children (see fig. 10).

Page 29 GAO-17-60 Child Care
Figure 10: Eligible Children and Subsidy Recipients Who Are Hispanic, 2010-2012
Notes: Figure represents eligibility and subsidy receipt in an average month. Displayed state estimates for percent subsidy recipients and eligible children have margins of error (MOE) less than +/- 15 percentage points. Seven states are excluded from this graph because their MOEs exceeded this threshold.
The lower level of subsidy receipt among Hispanics in many states may reflect differing preferences for child care or barriers to accessing child care subsidies, or both. Some Hispanic families may be getting their child care needs met through other means, such as Head Start and universal pre-school programs. Stakeholders said that families without immigration documentation may have concerns if they encounter application forms that request Social Security Numbers or live in states that give priority to families receiving TANF because this program can require verification of immigration status. Finally, navigating the complexity of eligibility requirements may be particularly difficult for families with limited English

Page 30 GAO-17-60 Child Care
proficiency, which we and others have also highlighted in previous reports.43
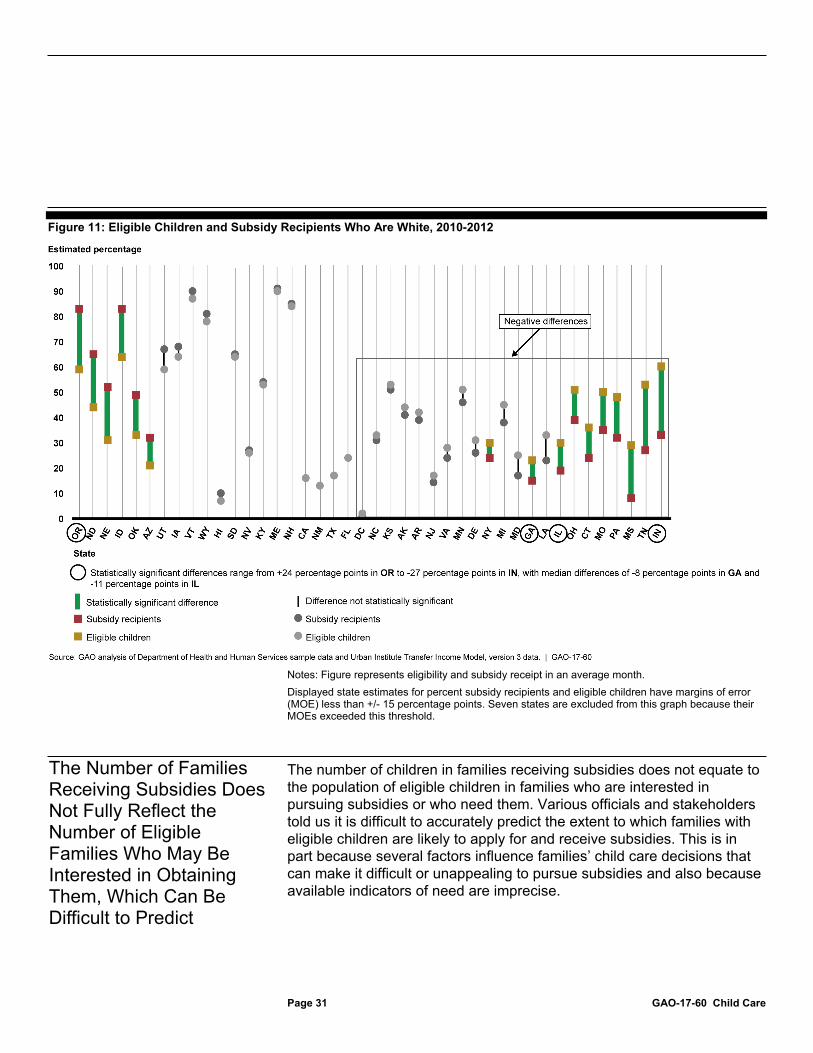
The national pattern of White children being under-represented among subsidy recipients was true in some, but not all states. In 26 of the 42 states that had reliable data, Whites were neither over nor under-represented—the differences were not statistically significant. Statistically significant results were available for 16 out of 42 states that had reliable data. In 10 of these 16 states, White children were under-represented, most commonly by more than an estimated 10 percentage points among subsidy recipients when compared to the eligible children in their states. In another 6 states, the reverse was true—with White children being over-represented, by more than an estimated 10 percentage points (see fig 11).44
43See GAO, Means-Tested Programs: Information on Program Access Can Be an Important Management Tool, GAO-05-221 (Washington, D.C.: Mar. 11, 2005), and Gina Adams and Hannah Matthews, Confronting the Child Care Eligibility Maze: Simplifying and Aligning with Other Work Supports (The Urban Institute and, CLASP, December 2013). 44We do not conduct state-level analysis on Asians, Native Americans, or Hawaiian/Pacific Islanders due to small sample sizes.
Page 31 GAO-17-60 Child Care
Figure 11: Eligible Children and Subsidy Recipients Who Are White, 2010-2012
Notes: Figure represents eligibility and subsidy receipt in an average month. Displayed state estimates for percent subsidy recipients and eligible children have margins of error (MOE) less than +/- 15 percentage points. Seven states are excluded from this graph because their MOEs exceeded this threshold.
The number of children in families receiving subsidies does not equate to the population of eligible children in families who are interested in pursuing subsidies or who need them. Various officials and stakeholders told us it is difficult to accurately predict the extent to which families with eligible children are likely to apply for and receive subsidies. This is in part because several factors influence families’ child care decisions that can make it difficult or unappealing to pursue subsidies and also because available indicators of need are imprecise.
The Number of Families Receiving Subsidies Does Not Fully Reflect the Number of Eligible Families Who May Be Interested in Obtaining Them, Which Can Be Difficult to Predict

Page 32 GAO-17-60 Child Care
Factors affecting families’ decisions include information, program policies, and supply issues, according to stakeholders and officials we spoke with, in addition to some relevant studies we reviewed.
Information: Lack of awareness of the subsidies could prevent families from applying, in addition to misinformation about eligibility criteria and perceptions of limited availability of subsidies.45
Program policies and procedures: Some families may be unable or unwilling to manage the administrative burden associated with applying for the subsidy, which could include in-person meetings, dealing with multiple benefit systems such as TANF, and other bureaucratic procedures. Moreover, a family’s eligibility status may have changed after a potentially lengthy approval process. In addition, the amount of the co-payment or the low amount of the subsidy may be a deterrent. HHS officials noted that these types of state policies can affect demand for child care subsidies because the more challenging it is to receive and maintain a subsidy, the less likely families are to want one.
Supply issues: The availability of appropriate care options is interrelated with subsidy demand in that some families may not apply if they know there are no viable child care options in their area that accept subsidies or that can care for children with special circumstances (e.g., behavioral or developmental needs, non-English speakers).46
In addition to the complex interplay of factors influencing families’ child care decisions, there are various indicators officials use to help estimate how many families are likely to receive subsidies. At a national level, HHS monitors need for child care subsidies in part by calculating coverage rates. Coverage rates estimate the extent to which children who may meet eligibility criteria actually receive subsidies. HHS estimated this rate at 15 percent of children meeting federal eligibility requirements in fiscal
45Heather Hahn, et al., “Supporting the Child Care and Workforce Development Needs of TANF Families” (Urban Institute, 2016); Julia Isaacs, et al., “Review of Child Care Needs of Eligible Families in Massachusetts” (Urban Institute, 2015); Hannah Matthews and Danielle Ewen, “Early Education Programs and Children of Immigrants: Learning Each Other’s Language” (Urban Institute, 2010). 46Heather Hahn, et al., “Supporting the Child Care and Workforce Development Needs of TANF Families” (Urban Institute, 2016); Julia Isaacs, et al., “Review of Child Care Needs of Eligible Families in Massachusetts” (Urban Institute, 2015); Sharon Kagan, et al, “Young Children’s Early Experiences: Examining Differences on Long Island” (National Center for Children and Families, 2012).
Page 33 GAO-17-60 Child Care
year 2012 (the most current year available).47 While HHS’s analyses provide some information about the need for child care subsidies, they rely on eligibility estimates and the extent to which eligible families are actually interested in or would apply for subsidies is unknown.
State child care officials we spoke with said that various other indicators can demonstrate whether families need child care subsidies, such as waiting lists, Census data, and surveys. Many state officials—representing 18 of 32 states in our group interviews—said they use their own program data to help assess need. This could include looking at funding allocations and the number of applicants, including those placed on wait lists. In addition, officials representing 10 states told us they used Census data, officials from 7 states said they conducted needs assessments, and 6 worked with other programs to determine the extent of program need. The latter might include sharing data with partner entities (like child care referral agencies and schools), either formally or informally.
Based on their assessments and experience, numerous stakeholders, federal officials, and state officials we spoke with believe unmet need exists. In particular, officials in 26 out of the 32 states that participated in our group interviews told us that there are likely more potentially eligible families than these states can serve. These included officials from 6 of the 12 states we spoke with where all applicants determined eligible received subsidies. This is consistent with the observation that there are an unknown number of potentially eligible families who never apply.
47Coverage rates specifically measure children eligible based on federal CCDF requirements in comparison to those receiving or estimated to receive subsidies from the major federal funding sources that subsidize the cost of child care for low-income working families—CCDF, two sources of TANF funds spent directly on child care, and SSBG. According to HHS, CCDF funds the majority of child care subsidies—roughly two-thirds—with the remaining third coming from other government funding streams, primarily related to TANF (see HHS, Office of the Assistant Secretary for Planning and Evaluation (ASPE), ASPE Issue Brief: Estimates of Child Care Eligibility and Receipt for Fiscal Year 2012 (November 2015). HHS officials told us that while the integrity of the coverage rate model is good, there are some limitations to their estimates. For example, they said there is some mismatch in how work activities are defined under TANF and SSBG, so the model may not pick up potentially eligible recipients who are involved in job searches or TANF work activities. Also, HHS officials said they only estimate coverage rates on a national level since state-by-state data on the number of children served with SSBG, TANF funds spent directly on child care, and TANF maintenance of effort is either not available or not reliable.
Page 34 GAO-17-60 Child Care
Several officials and stakeholders we spoke with cautioned that some of the methods used to estimate need are imperfect indicators. For example, representatives of one large state noted that Census figures and other demographic data can only provide rough estimates and do not reflect the full extent of need. Officials in two other states said these types of data do not include information about key eligibility characteristics or are out of date. Several state officials and stakeholders we spoke with also expressed concerns about using wait lists to measure need for child care subsidies. They noted wait lists can be inaccurate and out of date. Another drawback to using wait lists to assess demand is that they only reflect the population of potentially eligible beneficiaries who actually follow through with their applications, and therefore such lists could underestimate need. On the other hand, wait lists can artificially inflate estimates of need in cases where families’ eligibility status changes or they remain on the wait list even after they have found other child care arrangements.
While the nuances of family decisions and the lack of comprehensive indicators can make it difficult for program officials to more accurately predict subsidy need, the CCDBG Act of 2014 places requirements on states to do so. It requires states as part of their state plan to develop strategies to increase the supply of child care services for certain groups, such as children with disabilities, children in under-served areas, infants and toddlers, and children who receive care during nontraditional hours.48 In its 2015 guidance about how to do this, HHS encourages states to use data to assess need and identify supply shortages, for example by assessing where low-income families live and where high-quality child care providers are located.49 This would provide information about the gap between the existing supply of child care and the population that is likely to need access to this care. The guidance also suggests that states leverage existing data from market rate surveys, referral agencies, and other agencies that conduct needs assessments, such as the Maternal and Infant Early Childhood Home Visitation Program and Head Start. HHS advises states to consider the unmet needs that are most pressing in a particular area and, accordingly, create an appropriate strategy for building supply.
48Pub. L. No. 113-186, § 5(b)(2)(C), 128 Stat. 1971, 1978 (adding 42 U.S.C. § 9858c(c)(2)(M)). 49CCDF-ACF-IM-2015-02, Issuance Date November 6, 2015.
Page 35 GAO-17-60 Child Care
Wait lists are a common way that states manage their caseloads when more families qualify for subsidies than states can fund. Of the 33 states that had wait list policies at the end of 2014, 19 used wait lists at the start of 2015 and the others did not, according to the National Women’s Law Center (NWLC).50 The results of our group interviews showed that states manage wait lists in a variety of ways. For example:
Number of lists: Of the 19 states that used wait lists in 2015, 10 states had a single statewide wait list and the remaining 9 states had more than one list at a sub-state level, according to state child care officials who participated in our group interviews. With the exception of New York and California, all wait list states can report the number of children on their wait lists statewide.51 State child care officials from states with multiple wait lists also said that these states can have a mix of statewide and sub-state policies regarding how to develop and manage their lists.
50For the 33 states with wait list policies, see CCDF Policies Database Book of Tables, (October 2014). For the 19 states that used wait lists, see Building Blocks: State Child Care Assistance Policies 2015. The National Women’s Law Center (NWLC) surveys state child care administrators annually on 5 key policy areas related to child care subsidies, including wait lists, and presents this information in annual reports. GAO reviewed the methodology section of the 2015 report and interviewed relevant NWLC staff about how they conduct their surveys. We determined that the information in this report is sufficiently reliable for our purposes. We did not independently verify the information in the NWLC report. State child care officials from all 19 wait list states participated in our group interviews. 51The NWLC collects data annually on the number of children states place on waiting lists from all states except California and New York. Because of differences in how states develop and manage their wait lists, however, this data is not comparable state-to-state. In its 2015 report, the number of children on waits lists ranged from 45 in Colorado to 51 thousand in Florida. Ten of the 19 wait list states had between 900 to just over 9000 children on their wait list. See Building Blocks: State Child Care Assistance Policies 2015, table 2, p. 26.
States Use Wait Lists and Other Methods to Help Determine Which Eligible Families Receive Subsidies
Although a Common Method for Managing Caseloads, States Find Wait Lists Challenging to Administer
Page 36 GAO-17-60 Child Care
Eligibility determination: Some states require full eligibility determinations prior to placing children on wait lists for subsidies and other states do not have such a requirement. Child care officials in 5 of the 19 states that used wait lists in 2015 told us, for example, that their states require full eligibility determinations prior to wait listing children, whereas officials in 11 other states said that they either rely solely on self-reported information or partial eligibility screenings prior to wait listing children.52
Periodic review: States also varied in whether and how often they require agencies to review their wait lists. Many states require reviews at set intervals to ensure that those on the list continue to be eligible for and want subsidies, and others do not require these reviews. According to state child care officials, reviews tend to consist of sending letters to families asking if they want to remain on the list. Of the 19 wait list states that participated in our group interviews, officials from 13 mentioned that their states require periodic reviews of wait lists and 6 others said that periodic reviews are either not required or left to the discretion of the local entities administering the subsidy programs in their states.
HHS officials and state child care officials knowledgeable about wait lists told us that wait lists can be a valuable tool for managing caseloads and expenditures. Child care officials from 14 states that participated in our group interviews mentioned, for example, that one benefit of wait lists is that they track children eligible or likely to be eligible for a subsidy and who is next in line to receive one. Such tracking is important because these policies can be complex and, according to HHS guidance and a child care subsidy stakeholder, states often prioritize the types of children eligible for subsidies to ensure that they serve those most in need. Two officials told us, for example, that their wait lists help manage caseloads by ensuring that families with higher priorities for service (such as those most in need) are served before families with lower priorities. Child care officials in 10 states also mentioned that these lists provide insight into where additional funds may be needed in their states. Two officials mentioned, for example, that their lists help them determine whether funds should be reallocated from one county to another.
52Officials in the remaining 3 states did not address whether full eligibility determinations were required prior to wait listing children. They did say, however, that wait list policies tended to be left to the discretion of the local entities administering the subsidy programs in their states.
Page 37 GAO-17-60 Child Care
Few families on wait lists may end up receiving subsidies, according to state child care officials and other child care stakeholders knowledgeable about wait lists. This may occur when wait listed families experience changes in circumstances that cause them to either no longer want subsidies or make them ineligible. State officials from 15 wait list states who participated in our group interviews characterized the number of wait listed families that eventually received subsidies as small or they estimated that no more than 50 percent of wait listed families received subsidies. One official told us that historically about 17 to 20 percent of families on her state’s wait list apply for subsidies in response to notifications they receive that funds are available. At the other end of the range, one state official said that most wait listed families in her state eventually receive subsidies and she attributed this to her state adequately funding child care subsidies.
Wait lists can be challenging to administer. Because few families placed on wait lists may receive subsidies, it can be difficult to manage wait lists in a way that is not overly resource- and time-intensive for the agency administering the subsidy program nor overly burdensome for families who want to remain on the list to be able to do so. State child care officials from 23 of the 32 states that participated in our group interviews, for example, reported various challenges, such as being able to easily contact wait listed families and ensuring that they continued to want and qualify for subsidies. In its technical assistance on wait lists, HHS echoes similar views, saying that wait lists become inefficient when they take significant resources to establish and maintain. Specific challenges include:
Keeping wait lists current and accurate: Two challenges that HHS officials, stakeholders, and state officials participating in our group interviews mentioned were ensuring that families on the wait list: (1) could be easily contacted and (2) continued to qualify for and want child care subsidies. According to child care officials in 11 states, for example, without accurate information it is difficult to contact families to see if they want to remain on the list or want a subsidy should one become available. One state official estimated for example, that her state gets a roughly 50 percent response rate to letters sent to wait listed families during periodic reviews, excluding letters that are returned as undeliverable. According to HHS officials knowledgeable about subsidies, maintaining accurate contact information for wait listed families can be difficult because low-income families tend to frequently move. Child care officials in 13 states also told us that families often remain on the wait list despite no longer wanting subsidies or becoming ineligible for them. According to 6 state
Page 38 GAO-17-60 Child Care
officials, families may no longer want subsidies because they made alternative child care arrangements once they were wait listed. Several state officials also said that families may become ineligible for subsidies while wait listed because their children become too old for subsidies; parents stop working; or the family’s income grows to exceed the state’s limit. One state child care official told us that it takes a lot of time and money to find a single family on his state’s wait list who will take a child care subsidy slot that opens up. He said that sometimes as many as 50 to 100 letters have to go out to wait listed families to get a single, affirmative response.
Multiple wait lists in a state: HHS officials and stakeholders knowledgeable about wait lists told us that states with wait lists maintained at the sub-state level can face some unique challenges. For example, such individuals said if there are sub-state lists, families in these states can place their names on more than one list, and this duplication makes it difficult to efficiently manage the lists. Resources may be wasted when more than one agency in a state attempts to contact the same family to see if they want to remain on their lists. Also, when local lists are rolled up to the state level, it may be difficult to eliminate the duplicate entries and thereby get an accurate count of the number of families statewide that are waiting for subsidies. Some state child care officials echoed the view that decentralized wait lists pose unique challenges. One official said that it is difficult to ensure that all counties collect the same information on families who they place on their wait lists. Two other state officials mentioned that families may experience different wait times across counties and that their states try to counterbalance this by moving funds from one county to another.
Insufficient technology to manage wait lists: Officials from seven states mentioned that limited technology hindered their ability to efficiently manage wait lists. One state official whose state maintains sub-state lists said that in most cases these lists are on paper and that her state could benefit from more centralized lists. Another state official said that, although her state has a web-based wait list system, various wait list management tasks still must be done manually because this new system does not always integrate well with their older system used to determine eligibility. The CCDBG Act of 2014 and the CCDF regulations require both HHS and states to develop websites that, among other things, must contain localized lists of eligible child care providers such that parents can enter a ZIP code and obtain information on the availability of specific providers in their area. An HHS official suggested that, as states develop
Page 39 GAO-17-60 Child Care
data for these websites, they may want to consider greater use of technology to help manage wait lists.
Although whether and how to use wait lists is at the discretion of state child care subsidy programs, HHS does provide states with technical assistance on how to develop and manage their lists, when requested. In an effort to promote efficiently-run lists, HHS’s written technical guidance encourages states to develop wait list management strategies that minimize the use of staffing resources. Strategies include conducting partial eligibility reviews for at least some families placed on the wait list as opposed to full eligibility determinations, periodically reviewing wait lists by contacting families to validate an ongoing need for subsidies, and requiring families to report address changes to maintain wait list eligibility. Officials from most of the 19 wait list states that participated in our group interviews said that they use at least one of these strategies.
The CCDBG Act of 2014 also might influence use of state wait lists over the next few years. Officials from 15 states that participated in our group interviews said, for example, that they might need to establish new wait lists, their existing wait lists may increase, or families may remain on the lists for longer periods of time. Several also mentioned that whether their use of wait lists was impacted depended upon how certain provisions in this law affect their state and whether subsidy funding increases. For example, some state officials told us new requirements, such as families receiving subsidies for a minimum of 12 months, may result in families being subsidized for longer time periods.53 If funding for subsidies remains flat, this may result in these states not being able to serve as many newly qualified applicants and therefore wait lists might expand. Other provisions that state officials cited as potentially increasing the use or size of wait lists included those pertaining to improving the quality of child care and gradual phase-out of subsidies for families once their income exceeds their state’s limits to receive subsidies.
53The law provides that eligible children will receive assistance for a minimum of 12 months, regardless of changes in income, as long as income does not exceed the federal threshold of 85 percent of SMI. 42 U.S.C. § 9858c(c)(2)(N)(i)(I).
Page 40 GAO-17-60 Child Care
According to HHS written technical assistance and state child care officials and child care stakeholders, other caseload management techniques include prioritizing serving some types of families over other types of families, limiting applications by freezing intake, or changing eligibility policies so that fewer families qualify for subsidies.
Prioritizing certain eligible families over others: Based on our analysis of the CCDF Policies Database Book of Tables, most states (40 out of 51) develop priority policies that specify which eligible families they will serve before other types of eligible families.54 Common priority groups included:
• Families receiving TANF (37 states, including 18 wait list states);55
• children in protective services (28 states, including 14 wait list states);
• children with special needs (26 states, including 12 wait list states); and
• children in families with very low incomes (23 states, including 10 wait list states).56
As long as states provide subsidies to all families who they determine to be eligible, priority groups do not result in some families going unserved. However, in the 19 wait list states, priority groups influence which families get subsidies in their states because not all families determined eligible get served. Priorities can take two forms—guaranteeing a subsidy to all eligible applicants that meet the criteria of the prioritized group or providing these families subsidies before other types of applicants only if funds are available. When children are guaranteed subsidies, they are exempt from wait lists. When children are prioritized over other children without a guarantee, they are placed higher up on wait lists than children with a lesser or no priority. Policies in wait list states tended to guarantee
54Priority policies can be statewide or, in states where CCDF is administered locally, can vary by locality. Information about which states had priority policies is from The CCDF Policies Database Book of Tables, table 25 (October 2015), pp.155-166. 55The CCDF Polices Database Book of Tables reports information on one of three subsidy programs in California—Non-CalWORKS Alternative Payment Program, which does not have a priority for TANF recipients. Another of these three programs, however, does prioritize TANF recipients. 56States define very low income in a number of ways. For example, in Arizona very low-income families are defined as families with income at or below 100 percent of federal poverty guidelines.
Other Caseload Management Techniques Include Priority Groups and Methods That Can Limit Applications
Page 41 GAO-17-60 Child Care
subsidies for TANF recipients and mostly prioritized other groups for subsidies without a guarantee.
Freezing intake: Freezing intake occurs when a state or locality stops taking applications for subsidies for either the entire program (a full program freeze) or for specific priority groups or income levels (a partial program freeze). In its annual reports on CCDF policies, the NWLC reported that three states froze intake in 2013, two in 2014, and three in 2015.57 In all of these cases, the states instituted partial program freezes, funding subsidies for some families (for example, families in priority groups) and froze intake for other applicants. States or localities also may freeze intake in conjunction with wait lists, for example freezing intake for some priority groups and maintaining wait lists for others.
In its written technical assistance, HHS describes the pros and cons of managing programs by instituting partial program freezes, full program freezes, or managing the program according to wait listed priority groups. According to this technical assistance, partial freezes (which close the program to some priority groups) may be more effective than full freezes (which close the program to everyone), because it can be easier to manage the flow of cases and manage funds. This technical assistance also says it may be preferable to maintain wait lists when closing the program to certain priority groups as opposed to simply instituting a program freeze for these groups. This is because wait lists allow states to determine which priority groups to reopen and to make informed decisions about the number of families to select from the list. An official from one state who participated in our group interviews told us, however, that her state now freezes intake instead of using wait lists when funds run low because they found that wait lists were too burdensome to administer. She said that it was difficult to find families on the wait list to receive subsidies once funding became available because it was difficult to ensure an accurate list that consisted of families who continued to want or qualify for subsidies.
Modifying eligibility policies: According to child care stakeholders and state child care officials, states may modify their eligibility policies to manage the size of their subsidy caseloads. Modifications in eligibility policies can be statewide or at the sub-state level. Child care officials 57NWLC, Pivot Point: State Child Care Assistance Policies 2013, table 2, pp. 29-30. NWLC, Turning the Corner: State Child Care Assistance Policies 2014, table 2, pp. 26-27. NWLC, Building Blocks: State Child Care Assistance Policies 2015, table 2, pp. 30-31.
Page 42 GAO-17-60 Child Care
mentioned this case management strategy in states that used waiting lists (5 out of 19 states) and in states that served all eligible applicants (7 out of 12 states). Officials said that modifications can decrease caseloads, ensure that the program serves the neediest children, or increase caseloads. State officials reported modifying policies such as income limits, co-payment amounts that parents pay to providers, and requirements related to employment or education. Officials from a few states also told us their states typically do not modify eligibility policies to manage caseloads because these policies are based in statute and it is difficult to go through the legislative process to change them.
Child care officials from 22 states described ways in which their states leverage funds and other programs to meet the child care needs of low-income working families. Programs and funds mentioned included Head Start, Early Head Start, state funded pre-kindergarten, TANF, Social Services Block Grant (SSBG), and various state or county run programs. Two officials, for example, said that that their states’ pre-kindergarten programs help meet the child care needs of 4-year-olds with low-income working parents. One of these officials specifically mentioned that fewer 4-year-olds receive subsidies because of the pre-kindergarten program and the other official said that, in her state, parents of 4-year-olds that apply for subsidies are referred to the pre-kindergarten program. Another official, however, described his child care subsidy program as the last resort for low-income working families. This official explained that by the time families apply to his program, they have already been turned down or the other programs also have wait lists. Officials from 13 states mentioned additional programs their states or localities leverage to help meet the child care needs of low-income families. For example, one official mentioned that his state tries to reduce the number of families with school-aged children that receive child care subsidies by referring them to after school programs. Officials from 3 states mentioned that some of their counties have local funding for assistance with child care expenses and officials in 2 of these states specifically mentioned that these funds were county responses to CCDF waiting lists.
We provided a draft of this report to the Department of Health and Human Services (HHS). The agency noted that the report provides valuable information to states and federal officials about access to subsidies, and breaks new ground by analyzing state-by-state data on families eligible for and those that actually receive Child Care and Development Fund (CCDF) services. HHS also expressed concerns about the overall funding
States Leverage Other Programs and Funds to Help Meet Subsidy Need
Agency Comments and Our Evaluation
Page 43 GAO-17-60 Child Care
level for CCDF and its impact on state decisions as to which eligible families to serve as well as the amount of the subsidy to provide. The agency also provided technical comments, which we incorporated as appropriate.
We are sending copies of this report to appropriate congressional committees, the Secretary of Health and Human Services, and other interested parties. In addition, the report will be available at no charge on the GAO website at http://www.gao.gov.
If you or your staff have any questions concerning this report, please contact me at (202) 512-7215 or [email protected]. Contact points for our Offices of Congressional Relations and Public Affairs may be found on the last page of this report. GAO staff who made key contributions to this report are listed in appendix III.
Cindy S. Brown Barnes, Director Education, Workforce, and Income Security Issues

Appendix I: Objectives, Scope, and Methodology
Page 44 GAO-17-60 Child Care
Our review focused on: (1) what is known about the number and types of families eligible for child care subsidies and the extent to which they receive them; and (2) how states determine which eligible families receive subsidies when subsidy need exceeds supply. We used a variety of methods to address these objectives, including analyzing data from Urban Institute’s Transfer Income Model, version 3 (TRIM3) on subsidy eligibility, the U.S. Department of Health and Human Services’ (HHS) summary tables of administrative data on subsidy receipt (HHS administrative data), and HHS public use sample data on Child Care and Development Fund (CCDF) recipients (HHS sample data). We interviewed HHS officials, researchers in the child care subsidy field, and other knowledgeable stakeholders, in addition to holding group interviews with child care officials from 32 states. We also identified and reviewed applicable studies as needed that discussed eligibility and access issues associated with child care subsidies. We identified these studies by consulting with interviewees and reviewing key online research websites and repositories. Finally, we reviewed relevant federal laws, such as the Child Care and Development Block Grant Act of 2014,1 and summaries of state CCDF policies.
We conducted our work from May 2015 to December 2016 in accordance with generally accepted government auditing standards. Those standards require that we plan and perform the audit to obtain sufficient, appropriate evidence to provide a reasonable basis for our findings and conclusions based on our audit objectives. We believe that the evidence obtained provides a reasonable basis for our findings and conclusions based on our audit objectives. Further details on our key methodologies are discussed below.
To determine what is known about families eligible for subsidies, we used data from TRIM3 to estimate the number of children nationwide and state-by-state that: (1) met federal requirements for CCDF eligibility and (2) were eligible to receive CCDF subsidies based on state policies. We then compared the characteristics of children eligible for subsidies to children receiving subsidies, using TRIM3 and HHS data (described below).
TRIM3 is developed and maintained by staff at the Urban Institute with funding primarily from HHS. The TRIM3 model simulates major
1Pub. L. No. 113-186, 128 Stat. 1971.
Appendix I: Objectives, Scope, and Methodology
TRIM3 Microsimulation Model

Appendix I: Objectives, Scope, and Methodology
Page 45 GAO-17-60 Child Care
governmental tax, transfer, and health programs using federal data from the Current Population Survey containing detailed information on the demographic characteristics and economic circumstances of U.S. households. TRIM3 models eligibility for CCDF-funded subsidies on a monthly basis. In other words, each family is checked for eligibility in each month of the simulation year, and a family might be found eligible for CCDF-funded subsidies in some months of the year but not the entire year. The eligibility policies in the simulation reflect the variations in eligibility policies across states.
To identify the number of children estimated to be eligible for child care subsidies, we examined TRIM3 data on children who met federal requirements and who also met state eligibility policies. In addition, to understand more about the characteristics of children estimated to be eligible for subsidies according to their state policies, we analyzed the following variables: age; race; Hispanic ethnicity; whether the head of household is single, not single, or the child is in a child-only unit;2 and family income-to-poverty ratios. To improve the reliability of our estimates, we used multiple calendar years of TRIM3 data to generate subsidy eligibility estimates for an average month. For our estimates of the number of children meeting federal requirements and estimates of children eligible under state policies, we used data from calendar years 2011 and 2012, which was the most recent at the time of our analysis. We obtained these data from the HHS publication, “ASPE Issue Brief: Estimates of Child Care Eligibility and Receipt for Fiscal Year 2012.”3 A relatively small number of children (216,000 out of 8.9 million in 2012) are defined as eligible under state policies in this brief, but are not considered eligible under federal parameters. This can occur because some children are considered child-only units under state policies, making them eligible, but are not considered child-only units under federal parameters, and because some states define the assistance unit differently than the federal requirements. In addition, estimates of children eligible under federal parameters do not consider state-allowable income disregards when determining whether a child’s family income is below 85 percent of state median income; in some states, income disregards can therefore 2Examples of child-only units may include units where a child lives with a non-parent caretaker, such as when a child lives in foster care. 3This Brief used TRIM3 data to estimate CCDF eligibility. We used its estimates of both children meeting federal requirements and children eligible under state policies, instead of replicating them through our own analysis, because we found them sufficiently reliable for our purposes.

Appendix I: Objectives, Scope, and Methodology
Page 46 GAO-17-60 Child Care
lead to a slightly higher estimate of children eligible under state policies than children eligible under federal parameters. This was the case in the District of Columbia and New Mexico. For these two states, we subtracted a small number of children (170) from the estimated number of state eligible children so we could use the percentage formula to estimate the margin of error of the percentage of children meeting federal parameters that are eligible under state rules. For our state-by-state estimates of the age and race and ethnicity of children eligible under state policies, we used data from calendar years 2010 through 2012 because the additional year increased the reliability of estimates for subgroups within states. We obtained these data from the Urban Institute’s publicly available TRIM3 baseline microdata files. Due to TRIM3 data limitations with 2010 data, however, we could only use 2011 and 2012 data for head of household and income-to-poverty ratios. For estimated percentages, we excluded from our analysis any estimates where the margin of error exceeded 15 percentage points. For count estimates, we excluded from our analysis any estimates where the relative margin of error exceeded 15 percent. In addition, we assessed the reliability of TRIM3 by (1) performing electronic testing of required data elements, (2) reviewing publicly available information about the data and systems that produced them, (3) reviewing additional information about the Child Care Module provided by HHS and the Urban Institute, (4) interviewing staff at the Urban Institute who developed and maintain the TRIM3 microsimulation, and (5) interviewing HHS agency officials knowledgeable about the data. We determined that none of the data limitations or modeling assumptions affected or compromised the analysis for this report and the data are considered to be sufficiently reliable for our purposes.
We used HHS administrative data to gather information on children receiving subsidies. Data on subsidy recipients are derived from mandatory state reports that include case-level data (specifically, the ACF-801 that states submit monthly to HHS). State ACF-801 reports are based on information families provide to caseworkers, who then input the data into existing state information technology systems. Using the ACF-801 reports, HHS provided us with summary tables of state-by-state data on the number and characteristics of children and families receiving subsidies in an average month (HHS administrative data). To conduct further analyses using different categories and combinations than the full administrative data offered, we also obtained sample case-level data through the Research Connections Public Use Sample Data Sets (HHS sample data). For states that submitted full population data in their ACF-801 reports, a random sample of families is selected for each month and
HHS Administrative Data

Appendix I: Objectives, Scope, and Methodology
Page 47 GAO-17-60 Child Care
only the children of those families are included in the child Public Use Sample Data Set. For the states that submitted sample data in their ACF-801 reports, all families and all children were included in the Public Use Sample Data Sets.4
To analyze the HHS subsidy receipt data, we selected variables that characterized the subsidy population and could be readily compared to data from TRIM3 microsimulation: children’s age, children’s race and Hispanic ethnicity, whether the head of household is single, and the family income-to-poverty ratio. We used the HHS administrative data to analyze age, and we used the HHS sample to analyze the remainder of the characteristics. For age and race and ethnicity, we combined the totals from fiscal years 2010, 2011, and 2012 in order to be comparable with our TRIM3 analysis. Due to data limitations in TRIM3, we could only analyze 2011 and 2012 for the income-to-poverty ratio and head of household analyses, so we used HHS sample data from fiscal years 2011 and 2012 for these characteristics as well. For each characteristic, we did not report state-level results for any states where the data on that characteristic were missing or invalid for 15 percent or more of the children. We also did not report any state-level estimates (from the HHS sample data) where the margin of error (for percentage estimates) exceeded 15 percentage points, or where the relative margin of error (for count estimates) exceeded 15 percent. Finally, we excluded territories from all HHS administrative data because TRIM3 only includes data on the 50 states and the District of Columbia. The territories removed from national analyses were: American Samoa, Guam, Northern Mariana Islands, Puerto Rico, and Virgin Islands. When reporting national totals, we included all states and the District of Columbia.
We also reported HHS’s estimates of the extent to which children who may meet eligibility criteria actually received subsidies for fiscal year 2012 nationwide, known as a coverage rate. Coverage rates specifically measure children eligible based on federal CCDF requirements in comparison to those receiving or estimated to receive subsidies from the major federal funding sources that subsidize the cost of child care for low-income working families—CCDF, two sources of Temporary Assistance for Needy Families (TANF) funds spent directly on child care, and Social Services Block Grant (SSBG). For this reason, HHS officials told us they
4While most states submit full population data in their ACF-801 reports, a few elect to submit sample data that are proportional to the caseload for that month.

Appendix I: Objectives, Scope, and Methodology
Page 48 GAO-17-60 Child Care
did not believe data on SSBG, TANF funds spent directly on child care, and TANF maintenance of effort to be reliable on a state-by-state level, and therefore they only estimate coverage rates on a national level.
HHS allows states to report the total number of children they subsidize using any funds on the ACF-801 because states may not have the ability to identify children served only by CCDF. In these cases, HHS must estimate the number served by CCDF using a state-reported pooling factor, which is the percentage of funds spent on child care subsidies from CCDF. HHS uses the pooling factor to weight the state-reported data to determine the number of children and families served solely by CCDF. The department multiplies a state’s pooling factor by the total number served to develop adjusted counts of those served by CCDF.
We assessed the reliability of HHS administrative data by (1) performing electronic testing of required data elements, (2) reviewing existing information about the data and systems that produced them, and (3) interviewing agency and other officials knowledgeable about the data. We determined that the administrative data used to estimate participation and coverage rates were sufficiently reliable for the purposes of this report.
For our analysis of race and ethnicity in both TRIM3 and HHS data, we constructed the following mutually exclusive categories: White, non-Hispanic; Black, non-Hispanic; Other or multi-racial, non-Hispanic; and Hispanic. In our state-level analysis, we present information on non-Hispanic White children, non-Hispanic Black children, and Hispanic children.
For our analysis of family income-to-poverty status, we constructed a variable in the HHS sample data that compared monthly family income to the HHS poverty guidelines for the appropriate year. For our estimates of income-to-poverty status among eligible children, we used a variable from the TRIM3 Child Care module with monthly family income as a percentage of poverty. We did not include children in child-only units5 in the analysis of family income-to-poverty status, because any family income associated with those children would not affect their eligibility, and we did not include children whose family income exceeded four times the
5 Examples of child-only units may include units where a child lives with a non-parent caretaker, such as when a child lives in foster care.
Variable Recodes and Restrictions

Appendix I: Objectives, Scope, and Methodology
Page 49 GAO-17-60 Child Care
poverty guideline as we determined that these values were likely to be errors. We determined statistical significance for all comparisons between subsidy recipients and eligible children at a 95 percent confidence level.
To review state CCDF policies and how they may vary across states, we used data from Urban Institute’s CCDF Policies Database, which is a cross-state, cross-time database of CCDF policy information funded by HHS. Urban Institute publishes selected policies for all states annually in its Book of Tables, and we primarily relied upon the 2014 Book of Tables.6 The information contained in this database was collected primarily from caseworker manuals, which are documents that caseworkers use as they work with families and providers. The tables created from the database were reviewed by almost all state administrators and verified for accuracy, with two states not providing verification. As noted in various places in this report, in a few states, child care policies vary across sub-areas within a state. In those cases, the Urban Institute’s tables show information for the most populous area. Although some caseworker manuals may include policies derived from state legal requirements, GAO did not examine state statutes and regulations nor did we independently verify the information in the Urban Institute’s tables.
To understand how states manage demand for child care subsidies, we held interviews with child care administrators or their designees (collectively referred to as state child care officials in the report) from 32 states that had wait list policies in 2014 about how they assess need for subsidies in their states, prioritize who they serve, and manage wait lists (see table 4). Of these 32 states, 19 had active wait lists as of early 2015. The remaining 13 states served all applicants they determined eligible for the program. The results of these interviews are not generalizable to all states.
6See Sarah Minton, , Kathryn Stevens, Lorraine Blatt, and Christin Durham. The CCDF Policies Database Book of Tables: Key Cross-State Variations in CCDF Policies as of October 1, 2014, OPRE Report 2015-95 (Washington, DC: Office of Planning, Research and Evaluation, Administration for Children and Families, U.S. Department of Health and Human Services, 2015)
CCDF Policies Database
Group Interviews
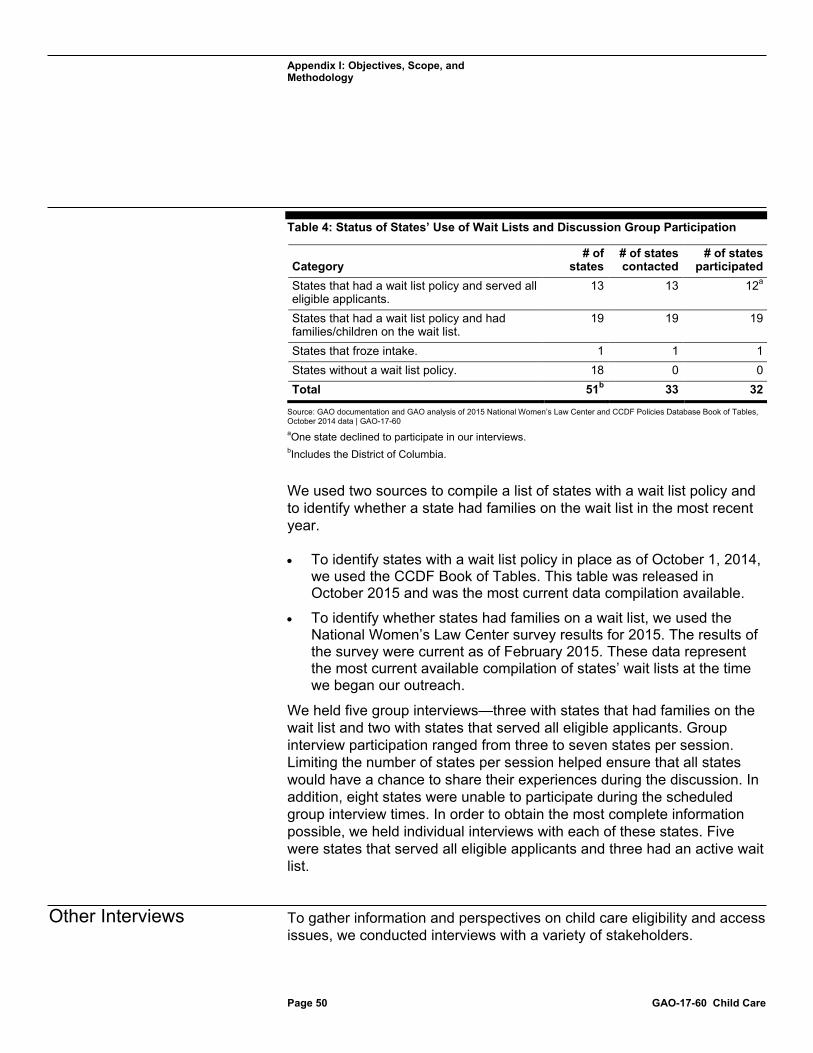
Appendix I: Objectives, Scope, and Methodology
Page 50 GAO-17-60 Child Care
Table 4: Status of States’ Use of Wait Lists and Discussion Group Participation
Category # of
states # of states contacted
# of states participated
States that had a wait list policy and served all eligible applicants.
13 13 12a
States that had a wait list policy and had families/children on the wait list.
19 19 19
States that froze intake. 1 1 1 States without a wait list policy. 18 0 0 Total 51b 33 32
Source: GAO documentation and GAO analysis of 2015 National Women’s Law Center and CCDF Policies Database Book of Tables, October 2014 data | GAO-17-60 aOne state declined to participate in our interviews. bIncludes the District of Columbia.
We used two sources to compile a list of states with a wait list policy and to identify whether a state had families on the wait list in the most recent year.
• To identify states with a wait list policy in place as of October 1, 2014, we used the CCDF Book of Tables. This table was released in October 2015 and was the most current data compilation available.
• To identify whether states had families on a wait list, we used the National Women’s Law Center survey results for 2015. The results of the survey were current as of February 2015. These data represent the most current available compilation of states’ wait lists at the time we began our outreach.
We held five group interviews—three with states that had families on the wait list and two with states that served all eligible applicants. Group interview participation ranged from three to seven states per session. Limiting the number of states per session helped ensure that all states would have a chance to share their experiences during the discussion. In addition, eight states were unable to participate during the scheduled group interview times. In order to obtain the most complete information possible, we held individual interviews with each of these states. Five were states that served all eligible applicants and three had an active wait list.
To gather information and perspectives on child care eligibility and access issues, we conducted interviews with a variety of stakeholders.
Other Interviews
Appendix I: Objectives, Scope, and Methodology
Page 51 GAO-17-60 Child Care
• We assembled a group of stakeholders knowledgeable about wait lists and access to child care. We selected seven stakeholders from research and advocacy organizations, as well as the government, based on referrals from the HHS entrance conference and other interviews, as well as a review of relevant literature. The selected stakeholders had authored reports on child care subsidies or had experience managing related programs. Our discussion with these individuals focused on good wait list practices, which we used to inform our questions for the group interviews we held with state child care officials.
• We conducted individual interviews with stakeholders from research and advocacy organizations, as well as academia, to discuss access issues and data sources. We identified these stakeholders through reviewing policy papers and applicable websites, attending webinars, and asking interviewees to suggest other knowledgeable stakeholders to contact.
• We met with federal officials who administer the CCDF and contractors who provide technical assistance on eligibility and access issues.
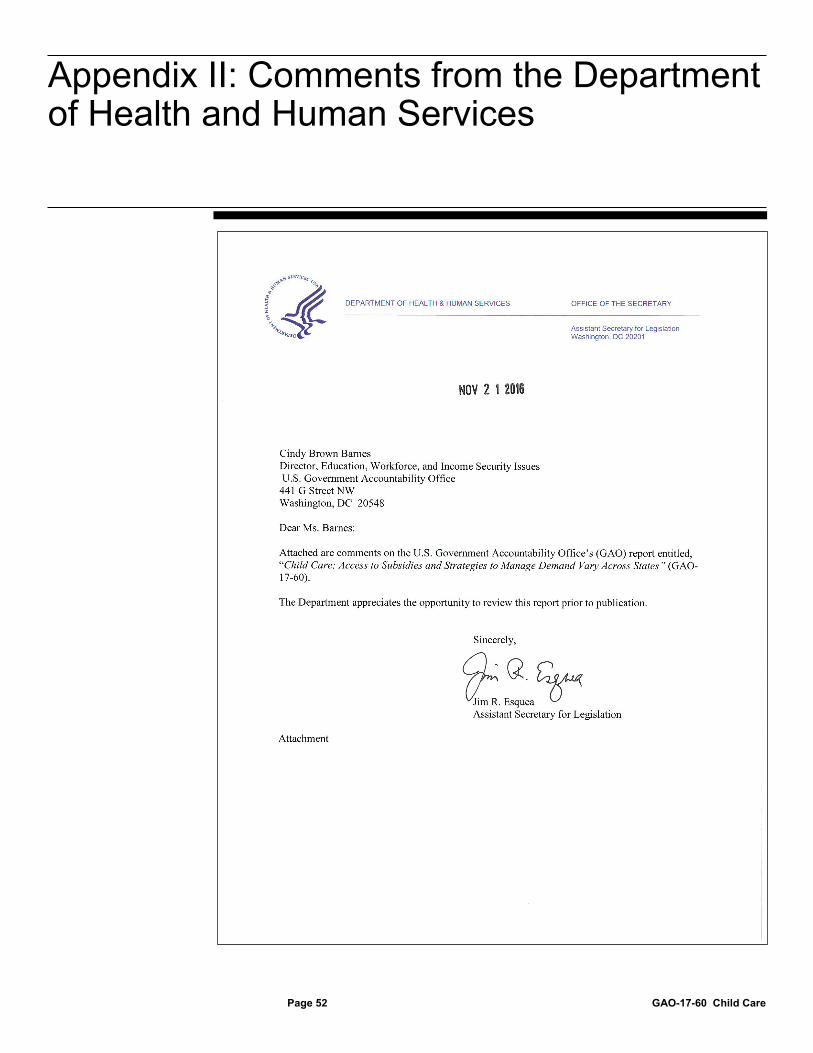
Appendix II: Comments from the Department of Health and Human Services
Page 52 GAO-17-60 Child Care
Appendix II: Comments from the Department of Health and Human Services

Appendix II: Comments from the Department of Health and Human Services
Page 53 GAO-17-60 Child Care
Appendix II: Comments from the Department of Health and Human Services
Page 54 GAO-17-60 Child Care
Appendix III: GAO Contact and Staff Acknowledgments
Page 55 GAO-17-60 Child Care
Cindy Brown Barnes, (202) 512-7215 or [email protected].
In addition to the contact named above, Janet Mascia (Assistant Director), Nancy Cosentino (Analyst-in-Charge), Rhiannon Patterson, Amy Moran Lowe, Nyree Ryder Tee, and Eric Anderson made significant contributions to this report. Also contributing to this report were James Rebbe, Mimi Nguyen, Jean L. McSween, Karen O’Conor, Anna Maria Ortiz, Kate van Gelder, Jessica Orr, Rachael Chamberlin, Kelly Snow, and Chris Schmitt.
Appendix III: GAO Contact and Staff Acknowledgments
GAO Contact
Staff Acknowledgments
(131366)
The Government Accountability Office, the audit, evaluation, and investigative arm of Congress, exists to support Congress in meeting its constitutional responsibilities and to help improve the performance and accountability of the federal government for the American people. GAO examines the use of public funds; evaluates federal programs and policies; and provides analyses, recommendations, and other assistance to help Congress make informed oversight, policy, and funding decisions. GAO’s commitment to good government is reflected in its core values of accountability, integrity, and reliability.
The fastest and easiest way to obtain copies of GAO documents at no cost is through GAO’s website (http://www.gao.gov). Each weekday afternoon, GAO posts on its website newly released reports, testimony, and correspondence. To have GAO e-mail you a list of newly posted products, go to http://www.gao.gov and select “E-mail Updates.”
The price of each GAO publication reflects GAO’s actual cost of production and distribution and depends on the number of pages in the publication and whether the publication is printed in color or black and white. Pricing and ordering information is posted on GAO’s website, http://www.gao.gov/ordering.htm.
Place orders by calling (202) 512-6000, toll free (866) 801-7077, or TDD (202) 512-2537.
Orders may be paid for using American Express, Discover Card, MasterCard, Visa, check, or money order. Call for additional information.
Connect with GAO on Facebook, Flickr, Twitter, and YouTube. Subscribe to our RSS Feeds or E-mail Updates. Listen to our Podcasts. Visit GAO on the web at www.gao.gov.
Contact:
Website: http://www.gao.gov/fraudnet/fraudnet.htm E-mail: [email protected] Automated answering system: (800) 424-5454 or (202) 512-7470
Katherine Siggerud, Managing Director, [email protected], (202) 512-4400, U.S. Government Accountability Office, 441 G Street NW, Room 7125, Washington, DC 20548
Chuck Young, Managing Director, [email protected], (202) 512-4800 U.S. Government Accountability Office, 441 G Street NW, Room 7149 Washington, DC 20548
James-Christian Blockwood, Managing Director, [email protected], (202) 512-4707 U.S. Government Accountability Office, 441 G Street NW, Room 7814, Washington, DC 20548
GAO’s Mission
Obtaining Copies of GAO Reports and Testimony Order by Phone
Connect with GAO
To Report Fraud, Waste, and Abuse in Federal Programs
Congressional Relations
Public Affairs
Strategic Planning and External Liaison
Please Print on Recycled Paper.