december 22, 2014 · any price quoted, analysis (including any expression of opinion or forecast),...
TRANSCRIPT


1
December 22, 2014
Prepared by: Winston Chu
HT Capital Management Email: [email protected] / [email protected]
Special acknowledgements to Perry Tan, CFA, CAIA, FRM, from Black Crane Capital who assisted in co-authoring
this presentation
Email: [email protected] / [email protected] DISCLAIMER This presentation is prepared specifically for the FactSet Top Idea Tournament Best Special Situations sponsored by SumZero from December 12th to 22nd. The presentation is for information purposes only and is not intended to provide investment, legal, accounting or tax advice or otherwise to any person. No information in this presentation shall be treated as any kind of advice and no reliance shall be placed in that regard. Each and any investor should seek independent advice from the relevant professional advisers. Any price quoted, analysis (including any expression of opinion or forecast), research, recommendation or information in this presentation
2
Table of Contents
Executive Summary .................................................................................................................................... 3
The Energizer Bunny .................................................................................................................................. 4
The “Inevitable” Brand Portfolio ................................................................................................................ 6
Energizer 2014 - Group Snapshot .............................................................................................................. 8
The Special Situation ................................................................................................................................. 10
“Transformers” Restructuring .................................................................................................................. 11
Second Place – Good Enough? More Than Enough! ............................................................................... 14
Long Term Proposition or Earnings Catalyst? Why Not Both? ................................................................ 18
The End Game ........................................................................................................................................... 21
Integrating the Analysis - Valuation .......................................................................................................... 33
Excellent Corporate Governance .............................................................................................................. 34
Addressing the Risks ................................................................................................................................ 36
Appendix .................................................................................................................................................. 38
Fun Facts .................................................................................................................................................. 42
3
0
20
40
60
80
100
120
140
2009 2010 2011 2012 2013 2014
Executive Summary
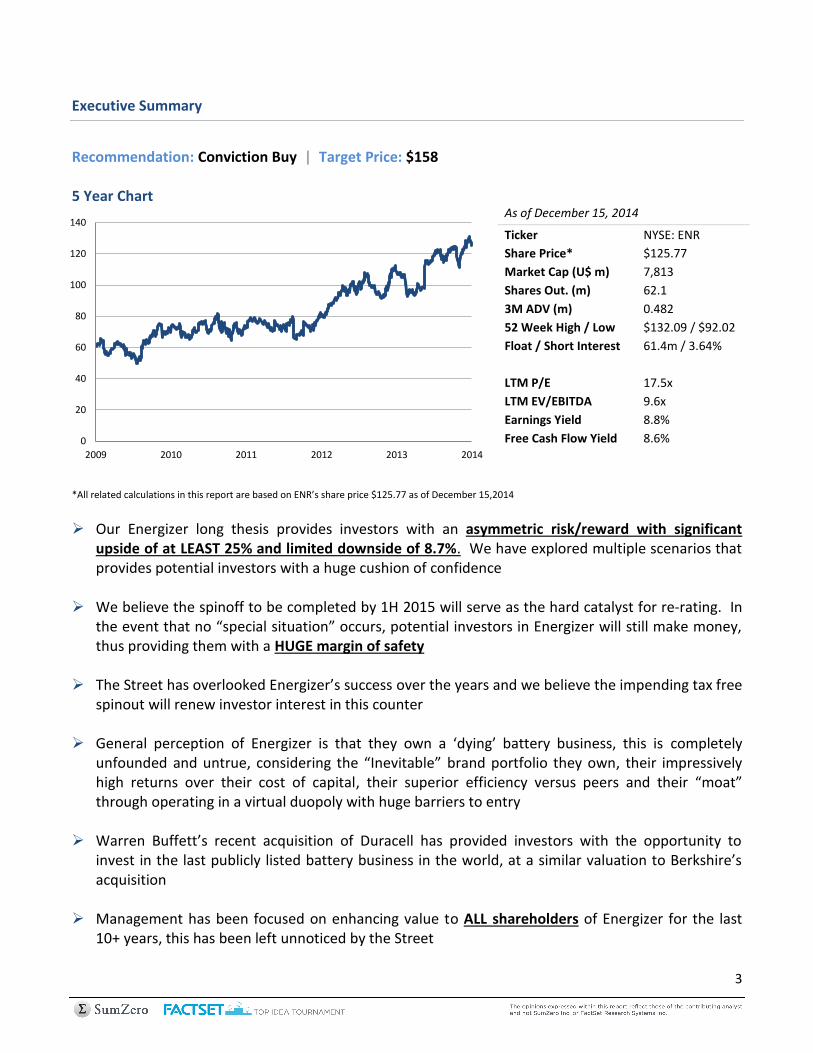
Recommendation: Conviction Buy | Target Price: $158 5 Year Chart
*All related calculations in this report are based on ENR’s share price $125.77 as of December 15,2014
Our Energizer long thesis provides investors with an asymmetric risk/reward with significant upside of at LEAST 25% and limited downside of 8.7%. We have explored multiple scenarios that provides potential investors with a huge cushion of confidence
We believe the spinoff to be completed by 1H 2015 will serve as the hard catalyst for re-rating. In the event that no “special situation” occurs, potential investors in Energizer will still make money, thus providing them with a HUGE margin of safety
The Street has overlooked Energizer’s success over the years and we believe the impending tax free
spinout will renew investor interest in this counter
General perception of Energizer is that they own a ‘dying’ battery business, this is completely unfounded and untrue, considering the “Inevitable” brand portfolio they own, their impressively high returns over their cost of capital, their superior efficiency versus peers and their “moat” through operating in a virtual duopoly with huge barriers to entry
Warren Buffett’s recent acquisition of Duracell has provided investors with the opportunity to invest in the last publicly listed battery business in the world, at a similar valuation to Berkshire’s acquisition
Management has been focused on enhancing value to ALL shareholders of Energizer for the last
10+ years, this has been left unnoticed by the Street
As of December 15, 2014
Ticker NYSE: ENR
Share Price* $125.77
Market Cap (U$ m) 7,813
Shares Out. (m) 62.1
3M ADV (m) 0.482
52 Week High / Low $132.09 / $92.02
Float / Short Interest 61.4m / 3.64%
LTM P/E 17.5x
LTM EV/EBITDA 9.6x
Earnings Yield 8.8%
Free Cash Flow Yield 8.6%
4
The Energizer Bunny
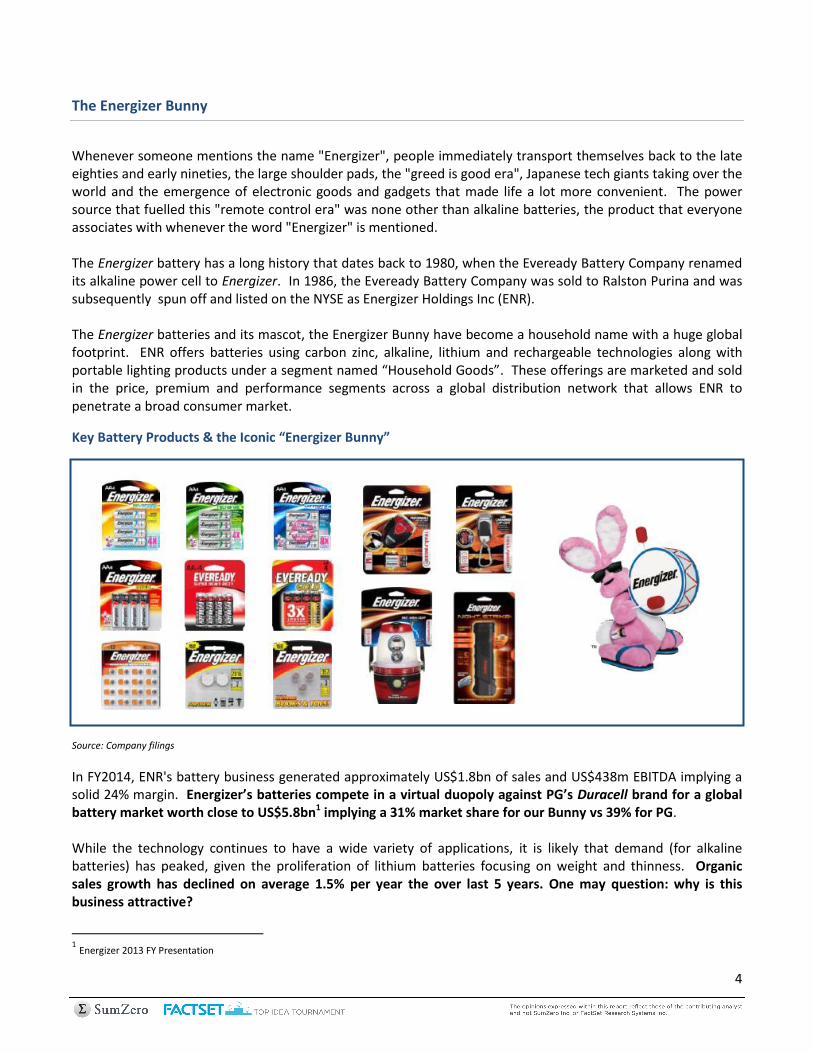
Whenever someone mentions the name "Energizer", people immediately transport themselves back to the late eighties and early nineties, the large shoulder pads, the "greed is good era", Japanese tech giants taking over the world and the emergence of electronic goods and gadgets that made life a lot more convenient. The power source that fuelled this "remote control era" was none other than alkaline batteries, the product that everyone associates with whenever the word "Energizer" is mentioned. The Energizer battery has a long history that dates back to 1980, when the Eveready Battery Company renamed its alkaline power cell to Energizer. In 1986, the Eveready Battery Company was sold to Ralston Purina and was subsequently spun off and listed on the NYSE as Energizer Holdings Inc (ENR). The Energizer batteries and its mascot, the Energizer Bunny have become a household name with a huge global footprint. ENR offers batteries using carbon zinc, alkaline, lithium and rechargeable technologies along with portable lighting products under a segment named “Household Goods”. These offerings are marketed and sold in the price, premium and performance segments across a global distribution network that allows ENR to penetrate a broad consumer market.
Key Battery Products & the Iconic “Energizer Bunny”
Source: Company filings
In FY2014, ENR's battery business generated approximately US$1.8bn of sales and US$438m EBITDA implying a solid 24% margin. Energizer’s batteries compete in a virtual duopoly against PG’s Duracell brand for a global battery market worth close to US$5.8bn1 implying a 31% market share for our Bunny vs 39% for PG. While the technology continues to have a wide variety of applications, it is likely that demand (for alkaline batteries) has peaked, given the proliferation of lithium batteries focusing on weight and thinness. Organic sales growth has declined on average 1.5% per year the over last 5 years. One may question: why is this business attractive?
1 Energizer 2013 FY Presentation

5
1) Strong, stable, predictable free cash flow: The business requires only minimal capital expenditures, averaging 1.5% of sales. The simple alkaline battery generates free cash flow of about approximately US$310m per year translating into an impressive 10.1% FCF yield.2
2) Highly profitable: Since undertaking cost restructuring in 2012, the division has posted an average ROA
of 37% while EBITA3 margins improved by 2% despite sales falling from US$2bn to US$1.8bn. As a standalone business, Energizer is very attractive: “I have always been impressed by Duracell, as a consumer and as a long-term investor...Duracell is a leading global brand with top quality products, and it will fit well within Berkshire Hathaway.” - Warren Buffett It is no secret that the venerable Warren Buffett loves Duracell's product and business. If one takes a closer look at ENR's battery business, their return profile, and their FCF generation, there really is not much difference between both these companies. One would think that the discussion of ENR ends with batteries. After all, if their core product is not THE Energizer battery, why is company called "Energizer"?! Fortunately for us, ENR is so much more than just batteries.
2 FCF Yield: free cash flow of the Household segment divided by the implied EV, based on 7x EV/EBITDA
3 EBITA: earnings before interest, taxation, and amortization. We did not add back depreciation because it is a true cost to the business, albeit a very small number in ENR's case. R&D is already accounted for as 'cost' in the income statement

6
The “Inevitable” Brand Portfolio
ENR's battery business represents the “Household Goods” segment and contributes to approximately 40% of the Group's revenue and profits. So what is ENR's key contributor? Razor blades, skin care, feminine care and infant care products! Almost 60% of ENR’s sales come from the “Personal Care” segment, consisting of major brands such as:
Key Personal Care Products
We have all seen these brands at local and international retail stores and many of us probably purchased these products in the past, or better yet, are loyal customers. The portfolio of companies ENR has built up over the last decade can suitably be labelled a part of “The Inevitables” as coined by Warren Buffet for such businesses:
Major Brands Description Date of Acquisition
Schick-Wilkinson Sword 2
nd largest brand of wet shave products with over 20% global
market share March 2003
Playtex 2
nd best-selling tampon in the US; including leading infant care
products such as Diaper Genie and moist wipes Wet Ones Early 2008
Banana Boat/Hawaiian Tropic Global sun care products holding #1 position in US Early 2008 (part of Playtex)
Edge/Skintimate Shave preparation brand in US with 30%/65% share in men/women market
June 2009
American Safety Razor Global manufacturer of private label/value razors under Personna and GEM brands along with industrial/specialty blades with over 60% share
November 2010
Stayfree/Carefree/o.b. Pad, liner and tampon brands sold in N. America and Caribbean October 2013
Source: Company Filings

7
SWS
Playtex
Edge & Skintimate
ASR
Stayfree/Carefree/ob
0
500
1,000
1,500
2,000
2,500
3,000
2003 2004 2005 2006 2007 2008 2009 2010 2011 2012 2013 2014
“Forecasters may differ a bit in their predictions of exactly how much soft drink or shaving-equipment business these companies will be doing in ten or twenty years. In the end, however, no sensible observer…questions that Coke and Gillette will dominate their fields worldwide for an investment lifetime.” – Warren Buffett Personal Care Total Sales (US$m) Since its first acquisition of Schick-Wilkinson Sword (SWS) in 2003, the Personal Care business has grown 5x. In 2014, ENR’s Personal Care business generated US$2.6bn in revenues and US$531m in EBITA. Its FCF was $437m (7.8% yield)4 and has posted 8% CAGR since 2009. Unlike the battery’s structural decline, there are very few things that can replace the humble razor; the Wet Shave segment has shown 20% organic growth to account for 60% of division revenues and operating profit. Similarly, feminine care products are irreplaceable and tend to have lifetime brand loyalty from its consumers. Consumer necessities with established brands and minimal expenditures to maintain the business, contribute to the continued success of brands like Playtex, Hawaiian Tropic and SWS, thus making their use and success "Inevitable". As of FY14, the Group has 1,460 unexpired US patents and approximately 188 US patent applications pending, 3,349 foreign patents and 584 foreign patent applications pending. We believe that the ENR has successfully carved out a ‘moat’ for their products.
4 FCF Yield: free cash flow for the segment divided by Group EV less Household Goods EV appraised EV at 7x EBITDA
Source: Company Filings
8
Personal Care 57%
Household Goods 43%
EBIT
Wet Shave 36% Skin
10%
Feminine 9%
Infant 3%
Other 1%
Batteries 41%
Sales
US$4.4b
NA 57%
EMEA 20%
Asia 15%
Latam 8%
Geographies
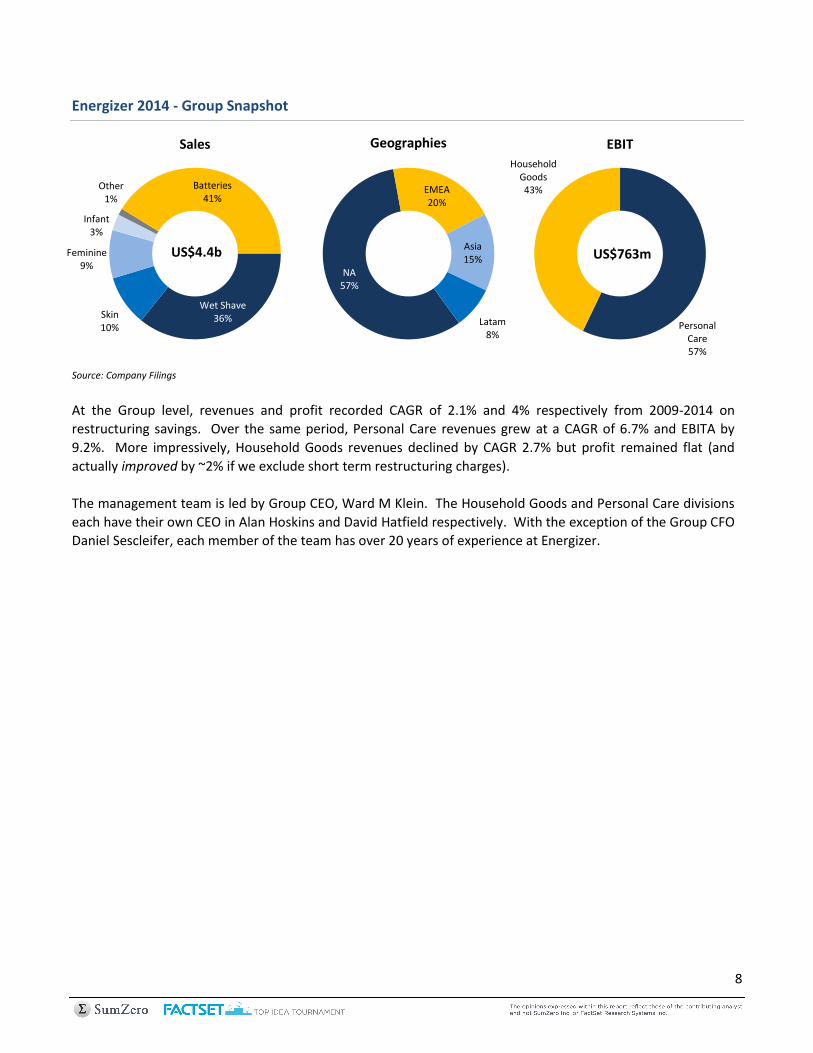
Energizer 2014 - Group Snapshot
Source: Company Filings
At the Group level, revenues and profit recorded CAGR of 2.1% and 4% respectively from 2009-2014 on
restructuring savings. Over the same period, Personal Care revenues grew at a CAGR of 6.7% and EBITA by
9.2%. More impressively, Household Goods revenues declined by CAGR 2.7% but profit remained flat (and
actually improved by ~2% if we exclude short term restructuring charges).
The management team is led by Group CEO, Ward M Klein. The Household Goods and Personal Care divisions
each have their own CEO in Alan Hoskins and David Hatfield respectively. With the exception of the Group CFO
Daniel Sescleifer, each member of the team has over 20 years of experience at Energizer.
US$763m

9
*As of 9/30/2014
Source: Company Filings
Key Management
Title Name Age Since
CEO Ward M Klein
59 Jan 2005
CEO: Personal Care David P Hatfield 54 Nov 2007
CEO: Household Goods Alan R Hoskins 53 April 2012
CFO Daniel J Sescleifer 52 Oct 2000
The top shareholders are all ‘long term investors’. In particular, we also have a special stamp of approval from the veritable special situations stock market genius Joel Greenblatt5 of Gotham Capital with ENR as his largest long position. Before even doing our analysis, this is a pedigree that inspires confidence!
Top 10 Shareholders* Joel Greenblatt Top Longs and Shorts*
Holder name # of shares held % out Top 5 Long Holdings** Ticker
Blackrock 5,669,979 9.13% Energizer Holdings ENR
Vanguard Group 3,699,986 5.96% Sanderson Farms SAFM
JP Morgan Chase 2,872,245 4.92% Bunge BG
Mason Capital 2,354,099 3.79% Anixter International AXE
State Street 2,133,652 3.43% Canaterpillar CAT
LSV Asset Management 1,971,550 3.17% Top 5 Short Holdings** Ticker
GAMCO 1,865,463 3.00% Susser Holdings SUSS
Manning & Napier Advisors 1,796,774 2.89% Tenet Healthcare THC
T Rowe Price 1,342,355 2.16% Bob Evans Farms BOBE
Goldman Sachs Group 1,188,106 1.91% Kennametal KMT
Thermo Fisher Scientific TMO
5 Joel Greenblatt the founder of Gotham Capital, a hedge fund that managed to achieve an estimated 40% return per year from 1985-2006 employing a value investing approach with a high earnings yield, and high return on invested capital criteria for his investments. Outside of running his fund, Mr. Greenblatt is most famous for penning classic investment texts including “The Little Book That Still Beats the Market”, “You Can Be a Stock Market Genius: Uncover the Secret Hiding Places of Stock Market Profits”, “The Big Secret for the Small Investor: A New Route to Long-Term Investment Success” and is the founder of the now world famous “Value Investors Club” http://www.valueinvestorsclub.com/
* Holdings as of 04/30/2014 **Each long holding is < 1%; each short holding < 0.5%. Source: SEC; Gotham Asset Management

10
The Special Situation
On April 30th 2014, ENR announced with its Q2 results that they intend to divide the Household Goods and Personal Care divisions into separate companies via a tax free spinoff. Since the announcement, ENR has rallied over 30% on the potential of unlocking value. There are cues that point to the possibility of activist involvement because on the Q2 earnings call, Mr. Klein plainly ignored multiple questions regarding investor activism; furthermore, just 45 days prior to the announcement he was speaking against the potential of a spinoff at an investment conference saying “We don’t see where separating the business, incurring all those dis-synergies and costs are really going to be accretive for shareholders.”
Spinoff Strategy & Directives
Household Goods
Build market share through investment in effective categories Drive relevant, consumer – led marketing Accelerate initiatives to optimize global cost structure FCF retained to shareholders
Personal Care Accelerate growth via investments in building brand equity Focused global go-to market strategy FCF distributed back to shareholders
Source: Company Filings
Post-spinoff Ward Klein and David Hatfield will move to the Personal Care unit while Alan Hoskins and the current Chairman of the Board, Patrick Mulcahy, will remain with Household Goods. As we await further details from the Form 10 expected early 2015, the Street believes the stock has largely priced in the incremental benefits with an average target price of $132 and as many “Hold” as “Buy” ratings. The separate companies are widely regarded as potential takeout targets. We believe sell-side estimates will prove conservative as they overlooked various factors in their valuation.
Selected Broker Recommendations
Broker Recommendation Target Price
Deutsche Bank Buy $134
Goldman Sachs Neutral $123
UBS Neutral $127
JP Morgan Overweight $146
Jefferies Hold $123
Source: Bloomberg

11
“Transformers” Restructuring
Before we get into the industry, growth/takeover opportunities and valuation of ENR’s two divisions, let us first focus on their two restructuring initiatives in 2011 and 2013. Their 2011 Household Products Restructuring project was focused on rationalizing manufacturing facilities. They closed plants in Philippines and Switzerland and transferred production into existing facilities. Investors were treated to a glimpse of management’s capability as annual savings exceeded guidance without cost overruns:
2011 Restructuring (US$m) Target Actual
Restructuring Charge 65 - 85 79
Annual Savings 25 - 35 35 - 45
Source: Company Filings
Towards the end of 2012, ENR announced a multi-year restructuring plan starting in 2013. With a much larger scope, management guided that most of these cost cuts would come from:
1) Rationalizing plants, operations and procurement in Household Goods 2) 10% workforce reduction (~1,500 employees) 3) Centralizing G&A functions
As of FY14, ENR is on track to exceed targets with flying colours more than a year ahead of plan:
“Our restructuring program continues to deliver meaningful savings, with approximately $255 million in savings realized since the inception of the project in 2012. We are on track to deliver $300 million in savings by July 1, 2015, the expected date for separating into two stand-alone companies. Our original target was $200 million, but we are now estimating total project savings of $330 million” - 2014 Annual Report In addition to gross savings, they also aimed to improve working capital/sales by 400 bps for better cash flow. Impressively, management doubled down on that with a 790 bps working capital improvement.
US$ m
2012 Target Cumulative Actual Restructuring Charge 250 -
Gross Savings 200 -
Working Capital 200 88
2013
Restructuring Charge 350 139
Gross Savings 300 103
Working Capital 200 147
2014
Restructuring Charge 350 232
Gross Savings 330 255
Working Capital 200 350
Source: Company Filings

12
16.3% 17.4%
15.8%
11.9%
9.8%
15.2%
12.1%
19.6%
24.0%
19.7% 18.1%
17.1% 15.9%
11.4%
16.2%
13.7%
19.4%
26.1%
8%
12%
16%
20%
24%
28%
CHD CLX ENR HEN JAH KMB NWL PG RB
Historical Range Average Current
Brokers turned conservative as they questioned how much more juice can be squeezed out of ENR’s operations
given that these margins are higher than what ENR used to experience.
Margin Comparison Source: BTIG
We disagree, there is plenty left in ENR’s tank. Management has proven their capability for disciplined realization of cost savings and there are several elements the Street has overlooked: “Looking ahead, this focus on cost savings has been ingrained in our culture and will serve Household Products and Personal Care well after they split into two companies.” – Ward Klein, CEO 1) Personal Care remains untouched: The 2013 restructuring initiative mostly left the Personal Care division
alone, 77% of the cost cuts originated from either Household Goods or Corporate. Considering that the battery business basically runs itself, we can assume a majority of costs and overhead is attributed to our “Inevitables” business. Having conducted no cost initiatives for Personal Care since acquiring SWS in 2003, we believe there is more fat to trim. Productivity shows organic growth: Since 2009, ENR shed ~2,500 employees and profit per employee has recorded 8.4% CAGR.
2009 2010 2011 2012 2013 2014 CAGR
Employees 15,500 15,500 15,000 14,800 13,000 13,000 -
Sales/Employee 258,100 274,100 309,700 308,600 343,500 342,100 5.8%
Profit/Employee 47,700 52,800 54,600 58,800 70,400 71,400 8.4%
Even if we were to assume no employees were shed, the metric still yields a 4.7% CAGR, signifying management's success in improving the efficiency of the business in multiple channels:
2009 2010 2011 2012 2013 2014 CAGR
Employees 15,500 15,500 15,500 15,500 15,500 15,500 -
Sales/Employee $ 258,052 $ 274,084 $ 299,723 $ 294,658 $ 288,129 $ 286,948 2.1%
Profit/Employee $ 47,723 $ 52,755 $ 52,839 $ 56,187 $ 59,084 $ 59,923 4.7%
Source: Company Filings

13
Simply put, productivity continues to show good organic growth which implies there is more room for margin expansion. The sequential slowdown in 2014 is more a function of the 9% decline in battery segment sales from restructuring than an indication of peaking profitability
3) ERP/SAP revision: According to BTIG, ENR will be implementing more ERP/SAP initiatives this month. Case
studies of Estee Lauder and PG show that substantial savings can be found post-implementation. Estee Lauder’s efforts resulted in 5% improvement in gross profit margin since 2009 despite increases in inventory days. PG, ENR’s most direct competitor, was able to cut inventory in its Beauty & Grooming segment by HALF and realized US$1.5bn incremental cash savings or 10% increase in operating cash flow6
4) Hidden value in restructuring: ENR products are marketed primarily through a direct sales force, but also
through exclusive and non-exclusive distributors and wholesalers. In the US, Household Products and Personal Care segments have dedicated and separate commercial organizations for each business unit while outside of the US, the commercial teams currently market the portfolio of product offerings together. As part of the spinoff, ENR is in the process of establishing dedicated commercial organizations globally. The successful implementation of this due to renewed focused on BOTH segments can potentially create substantial upside for ENR. This will eliminate general corporate expenses on an international scale. We will explore ENR’s presence outside the US in the upcoming sections
5) Focus on cash flow: Brokers are missing the point. Even if we assume that few cost cuts remain, there is much that can be done in terms of optimization. Over the last 5 years, PG reduced working capital as a % of sales from 10% to 6% which drove their cash conversion cycle from 45 days to an astonishing 13 days! ENR is not directly comparable to PG’s massive scale so let us assume no further improvements in receivables and payables days outstanding. However, their products sell through near identical channels; properly optimized over the long term it is not hard to see inventory to COGS converging from current 25% to PG’s 16% level which would imply potentially 600 bps reduction in working capital to sales. Many studies have shown that improved cash flow is directly correlated with higher profitability and shareholder value
6 Farasyn et all. Inventory Optimization at P&G. http://startrinity.com/SupplyChainManagement/Resources/io15pandg.pdf

14
Second Place – Good Enough? More Than Enough!
All of ENR’s core products function in a virtual duopoly environment, primarily against their key competitor, the behemoth Proctor & Gamble (PG). One of the most interesting aspects of finance and the study of business is why new innovations may at times help a business and improve returns, while in some other instances, all the benefits fall to the customers.
“That's such an obvious concept ‑ that there are all kinds of wonderful new inventions that give you nothing as owners except the opportunity to spend a lot more money in a business that's still going to be lousy. The money still won't come to you. All of the advantages from great improvements are going to flow through to the customers.” – Charlie Munger, The Art of Stock Picking In many instances, the market leader will have outsized returns, while their remaining lesser competitors struggle either with very low returns or barely breakeven profit numbers. We suspect that many investors view ENR’s #2 position in its respective products lines in this light and therefore have no interest in even looking at an ex-growth, secondary, unattractive business. “Here's a model that we've had trouble with. Maybe you'll be able to figure it out better. Many markets get down to two or three big competitors or five or six. And in some of those markets, nobody makes any money to speak of. But in others, everybody does very well.” – Charlie Munger, The Art of Stock Picking Contrary to popular belief, while ENR is not the market leader, their returns and margins have been high for the last 10 years. It seems therefore, that ENR falls under the latter category of Mr. Munger’s statement above ("everybody does very well"), thus implying that competition has been rational between ENR, PG and the other industry participants. In many industries, companies end up mired in price wars which result in perpetual declines in ROIC until all shareholders’ wealth is destroyed. This has not been the case for ENR’s brands; PG and ENR have been consolidators in their product categories while maintaining stable market share. Market share analysis is helpful in understanding the size and value of a certain product category, it is also helpful to study market share for a maturing/matured business to get a sense of how much incremental capital expenditure is required for the lagging competitor to catch up or overtake the competitor ahead of them. Warren Buffett engaged in this type of analysis and became so comfortable with his Coca-Cola investment in 1988 that he ended up owning 7% of the company because he understood that Coke’s rivals could never catch up with them simply because no one has the balance sheet to match Coke’s scale. Needless to say, ENR would have to spend a lot of dollars to match PG’s business. Having said that, is being second such a bad thing? Is market share the key consideration here? What about returns on the business?

15
ENR Group Invested Capital
YE Sept US$ m 2009 2010 2011 2012 2013 2014
Working capital
Trade receivables, net 810.0 824.8 709.8 676.7 480.6 495.0
Inventories 667.3 666.3 653.4 672.4 616.3 616.9
Accounts payable 231.6 271.0 289.6 325.2 340.4 397.1
Net working capital 1,245.7 1,220.1 1,073.6 1,023.9 756.5 714.8
Fixed asset investments
PP&E 863.4 840.6 885.4 848.5 755.6 751.7
Goodwill 1,326.2 1,316.4 1,475.3 1,469.5 1,475.8 1,487.4
Other intangible assets 1,788.6 1,774.2 1,878.2 1,853.7 1,835.5 1,847.3
Other assets 45.0 27.2 31.9 36.7 82.1 112.7
Total 4,023.2 3,958.4 4,270.8 4,208.4 4,149.0 4,199.1
Invested capital 5,268.9 5,178.5 5,344.4 5,232.3 4,905.5 4,913.9
Invested capital ex Goodwill 3,942.7 3,862.1 3,869.1 3,762.8 3,429.7 3,426.5
EBITA 630.4 715.1 684.1 713.6 763.1 708.2
NOPLAT 478.2 570.7 533.4 551.3 597.3 587.3
ROIC 9.1 % 11.0 % 10.0 % 10.5 % 12.2 % 12.0 %
ROIC ex Goodwill 12.1 % 14.8 % 13.8 % 14.7 % 17.4 % 17.1 %
As we can see, invested capital has decreased over the years from improvements in working capital management and reduction in capital expenditures. In fact, capital expenditures have declined significantly by almost 50% for Personal Care and more than 60% for Household Products between 2008-2014 to account for only 1.6% and 1.5% of segment sales respectively in FY14. At the same time, profitability has improved. What does this mean? ENR is investing less but getting more bang for their buck!
Source: Company Filings
16
Source: Company Filings
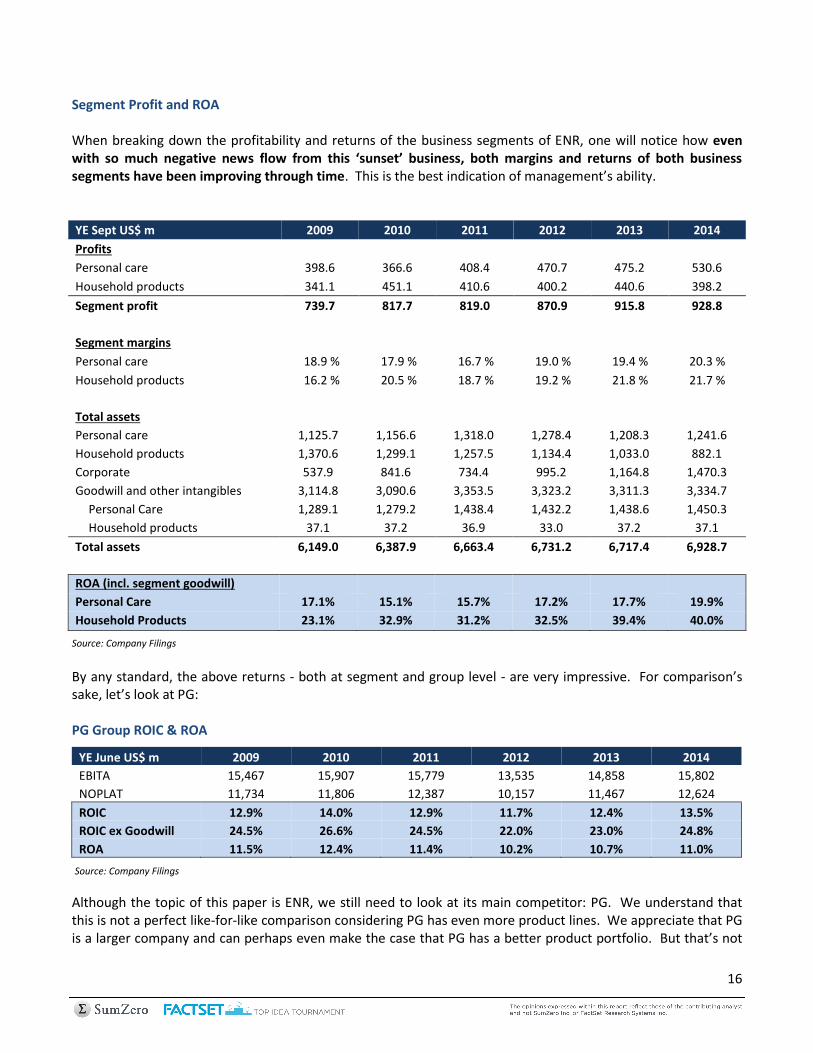
Segment Profit and ROA When breaking down the profitability and returns of the business segments of ENR, one will notice how even with so much negative news flow from this ‘sunset’ business, both margins and returns of both business segments have been improving through time. This is the best indication of management’s ability. YE Sept US$ m 2009 2010 2011 2012 2013 2014
Profits
Personal care 398.6 366.6 408.4 470.7 475.2 530.6
Household products 341.1 451.1 410.6 400.2 440.6 398.2
Segment profit 739.7 817.7 819.0 870.9 915.8 928.8
Segment margins
Personal care 18.9 % 17.9 % 16.7 % 19.0 % 19.4 % 20.3 %
Household products 16.2 % 20.5 % 18.7 % 19.2 % 21.8 % 21.7 %
Total assets
Personal care 1,125.7 1,156.6 1,318.0 1,278.4 1,208.3 1,241.6
Household products 1,370.6 1,299.1 1,257.5 1,134.4 1,033.0 882.1
Corporate 537.9 841.6 734.4 995.2 1,164.8 1,470.3
Goodwill and other intangibles 3,114.8 3,090.6 3,353.5 3,323.2 3,311.3 3,334.7
Personal Care 1,289.1 1,279.2 1,438.4 1,432.2 1,438.6 1,450.3
Household products 37.1 37.2 36.9 33.0 37.2 37.1
Total assets 6,149.0 6,387.9 6,663.4 6,731.2 6,717.4 6,928.7
ROA (incl. segment goodwill)
Personal Care 17.1% 15.1% 15.7% 17.2% 17.7% 19.9%
Household Products 23.1% 32.9% 31.2% 32.5% 39.4% 40.0%
Source: Company Filings
By any standard, the above returns - both at segment and group level - are very impressive. For comparison’s sake, let’s look at PG: PG Group ROIC & ROA
YE June US$ m 2009 2010 2011 2012 2013 2014
EBITA 15,467 15,907 15,779 13,535 14,858 15,802
NOPLAT 11,734 11,806 12,387 10,157 11,467 12,624
ROIC 12.9% 14.0% 12.9% 11.7% 12.4% 13.5%
ROIC ex Goodwill 24.5% 26.6% 24.5% 22.0% 23.0% 24.8%
ROA 11.5% 12.4% 11.4% 10.2% 10.7% 11.0%
Although the topic of this paper is ENR, we still need to look at its main competitor: PG. We understand that this is not a perfect like-for-like comparison considering PG has even more product lines. We appreciate that PG is a larger company and can perhaps even make the case that PG has a better product portfolio. But that’s not
17
the point here, in comparing ENR’s return profile with PG’s you will notice that both have great returns, but surprisingly, ENR is the more efficiently run company out of the two. Management has been nimble and quick to both counter headwinds and to identify new opportunities. PG’s rate of investment return has declined since they hit their peak in FY10 whereas ENR has continued creating value despite its number two position. To break this duopoly would require massive spending, but would it make sense to compete in a mature single-digit growth industry in such a way? The implications are clear. PG’s market leadership in ENR’s core segments only results in a larger revenue share; being second has not negatively affected ENR’s value proposition at all, that is: high returns and free cash flow. Better yet, there is ZERO incentive for PG to undercut prices and compete with Energizer to steal significant market share at the expense of their returns on capital (which have already been declining). The conclusion: continued high returns on investment for Energizer!

18
PG 39%
ENR 31%
Spectrum 14%
Other 15%
Batteries
PG 55%
ENR 20%
BIC 9%
Other 16%
Wet Shave
PG 46%
ENR 22%
KMB 17%
JNJ 5% Other
10%
Feminine Care
Long Term Proposition or Earnings Catalyst? Why Not Both?
U.S. 2013 Market Shares We question whether the graph above is that relevant in the ‘grand scheme of things’ for the long run battery industry dynamics. Aside from the fact that the graph excludes sales data from some major retailers such as Costco, it is clear that Energizer will continue to be a top alkaline battery globally generating ~37% ROA into literal perpetuity. The long-term value proposition for batteries remains as strong as ever.
Source: Statista, Goldman Sachs
U.S. Battery Market Share Gains/Losses
The graph captures the negative market sentiment on ENR’s batteries owing to distribution losses at some US stores such as Sam’s Club and Family Dollar in FY14
Energizer or Duracell?
Sometimes you see Duracell, sometimes you see Energizer. 7-Eleven, the largest convenient store chain in Hong Kong happens to stock ENR’s brand. The local brand below is US¢50 cheaper for the same number of batteries, but does it keep going and going and going?

19
Better yet, ENR’s Personal Care business presents a key opportunity both in the long term and as a growth play. Their Sun Care product line is the one category PG has no presence in. Together, Banana Boat and Hawaiian Tropic are market leaders that account for 25% share in the US. Major competitors include Bayer AG’s Coppertone and Johnson & Johnson’s Neutrogena/Piz Buin. With the global sun care market expected to grow 6.5% annually from its current global value of US$8.7bn7, this remains a large growth segment full of opportunities. As proof of this, international Sun Care sales 5 year CAGR recorded 14.5%8 with focus markets limited to only Canada, UK, Italy, Spain, Brazil, Chile, Mexico and Australia. Overall, we believe consensus estimates for 2% revenue growth in Personal Care is conservative and growth could pick up. Why? ENR owns leading Personal Care brands and have barely tapped the market outside of North America owing to the company’s lack of scale and route-to-market capabilities. ENR's Household and Personal Care lines are marketed separately in the US but bundled together for their international business; in preparation for the spinoff, management is looking to establish dedicated commercial organizations to separately cater for the two segments. In 2014, sales were evenly split between US and International markets; compare this to multinational peers with larger global scales:
If ENR can improve its global distribution capability, its brand portfolio is strong enough to challenge PG’s dominance with retailers in emerging markets where categories like Shaving and Sun Care have grown at CAGR 9% and 26% between 2008 and 2012.9 However, there is a general perception that with their immense scale and market share PG has already won.
“ENR has more direct exposure than any company…to a formidable and aggressive competitor in PG.” – Goldman Sachs
7 Datamonitor Sun-care Innovation Trends
8 Energizer 2013 Presentation
9 Energizer 2012 Analyst Presentation
2013 PG CL RB ULVR HEN
Intl sales % of total sales 61% 83% 64% 67% 82%
Source: Company Filings
Weak Route-to-Market
We have conducted some channel checks at Hong Kong’s largest supermarket chain Wellcome, feminine care shelf space is dominated by KMB and PG brands. No sign of ENR’s products. Yet...

20
7
8
9
10
11
2009 2010 2011 2012 2013 2014
PG ENR ULVR CL
11.1%
11.1%
13.7%
10.5%
0
200
400
600
800
1000
PG ENR ULVR CL
Bas
is P
oin
ts
In reality, PG has not been doing great. For most of the last three years, PG has underperformed its rivals on both revenue growth and profitability. PG’s traditional stronghold brands in Beauty, Health and Fabric/Home Care have been losing share to competitors. The market shares for these mature categories rarely shift more than 0.3% in a given year and yet according to their company filings, several brands within these categories have lost around 1% share over this period. While net margins improved on cost cuts, PG is the only one to see sales decline compared to average 1.3% growth at peers Colgate-Palmolive and Unilever. The key challenge for PG has been its inefficient business structure. They continue to run a highly centralized structure segmented by category which has historically helped them enter new markets by muscling out smaller competitors through innovation and marketing; however these markets have changed significantly over the last decade. Making global decisions at a centralized bureaucracy increases costs and slows reaction time. Colgate-Palmolive and Unilever have long switched to geographic segmentation. Under returning CEO A.G. Lafley, PG is aiming to sell half of its brands to re-ignite revenue growth. The issue however, does not appear to be with the brands themselves. Over the past 15 years, they have sold over 30 iconic brands that were supposedly a drag on earnings such as Jif peanut butter and Folgers coffee which have gone on to do quite well with J.M. Smucker posting 13% and 1% average revenue growth since 2012 respectively.
Rather, it seems PG’s poorly optimized structure has also resulted in weak brand management. Compared to
peers, they have had the worst trend in generating incremental revenues from marketing despite having
increased advertising spending as a % of sales by the largest magnitude:
Revenue Per Trailing 24M Advertising $
The takeaway here is that rather than size and scale, the ability to effectively manage brands is a key value
driver. Between ENR and PG, the battery market’s FCF opportunity is largely the same while revenue growth for
razor and feminine care products is likely to stay in low single-digits. Given such, realizing marginal
improvements across line items is a function of efficiency that PG sorely lacks as demonstrated by the differing
ROIC trends. Suddenly, PG does not look formidable anymore. So we have established that ENR is 1) still strongly positioned in its brand categories 2) has untapped opportunity in developing markets and 3) runs a more efficient operation than its greatest competitor. The obvious implication here is that both of ENR’s segments are attractive takeout targets (especially with PG now mired in restructuring its brand portfolio). Naturally, we should ask: Who?
Increase in Advertising % of Revenue (2009 – 2014)
Source: Company Filings *Labels represent latest FY advertising % sales
Source: Company Filing *ULVR not directly comparable; historically higher advertising % sales

21
The End Game
With Energizer’s imminent spinoff of their Household Goods and Personal Care business, it is worth studying what the potential end game is for investors like us.
1) Spinoff completes with one or both units acquired 2) Spinoff completes with no change in prevailing business economics 3) Spinoff completes with improved business prospects
Scenario 1: Spinoff completes with one or both units acquired Acquisition Potential Household Goods The battery takeout will be straightforward. PG has successfully divested both its battery businesses this year: selling Duracell to Berkshire Hathaway for US$3bn and Fujian Nanping Nanfu Battery (China’s largest battery maker) to CDH Investments for US$560m. It is too early to tell who will be or is interested in taking out Energizer/Eveready. However the cash flow is clearly attractive to private equity companies or enterprises that are interested in tapping into this cash cow, either to reinvest in the business again, or to use the battery business' free cash as future 'float'. Now if we compare ENR’s battery segment to Duracell, we’ll find our Bunny posts EBITA margins close to 22% which is even higher than Duracell’s 18%! Personal Care There are a wide range of potential acquirers (excluding PG since it would unlikely pass antitrust review) for ENR’s Personal Care business, either as a whole or in parts. We take a look at the top contenders: Unilever Global consumer staples giant based in the UK with operations in segments Asia, AMET (Africa, Middle East and Turkey), RUB (Russia, Ukraine and Belarus), Americas and Europe. ULVR’s brand categories span across Personal Care, Foods, Refreshment and Home Care and include iconic brands such as Dove, Lipton, Vaseline, Ben & Jerry’s, Axe, Rexona and more. FY13 YE December turnover was ~US$62bn while “core” EBIT of ~US$9bn which puts them roughly at the same size as PG. ULVR is the most likely buyer of ENR’s Personal Care division owing to several key motivations: 1) Expansion into men’s care categories: ULVR’s popular male deodorant brand Axe stands out amongst their
other predominantly feminine personal care products. With their launch of Dove Men+Care in 2010, it is clear that expansion into male personal care is a high priority. For its part, ULVR claims that Axe is the category leader outside of shaving…but shaving has definitely been on its mind:
As of December 15, 2014
Ticker LSE: ULVR
Share Price £2,542
Market Cap (£ m) 75,657
Shares Out. (m) 1,283.5
3M ADV (m) 3.42m
52 Week High / Low £2763 / £2292
Float / Short Interest 1283.5m / 3.67%

22
2) Geographic diversification: ULVR’s strongest markets have been emerging economies in Asia/AMET/RUB accounting for 40% of sales and 37% EBIT. However, its operations in America are relatively more profitable with 38% EBIT coming from 33% revenues. Europe has been weak on both metrics; as a result, ULVR has moved to shift more towards America with its acquisition of Alberto Culver in 2010. The rationale was that with its recognizable brands - which include VO5 and TRESemme - generating 64% of sales from the US, ULVR could at once shift its geographic mix and have the option to extend the brands into its stronger emerging markets.10 Sounds familiar? Which other company that is smaller than ULVR has high margins and great returns in the US?
3) Focus: The rampant consolidation of brands in the past has left us with conglomerates owning all the brands. Many of these brands end up underperforming for various reasons such as structural decline or lack of focus on brand development, and are now a drag on group profits. The solution is of course, to spinoff certain divisions, similar to what ENR or KRFT has done. ULVR has joined the fray and announced earlier this month that it will split its US and European spreads operation – with brands like Flora and I Can’t Believe It’s Not Butter – into a standalone unit. The move will allow them room to refocus on winning brands, which could include ENR’s Personal Care business.
Colgate-Palmolive A major player of toiletries and household products, they also have a strong presence in pet food through Hill’s brand. We mentioned CL in our comparison with PG, but despite good synergies and an opportunity to branch out from its underwhelming deodorant business, CL is unlikely to acquire ENR’s Personal Care division as they have employed significant leverage with 184% net debt-to-equity. ULVR runs 57% net gearing and has access to US$6.4bn credit facility in addition to equity or bond financing options thus allowing for a lot more flexibility.
10
Clementine Fletcher. Bloomberg http://www.bloomberg.com/news/2010-09-27/unilever-agrees-to-buy-alberto-culver-for-3-7-billion.html
As of December 15, 2014
Ticker NYSE: CL
Share Price $67.95
Market Cap (U$ m) 61,529
Shares Out. (m) 911.4
3M ADV (m) 3.16m
52 Week High / Low $70.11 / $59.75
Float / Short Interest 906.6m / 3.53%
Axe-Schick Collaboration
Last year, ULVR approached ENR to co-launch the Axe-Schick razor. While Gillette has not had much success in extending its razor brand to other personal care products, its 70% market share in razors has been absolute. Acquiring ENR’s household business would not only give ULVR a strong starting position in razors but the added bonus of acquiring Edge, the market leader in shave preparation that ENR owns.
23
Kimberly Clark Does your baby wear Huggies or Pampers? KMB is second in the infant care category through their Huggies disposable diaper brand after PG. While often ignored due to its low sales contribution, ENR’s infant care line consisting of diaper disposal mechanisms and feeding products could be highly complementary to KMB’s disposable diaper focus. KMB also owns the Kotex brand, which has been a formidable contender to PG in international markets compared to ENR’s lacklustre showing. FY13 YE December revenue came in at US$21bn with US$3.2bn EBIT. KMB would primarily be interested in ENR’s feminine care brands that now include Stayfree, Carefree and o.b. alongside Playtex meaning that KMB could own almost ALL of the feminine care brands with the takeover and thus shoot into market leading position. Unfortunately, KMB also runs a highly leveraged operation at 100% net debt-to-equity which puts them in a similar position to CL. Johnson & Johnson JNJ is a veritable giant in health care with their Pharmaceuticals and Medical Devices segments totalling 79% of US$71bn sales and 88% of US$16.4bn EBIT for YE December 2013. Less often mentioned is their Consumer Health Care segment purchased from Pfizer in 2006 which includes huge brands such as Listerine, Tylenol, Band-Aid, Aveeno and Neutrogena. JNJ could opportunistically take US market leadership by acquiring ENR’s Sun Care brands while Bayer AG is still integrating their recent purchase of Coppertone from Merck. On the other hand, JNJ would likely have no interest in ENR’s other Personal Care brands, considering that ENR purchased JNJ’s feminine hygiene unit for $185m in late 2013. Thus it may be difficult to make a bid for the Banana Boat/Hawaiian Tropic as a standalone unit given the attractiveness of the overall division to other buyers and the dis-synergies that would be incurred. Valuation Under a takeout scenario, it makes total sense to look at precedent transactions for the following reasons:
The acquirer, target, and the market (investors) will use this as a proxy for valuation and benchmark how reasonable the deal looks based on previous metrics. After all, humans do have a tendency for 'anchoring and adjustment' biases
Under an M&A scenario, the analysis would centre firstly on whether the deal would go through or not, and secondly on the whether the deal makes sense in the long run (this usually takes years to unravel and is generally beyond an event investor’s time horizon). The easiest first cut approach in determining this, is again, to look at past transactions
As of December 15, 2014
Ticker NYSE: KMB
Share Price $112.35
Market Cap (U$ m) 41,864
Shares Out. (m) 372.5
3M ADV (m) 1.78m
52 Week High / Low $116.78 / $98.27
Float / Short Interest 371.3m / 1.67%
As of December 15, 2014
Ticker NYSE: JNJ
Share Price $103.96
Market Cap (U$ m) 287,636
Shares Out. (m) 2799.1
3M ADV (m) 8.30m
52 Week High / Low $109.49 / $86.09
Float / Short Interest 2798.6m / 0.91%

24
Household Products It has already been discussed in the previous segments that Energizer’s Energizer is a high returning business with declining revenue trends. Under such headwinds, what deal multiple should we use to value the ENR’s Household segment? Our work has really been made easy with the help from the greatest investor ever… On November 13th 2014, Warren Buffett announced that his firm, Berkshire Hathaway would purchase Duracell from PG for US$4.7bn in a share swap deal. Berkshire will buy the Duracell unit through disposal of his PG shares currently worth US$4.7bn back to PG to fund the Duracell purchase. PG will subsequently infuse US$1.8bn in cash into the Duracell business. The deal is expected to close in the 2H 2015.11 “We haven’t had a really clean valuation benchmark on a battery business in quite some time…This sets that benchmark. Takeover speculation will boost the shares, though, and the household-products division, which is made up mostly of the battery business, could command as much as 9 times Ebitda in an eventual sale…That translates to more than $3 billion, based on his estimates for 2016 profit.”- Stephen Powers, UBS 12
The deal fits very well for Berkshire, as they now can purchase a cash cow business without paying any capital gains tax from their PG stake disposal which only cost him US$336m to accumulate years before. Assuming a 35% capital gains tax rate, this is a savings of more than US$1bn for Buffett and his firm. Other than buying a great, stable business, Buffett has already discovered other forms of synergies, notably his appointment of Angelo Pantaleo, the head of Berkshire subsidiary Marmon Group to oversee Duracell after deal completion.13 Although slightly off-topic, it is hard not to wonder why Buffett would want to dispose of his stake in PG, ENR’s main competitor, if they were so formidable. We strongly believe that his rationale for the PG disposal (along with the tax savings) is underlined in the previous sections. He has famously indicated that he runs Berkshire to maximise long term shareholder returns from investments rather than short term gains from tax loss harvesting or the like. Taxes are in his consideration, but it isn’t the primary driver for any deal he strikes. Duracell’s EBITDA amounted to $414m in 2014. Since PG would inject $1.8bn in cash into Duracell’s business, the deal’s adjusted EV amounts to $2.9bn. This implies an EV/EBITDA deal multiple of 7.0x when other mature consumer companies usually trade closer to the 8-10x range. Obviously, the real deal multiple for Berkshire would be even lower than 7.0x, considering the tax savings of more than $1bn, but it is unfair and meaningless to include this as a fair comparison for potential buyers of Energizer given that they are unlikely to enjoy such tax savings.
Target Buyer Price (US$ m) EBITDA EV/EBITDA
Duracell Berkshire Hathaway 2,900* 414 7.0x
*Adjusted for cash injection Source: Reuters
It is therefore fair to say that based on precedent transactions, ENRs battery business should be valued at an EV/EBITDA multiple of between 7-10x. One may argue that we have not provided enough comparables here, but if Duracell isn’t THE comparable, then what else should be used?
11 Reuters http://www.reuters.com/article/2014/11/13/us-duracell-m-a-berkshire-hatha-idUSKCN0IX1F020141113 12 Bloomberg http://www.bloomberg.com/news/2014-11-14/buffett-duracell-deal-sets-energizer-as-target-real-m-a.html 13 Bloomberg http://www.bloomberg.com/news/2014-12-02/berkshire-s-marmon-said-to-oversee-duracell-after-acquisition.html
25
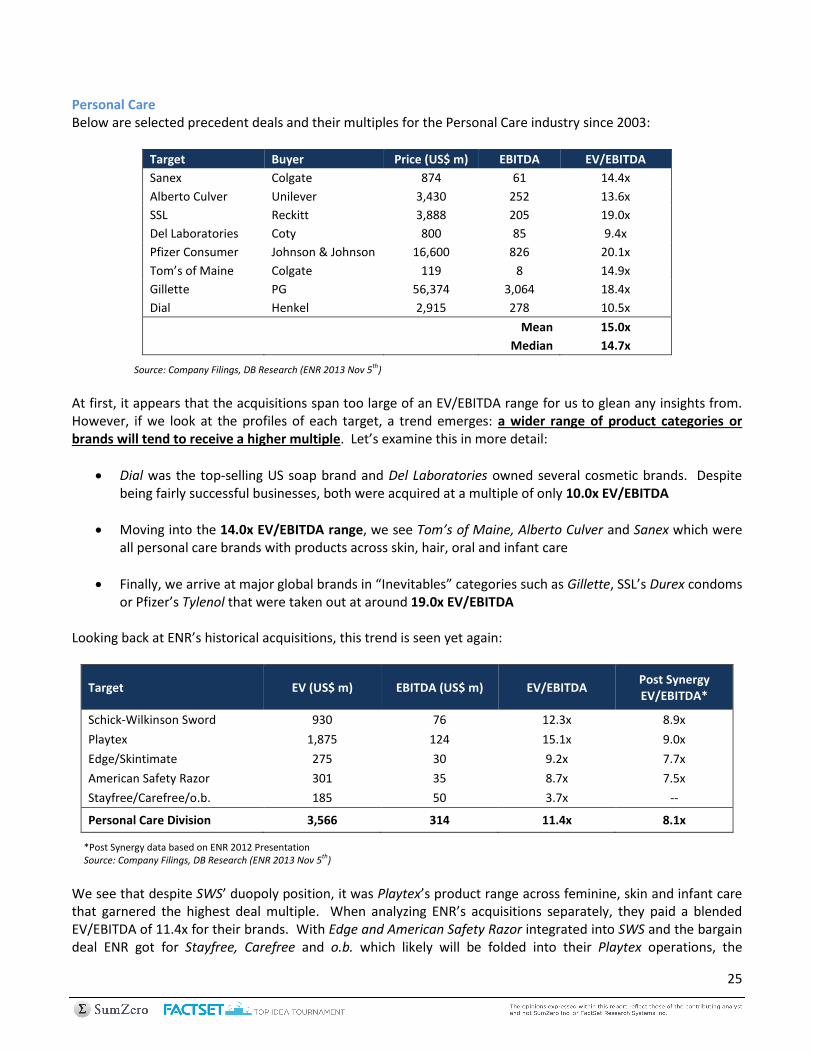
Personal Care Below are selected precedent deals and their multiples for the Personal Care industry since 2003:
Target Buyer Price (US$ m) EBITDA EV/EBITDA
Sanex Colgate 874 61 14.4x
Alberto Culver Unilever 3,430 252 13.6x
SSL Reckitt 3,888 205 19.0x
Del Laboratories Coty 800 85 9.4x
Pfizer Consumer Johnson & Johnson 16,600 826 20.1x
Tom’s of Maine Colgate 119 8 14.9x
Gillette PG 56,374 3,064 18.4x
Dial Henkel 2,915 278 10.5x
Mean 15.0x
Median 14.7x
Source: Company Filings, DB Research (ENR 2013 Nov 5th)
At first, it appears that the acquisitions span too large of an EV/EBITDA range for us to glean any insights from. However, if we look at the profiles of each target, a trend emerges: a wider range of product categories or brands will tend to receive a higher multiple. Let’s examine this in more detail:
Dial was the top-selling US soap brand and Del Laboratories owned several cosmetic brands. Despite being fairly successful businesses, both were acquired at a multiple of only 10.0x EV/EBITDA
Moving into the 14.0x EV/EBITDA range, we see Tom’s of Maine, Alberto Culver and Sanex which were all personal care brands with products across skin, hair, oral and infant care
Finally, we arrive at major global brands in “Inevitables” categories such as Gillette, SSL’s Durex condoms or Pfizer’s Tylenol that were taken out at around 19.0x EV/EBITDA
Looking back at ENR’s historical acquisitions, this trend is seen yet again:
Target EV (US$ m) EBITDA (US$ m) EV/EBITDA Post Synergy EV/EBITDA*
Schick-Wilkinson Sword 930 76 12.3x 8.9x
Playtex 1,875 124 15.1x 9.0x
Edge/Skintimate 275 30 9.2x 7.7x
American Safety Razor 301 35 8.7x 7.5x
Stayfree/Carefree/o.b. 185 50 3.7x --
Personal Care Division 3,566 314 11.4x 8.1x
*Post Synergy data based on ENR 2012 Presentation Source: Company Filings, DB Research (ENR 2013 Nov 5th)
We see that despite SWS’ duopoly position, it was Playtex’s product range across feminine, skin and infant care that garnered the highest deal multiple. When analyzing ENR’s acquisitions separately, they paid a blended EV/EBITDA of 11.4x for their brands. With Edge and American Safety Razor integrated into SWS and the bargain deal ENR got for Stayfree, Carefree and o.b. which likely will be folded into their Playtex operations, the

26
synergies from the acquisitions are immense. Every acquisition made by ENR has been accretive. We believe that ENR’s overall Personal Care portfolio belongs in the “Inevitables” category detailed above and deserves at least 14.0x EV/EBITDA. The best part is yet to come though… ENR has graciously made our work easier by disclosing the EV/EBITDA per acquisition NET of synergies. Synergies are always a ‘buzzword’ in M&A scenarios, as the acquirer usually needs to pay a premium to purchase the target. For instance, PG paid an 18% premium for Gillette… That said, ENR have been masters of deal making, with all of their historical acquisitions, ENR further realized a total US$125m EBITDA (or an additional 40%) beyond what they were expecting due to synergies and successful integrations! The blended 11.4x times paid effectively is only 8.1x. Now that’s a grab for them! Management just keeps executing and executing and executing! Before we get ahead of ourselves, let’s step back and put together a base case assuming NO takeout premiums. At a segment level, using the 7.0x multiple at which Warren Buffet and CDH Investments purchased PG’s battery businesses, we can back out and infer how the market is currently valuing ENR’s Personal Care unit and what our share price would be if we used 14x EV/EBITDA vs its current implied valuation:
Implied PC EV (7x HH EV/EBITDA)
As of December 15, 2014 US$ m
Market Cap (based on current share price) 7,813
Plus Debt 2,288
Less Cash (1,129)
Plus Pension Deficit 319
EV 8,653
Household Goods (on 7x EV/EBITDA) 3,064
Implied Personal Care EV 5,589
Implied PC EV/EBITDA 9.1 x
Blended EV/EBITDA 8.2 x
Implied Group EV (7x EV/EBITDA for HH & 14x for PC)
As of December 15, 2014 US$ m
EV 11,628
Less Debt (2,288)
Plus Cash 1,129
Less Pension Deficit (319)
Market Cap 10,788
Shares Outstanding 62.1
Share Price (US$) 173.72
Household Goods (on 7x EV/EBITDA) 3,064
Personal Care (on 14x EV/EBITDA) 8,564
PC EV/EBITDA 14.0 x
Blended EV/EBIT 11.0 x

27
The 2 tables above clearly show the potential upside of the stock if the Personal Care unit is valued at a higher multiple. With Household at 7.0x, the valuable Personal Care business is currently valued only at a meagre 9.1x. We are very aware of the fact that valuation is more an art than an exact science, and as such have provided a sensitivity table below to investigate the range of possible outcomes.
Personal Care
10.0x 11.0x 12.0x 13.0x 14.0x 15.0x 16.0x 17 x 18 x
5.0x $ 110 $ 120 $ 130 $ 139 $ 149 $ 159 $ 169 $ 179 $ 189
6.0x $ 117 $ 127 $ 137 $ 146 $ 156 $ 166 $ 176 $ 186 $ 196
7.0x $ 124 $ 134 $ 144 $ 154 $ 163 $ 173 $ 183 $ 193 $ 203
8.0x $ 131 $ 141 $ 151 $ 161 $ 170 $ 180 $ 190 $ 200 $ 210
9.0x $ 138 $ 148 $ 158 $ 168 $ 177 $ 187 $ 197 $ 207 $ 217
10.0x $ 145 $ 155 $ 165 $ 175 $ 184 $ 194 $ 204 $ 214 $ 224
We can see that ignoring ANY takeover premium, based on precedent multiples the Downside Case is $137 and the Upside Case is $197. In both cases, our appraised value of ENR is higher than current market price. Now that is what 'margin of safety' truly means. We have opted to go with 7.0x Household Goods and 14.0x Personal Care to come to a fair value of $163 which is very conservative considering some on the Street thinks the batteries are worth 9.0x and Personal Care likely belongs in the “inevitable” 19.0x category.
"Heads I win; tails, I don’t lose much." - Mohnish Pabrai, The Dhando Investor In this rare case, tails we still win! Considering there is essentially no downside here from a valuation perspective, we believe there is no need to further explore other types of analysis such as the potential narrowing of "holdco discounts", an approach that is often employed in our industry. Having said that; investors who are interested in taking such a route may discover even more upside.
Scenario 2: Spinoff completes with no change in prevailing business economics Possibly, the worst case scenario for this investment thesis is the scenario where ENR completes the spinoff of both businesses and there are no significant improvements in the economics of either. As a prudent investor, one has to study this scenario too to see our potential 'downside'. The best way to look at this scenario is to see ENR as a bond that pays out interest each year (FCF) without any, or barely any growth in the face value of this bond in the future. In other words, this is the DCF approach. Since 2009, ENR’s Household Goods division has begun a declining trend in revenue growth at low single digits y/y decline, while the Personal Care business has experienced low single digits organic top line growth. This revenue trajectory appears to be consistent going forward, considering that management has guided for FY15 (first 9 months) to exhibit similar growth rates. As such, it is too conservative to assume that revenue growth going forward at a group level will be 0%.
Ho
use
ho
ld G
oo
ds
28
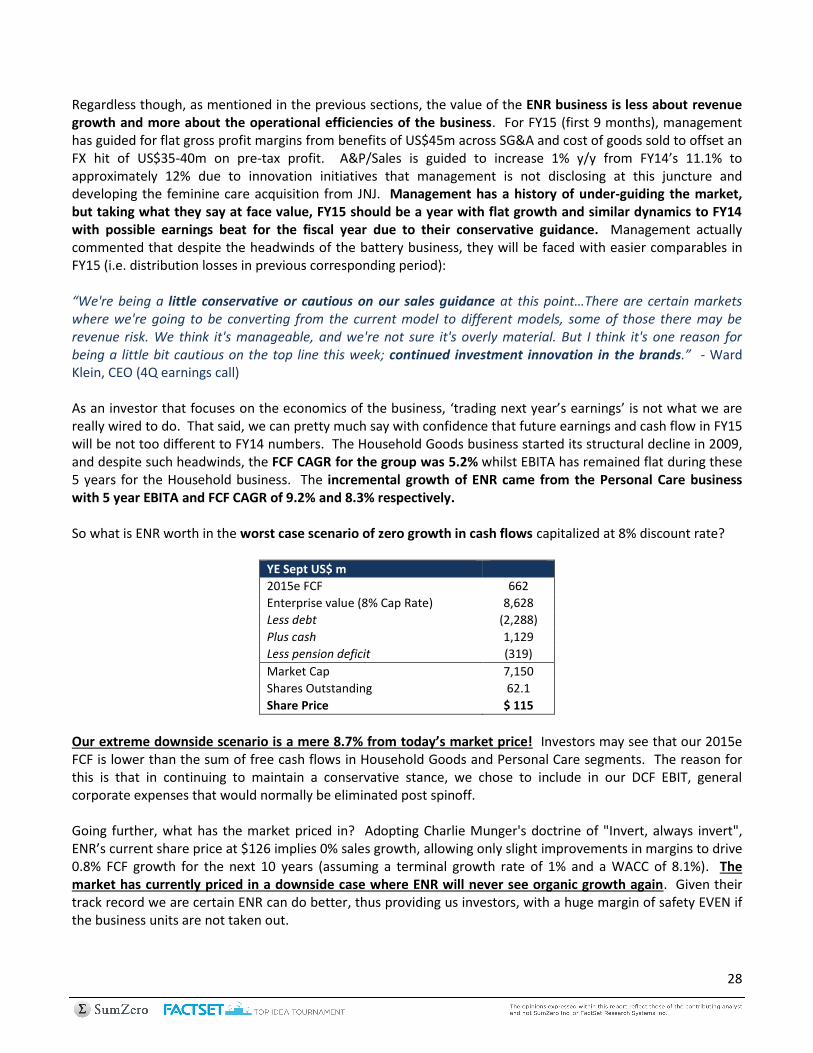
Regardless though, as mentioned in the previous sections, the value of the ENR business is less about revenue growth and more about the operational efficiencies of the business. For FY15 (first 9 months), management has guided for flat gross profit margins from benefits of US$45m across SG&A and cost of goods sold to offset an FX hit of US$35-40m on pre-tax profit. A&P/Sales is guided to increase 1% y/y from FY14’s 11.1% to approximately 12% due to innovation initiatives that management is not disclosing at this juncture and developing the feminine care acquisition from JNJ. Management has a history of under-guiding the market, but taking what they say at face value, FY15 should be a year with flat growth and similar dynamics to FY14 with possible earnings beat for the fiscal year due to their conservative guidance. Management actually commented that despite the headwinds of the battery business, they will be faced with easier comparables in FY15 (i.e. distribution losses in previous corresponding period): “We're being a little conservative or cautious on our sales guidance at this point…There are certain markets where we're going to be converting from the current model to different models, some of those there may be revenue risk. We think it's manageable, and we're not sure it's overly material. But I think it's one reason for being a little bit cautious on the top line this week; continued investment innovation in the brands.” - Ward Klein, CEO (4Q earnings call) As an investor that focuses on the economics of the business, ‘trading next year’s earnings’ is not what we are really wired to do. That said, we can pretty much say with confidence that future earnings and cash flow in FY15 will be not too different to FY14 numbers. The Household Goods business started its structural decline in 2009, and despite such headwinds, the FCF CAGR for the group was 5.2% whilst EBITA has remained flat during these 5 years for the Household business. The incremental growth of ENR came from the Personal Care business with 5 year EBITA and FCF CAGR of 9.2% and 8.3% respectively. So what is ENR worth in the worst case scenario of zero growth in cash flows capitalized at 8% discount rate?
YE Sept US$ m
2015e FCF 662
Enterprise value (8% Cap Rate) 8,628
Less debt (2,288)
Plus cash 1,129
Less pension deficit (319)
Market Cap 7,150
Shares Outstanding 62.1
Share Price $ 115
Our extreme downside scenario is a mere 8.7% from today’s market price! Investors may see that our 2015e FCF is lower than the sum of free cash flows in Household Goods and Personal Care segments. The reason for this is that in continuing to maintain a conservative stance, we chose to include in our DCF EBIT, general corporate expenses that would normally be eliminated post spinoff. Going further, what has the market priced in? Adopting Charlie Munger's doctrine of "Invert, always invert", ENR’s current share price at $126 implies 0% sales growth, allowing only slight improvements in margins to drive 0.8% FCF growth for the next 10 years (assuming a terminal growth rate of 1% and a WACC of 8.1%). The market has currently priced in a downside case where ENR will never see organic growth again. Given their track record we are certain ENR can do better, thus providing us investors, with a huge margin of safety EVEN if the business units are not taken out.
29
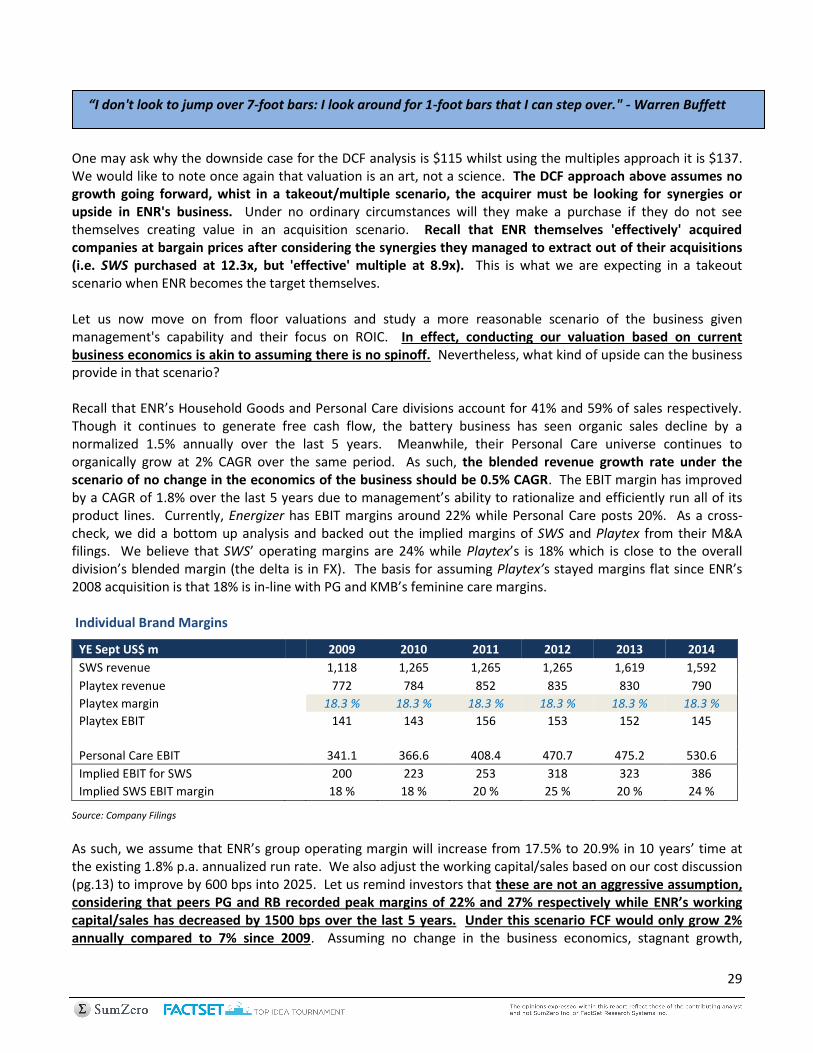
“I don't look to jump over 7-foot bars: I look around for 1-foot bars that I can step over." - Warren Buffett One may ask why the downside case for the DCF analysis is $115 whilst using the multiples approach it is $137. We would like to note once again that valuation is an art, not a science. The DCF approach above assumes no growth going forward, whist in a takeout/multiple scenario, the acquirer must be looking for synergies or upside in ENR's business. Under no ordinary circumstances will they make a purchase if they do not see themselves creating value in an acquisition scenario. Recall that ENR themselves 'effectively' acquired companies at bargain prices after considering the synergies they managed to extract out of their acquisitions (i.e. SWS purchased at 12.3x, but 'effective' multiple at 8.9x). This is what we are expecting in a takeout scenario when ENR becomes the target themselves. Let us now move on from floor valuations and study a more reasonable scenario of the business given management's capability and their focus on ROIC. In effect, conducting our valuation based on current business economics is akin to assuming there is no spinoff. Nevertheless, what kind of upside can the business provide in that scenario? Recall that ENR’s Household Goods and Personal Care divisions account for 41% and 59% of sales respectively. Though it continues to generate free cash flow, the battery business has seen organic sales decline by a normalized 1.5% annually over the last 5 years. Meanwhile, their Personal Care universe continues to organically grow at 2% CAGR over the same period. As such, the blended revenue growth rate under the scenario of no change in the economics of the business should be 0.5% CAGR. The EBIT margin has improved by a CAGR of 1.8% over the last 5 years due to management’s ability to rationalize and efficiently run all of its product lines. Currently, Energizer has EBIT margins around 22% while Personal Care posts 20%. As a cross-check, we did a bottom up analysis and backed out the implied margins of SWS and Playtex from their M&A filings. We believe that SWS’ operating margins are 24% while Playtex’s is 18% which is close to the overall division’s blended margin (the delta is in FX). The basis for assuming Playtex’s stayed margins flat since ENR’s 2008 acquisition is that 18% is in-line with PG and KMB’s feminine care margins. Individual Brand Margins
YE Sept US$ m
2009 2010 2011 2012 2013 2014
SWS revenue
1,118 1,265 1,265 1,265 1,619 1,592
Playtex revenue
772 784 852 835 830 790
Playtex margin
18.3 % 18.3 % 18.3 % 18.3 % 18.3 % 18.3 %
Playtex EBIT
141 143 156 153 152 145
Personal Care EBIT
341.1 366.6 408.4 470.7 475.2 530.6
Implied EBIT for SWS
200 223 253 318 323 386
Implied SWS EBIT margin
18 % 18 % 20 % 25 % 20 % 24 %
Source: Company Filings
As such, we assume that ENR’s group operating margin will increase from 17.5% to 20.9% in 10 years’ time at the existing 1.8% p.a. annualized run rate. We also adjust the working capital/sales based on our cost discussion (pg.13) to improve by 600 bps into 2025. Let us remind investors that these are not an aggressive assumption, considering that peers PG and RB recorded peak margins of 22% and 27% respectively while ENR’s working capital/sales has decreased by 1500 bps over the last 5 years. Under this scenario FCF would only grow 2% annually compared to 7% since 2009. Assuming no change in the business economics, stagnant growth,
30
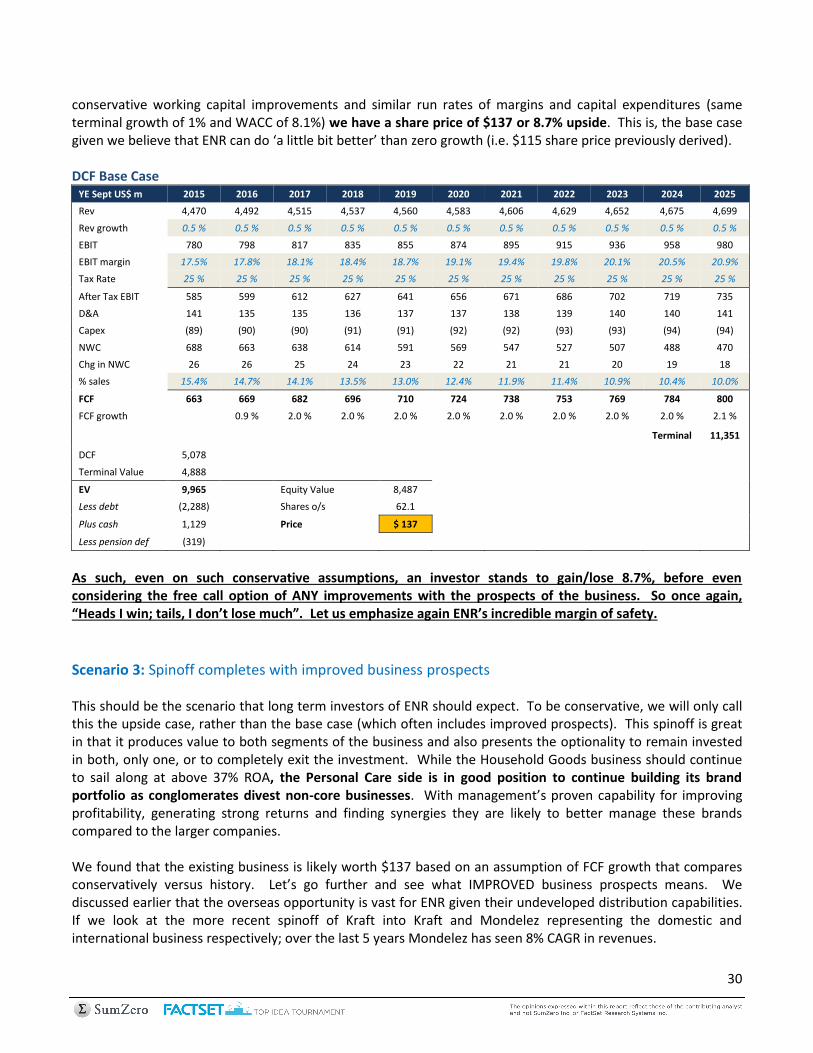
conservative working capital improvements and similar run rates of margins and capital expenditures (same terminal growth of 1% and WACC of 8.1%) we have a share price of $137 or 8.7% upside. This is, the base case given we believe that ENR can do ‘a little bit better’ than zero growth (i.e. $115 share price previously derived). DCF Base Case
YE Sept US$ m 2015 2016 2017 2018 2019 2020 2021 2022 2023 2024 2025
Rev 4,470 4,492 4,515 4,537 4,560 4,583 4,606 4,629 4,652 4,675 4,699
Rev growth 0.5 % 0.5 % 0.5 % 0.5 % 0.5 % 0.5 % 0.5 % 0.5 % 0.5 % 0.5 % 0.5 %
EBIT 780 798 817 835 855 874 895 915 936 958 980
EBIT margin 17.5% 17.8% 18.1% 18.4% 18.7% 19.1% 19.4% 19.8% 20.1% 20.5% 20.9%
Tax Rate 25 % 25 % 25 % 25 % 25 % 25 % 25 % 25 % 25 % 25 % 25 %
After Tax EBIT 585 599 612 627 641 656 671 686 702 719 735
D&A 141 135 135 136 137 137 138 139 140 140 141
Capex (89) (90) (90) (91) (91) (92) (92) (93) (93) (94) (94)
NWC 688 663 638 614 591 569 547 527 507 488 470
Chg in NWC 26 26 25 24 23 22 21 21 20 19 18
% sales 15.4% 14.7% 14.1% 13.5% 13.0% 12.4% 11.9% 11.4% 10.9% 10.4% 10.0%
FCF 663 669 682 696 710 724 738 753 769 784 800
FCF growth
0.9 % 2.0 % 2.0 % 2.0 % 2.0 % 2.0 % 2.0 % 2.0 % 2.0 % 2.1 %
Terminal 11,351
DCF 5,078
Terminal Value 4,888
EV 9,965
Equity Value 8,487
Less debt (2,288)
Shares o/s 62.1
Plus cash 1,129
Price $ 137
Less pension def (319)
As such, even on such conservative assumptions, an investor stands to gain/lose 8.7%, before even considering the free call option of ANY improvements with the prospects of the business. So once again, “Heads I win; tails, I don’t lose much”. Let us emphasize again ENR’s incredible margin of safety.
Scenario 3: Spinoff completes with improved business prospects This should be the scenario that long term investors of ENR should expect. To be conservative, we will only call this the upside case, rather than the base case (which often includes improved prospects). This spinoff is great in that it produces value to both segments of the business and also presents the optionality to remain invested in both, only one, or to completely exit the investment. While the Household Goods business should continue to sail along at above 37% ROA, the Personal Care side is in good position to continue building its brand portfolio as conglomerates divest non-core businesses. With management’s proven capability for improving profitability, generating strong returns and finding synergies they are likely to better manage these brands compared to the larger companies. We found that the existing business is likely worth $137 based on an assumption of FCF growth that compares conservatively versus history. Let’s go further and see what IMPROVED business prospects means. We discussed earlier that the overseas opportunity is vast for ENR given their undeveloped distribution capabilities. If we look at the more recent spinoff of Kraft into Kraft and Mondelez representing the domestic and international business respectively; over the last 5 years Mondelez has seen 8% CAGR in revenues.

31
40
45
50
55
60
65
2012 2013 2014
20
25
30
35
40
45
2012 2013 2014
KRFT Post-Spinoff MDLZ Post-Spinoff Source: Bloomberg
Since the spinoff, KRFT and MDLZ have recorded gains of 40% and 33% respectively driven by the improved economics for their businesses. Similarly, we believe that after the spinoff, each ENR division can pursue the international opportunity more effectively than when bundled together as they will be separating the marketing divisions between Household Goods and Personal Care as said before. We first assume the North American business maintains its historical 0.5% growth while international sales as a % of total revenue will increase by ~1% per annum starting from 49% in 2014. We will see that revenue growth would return to a 4% run rate, implying 3.6% CAGR over 10 years. International Expansion
YE Sept US$ m 2015 2016 2017 2018 2019 2020 2021 2022 2023 2024 2025
Domestic Rev 2,273 2,284 2,296 2,307 2,319 2,331 2,342 2,354 2,366 2,377 2,389
y/y 0.5% 0.5% 0.5% 0.5% 0.5% 0.5% 0.5% 0.5% 0.5% 0.5% 0.5%
International Rev 2,264 2,366 2,494 2,650 2,837 3,031 3,234 3,445 3,666 3,895 4,134
% sales 50% 51% 52% 54% 55% 57% 58% 59% 60% 62% 63%
y/y 3.6% 4.5% 5.4% 6.3% 7.0% 6.9% 6.7% 6.5% 6.4% 6.3% 6.1%
Total Rev 4,537 4,650 4,790 4,957 5,155 5,362 5,576 5,799 6,031 6,272 6,523
y/y 0.5% 2.5% 3.0% 3.5% 4.0% 4.0% 4.0% 4.0% 4.0% 4.0% 4.0%
Source: Company Filings
Next is to see what type of margins to expect. We mentioned in the previous scenario that SWS and Playtex have margins of 24% and 18% respectively. Of course, we must refer back to our market leader PG. While we have discussed PG’s general weakness at length, we note that their Grooming segment (i.e. Gillette) still sets an outrageous benchmark for profitability at 30% EBIT margin. To be conservative, we do not believe that SWS can achieve Gillette’s 30% EBIT margin due to PG’s advantage in operating leverage and scale, as such, we maintain that ENR’s group operating margin will increase from 17.5% to 20.9% as in the base case to arrive at a DCF share price of $176 or 40% upside. We point out that this result comes only from a slight pickup in revenues and actually discounts management exceeding expectations on improving profitability…but guess what management has been REALLY good at doing?

32
DCF Upside Case
YE Sept US$ m 2015 2016 2017 2018 2019 2020 2021 2022 2023 2024 2025
Rev 4,537 4,650 4,790 4,957 5,155 5,362 5,576 5,799 6,031 6,272 6,523
Rev growth 2.0 % 2.5 % 3.0 % 3.5 % 4.0 % 4.0 % 4.0 % 4.0 % 4.0 % 4.0 % 4.0 %
EBIT 794 828 869 915 969 1,026 1,086 1,150 1,217 1,289 1,365
EBIT margin 17.5% 17.8% 18.1% 18.5% 18.8% 19.1% 19.5% 19.8% 20.2% 20.5% 20.9%
Tax Rate 25 % 25 % 25 % 25 % 25 % 25 % 25 % 25 % 25 % 25 % 25 %
After Tax EBIT 595 621 651 686 727 769 815 862 913 967 1,023
D&A 141 140 144 149 155 161 167 174 181 188 196
Capex (91) (93) (96) (99) (103) (107) (112) (116) (121) (125) (130)
NWC 699 686 677 671 668 665 663 660 658 655 652
Chg in NWC 16 13 9 6 3 3 3 3 3 3 3
% sales 15.4% 14.7% 14.1% 13.5% 13.0% 12.4% 11.9% 11.4% 10.9% 10.4% 10.0%
FCF 662 681 709 742 781 826 873 923 976 1,032 1,091
FCF growth
2.8 % 4.1 % 4.7 % 5.3 % 5.7 % 5.7 % 5.7 % 5.7 % 5.7 % 5.7 %
Terminal 15,475
DCF 5,761
Terminal Value 6,664
EV 12,425
Equity Value 10,946
Less debt (2,288)
Shrs Out 62.1
Plus cash 1,129
Price $ 176
Less pension def (319)
The model above implies a moderately successful expansion peaking 5 years from now, which we believe is fair given ENR’s strong foundation of brands. What’s this? A share price of $176 lands extremely close to the target prices implied by takeout multiples between 7-9x for Household Goods and 14-16x for Personal Care discussed in the previous segment. With two completely separate approaches and set of assumptions we have triangulated the potential value of ENR’s overall business, which offers us a much higher degree of confidence.

33
Integrating the Analysis - Valuation
We have represented prices reflecting the different scenarios of ENR and its circumstances to give the reader perspective and to appreciate the margin of safety of this investment. Having said that, we still need to put all the scenarios into consideration and derive a blended target price. We have decided to provide weightings for each of the outcomes presented, to come to a conservative, yet reasonable price. Let’s review our multiple outcomes:
For our downside case, which assumes an extreme scenario of zero growth in cash flows into perpetuity, we have assigned a 10% weighting.
Our base case is given a 20% weighting based on the assumption that the business economics have peaked and will never improve again. The target price here is based on the same run rates for revenue and EBIT margin growth and a working capital reduction BELOW what management has achieved historically
We assign a 35% weighting to our upside case, which implies no significant improvements other than ENR being able to tap into international markets
Finally, we believe the takeout case deserves a 35% weighting given that both of ENR’s segments are not only widely viewed as attractive takeout targets, but as we covered above, can offer real synergistic value to many potential suitors. We would like to remind investors that our EV/EBITDA takeout multiples of 7.0x for Household Goods and 14.0x for Personal Care are at the low range of possible outcomes
Probability Price Weighted price
Downside case 10 % $ 115 $ 11.5
Base case 20 % $ 137 $ 27.4
Upside case 35 % $ 176 $ 61.7
Takeout case 35 % $ 163 $ 57.2
Total $ 158
Employing the weighted average approach, we have derived a fair value of ENR at $158 per share. An upside of 25%. We would like to once again stress that the 25% upside presented here is a result of very conservative and at times, pessimistic assumptions that we employed in our different scenarios. We suspect there to be more upside potential.

34
Excellent Corporate Governance
A number of analysts on the street have questioned ENR's corporate governance record. Some have commented that ENR offers below-peer-level-disclosures while others have criticized them for not distributing cash back to shareholders. We find both of these accusations unfounded. Recall the table in the "The “Inevitable” Brand Portfolio" section of this research piece (pg.6). The entire Personal Care business was built up via a string of value enhancing acquisitions in between calendar years 2003-2013. This means that management has always been on the lookout for value enhancing acquisitions for the last 10 years. We have already pointed out the merits of the past acquisitions and will not touch on it here. Rather, the main question that one must ask oneself is: "What is the best use of capital in a business"? For many investors, the answer is to pay out dividends to minority shareholders. We believe that there is more to understanding the concept of value creation. The tenets of value creation are clearly and succinctly laid out in the book "Valuation - Measuring and Managing the Value of Companies" by McKinsey & Company: "The guiding principle of value creation is that companies create value by investing capital they raise from investors to generate future cash flows at rates of return exceeding the cost of capital (the rate investors require to be paid for the use of their capital)." "The corollary of this guiding principle, known as the conservation of value, says anything that doesn’t increase cash flows doesn’t create value." – McKinsey & Company If we think about the conservation of value principle above, we will come to realize that dividends paid to minority shareholders is not a creation of value, but rather, a transfer of value from the firm to the investors. The rate of return of cash distributed as dividends is zero (or negative if you consider dividend withholding taxes). Considering the fact that ENR's management has been looking for value enhancing acquisitions for over 10 years, demanding that they should distribute the cash to minority holders is actually asking management to destroy value! That said, management initiated its first quarterly dividend on May 2012, coinciding with the fact that they had not found any major acquisitions since American Safety Razor in FY11 (the JNJ acquisition was a bargain purchase and only cost them $185m or 4.7x EV/EBITDA, leaving ample cash in the bank). Management has since continued to pay quarterly dividends to shareholders with the payout ratio increasing from 6% to a staggering 28% in just 2 years. How can this be poor corporate governance?
Dividend History
Calendar Quarterly Dividends Paid
Year Mar.31 Jun.30 Sep.30 Dec.31 FY
2011 - - - - -
2012 - - 0.4 0.4 0.80
2013 0.4 0.4 0.5 0.5 1.80
2014 0.5 0.5 0.5 TBA 1.50
Source: Value Line

35
One may challenge our assertion and question that "if dividends do not create true value, why has the company bought back shares?" Indeed, share count has decreased from 70.5m in FY10 to 61.6m in FY14, an 11.2% decrease in shares outstanding. This means that even if earnings were to stay constant over this period, EPS would automatically increase by over 10%. The main difference in dividends and share buybacks is that even though both are a 'transfer of value', management in effect actually created true value for shareholders by purchasing stock at below the company's intrinsic value (see previous sections) and retiring it. Therefore, we believe management has spent ENR's cash on the best possible investment to enhance long term value without any leakages in the form of taxes. Now that they have slowed down on acquisitions and continued to repurchase shares, increased dividend payout and streamlined the business through the restructuring, management is taking this one step further and is looking to spinoff the Personal Care and Household Goods business in a tax free spinoff. Again, how can this be poor corporate governance? The criticism of poor disclosure baffles us. Management's disclosure has always been good, breaking segments down to details such as segment assets and capital expenditures. Consider for a second that their filings allowed us to run detailed analysis on their returns or the restructuring project with no Form 10 to work with. The poor disclosure accusation is more likely to do with management’s tendency to keep a low profile. However, since 2011 we have seen a dramatic increase in the amount of public communications including fiscal year end and analyst presentations that helped shed light on more metrics such as organic growth. Even if one stands by the assertion that disclosures can always improved, one has to realise that ENR competes in a duopoly in the Household Goods segment and with numerous other players in the Personal Care segment as the smaller competitor in terms of scale. It is not only risky, but perhaps even reckless to disclose too much information to shareholders at the expense of competitors learning about their trade secrets and operational statistics.
36
Addressing the Risks
Despite ENR’s enormous margin of safety, as informed investors there are always risks we need to account for with any investment. 1) Spinoff issues: The most obvious risk of investing in special situations is the situation not materializing or
being delayed. There can be numerous reasons for this, some that make economic sense and others that are not grounded by logic. Having rallied 30% since the spinoff announcement, there are clearly many event-driven funds positioned for merger arbitrage scenarios. If ENR cancels the spinoff plan, many investors will be quick to dump shares as there is no longer a catalyst for the company’s fundamental value to be realized in the shorter term. However, we do not believe this risk is likely to occur. Management’s execution track record is stellar, exceeding targeted cost savings one year ahead of schedule. They are on record stating that they are “laser-focused on separating these businesses effective July 1.” so their managerial reputation is on the line. They also dedicated the better part of FY14 incurring dis-synergies alongside the restructuring charges towards this project. To go back now would be immensely value destroying and is not something we think management would risk given their strong culture of corporate governance. Regardless, if the spinoff fails to occur, our downside and base case valuations still suggest a high margin of safety for investors. Furthermore, the unrealized fundamental value of ENR makes it a prime target for investor activism in the event that the spinoff does not go as planned On 29 April 2014 on the day of the spinoff announcement, 5,147,386 shares changed hands, this is approximately 10x that of the average daily trade volume (between 31 December 2012 and 28 April 2014) of 507,285. We are now in the last month of 2014 (8 months since deal announcement), 3 month average daily trade volume has normalized back to approximately 482,000 with very low short interest. It seems to us that the short term punters are already out of this trade and provides us with some level of comfort that there will not be any substantial liquidity squeeze back to pre-deal levels, especially considering the fact that at no growth, ENR is worth around $115
2) Preference for Personal Care over Household Goods: Similar to above, this is more of a short term liquidity consideration rather than a long term, fundamental consideration. Upon the completion of the spinoff, investors will have the optionality to hold both companies, sell one, or sell both. We are speculating that there is a possibility that they may opt to retain the Personal Care business and dump the stock of the Household Goods business. Under this scenario, there is a possibility that the share price of the battery business will decline and thus affect the ‘aggregate valuations’ that we have presented above. Then again, we would like to remind you that this is only a liquidity driven event, as the age-old adage goes “in the short term, the stock market behaves like a voting machine, but in the long term it acts like a weighing machine”; as fundamental bottom-up investors, we tend to have a longer time horizon
3) Battery weakness: Everyone knows that the alkaline battery is on a structural decline as more gadgets migrate to lithium-ion power sources. We noted in the beginning that the alkaline battery still has many applications such as the flashlight, wireless mouse, remote control, toys and more. While there is a chance that the weakness will accelerate to such a point that it offsets ENR’s ability to generate returns, we do not see this as likely for the foreseeable future. Brokers have forecasted between 0-2% declines in segment revenues going forward which implies a steady decline. However, simply from a qualitative perspective, producers of gadgets such as remote controls and flashlights have no incentive to switch to a rechargeable battery because it is not worth the additional cost of materials nor development expense for a

37
largely meaningless “improvement”. Overall, the battery business’ low trading multiples has priced in the weakness and been given Warren Buffet’s stamp of approval on where the 'floor' valuations should be
4) Breaches in debt covenant: ENR has debt liabilities with covenants dictating that their Debt/EBITDA ratio
cannot be greater than 4.0x and cannot remain above 3.5x for 4 consecutive quarters. Failure to comply with the covenants will result in paying additional interest and additional fees on the debt and risk on Energizer’s having a poorer credit rating and inadvertently result to a higher cost of capital. We see the risk as unlikely, given that in FY14, Debt/EBITDA was only 2.7x, very much in our comfort zone
5) Value destructive acquisition sprees: Much of ENR’s success has been built upon successful acquisitions in
the past. We are aware that “past performance may not be indicative of future results” but having already established that management has been master capital allocators it is unlikely that they will go on any acquisitions at all, during this spinoff period
6) Unfavorable global economic conditions: Needless to say, ENR is a global brand and a global business.
General economic slowdowns will reduce consumer demand for their products due to a reduction in discretionary spending, trading down for cheaper products and/or differing purchases outright. This may have a short term impact on sales, profitability and also the share price of ENR. During the financial crises, ENR traded at a low of $42.19 (27 February 2009). We have no idea when the next economic slowdown is, or when the next great crash will occur. Investors should keep in mind though, that under such ‘doomsday scenarios’, ANY investment will have a short term impairment in asset value. As we have already pointed out, we believe that ENR is a great business with great products and solid management. The rest is outside of our control
7) Sensitivities to the change in the cost of capital: We have not factored in the change in discount rates for
our analysis above. In the scenario of higher cost of capital due to inflation, our appraised target prices and valuation will be lower than the ones presented. That said, given that ENR’s products are mostly in the premium segment, we believe that they can pass costs on to the end user, something that they have successfully done in the last 20 years. This implies that the nominal increase in revenue (due to inflation and higher pricing), will more than offset an increased cost of capital we have employed in our DCF calculations.
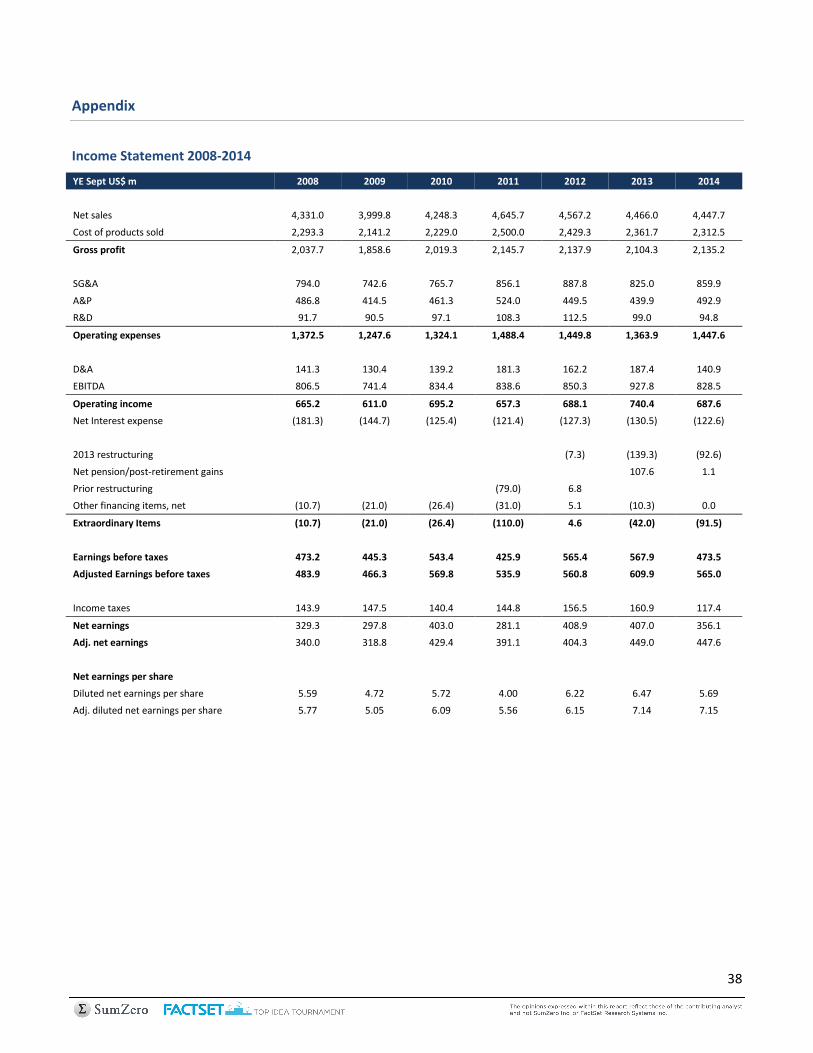
38
Appendix
Income Statement 2008-2014
YE Sept US$ m 2008 2009 2010 2011 2012 2013 2014
Net sales 4,331.0 3,999.8 4,248.3 4,645.7 4,567.2 4,466.0 4,447.7
Cost of products sold 2,293.3 2,141.2 2,229.0 2,500.0 2,429.3 2,361.7 2,312.5
Gross profit 2,037.7 1,858.6 2,019.3 2,145.7 2,137.9 2,104.3 2,135.2
SG&A 794.0 742.6 765.7 856.1 887.8 825.0 859.9
A&P 486.8 414.5 461.3 524.0 449.5 439.9 492.9
R&D 91.7 90.5 97.1 108.3 112.5 99.0 94.8
Operating expenses 1,372.5 1,247.6 1,324.1 1,488.4 1,449.8 1,363.9 1,447.6
D&A 141.3 130.4 139.2 181.3 162.2 187.4 140.9
EBITDA 806.5 741.4 834.4 838.6 850.3 927.8 828.5
Operating income 665.2 611.0 695.2 657.3 688.1 740.4 687.6
Net Interest expense (181.3) (144.7) (125.4) (121.4) (127.3) (130.5) (122.6)
2013 restructuring
(7.3) (139.3) (92.6)
Net pension/post-retirement gains
107.6 1.1
Prior restructuring
(79.0) 6.8
Other financing items, net (10.7) (21.0) (26.4) (31.0) 5.1 (10.3) 0.0
Extraordinary Items (10.7) (21.0) (26.4) (110.0) 4.6 (42.0) (91.5)
Earnings before taxes 473.2 445.3 543.4 425.9 565.4 567.9 473.5
Adjusted Earnings before taxes 483.9 466.3 569.8 535.9 560.8 609.9 565.0
Income taxes 143.9 147.5 140.4 144.8 156.5 160.9 117.4
Net earnings 329.3 297.8 403.0 281.1 408.9 407.0 356.1
Adj. net earnings 340.0 318.8 429.4 391.1 404.3 449.0 447.6
Net earnings per share
Diluted net earnings per share 5.59 4.72 5.72 4.00 6.22 6.47 5.69
Adj. diluted net earnings per share 5.77 5.05 6.09 5.56 6.15 7.14 7.15

39
Segment Sales
YE Sept US$m 2008 2009 2010 2011 2012 2013 2014
Net sales
Personal care 1,856.7 1,890.3 2,048.6 2,449.7 2,479.5 2,448.9 2,612.2
Wet Shave 1,085.0 1,118.1 1,265.1 1,598.1 1,644.2 1,619.0 1,591.5
Skin Care 364.1 364.0 383.0 425.6 430.2 429.0 424.5
Feminine Care 222.6 214.1 198.8 187.2 178.3 177.1 404.5
Infant Care 185.0 194.1 201.7 198.0 180.3 169.2 136.3
Other Personal Care 0.0 0.0 0.0 40.8 46.5 54.6 55.4
Household products 2,474.3 2,109.5 2,199.7 2,196.0 2,087.7 2,017.1 1,835.5
Batteries 1,490.1 1,264.3 1,327.9 1,311.7 1,263.4 1,245.9 1,162.7
Other lighting/batteries 984.2 845.2 871.8 884.3 824.3 771.2 672.8
Total net sales 4,331.0 3,999.8 4,248.3 4,645.7 4,567.2 4,466.0 4,447.7

40
Balance Sheet 2008-2014
YE Sept US$ m 2008 2009 2010 2011 2012 2013 2014
Cash and cash equivalents 171.2 359.3 629.7 471.2 718.5 998.3 1,129.0
Trade receivables, net 923.2 810.0 824.8 709.8 676.7 480.6 495.0
Inventories 674.6 667.3 666.3 653.4 672.4 616.3 616.9
Other current assets 257.8 289.2 308.7 426.3 455.0 473.2 488.7
Current assets 2,026.8 2,125.8 2,429.5 2,260.7 2,522.6 2,568.4 2,729.6
PP&E 835.5 863.4 840.6 885.4 848.5 755.6 751.7
Goodwill 1,206.4 1,326.2 1,316.4 1,475.3 1,469.5 1,475.8 1,487.4
Other intangible assets 1,663.2 1,788.6 1,774.2 1,878.2 1,853.7 1,835.5 1,847.3
Other assets 84.8 45.0 27.2 31.9 36.7 82.1 112.7
Non current assets 3,789.9 4,023.2 3,958.4 4,270.8 4,208.4 4,149.0 4,199.1
Total assets 5,816.7 6,149.0 6,387.9 6,531.5 6,731.0 6,717.4 6,928.7
Current maturities of long term debt 106.0 101.0 266.0 106.0 231.5 140.0 230.0
Notes payable 264.4 169.1 24.9 56.0 162.4 99.0 289.5
Accounts payable 262.4 231.6 271.0 289.6 325.2 340.4 397.1
Other current liabilities 728.9 657.8 691.6 575.8 588.4 574.0 657.1
Current liabilities 1,361.7 1,159.5 1,253.5 1,027.4 1,307.5 1,153.4 1,573.7
Long term debt 2,589.5 2,288.5 2,022.5 2,206.5 2,138.6 1,998.8 1,768.9
Other liabilities 869.2 938.7 1,012.3 1,196.3 1,215.6 1,111.6 1,063.8
Non current liabilities 3,458.7 3,227.2 3,034.8 3,402.8 3,354.2 3,110.4 2,832.7
Total liabilities 4,820.4 4,386.7 4,288.3 4,430.2 4,661.7 4,263.8 4,406.4
Shareholder's equity
Common stock, par value 1.0 1.1 1.1 1.1 1.1 0.7 0.7
Addition paid in capital 1,034.9 1,555.3 1,569.5 1,593.6 1,621.7 1,628.9 1,641.3
Retained earnings 1,671.8 1,963.2 2,353.9 2,613.0 2,993.2 1,144.1 1,373.0
Common stock in treasury (1,719.3) (1,702.4) (1,667.6) (1,925.7) (2,328.7) (147.2) (221.6)
Accumulated other comprehensive loss 7.9 (54.9) (157.3) (180.7) (217.8) (172.9) (271.1)
Shareholder's equity 996.3 1,762.3 2,099.6 2,101.3 2,069.5 2,453.6 2,522.3

41
Cash Flow Statement 2008-2014
YE Sept US$m 2008 2009 2010 2011 2012 2013 2014
Net earnings 329.3 297.8 403.0 261.2 408.9 407.0 356.1
Adjustments to reconcile net earnings to net cash flow from operations
Non-cash restructuring costs
42.9 4.7
Net pension/post-retirement gains
(107.6) (1.1)
Depreciation and amortisation 141.3 130.4 139.2 181.3 162.2 144.5 136.2
Deferred income taxes 27.0 (8.2) (1.3) 26.4 (2.9) 43.3 3.2
Other non-cash charges 39.2 68.1 71.9 84.2 55.0 70.9 65.2
Other, net (25.0) (9.7) 12.8 (30.4) (37.1) (59.7) (33.7)
CFO before NWC changes 511.8 478.4 625.6 522.7 586.1 541.3 530.6
Decrease/(incease) in AR (39.4) 106.7 (17.4) (19.7) 38.2 181.8 (34.7)
Decrease/(increase) in inventories 29.5 21.8 (2.3) 65.1 (17.6) 45.1 22.4
Increase in other current assets (2.8) (8.2) (2.9) (33.8) (11.6) (45.8) (84.2)
Increase/(decrease) in AP (9.8) (28.1) 41.3 (12.0) 47.1 17.5 57.4
Increase/(decrease) in other current liabilities (22.8) (81.4) 8.1 (109.8) (10.6) 10.1 80.5
Change in NWC (45.3) 10.8 26.8 (110.2) 45.5 208.7 41.4
CFO 466.5 489.2 652.4 412.5 631.6 750.0 572.0
10.8% 12.2% 15.4% 8.9% 13.8% 16.8% 12.9%
Capex (160.0) (139.7) (108.7) (98.0) (111.0) (90.6) (85.3)
Proceeds from sale of assets 1.2 2.5 0.8 7.6 19.3 1.8 9.1
Acquisitions, net of cash acquired (1,882.1) (275.0) 0.0 (267.1) 0.0 0.0 (187.1)
Proceeds from share options 46.0
Other, net 0.4 0.0 (5.4) (6.0) (3.2) (0.3) (0.1)
CFI (1,994.5) (412.2) (113.3) (363.5) (94.9) (89.1) (263.4)
Cash proceeds from debt > than 90 days, net of discount 1,482.8 0.0 0.0 600.0 498.6 0.0 0.0
Payment of debt issue cost (269.5) 0.0 0.0 (7.6) (4.3) 0.0 0.0
Cash payment on debt with original maturities > 90 days
(306.0) (101.0) (576.0) (441.0) (231.5) (140.1)
Net (decrease)/increase in debt with original maturities < 90 days 97.4 (102.0) (151.9) 45.7 100.9 (63.9) 194.2
Common stock purchased
0.0 0.0 (276.0) (417.8) 0.0 (94.4)
Cash dividends paid
0.0 0.0 (24.9) (105.6) (123.9)
Proceeds from issuance of common stock 12.9 515.8 12.6 8.2 3.0 18.2 9.9
Excess tax benefit from share based payments 16.5 3.2 5.8 3.7 2.2 5.3 6.6
CFF 1,340.1 111.0 (234.5) (202.0) (283.3) (377.5) (147.7)
Exchange rate effect (4.1) 0.1 (34.2) (5.5) (6.1) (3.6) (30.2)
Increase/(decrease) in cash (192.0) 188.1 270.4 (158.5) 247.3 279.8 130.7
Cash at beginning of period 363.2 171.2 359.3 629.7 471.2 718.5 998.3
Ending cash 171.2 359.3 629.7 471.2 718.5 998.3 1,129.0
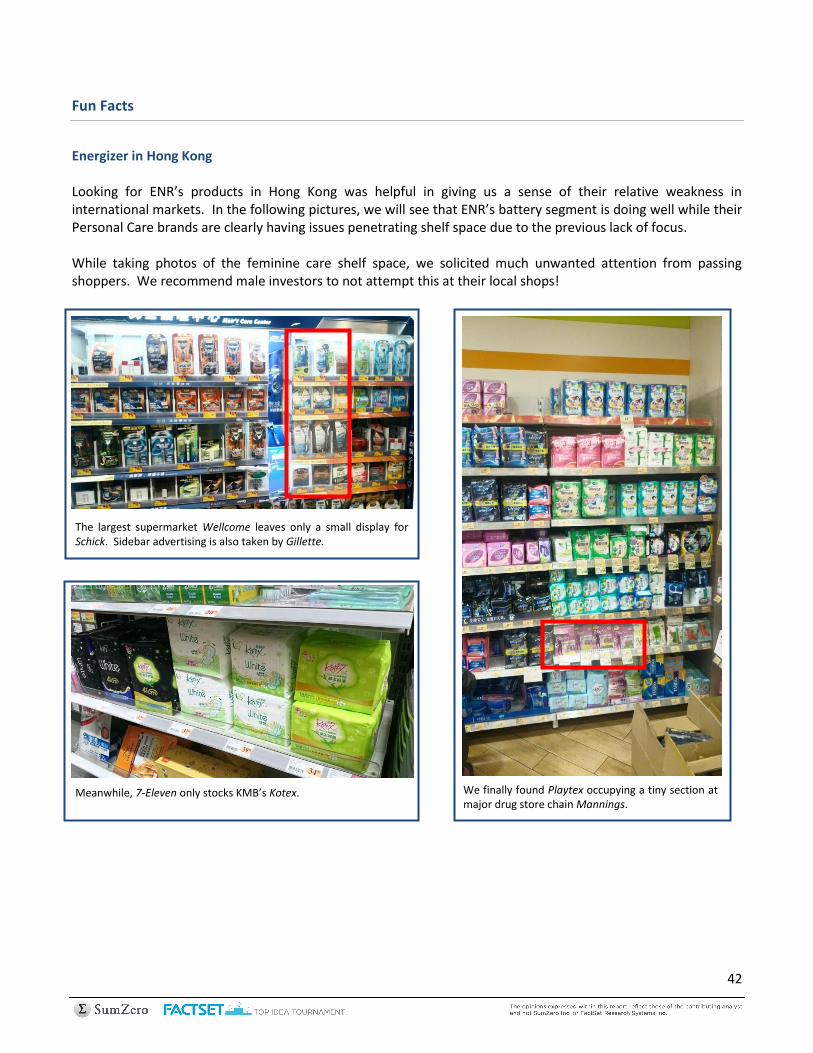
42
Fun Facts
Energizer in Hong Kong Looking for ENR’s products in Hong Kong was helpful in giving us a sense of their relative weakness in international markets. In the following pictures, we will see that ENR’s battery segment is doing well while their Personal Care brands are clearly having issues penetrating shelf space due to the previous lack of focus. While taking photos of the feminine care shelf space, we solicited much unwanted attention from passing shoppers. We recommend male investors to not attempt this at their local shops!
The largest supermarket Wellcome leaves only a small display for Schick. Sidebar advertising is also taken by Gillette.
Meanwhile, 7-Eleven only stocks KMB’s Kotex.
We finally found Playtex occupying a tiny section at major drug store chain Mannings.

43
Batteries in Omaha
During the announcement ENR’s tax free spinoff, we stumbled across this interesting article: http://www.bizjournals.com/stlouis/blog/2013/05/energizer-warren-buffetts-kind-of.html
“Energizer Holdings is the kind of company that could be on Warren Buffett’s shopping list, at least according to Motley Fool writer David Hanson. What’s more, “the company is led by CEO Ward Klein, who fits what Buffett looks for in a leader,” including his 25 years at Energizer and expansion into new markets”
Imagine how exciting it would be for all investors in ENR if the ‘Oracle of Omaha’ validates their investment! YE Sept US$ m
Battery Discharges
ENR gets a lot of bang for its buck. How about the batteries themselves? Turns out that the energy used to manufacture batteries is 50 times greater than the electric energy discharged by a battery!14
Huge Volume
About 3 billion batteries are sold in the battery per year in the US, averaging 10 per person.15
The average woman uses 11,000 to 17,000 tampons in her lifetime.16 That amounts to 2.3 trillion tampons per generation of women living in the US and assuming US$7 per pack over US$350b total in sales.
14
http://www.envirogadget.com/recycling/10-interesting-facts-about-batteries/ 15
http://batteriesandbutter.com/blog/2013/11/8-interesting-battery-facts/ 16 http://www.lovelyish.com/2010/09/13/7-interesting-facts-about-tampons/
We presented this picture in the main report, but would like to add that Energizer was also the exclusive brand at Mannings and Wellcome. Interestingly, we have yet to see Duracell.
44
Thank you for your time and consideration. We hope you enjoyed our report on Energizer!

Disclaimer SumZero is not a registered investment advisor or broker-dealer, and is not licensed nor qualified to provide investment advice. There is no requirement that any of our Information Providers be registered investment advisors or broker-dealers. Nothing published or made available by or through SumZero should be considered personalized investment advice, investment services or a solicitation to BUY, SELL, or HOLD any securities or other investments mentioned by SumZero or the Information Providers. Never invest based purely on our publication or information, which is provided on an “as is” basis without representations. Past performance is not indicative of future results. YOU SHOULD VERIFY ALL CLAIMS, DO YOUR OWN DUE DILIGENCE AND/OR SEEK YOUR OWN PROFESSIONAL ADVISOR AND CONSIDER THE INVESTMENT OBJECTIVES AND RISKS AND YOUR OWN NEEDS AND GOALS BEFORE INVESTING IN ANY SECURITIES MENTIONED. INVESTMENT DOES NOT GUARANTEE A POSITIVE RETURN AS STOCKS ARE SUBJECT TO MARKET RISKS, INCLUDING THE POTENTIAL LOSS OF PRINCIPAL. You further acknowledge that SumZero, the Information Providers or their respective affiliates, employers, employees, officers, members, managers and directors, may or may not hold positions in one or more of the securities in the Information and may trade at any time, without notification to you, based on the information they are providing and will not necessarily disclose this information to subscribers, nor the time the positions in the securities were acquired. You confirm that you have read and understand, and agree to, our full disclaimer and terms of use, a copy of which can be accessed by clicking here and that neither SumZero nor any of its Information Providers is in any way responsible for any investment losses you may incur under any circumstances.