december corporate presentation - seeking alpha
TRANSCRIPT
D E C E M B E RC O R P O R AT E P R E S E N TAT I O N

2
2021 INVESTMENT HIGHLIGHTSMEG has taken definitive action to enhance its strong liquidity and protect its attractive asset base in the face of COVID induced market conditions
1. Based on December 7, 2020 strip commodity prices.
2020 Success
2021: Long-term Sustainable Value
Material savings identified – $50 mm in operating cost and G&A savings and $100mm (40%) reduction in capital expenditures
Substantial gains from hedging program – ~$350 mm1 in forecast 2020 gains; 80% of Q4 WTI exposure is hedged
Balance Sheet Improvement – $130 mm reduction in total debt outstanding, extension of term debt; C$800 mm covenant light revolver remains undrawn
$100 mm on Balance Sheet at Year End
Strong financial position supported by high quality operations
• Capital budget sustains production and is funded within cash flow at ~US$30/bbl WCS – investment strategy is flexible allowing MEG to react to market environment and is protected by hedging program
• Cost efficiencies remain a priority – G&A has been cut in half since 2015; non-energy opex remains best in class
• Sustainability integrated into development plan –2021 includes advancement of key ESG initiatives including the on-going development of GHG reducing technologies
• Positioned to capture commodity price recovery – $46/bbl WTI hedging weighted, 47% in H1, and 33% in H2
2020: Demonstrated Resilience
3
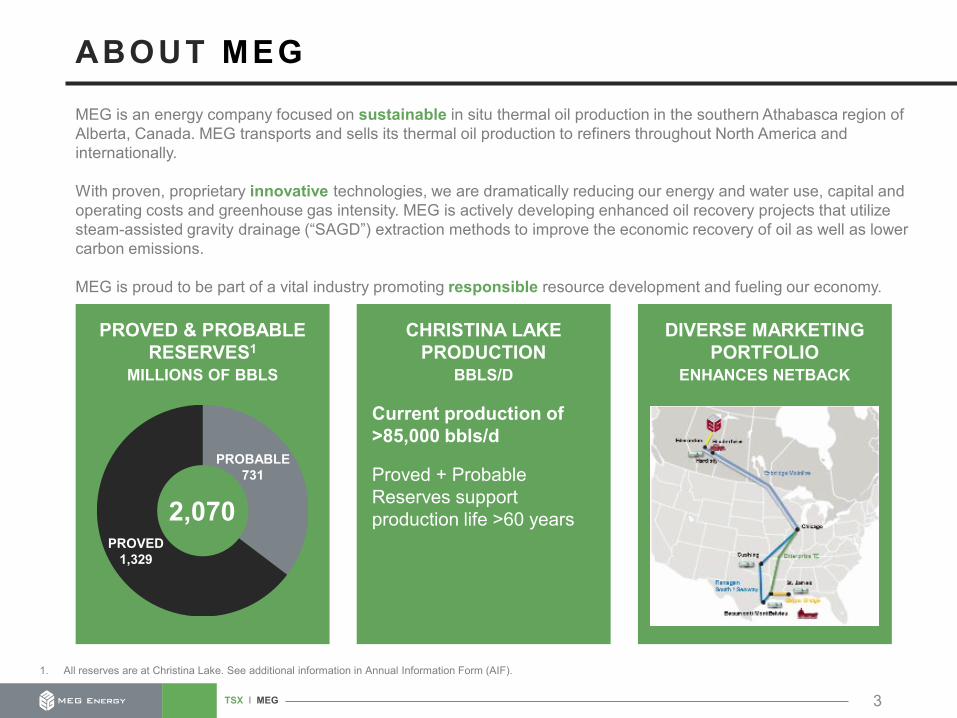
ABOUT MEGMEG is an energy company focused on sustainable in situ thermal oil production in the southern Athabasca region of Alberta, Canada. MEG transports and sells its thermal oil production to refiners throughout North America and internationally.
With proven, proprietary innovative technologies, we are dramatically reducing our energy and water use, capital and operating costs and greenhouse gas intensity. MEG is actively developing enhanced oil recovery projects that utilize steam-assisted gravity drainage (“SAGD”) extraction methods to improve the economic recovery of oil as well as lower carbon emissions.
MEG is proud to be part of a vital industry promoting responsible resource development and fueling our economy.
1. All reserves are at Christina Lake. See additional information in Annual Information Form (AIF).
PROVED & PROBABLERESERVES1
PROVED1,329
PROBABLE 731
2,070
MILLIONS OF BBLS
CHRISTINA LAKE PRODUCTION
BBLS/D
DIVERSE MARKETING PORTFOLIO
ENHANCES NETBACK
Current production of >85,000 bbls/d
Proved + Probable Reserves support production life >60 years
4
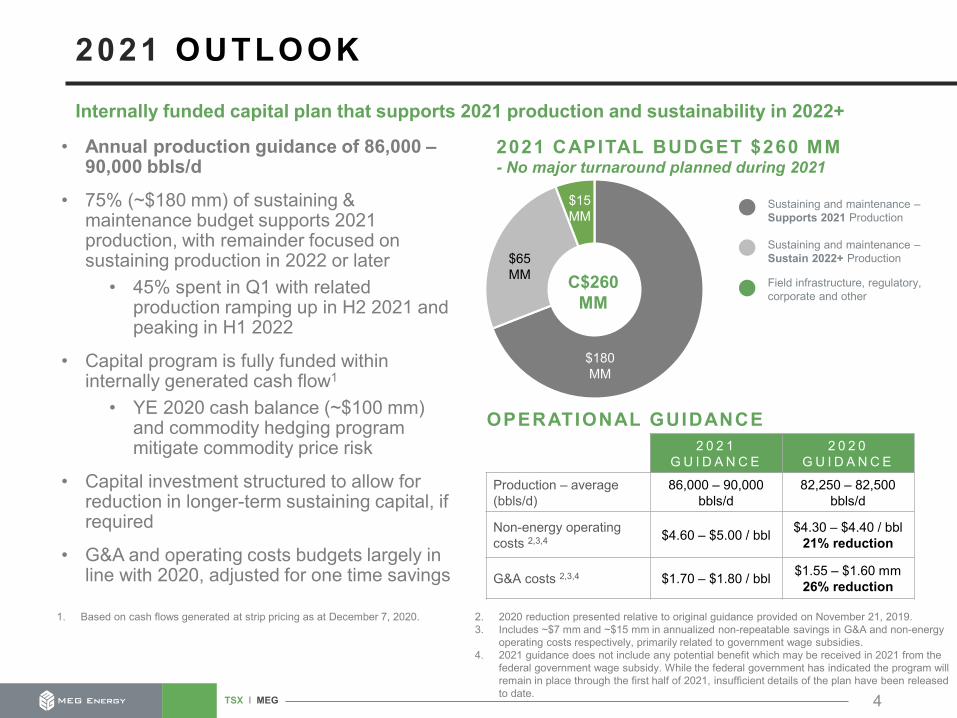
Internally funded capital plan that supports 2021 production and sustainability in 2022+
2 0 2 1 G U I D A N C E
2 0 2 0 G U I D A N C E
Production – average (bbls/d)
86,000 – 90,000 bbls/d
82,250 – 82,500 bbls/d
Non-energy operating costs 2,3,4 $4.60 – $5.00 / bbl $4.30 – $4.40 / bbl
21% reduction
G&A costs 2,3,4 $1.70 – $1.80 / bbl $1.55 – $1.60 mm26% reduction
2021 OUTLOOK
• Annual production guidance of 86,000 –90,000 bbls/d
• 75% (~$180 mm) of sustaining & maintenance budget supports 2021 production, with remainder focused on sustaining production in 2022 or later
• 45% spent in Q1 with related production ramping up in H2 2021 and peaking in H1 2022
• Capital program is fully funded within internally generated cash flow1
• YE 2020 cash balance (~$100 mm) and commodity hedging program mitigate commodity price risk
• Capital investment structured to allow for reduction in longer-term sustaining capital, if required
• G&A and operating costs budgets largely in line with 2020, adjusted for one time savings
$15MM
$180MM
Sustaining and maintenance –Supports 2021 Production
Sustaining and maintenance –Sustain 2022+ Production
Field infrastructure, regulatory, corporate and other
- No major turnaround planned during 20212021 CAPITAL BUDGET $260 MM
OPERATIONAL GUIDANCE
2. 2020 reduction presented relative to original guidance provided on November 21, 2019.3. Includes ~$7 mm and ~$15 mm in annualized non-repeatable savings in G&A and non-energy
operating costs respectively, primarily related to government wage subsidies.4. 2021 guidance does not include any potential benefit which may be received in 2021 from the
federal government wage subsidy. While the federal government has indicated the program will remain in place through the first half of 2021, insufficient details of the plan have been released to date.
1. Based on cash flows generated at strip pricing as at December 7, 2020.
C$260 MM
$65MM

Year1
Year2
Year3
Year4
5
High quality, 10-15% decline rate allows for low sustaining capital, enhancing the sustainability of the business and financial flexibility
Note: Production profile in chart above is illustrative only1. Based on estimated PDP corporate decline for Permian producers as per industry research. Profile is illustrative only and not meant to represent a production forecast for MEG or
others. Source: MEG and Barclays.2. See additional disclosure with respect to MEG’s reserves in its AIF.
SUSTAINABLE ASSET WITH LOW CAPITAL REQUIREMENTS
MEG baseproductiondecline
MEG shallow decline rate drives low full cycle breakeven economics and higher free cash flow
Illustrative Permian Base Decline1 ~40% in year 1
Significant sustainability advantage in low oil price environment
• Unique thermal oil decline profile results in low annual sustaining capital
• 2.1 bnbbl of 2P reserves2 at Christina Lake allows for production of ~ 60 years from existing, well delineated asset
• Sustaining capital can be fully funded in current commodity price environment
IN S ITU ASSETS HAVE LOW DECLINE PROFILE(10 -15% ANNUALLY)
$65 mm initial investment in 2021
~$195 mm capital spend in 2021
$0.00
$2.00
$4.00
$6.00
$8.00
$10.00
$12.00
$14.00
$16.00
Q1 Q2 Q3 Q4
2021 Edmonton WTI:WCS Strip 2021 Gulf Coast WTI:WCS Strip
1. Strip pricing as at December 7, 2020.
6
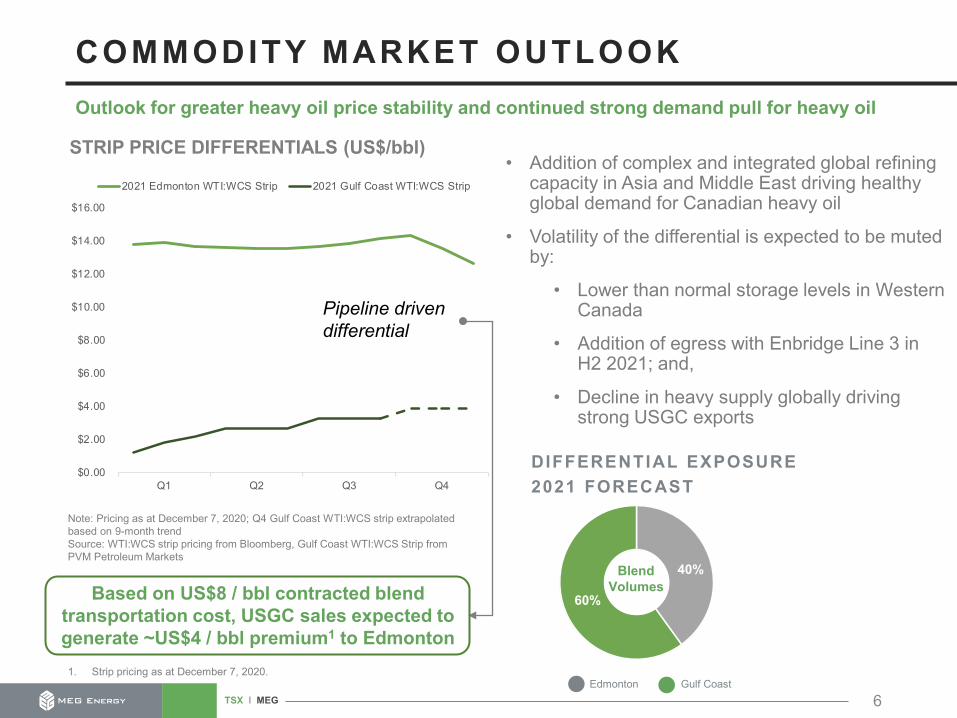
COMMODITY MARKET OUTLOOK
• Addition of complex and integrated global refining capacity in Asia and Middle East driving healthy global demand for Canadian heavy oil
• Volatility of the differential is expected to be muted by:
• Lower than normal storage levels in Western Canada
• Addition of egress with Enbridge Line 3 in H2 2021; and,
• Decline in heavy supply globally driving strong USGC exports
STRIP PRICE DIFFERENTIALS (US$/bbl)
Note: Pricing as at December 7, 2020; Q4 Gulf Coast WTI:WCS strip extrapolated based on 9-month trendSource: WTI:WCS strip pricing from Bloomberg, Gulf Coast WTI:WCS Strip from PVM Petroleum Markets
Outlook for greater heavy oil price stability and continued strong demand pull for heavy oil
Based on US$8 / bbl contracted blend transportation cost, USGC sales expected to generate ~US$4 / bbl premium1 to Edmonton
Pipeline driven differential
60%
40%Blend Volumes
Edmonton Gulf Coast
DIFFERENTIAL EXPOSURE2021 FORECAST

7
Final stage of Line 3 expansion construction is underway, increasing heavy oil egress by 370,000 bbls/d in H2 2021; Marketing assets position MEG to capitalize on egress
*Based on 100 rail cars per train with 600 bbls / car and 100% efficiency
ASSETS TO ACCESS HIGH VALUE MARKETS
Enterprise TE
Enbridge Mainline
Edmonton
Chicago
St. James
Bayou Bridge
Flanagan South / Seaway
Hardisty
Cushing
Beaumont / Mont Belvieu
Bruderheim
100 mbbls/d on Flanagan South/Seaway • Direct access to USGC• Supply/demand imbalance provides long-term
pricing support
1.4 mmbbl U.S. storage • Optimizes Flanagan commitments and exports
Marine export access• From MEG assets at Beaumont and St. James
1.4 mmbbl Western Canadian Storage • Manages Enbridge apportionment
40-50% condensate purchases from USGC • Access over-supplied USGC market • Reduces exposure to AB market volatility
Future 20,000 bbls/don TMX• Access to tidewater and
delivery to growing Asian heavy oil market
• TMX construction in progress
30,000 bbls/d* rail loading capacity• Capacity preserves
optionality• Rail is not anticipated to
be part of sales strategy in 2021

49% 44%34% 32%
$46.12/bbl $46.15/bbl $46.18/bbl $46.18/bbl
$40.00/bbl
$41.00/bbl
$42.00/bbl
$43.00/bbl
$44.00/bbl
$45.00/bbl
$46.00/bbl
0%
10%
20%
30%
40%
50%
60%
Q1 Q2 Q3 Q4
8
FUNDING WITHIN CASH FLOWAt current strip price, capital budget is fully funded from internally generated adjusted funds flow 1
1. Based on strip pricing as at December 7, 2020.2. Weighted average fixed WTI swap price (excludes put price on put options). See p. 17 for additional details.3. Including current hedge position.
WTI EXPOSURE HEDGED
Fixed Price 2(US$/bbl)
% of WTI Exposure Hedged
2021 FUNDS FLOW SENSITIVIT IES 3
• Capital funded from cash at prices above ~US$30/bbl WCS, which is below current strip price1
• Supported by ~40% WTI exposure hedges
• Below US$30/bbl WCS, capital is supported by forecast 2020 year-end $100 million cash balance
• Flexibility exists to manage capital program such that it is funded within cash flow
Variable Sensitivity Range Impact to 2021 Funds Flow
WTI (US$/bbl) +/- $2.50/bbl
Light:Heavy Differential (US$/bbl) +/- $0.50/bbl
Condensate (% of WTI) +/- 1%
AECO Gas (C$/GJ) +/- 10%
Exchange Rate (C$/US$) +/- $0.01
+/- C$58 mm
+/- C$29 mm
+/- C$8 mm
+/- C$6 mm
+/- C$7 mm

4.7
7.97.0
6.0
4.3 3.9 3.9 3.6 3.3 2.9 2.8
3.30.7 1.4 1.0 3.3
0.1
2.4 3.5
0.5 0.4 1.1
--
2
4
6
8
10
A B C MEG E F G H I J K
Year
s
9
Significant access to liquidity provided by undrawn C$800 mm modified covenant-lite credit facility with >3 years to maturity
No covenant unless drawn > $400 mm1
3 YEAR RUNWAY WITH NOFINANCIAL COVENANTS
Financial flexibility is a MEG hallmark: balance sheet has a unique combination of covenant structure and runway
COMPARABLE PRODUCER DEBT STRUCTURE2
CAPITAL MARKETS MATURITY STRUCTURE
1. If drawn in excess of $400 mm, MEG is required to maintain a quarterly first lien net leverage ratio (first lien net debt less cash on hand to last twelve-month EBITDA) of 3.5x or less.2. Comparison based on oil and gas peers with enterprise value greater than $1 billion and gas weighting less than 50%, including Baytex, Canadian Natural, Cenovus, Crescent
Point, Enerplus, Imperial, Seven Gen, Suncor, Vermillion and Whitecap.3. Weighted average maturity calculation assumes revolver is fully drawn; excludes accordion features.
Modified Covenant Lite
Covenant Based
Capital Markets Debt Maturities
~$496
@ 6.500%
$600
@ 7.000%
20212020 2022 2023 2024 2025 2026
US$ in Millions
Unsecured note2nd lien secured noteNew unsecured note
$1,200
@ 7.125%
2027
3 years
C$800 Revolver
Weighted Average Maturity3
Runway to Nearest Maturity

0
10
20
30
40
50
60
70
80
90 Yale Enviro. Performance Index Social Progress Index Worldbank Governance Index
10
CANADA’S ESG RANKING
TOP OIL RESERVE HOLDERS ESG SCORES
Source: BMO Capital Markets; Presentation uses an equal weight of each index representedNote: The Environmental Performance Index (EPI) is created jointly by Yale/Columbia Universities in collaboration with the World Economic Forum and ranks 180 countries on 24 performance indicators on environmental health and ecosystem vitality. The Social Progress Index (SPI) is developed by the Social Progress Imperative and ranks 149 countries on 51 measures of social responsibility that are independent of economic indicators. World Bank’s Worldwide Governance Indicators (WGI) rank over 200 countries on six dimensions including political stability, regulatory quality and corruption control.
Only top reserve holder to have a price on carbon
Stringent environmental regulation
High governance scores Enforcement of human rights
and social progress Low corruption Significant investment in
continuous improvement of environmental performance
Canadian oil companies earn a stronger ESG score than almost all other oil-rich countries, due to stringent environmental regulation, strong governance norms and commitment to safety and community

W A T E RZero surface or fresh water used in MEG’s operations82% reduction in make-up water withdrawal intensity since 2013
H E A L T H & S A F E T YNo employee lost time incidents at our Christina Lake Facility in 2019 or YTD 2020Rapid, effective COVID-19 response
I N D I G E N O U S R E L A T I O N SCumulative spend on contracts with Indigenous businesses of over $900 mm
ESG PRIORIT IES
D I V E R S I T Y30% women on board achieved in 2020
G H GGHG intensity is 20% below peer average
MEG’s reserve life drives our commitment to invest in economically viable solutions to improve sustainability and environmental performance and to foster strong partnership with local communities
Additional information can be found at www.megenergy.com/sustainability
11
Incorporate diversity objectives at all levels of the organization
Grow economic participation for local communities and implement company wide training
Continue to implement technology to reduce emissions with an aspirational goal of net zero emissions by 2050
Continued reduction in non-saline water usage
MEG’s goal is for all workers to return home safely to their families each day

U.S
. Bak
ken
No
Flar
e
Sau
di G
haw
arU
.S. E
agle
For
dU
.S. S
prab
erry
Rus
sia
Sam
atlo
r
Mex
ico
May
aC
hina
Boz
hong
Glo
bal A
vera
ge
U.S
. Eas
t Tex
as
U.S
. Gul
f MA
RS
Iraq
Kirk
uk
Iraq
Bas
rah
Nig
eria
Bon
nyU
.S. A
NS
Nor
way
Ose
berg
U.S
. Bak
ken
Flar
ing
Vene
zuel
a A
vg
Cal
iforn
ia T
herm
alIn
done
sia
Dur
i
CV
E C
hris
tina
ME
G C
hris
tina
Fost
er C
reek
Kirb
y S
outh
Fire
bag
JAC
OS
SAG
D A
vgS
U M
acka
yJa
ckfis
hS
urm
ont
Sun
rise
Oil
Sand
s Av
g
Leis
mer
Col
d La
keTu
cker AT
H H
angi
ngst
one
Prim
rose
/WL
AO
SP
/Sco
tford
Hor
izon
Sun
cor
Bas
e P
lant
Syn
crud
e
AO
SP
-M
inin
g
Fort
Hills K
earl
0
20
40
60
80
100
120
140
160
Global Crudes SAGD Mining SCO Mining Bitumen
Avg. In situ Intensity
MEG 2019 Intensity
Cogeneration
eMSAGP
12
GHG PERFORMANCEESTIMATED UPSTREAM CARBON INTENSITY
Source: IHS, Carnegie Endowment, Company Reports, BMO Capital Markets estimates
Track Record of Using Technology to Improve Environmental, Economic and Operating
Performance (kg CO2e/bbl)
MEG NET GHG INTENSITY1
• Technological innovation, such as eMSAGP, eMVAPEX and cogeneration have driven MEG’s GHG intensity down by 7% since 2013
• MEG uses cogeneration at its facilities with excess power being sold into the Alberta Power Market –electricity generated through cogeneration has a GHG intensity that is approximately one-third of the current Alberta provincial power grid
• Future reductions anticipated to be driven by implementation of additional technology
MEG has been a first mover in implementing technology to drive down MEG’s GHG intensity
MEG has taken measures to achieve one of the lowest GHG emissions intensities in the thermal heavy oil industry
Impact from technology
Below global average
52 kgCO2e/
bbl
1. Net GHG Intensity includes associated benefits of cogeneration.2. Based on public disclosure (see MEG’s ESG report for additional details).
kgCO2e/bblLEADER IN LOWERING GHG INTENSITY

0.09 0.2 0.40.7
2.5
MEG In situ HydraulicFracturing
Enhancedoil recovery
Oil sandsmining
• MEG’s focus on technology has enabled us to reduce our total make-up water withdrawal intensity by over 80% since 2013, leaving more groundwater untouched and reducing costs
• MEG does not operate in water stressed areas5 and has secured adequate supplies of deep non-drinkable groundwater for our current and future thermal operations
0.01
1.4
1.7
MEG Permian Eagle Ford
13
IN S ITU OPERATIONS IN CONTEXT
Non-Saline1 Water Use Intensity by Extraction Technology2
(bbl of water used to produce a bbl of oil; Alberta 2014-2018 average)
Comprehensive environmental management compares favourably to North American production
Water Methane Land
1. MEG defines fresh water as any surface water (e.g., lakes, rivers, streams and wetlands) or shallow groundwater from aquifers less than 150m deep. This is consistent with the definition of High-Quality Non saline water (fresh water) used by the Alberta Energy Regulator in Directive 81. Non-saline water is defined in Alberta as water with a total dissolved solids concentration of less than 4,000 mg/L.
2. AER Water Use Report.3. Schneising, O. et al (2020) - Remote sensing of methane leakage from natural gas and petroleum systems revisited. Atmospheric Chemistry and Physics.4. EIA, geoScout, BMO Capital Markets estimates.5. Aqueduct Water Risk Atlas.
MEG’s methane emissions intensity isover two orders of magnitude less
than the intensity of shale producers3
(kg CH4/BOE)
• MEG continues to invest in technology to reduce methane emissions – MEG conserves > 99.5% of methane
• Christina Lake is a gas conserving facility – meaning overall flaring and venting are virtually eliminated in normal operating conditions
Cumulative average number of tight oil wells drilled in support of base
production is 5x higher than SAGD4
(Wells per 1000 bbls/d)
• Tight oil averages 12.4 wells per 1,000 bbls/d compared to just 2.4 wells for SAGD to support base production4
• To date more than 100,000 tight oil wells have been drilled in the four main plays, compared to just 3,300 SAGD oil sands wells4
2.4
9.211.4
16.6
26.2
SAGD OilSands
Permian Bakken Eagle Ford Niobrara

2.1x
2.5x 2.
7x2.
7x 2.8x 2.8x 2.9x
2.9x 3.0x 3.0x
3.0x
3.4x 3.
6x3.
8x 4.1x 4.
4x 4.4x 4.
6x5.
3x5.
4x 7.5x
2.5x
2020
ISO
R (x
)
Producing In situ Projects
$5.85
$0
$2
$4
$6
$8
$10
$12
$14
$16
MEG Operating Expense Oil Sands Peer Operating Expense
14
TOP T IER OPERATOR IN THE SECTOR
MEG’s Christina Lake project has leading steam oil ratio (SOR) and operating costs, highlighting asset quality, advantaged economics and efficiency as an operator
1. Average SOR in 2020 up to September per AER.2. Based on results from nine months ended September 30. 3. MEG operating expense for nine months ended September 30, 2020, shown net of power revenue of $1.51/bbl.4. Oil sands peers include Athabasca, Baytex, Cenovus and CNRL; peers selected based on availability of disclosure.
Average 2020 SOR1 2020 YTD OPERATING EXPENSE2
(C$/bbl)
MEG Christina Lake• Potential for further
SOR reduction via eMSAGP & eMVAPEX
3 4
v
15
The Corporation continues to monitor the situation and believes that it can maintain safe operations with these pandemic-related procedures and protocols in place
Proactive plans to manage risks presented by global pandemic
COVID-19 RESPONSE
The Corporation’s business activities have been declared an essential service by the Alberta Government and the Corporation remains committed to the health and safety of all personnel and to the safety and continuity of operations. MEG has taken the following actions:
• Establishment of a COVID-19 task force, comprised of senior management and employees as well as third party expert consultants to promptly implement measures to protect the health and safety of the Corporation’s work force and the public, as well as to ensure continuity of operations.
• Implementation of mandatory self-quarantine policies, travel restrictions, screening protocols, enhanced cleaning and sanitation measures, and social distancing measures, including directing the vast majority of its office staff and certain non-essential field staff to work from home, revising shift schedules and increasing appropriate protective equipment.
• Management continues to monitor the developing COVID-19 situation to determine what, if any, additional measures might need to be taken to ensure that the health and safety of its people remain a top priority. In September, MEG safely returned to near-normal operations, with new safety measures in place, including majority of staff returning to regular work locations. Subsequently, the Corporation has reverted to having staff who are able to work remotely to do so, to reduce risk of exposure. Flexibility and adaptability continue to be integral to the risk management strategy.

16
APPENDIX

17
2021 capital program funded from cash flow where WCS > US$30 / bbl
SUBSTANTIAL VALUE FROMCOMMODITY HEDGING
1. Includes WTI fixed price swaps and WTI sold put options entered into for both Q4 2020 and the full year 2021. If in any month of 2021 the month average WTI settlement price isUS$38.79 per barrel (the sold put option) or better, MEG will receive US$46.18 per barrel (the fixed price swap) on hedged 2021 production in that month. If in any month of 2021 themonth average WTI settlement price is less than US$38.79 per barrel, MEG will receive the month average WTI settlement price in that month plus US$7.39 per barrel (the swap spread)on each barrel hedged in that month.
2. Includes approximately 10,900 bbls/d of physical forward blend sales for Q4 2020 at a fixed WTI:AWB differential.3. Includes approximately 8,200 bbls/d and 3,100 bbls/d of physical forward purchases for Q4 2020 and full year 2021, respectively.4. The average % of WTI landed in Edmonton includes estimated net transportation costs to Edmonton.5. Includes 7,500 GJ/d of physical forward purchases for full year 2021 at a fixed AECO price.
As of December 7 th , 2020 4Q 2020 1Q 2021 2Q 2021 3Q 2021 4Q 2021
WTI HedgesWTI Fixed Price HedgesVolume (bbl/d) 82,709 15,000 9,000 - -Weighted average fixed WTI price (US$/bbl) $45.17 $46.00 $46.00Enhanced WTI Fixed Price Hedges with Sold Put Options(1)
Volume (bbl/d) 24,500 29,000 29,000 29,000 29,000Weighted average fixed WTI price / Put option strike price(1) (US$/bbl) $59.11 / $52.00 $46.18 / $38.79 $46.18 / $38.79 $46.18 / $38.79 $46.18 / $38.79Light:heavy Differential HedgesWTI:WCS Differential Hedges at EdmontonVolume(2) (bbl/d) 38,896 - - - -Weighted average fixed WTI:WCS differential at Edmonton (US$/bbl) ($20.05)Condensate HedgesVolume(3) (bbl/d) 23,208 14,096 14,062 14,028 14,028Weighted average % of WTI landed in Edmonton (%)(4) 101% 95% 95% 95% 95%Natural Gas HedgesVolume(5) (GJ/d) - 50,000 35,000 35,000 35,000Weighted average fixed AECO price (C$/GJ) $2.70 $2.69 $2.69 $2.69
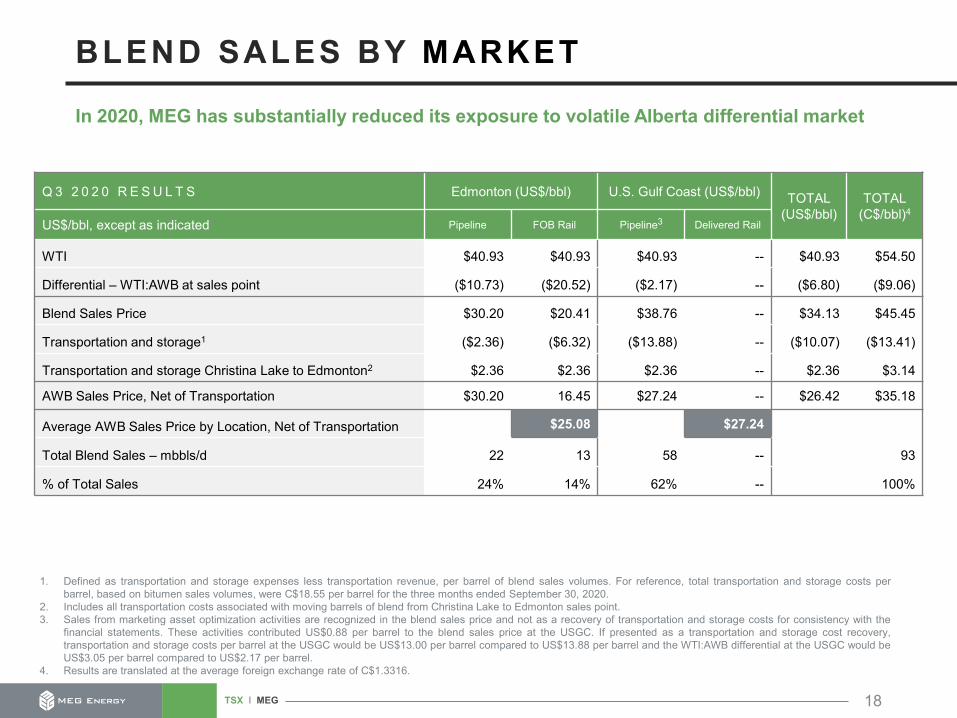
Q 3 2 0 2 0 R E S U L T S Edmonton (US$/bbl) U.S. Gulf Coast (US$/bbl) TOTAL (US$/bbl)
TOTAL (C$/bbl)4
US$/bbl, except as indicated Pipeline FOB Rail Pipeline3 Delivered Rail
WTI $40.93 $40.93 $40.93 -- $40.93 $54.50
Differential – WTI:AWB at sales point ($10.73) ($20.52) ($2.17) -- ($6.80) ($9.06)
Blend Sales Price $30.20 $20.41 $38.76 -- $34.13 $45.45
Transportation and storage1 ($2.36) ($6.32) ($13.88) -- ($10.07) ($13.41)
Transportation and storage Christina Lake to Edmonton2 $2.36 $2.36 $2.36 -- $2.36 $3.14
AWB Sales Price, Net of Transportation $30.20 16.45 $27.24 -- $26.42 $35.18
Average AWB Sales Price by Location, Net of Transportation $25.08 $27.24
Total Blend Sales – mbbls/d 22 13 58 -- 93
% of Total Sales 24% 14% 62% -- 100%
18
1. Defined as transportation and storage expenses less transportation revenue, per barrel of blend sales volumes. For reference, total transportation and storage costs perbarrel, based on bitumen sales volumes, were C$18.55 per barrel for the three months ended September 30, 2020.
2. Includes all transportation costs associated with moving barrels of blend from Christina Lake to Edmonton sales point.3. Sales from marketing asset optimization activities are recognized in the blend sales price and not as a recovery of transportation and storage costs for consistency with the
financial statements. These activities contributed US$0.88 per barrel to the blend sales price at the USGC. If presented as a transportation and storage cost recovery,transportation and storage costs per barrel at the USGC would be US$13.00 per barrel compared to US$13.88 per barrel and the WTI:AWB differential at the USGC would beUS$3.05 per barrel compared to US$2.17 per barrel.
4. Results are translated at the average foreign exchange rate of C$1.3316.
BLEND SALES BY MARKET
In 2020, MEG has substantially reduced its exposure to volatile Alberta differential market

19
$5.7 billion of tax pools immediately deductible
1. Refers to the amount of tax pools utilized while the pools are fully deductible.2. Tax pool value based on step down in tax rate from 25% to 23% over next three years (tax pools as at December 31, 2019); Value presented per MEG share, using fully diluted
shares outstanding as of December 31, 2019.3. Maximum theoretical value is calculated based on average 2020 tax rate of 25.0% applied to MEG’s total and immediately deductible tax pools, and using fully diluted shares
outstanding as of December 31, 2019.
$7.2 billion of tax pools
$5.7 billion of tax pools are
immediately deductible
Non-Capital LossesCEE + SR&ED
CDEOther Pools
MATERIAL UNRECOGNIZED VALUE FROM TAX POOLS
A M O U N T O F P O O L S U T I L I Z E D
B Y Y E A R 1
I L L U S T R A T I V E V A L U E O F T A X P O O L S A T 8 . 0 %
D I S C O U N T R A T E
( C $ M M ) ( C $ B n ) ( C $ / s h ) 2
$500 $1.0 $3.15
$1,000 $1.2 $4.05
$1,500 $1.4 $4.40
$2,000 $1.4 $4.65
M A X I M U M T H E O R E T I C A L V A L U E 3
Total $1.8 Bn $5.80/sh2
Immediately Deductible $1.4 Bn $4.55/sh2
C O M P O S I T I O N O F T A X P O O L S ( C $ B I L L I O N )
20
This presentation is not, and under no circumstances is to be construed to be a prospectus, offeringmemorandum, advertisement or public offering of any securities of MEG Energy Corp. (“MEG”). Neither the UnitedStates Securities and Exchange Commission (the “SEC”) nor any other state securities regulator nor anysecurities regulatory authority in Canada or elsewhere has assessed the merits of MEG’s securities or hasreviewed or made any determination as to the truthfulness or completeness of the disclosure in this document.Any representation to the contrary is an offence.
Recipients of this presentation are not to construe the contents of this presentation as legal, tax or investmentadvice and recipients should consult their own advisors in this regard.
MEG has not registered (and has no current intention to register) its securities under the United States SecuritiesAct of 1933, as amended (the “U.S. Securities Act”), or any state securities or “blue sky” laws and MEG is notregistered under the United States Investment Act of 1940, as amended. The securities of MEG may not beoffered or sold in the United States or to U.S. persons unless registered under the U.S. Securities Act andapplicable state securities laws or an exemption from such registration is available. Without limiting the foregoing,please be advised that certain financial information relating to MEG contained in this presentation was prepared inaccordance with International Financial Reporting Standards as issued by the International Accounting StandardsBoard, which differs from generally accepted accounting principles in the United States and elsewhere.Accordingly, financial information included in this document may not be comparable to financial information ofUnited States issuers.
DISCLAIMER

21
Forward-Looking InformationCertain statements contained in this presentation may constitute forward-looking statements within the meaning of applicable Canadian securities laws. These statements relate to futureevents or MEG's future performance. All statements other than statements of historical fact may be forward-looking statements. The use of any of the words "anticipate", "continue","estimate", "expect", "may", "will", "project", "should", "believe", "plan", "intend", "target", "potential" and similar expressions are intended to identify forward-looking statements. Forward-looking statements are often, but not always, identified by such words. These statements involve known and unknown risks, uncertainties and other factors that may cause actual results orevents to differ materially from those anticipated in such forward-looking statements. In particular, and without limiting the foregoing, this presentation contains forward-looking statements withrespect to our2020 capital budget, allocation and funding, expected free cash flow, future production capability, including the impact of a turnaround, target 2020 production, anticipated decline rates, non-energy operating costs, G&A expense, the value of tax pools, our focus and strategy, expected sustaining and maintenance capital and growth capital, the anticipated annualized interestsavings from credit facility refinancing and debt repayments, our projections of commodity prices and anticipated results from hedging activities, the expected impact of IMO 2020 on ourbusiness, capital efficiencies associated with certain growth projects, anticipated GHG and water withdrawal intensities, market access and diversification plans, and plans to improve overallcost efficiencies.
Forward-looking information contained in this presentation is based on management's expectations and assumptions regarding, among other things: future crude oil, bitumen blend, naturalgas, electricity, condensate and other diluent prices, foreign exchange rates and interest rates; the recoverability of MEG's reserves and contingent resources; MEG's ability to produce andmarket production of bitumen blend successfully to customers; future growth, results of operations and production levels; future capital and other expenditures; revenues, expenses and cashflow; operating costs; reliability; anticipated reductions in operating costs as a result of optimization and scalability of certain operations; anticipated sources of funding for operations andcapital investments; plans for and results of drilling activity; the regulatory framework governing royalties, land use, taxes and environmental laws and Federal and Provincial climate changepolicies, and the timing and level of government apportionment easing, in which MEG conducts and will conduct its business; and business prospects and opportunities. By its nature, suchforward looking information involves significant known and unknown risks and uncertainties, which could cause actual results to differ materially from those anticipated. These risks include,but are not limited to: risks associated with the oil and gas industry, including the transition to a low carbon environment; the securing of adequate access to markets and transportationinfrastructure and to investment capital ; the availability of capacity on the electricity transmission grid; the uncertainty of reserve and resource estimates; the uncertainty of estimates andprojections relating to production, costs and revenues; health, safety and environmental risks; risks of legislative and regulatory changes to, amongst other things, tax, land use, royalty,environmental laws, and Federal and Provincial climate change policies and curtailment of production policies, and, MEG’s ability to implement sales under the Alberta Government’s SpecialProduction Allowance (“SPA”) program; risks related to increased activism and public opposition to fossil fuel development; assumptions regarding and the volatility of commodityprices, interest rates and foreign exchange rates; risks and uncertainties related to commodity price, interest rate and foreign exchange rate swap contracts and/or derivative financialinstruments that MEG may enter into from time to time to manage its risk related to such prices and rates; risks and uncertainties associated with securing and maintaining the necessaryregulatory approvals and financing to proceed with MEG’s future phases and the expansion and/or operation of MEG’s projects; risks and uncertainties related to the timing of completion,commissioning, and start-up, of MEG’s turnarounds, and of future phases, expansions and projects; the operational risks and delays in the development, exploration, production, and thecapacities and performance associated with MEG's projects; and uncertainties arising in connection with any future acquisitions and/or dispositions of assets. Although MEG believes that theassumptions used in such forward-looking information are reasonable, there can be no assurance that such assumptions will be correct. Accordingly, readers are cautioned that the actualresults achieved may vary from the forward-looking information provided herein and that the variations may be material. Readers are also cautioned that the foregoing list of assumptions,risks and factors is not exhaustive.
Further information regarding the assumptions and risks inherent in the making of forward-looking statements can be found in MEG's most recently filed Annual Information Form ("AIF"),along with MEG's other public disclosure documents. Copies of the AIF and MEG's other public disclosure documents are available through the Company's website atwww.megenergy.com/investors and through the SEDAR website at www.sedar.com. The forward-looking information included in this presentation is expressly qualified in its entirety by theforegoing cautionary statements. Unless otherwise stated, the forward-looking information included in this presentation is made as of the date of this presentation and MEG assumes noobligation to update or revise any forward-looking information to reflect new events orcircumstances, except as required by law.
This presentation contains future-oriented financial information and financial outlook information (collectively, "FOFI") about MEG's prospective results of operations including, withoutlimitation, cash flow and various components thereof, all of which are subject to the same assumptions, risk factors, limitations, and qualifications as set forth above. Readers are cautionedthat the assumptions used in the preparation of such information, although considered reasonable at the time of preparation, may prove to be imprecise and, as such, undue reliance shouldnot be placed on FOFI. MEG's actual results, performance or achievement could differ materially from those expressed in, or implied by, these FOFI, or if any of them do so, what benefitsMEG will derive therefrom. MEG has included the FOFI in order to provide readers with a more complete perspective on MEG's future operations and such information may not be appropriatefor other purposes. MEG disclaims any intention or obligation to update or revise any FOFI statements, whether as a result of new information, future events or otherwise, except as requiredby law.
DISCLOSURE ADVISORIES

22Note: Values are rounded to the nearest million
Non-GAAP MeasuresThis presentation refers to the non-GAAP measure of free cash flow, as well as adjusted funds flow which is defined in Note 20 of the Q3 2020 Financial Statements. These terms may not be comparable to similar measures provided by other companies and are not intended to represent net cash provided by (used in) operating activities. These financial measures should not be considered in isolation or as an alternative to, or more meaningful than, MEG's consolidated statement of cash flow as determined in accordance with IFRS, as an indicator of financial performance.
Free cash flow is presented to assist management and investors in analyzing performance by the Corporation as a measure of the capacity of the business to repay debt, incur discretionary capital or increase returns to shareholders. Free cash flow is calculated as adjusted funds flow less capital expenditures.
DISCLOSURE ADVISORIES
N I N E M O N T H S E N D E D S E P T E M B E R 3 0
($mm) 2 0 2 0 2 0 1 9
Net cash provided by (used in) operating activities 186 406
Net change in non-cash operating working capital item (28) 162
Funds flow from (used in) operations 158 568
Adjustments:
Contract cancellation 33 -
Decommissioning expenditures 3 1
Adjusted funds flow 194 569
Capital expenditures (109) (126)
Free Cash Flow 85 443

INVESTOR RELATIONS
I N V E S T O R R E L A T I O N S
T: 5 8 7 . 2 9 3 . 6 0 4 5 E : I N V E S T @ M E G E N E R G Y. C O M
M E D I A R E L A T I O N S
T: 5 8 7 . 2 3 3 . 8 3 5 3 E : M E D I A @ M E G E N E R G Y. C O M
W W W . M E G E N E R G Y. C O M / I N V E S T O R S