decentralization and governance of healthcare in …dlouhy/3healthcare_czech_2.pdf194...
TRANSCRIPT
Decentralization and Governance
of Healthcare in the
Czech Republic in the 1990s
Jan Jaroš
Kamil Kalina
Martin Dlouhý
Antonín Malina

193
Decentralization and Governance of Healthcare
in the Czech Republic in the 1990s
Jan Jaroš, Kamil Kalina Martin Dlouhý, Antonín Malina
1. EXECUTIVE SUMMARY
There is no doubt that the Czech health sector offers a higher quality of care now than
it did ten years ago. The system is equitable, ensuring access to comprehensive care for
the whole population. The improvements in efficiency in healthcare provision were
needed, especially to address the excessive amounts of beds and specialists. Neverthe-
less, the Czech Republic was relatively successful in the deep reform which moved
from the inflexible state health system inherited from the communist regime toward
a pluralistic health insurance system, albeit with many financial problems. In tracing
the steps of reform, we were able to distinguish two different reform periods. The first
half of 1990s was the period of major reform in health finance. The insurance system
was introduced, physician practices were privatized, hospitals gained more autonomy,
professional chambers were established, and patients enjoy free choice and access to
modern health technologies. This reform period was, however, negatively affected by
ideology, naïve radicalism, and lack of experience with public administration in a mar-
ket economy. In the second half of the 1990s, the main reform topics, therefore, were
economic stabilization, consolidation, regulation, and sustainability. The health sector
is now more extensively regulated and to some extent stabilized. The 21st century opens
with a wide public administration reform which will impact the health sector in ways
we are not able to predict. Gains in efficiency will be welcomed. The last thing to note
is the absence of a long-term reform concept based on sufficient and qualified analytical
work. This leads to ad hoc measures directed at the most urgent problems but ignoring
other areas, which will lead to further problems.

194
D E C E N T R A L I Z AT I O N I N H E A LT H C A R E
1.1 General Information
The Czech Republic is located in Central Europe and covers an area of 78,866 km2. It
is bordered by Poland to the north (762 km), Slovakia to the east (252 km), Austria to
the south (466 km), and Germany to the southwest, west, and northwest (810 km). The
total population according to the 2001 census was 10.2 million. In 1990 (the previous
census), the population was 10.4 million. The female share of the population is 51.3
percent. The population density is 129.4 inhabitants per km2. 75 percent of the popula-
tion live in urban areas. The capital city of Prague concentrates about 10 percent of the
total population. According to the last census the ethnic composition was 94.2 Czech,
1.9 percent Slovak, 0.5 percent Polish, 0.4 percent German. The official language is
Czech. 59 percent of the population is atheist, 32 percent Roman-Catholic, 5.5 percent
Protestant, 9 percent undetermined.
The country is administratively divided into 13 regions and the capital city of Prague.
In the regions there are 205 communities with branches of public administration. For
certain statistics, judicial/legal proceedings etc., the previous division into 76 districts is
still used, where branches of some ministries and other central institutions operate.
1.2 Socio-economic Indicators
Chapters 2.6 to 2.8 include a broader description of the economic background of the
state and the development of the Czech healthcare system. Here we will introduce the
country profile with selected figures from 2002. More data and description of the eco-
nomic situation and development with the special attention to healthcare is available
in a recent study by the OECD: Economic Survey—Czech Republic 2003.1 The Czech
Republic has been a member of the OECD since 1965 (see Table 1).
The following charts show a dynamic view of those figures in the last thirteen
years—the period of post-communist development: See Annex 1 and 2.

195
D E C E N T R A L I Z AT I O N A N D G O V E R N A N C E O F H E A LT H C A R E I N T H E C Z E C H R E P U B L I C I N T H E 1 9 9 0 S
Table 1.
Basic Indicators 2002
Year 2002
GDP per capita (PPP $) 15,813
Labor force as % of population;
of which:
52.6 M; 40.9 F
• Agriculture 4.8%
• Industry and construction 40.4%
• Services 54.8%
Unemployment rate % 5.9 M; 9.0 F
Education of population 15+ years (2001)
• Elementary 22%
• Trained workers 37%
• Secondary 31%
• University 10%
Annual average rate of inflation % 1.8
Government revenue as % of GDP 46.6
Consumer price index 1.8
% of population age 0–14 16.6 M; 14.9 F
% of population age 65+ 11.0 M; 16.6 F
Live births per 1,000 individuals 9.6 M; 8.6 F
Total fertility rate 1.2
Annual population growth per 1,000 individuals –1.5
Life expectancy at birth 71.1 M; 78.4 F
Abortions per 1,000 live births 44.1
Marriages per 1,000 individuals 5.2
Divorces per 1,000 individuals 3.1
Source: Czech Statistical Office; Institute of Health Information and Statistics (IHIS).
1.3 Health and Healthcare Indicators
The main goal of the reforms of 1989/90 was to improve the health status of the Czech
population, which had been stagnating since the beginning of the 1960s (compared to
developed European countries). From World War II to the 1960s Czechs’ health status
was at the European standard. According to health indicators, for the period from
1960 to 1964 Czechoslovakia was ranked 10 among 27 European countries; by 1974
196
D E C E N T R A L I Z AT I O N I N H E A LT H C A R E
it dropped to 22, and by the 1980s to 27. This was determined by the overall decline
of the social and economic level of socialist society. The means for improving it was to
introduce a new healthcare system (whose features are described in the following text).
This paper is not primarily focused on the history of the health status of the Czech
population. The post-war period and especially the period since 1960 is described in the
Historical Yearbook of Healthcare: Czechoslovakia (IHIS 1992). A complete description
of the development with many charts illustrating the period since 1970 is available in
the WHO “europaper” Highlights on Health in the Czech Republic (WHO 2001). The
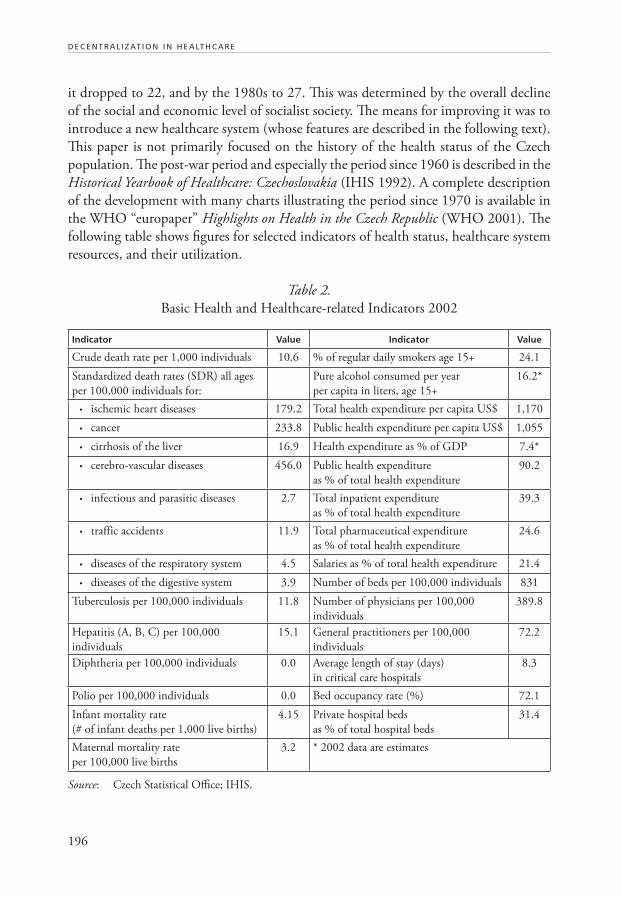
following table shows figures for selected indicators of health status, healthcare system
resources, and their utilization.
Table 2.
Basic Health and Healthcare-related Indicators 2002
Indicator Value Indicator Value
Crude death rate per 1,000 individuals 10.6 % of regular daily smokers age 15+ 24.1
Standardized death rates (SDR) all ages
per 100,000 individuals for:
Pure alcohol consumed per year
per capita in liters, age 15+
16.2*
• ischemic heart diseases 179.2 Total health expenditure per capita US$ 1,170
• cancer 233.8 Public health expenditure per capita US$ 1,055
• cirrhosis of the liver 16.9 Health expenditure as % of GDP 7.4*
• cerebro-vascular diseases 456.0 Public health expenditure
as % of total health expenditure
90.2
• infectious and parasitic diseases 2.7 Total inpatient expenditure
as % of total health expenditure
39.3
• traffic accidents 11.9 Total pharmaceutical expenditure
as % of total health expenditure
24.6
• diseases of the respiratory system 4.5 Salaries as % of total health expenditure 21.4
• diseases of the digestive system 3.9 Number of beds per 100,000 individuals 831
Tuberculosis per 100,000 individuals 11.8 Number of physicians per 100,000
individuals
389.8
Hepatitis (A, B, C) per 100,000
individuals
15.1 General practitioners per 100,000
individuals
72.2
Diphtheria per 100,000 individuals 0.0 Average length of stay (days)
in critical care hospitals
8.3
Polio per 100,000 individuals 0.0 Bed occupancy rate (%) 72.1
Infant mortality rate
(# of infant deaths per 1,000 live births)
4.15 Private hospital beds
as % of total hospital beds
31.4
Maternal mortality rate
per 100,000 live births
3.2 * 2002 data are estimates
Source: Czech Statistical Office; IHIS.

197
D E C E N T R A L I Z AT I O N A N D G O V E R N A N C E O F H E A LT H C A R E I N T H E C Z E C H R E P U B L I C I N T H E 1 9 9 0 S
Several charts show a dynamic view of these figures in the last thirteen years—the
period of post-communist development. To better understand the position of the
Czech Republic, we have also added average figures for the countries of the European
Union: Austria, Belgium, Denmark, Finland, France, Germany, Greece, Ireland, Italy,
Luxembourg, Netherlands, Portugal, Spain, Sweden, the United Kingdom, and also for
Central and Southeastern European Countries (CSEC): Albania, Bosnia and Herze-
govina, Bulgaria, Croatia, Czech Republic, Estonia, Hungary, Latvia, Lithuania, Poland,
Romania, Slovakia, Slovenia, FYR Macedonia, and Serbia and Montenegro (see charts
in Annex 1 and 2).2
The level of the technical equipment for healthcare has improved rapidly in the
1990s. The following table shows present capacity not including establishments outside
the healthcare sector (military hospitals etc.):
Table 3.
Technical Equipment
Medical Apparatus in Health Establishments as of 2002 Number of Performances3
Apparatus Quantity Number of Individuals
per Unit
Total Per Unit
X-ray diagnostic apparatus 6,635 1,538 12,949,618 1,952
X-ray therapeutic apparatus 48 212,625 208,697 4,348
Linear accelerators, therapeutic irradiators 70 145,800 1,118,558 15,979
Radioisotope irradiators 24 425,250 12,159 507
Lithotripters—therapeutic 33 309,273 18,891 572
Ultrasonic scanners (sonographs) 2,583 3,921 5,767,535 2,233
Other radiotherapy apparatus 151 67,589
Other Listed Apparatus
Magnetic resonance (MR tomograph) 22 463,909 86,941 3,952
Laser, surgical 207 49,304 73,815 357
Laser, therapeutic 1,331 7,668 542,899 408
Biochemical analyzers (automated) 1,447 7,053 na na
Hemodialysis units 1,268 8,049 na na
Ventilators (for long-term lung ventilation) 1,891 5,397 na na
Hyperbaric chamber, one place 10 1,020,600 na na
Hyperbaric chamber, multiple 5 2,041,200 na na
Other diagnostic and therapeutic
apparatus costing over 2 million CZK
(US $6,500) not listed above
781 13,068 na na
Source: IHIS 2003.

198
D E C E N T R A L I Z AT I O N I N H E A LT H C A R E
2. THE ROAD TO REFORM
2.1 Brief Description of the Healthcare System Before 1990
The healthcare system in the Czech territory has maintained a relatively high standard,
along with the economy and the general level of education. Obligatory health insur-
ance for industrial workers was established in 1888. From 1919 to 1924, obligatory
health insurance in the independent Czechoslovak Republic was extended to the entire
wage-earning population. Payment of insurance contributions (4.3 percent of wages)
was shared half and half between employer and employee; these contributions were
managed by about 300 insurance funds. The funds covered all employees and their
family members with healthcare provided by contracted private physicians and public
hospitals. Insurance funds also compensated for lost wages during illness at approximately
60 percent of the relevant wage (salary) up to a maximum of 39 weeks.
In 1948 health and social insurance was unified into one obligatory system of
insurance for all citizens. A sole Central National Insurance Fund (CNIF) was foun-
ded which covered all healthcare and illness benefits. The insurance, amounting to
6.8 percent of wages, was paid entirely by the employer. This amount did not include
pensions for the elderly.
In 1951, a Soviet model was established and the CNIF was abolished. The state took
over all healthcare coverage and financed it through taxes. All healthcare was provided free
of charge. At the same time, all healthcare providers were nationalized and subsequently
incorporated into regional and district institutes of national health. Since 1960 the Czech
part of Czechoslovakia had eight regions and 76 districts. The form and function as well
as the financing of this system from 1960 to 1991 is shown in Organizational Chart 1
in the appendix (this chart is necessary to understand the following text).
Each district (of the 76) had one District Institute of National Health (DINH), and
each region (of the 8) had one Regional Institute of National Health (RINH), and so
each healthcare organization (DINH, RINH) corresponded to only one administrative
unit, either a district or a region. DINHs consisted of medium or small hospitals, large
divisions for ambulatory care, polyclinics (with GPs and ambulatory specialists under
one roof ), healthcare centers (mainly for primary care), pharmacies, emergency and first
aid services, hygienic stations, healthcare centers for enterprises, nursing schools, etc.
1. The average number of employees in a DINH was 2,690, of which an average
of 390 were doctors. RINHs mainly consisted of larger and more specialized
hospitals, polyclinics, and pharmacies. GPs did not form part of the RINHs.
2. Healthcare was financed through general taxes. The Ministry of Finance
(MoF) allocated funds to regions and districts through the Regional National
Committee (RNC) and the District National Committee (DNC). RNCs and

199
D E C E N T R A L I Z AT I O N A N D G O V E R N A N C E O F H E A LT H C A R E I N T H E C Z E C H R E P U B L I C I N T H E 1 9 9 0 S
DNCs then distributed relevant funds to the RINHs and DINHs under their
jurisdiction.
3. The Ministry of Health (MoH) methodically controlled the professional (medi-
cal) aspects of healthcare through a network of chief regional and district experts
in each medical specialization. The MoH was also engaged in medical research
and was ultimately responsible for hygienic supervision, drug administration,
and overall financial control of health services.
4. All manpower of the RINHs and DINHs, from manual labor to the top spe-
cialists, received fixed salaries that inadequately reflected level of education and
quality of work.
5. Directors of RINHs and DINHs were appointed by the heads of the RNC or
DNC, after receiving approval by the Communist Party.
6. The area of responsibility of all health facilities was strictly fixed. Therefore,
all citizens were allotted a specific GP, polyclinic with ambulatory specialists,
hospital, and other services according to the citizen’s domicile.
7. Preventive as well as curative healthcare for the economically active part of the
population, on the primary care level, was organized through enterprise physi-
cians. These physicians were employees of DINHs as well, but they worked
exclusively with the enterprise employees. By the end of the 1980s, approximately
75 percent of the economically active population’s healthcare was covered in
this way.
8. All health services (with a few exceptions, e.g. dental gold, more expensive
eyeglasses, etc.) were provided free of charge. Drugs were also provided free of
charge, with the exception of a limited number of medicines or remedies which
were available in pharmacies without a prescription.
2.2 The Role and Place of Healthcare on the Political-economic Agenda of the Government Before and After 1990
The socialist system of healthcare was a point of pride for the regime. This was partly
justified before the end of the 1960s, but in the 1970s and 80s it was further and further
from the truth. The government and the Communist Party did not reflect many severe
problems (the worsening health status of the population, under-funding of healthcare,
deteriorating medical technology, etc.); if they did, problems were neither resolved nor
openly discussed. Only some quantitative data were used as a tool for political propa-
ganda, e.g. the number of doctors, number of hospital beds, number of new hospitals, etc.
This twisting of reality had been slowly changing in the last years of the 1980s,
consequent to the hidden political debate held inside the Communist Party on the sus-
tainability of planned economy and other “achievements” of socialism. The problems of

200
D E C E N T R A L I Z AT I O N I N H E A LT H C A R E
the health sector were discussed in the government, and the MoH was ordered to prepare
some moderate changes and improvements. Also research institutions were mandated to
study problems in the health sector. However, this did not have any significant impact.
In fact, the proper aim and content of changes being prepared at the MoH remained
unknown, and the effort to ameliorate the system of healthcare was cut by the collapse
of the communist regime in the Fall of 1989.
The first post-communist minister of health (a member of the temporary cabinet
working before the first free elections in June 1990) was open to reform ideas and
initiated an official preparation for health reform. He appointed a multi-disciplinary
external task force, which in several months elaborated a first draft for reform, called
the Yellow Paper (1990). After the first free elections the process was accelerated. Several
members of the reform task force entered the MoH, one became the Minister of Health,
and the new non-communist coalition cabinet declared the reform of the healthcare
system one of its priorities.
In the next several months the second and more radical reform draft was elabora-
ted (Potucek et al. 1990) and approved by the cabinet in December 1990. This can be
taken as a turning point from preparation to implementation; however some steps were
already completed before this. In the two years before the next parliamentary elections,
the government developed real pro-reform activities. Key bills were approved and passed
by Parliament, among other resolutions the autonomy of state hospitals and polyclinics,
the launch of the National Program for Health Promotion, and the plan for property
changes in the health sector.
Further development in the 1990s can be illustrated by the key programs of the
various cabinets:
• 1992 (a center-right coalition dominated by conservatives and minor parties:
Christian democrats and liberals): radical reforms of the healthcare system with-
out limiting accessibility of services; privatization of health services; improving
the social status of medical doctors and other medical personnel.
• 1996 (a right-center coalition—the same as in 1992): continuing reforms; con-
tinuing privatization of health services; definition of the guaranteed package of
healthcare services; measures against spiraling cost; rationalization of hospitals.
• 1998 (social democrats): broadly accessible healthcare for citizens; equity and
solidarity; strengthening the role of the public (i.e. non-private) sector of health
services; quality assurance.
• 2002 (left-center coalition dominated by social democrats and minor parties:
Christian democrats and liberals): broad accessibility, equity, and solidarity;
economic sustainability of health expenditures; public sector reform.
Healthcare was not on top of the political-economic agenda after 1992, but impor-
tant topics in health policy were discussed. From 1992 to 1995, the main attention of

201
D E C E N T R A L I Z AT I O N A N D G O V E R N A N C E O F H E A LT H C A R E I N T H E C Z E C H R E P U B L I C I N T H E 1 9 9 0 S
the government was focused on the privatization of health services. In the mid-1990s,
the danger of spiraling costs became urgent, and various cost containment measures
were put on the government agenda over several years. However, reforms in the health
sector were not assessed or reviewed, and almost no substantial reforms were launched
or officially planned. The MoH itself was having difficulty finding its proper role and
position in a new pluralistic system, and permanent quarrels with other major partners,
e.g. the General Health Insurance Fund (GHIF) and the medical chambers, seemed to
block any progress. One exception was the period from 1996 to 1997 under a rather
strong Minister of Health (the only one in four decades who was not a medical doctor)
when many short- and mid-term reform measures were prepared and implemented,
and a long-term reform project was elaborated. This period, called the “second round
of healthcare reform” or “the reform of the reform,” was stopped by the political crisis
that led to pre-term parliamentary elections. After 1998 the government dominated by
the Social Democratic Party did not continue the reform process, and the word “reform”
itself disappeared from the coalition’s discourse.
Reform of the healthcare system in the context of political, economic, and social trans-
formation of the CR in the 1990s:
Reform of the healthcare system was an inseparable component of the political,
economic, and social transformation of the CR in the 1990s. Its position within this
context can be described as follows:
1. The political changes in 1989 established a background for changes in the health
sector, particularly for formulating and launching reforms. The acceleration of the
political transformations after the first free parliamentary elections in 1990 also ac-
celerated reforms in the health sector and created pressure to move them ahead.4
2. Liberal and market principles were the leading orientation for profound changes
in the country in general, and reforms in the health sector were not a part of
the “mainstream.”
3. For economic transformations, the government needed a “social pillar,” which,
among other things, created specific requirements and limits for healthcare
reform. The reform was intended to be “painless” both for consumers and for
providers in order to avoid dissatisfaction with the general processes of trans-
formation and to maintain public consensus and political support.
4. In spite of this broad concern, changes in the healthcare system (and particularly
the consequent problems) were taken more and more as an agenda belonging
solely to the health sector and the MoH.
Reform of the healthcare system did not avoid many rather negative features that
were typical of transition as a whole, e.g.:
• Poor preparation and lack of evaluation: the reform draft approved by the gov-
ernment in 1990 had been “hot-tailored”—elaborated very quickly. Moreover,

202
D E C E N T R A L I Z AT I O N I N H E A LT H C A R E
its time horizon was limited to1992. However no evaluation was taken out after
that first period and no innovative scenario was conceptualized for subsequent
years. In fact, before 1996, conceptual work, analyses, and evaluation were
considered useless.
• The vague role of the state: after the experience of the communist period, there
was a general reluctance to enforce or accept any strong state role, even where
appropriate. In the health sector this stimulated a rapid process of decentraliza-
tion, devolution, and delegation, in which the MoH did not behave as a strong
player and quite often did not fully use the extent of its tools and competencies.
On one hand, this facilitated a sound spontaneity; on the other, it left space for
various power games, lobbies, and special interests.
• Lack or regulation and control mechanisms: in the first reform period there was
a conviction that freedom itself could form responsibility and lead to reason-
able behavior by people and institutions. Gaps in new legislation and missing
regulatory and control measures were a general deficiency. In the health sector,
this led to excessive spending, overproduction, and over-utilization of care.
• A centralized approach and ignorance of foreign experience: in healthcare re-
forms, foreign experience and the expertise of international organizations (the
World Bank, WHO) were taken into account in the period 1990–1992, however
no plan for long-term and systematic cooperation or assistance was accepted.
From 1992 to 1997, the prevalent attitude was that recommendations from
international organizations and experts could not meet Czech needs.5 There
were exceptions with little impact, but the situation in general can be illustrated
by the fact that the CR in 1991 rejected a World Bank loan targeting health
sector reform, and in 1996 did not join the Ljubljana Charter6 (the only post-
communist country not do so, and together with the United Kingdom, one of
two countries in the WHO European region not to); it joined much later due
to the pressure from Parliament.7
• Discontinuity due to political circumstances: maybe more than another sector,
reform in the health sector was very sensitive to politics. Even in a clearly-defined
“reform or transition period” (1990–1997) the reform of healthcare was not a con-
tinual process. It suffered many setbacks and many steps remained uncompleted.
As was mentioned above, after the left-wing shift following the 1998 parliamentary
elections, there was no political will to continue, and reforms ceased.
2.3 Specific Reasons for Launching the Reforms
Reform of the healthcare system, formulated and launched in the 1990s, was insepa-
rable from deep political, economical, and social changes in the Czech Republic (and

203
D E C E N T R A L I Z AT I O N A N D G O V E R N A N C E O F H E A LT H C A R E I N T H E C Z E C H R E P U B L I C I N T H E 1 9 9 0 S
Czechoslovakia) after the “Velvet Revolution” of November 1989. However, specific
reasons also existed.
2.3.1 Political Motivations
As described in the section on health and healthcare indicators, there was an apparent
stagnation in health status beginning in the1960s. The main reason was the shortening
of the mean lifespan (with a specific increase of mortality of men over 35 years of age) and an
increase in morbidity and in partial or total disability (see tables and charts 1.2 and 1.3).
Mortality, morbidity, and disability increased mainly due to cardiovascular diseases
and neoplasms, but also due to diseases of the muscosceletal and digestive systems. An
increase in the number and severity of diseases caused by psychological and psychosocial
factors was also observed. The rate of infant mortality was decreasing more slowly than
in other countries.
Poor health cannot not be ascribed merely to health services, but it seemed evident
that the poor quality of the healthcare system substantially contributed to the situati-
on, which was described as “a chronic and deepening crisis of health and healthcare”
(Kalina et al. 1991).
The main symptoms of this “chronic and deepening crisis” in healthcare are analyzed
in more detail in section 2.4. Although they are based on a study made seven years after
the launch of the reform, they do not differ significantly from what is presented in the
White Paper—the reform draft approved by the government in 1990:
• a rigid, hierarchical system of health services
• lack of modern management, economical stimuli, and quality assurance
• deteriorating buildings and equipment
• an insufficient number of doctors and hospital beds for practical use (while
statistically the CR was better off in both parameters than developed European
countries)
• waste of resources, human potential, and public confidence
• missing links among primary care, secondary care, and hospital care, as well as
between health and social care.
These problems created pressure for reform. Both politicians and experts empha-
sized that the system of health services had lost its ability to make rational decisions
and to react flexibly to the health needs of the population. It had failed in its central
mission—to encourage good health. Therefore, modification or partial changes to the
system were regarded as insufficient, and a radical change, establishing a “completely
new system,” was seen as an appropriate challenge in the new political situation (see
the sets of tables and charts 1.2 and 1.3).

204
D E C E N T R A L I Z AT I O N I N H E A LT H C A R E
2.3.2 Public Opinion
The first public opinion pool permitted and released before the collapse of the com-
munist regime revealed healthcare and the environment as two principal areas of public
dissatisfaction. Criticism of the existing healthcare system and desire for changes also
popped up among spontaneous slogans from the Velvet Revolution. Public opinion was
particularly sensitive to the following problems:
• Administrative barriers made the free choice of a physician and healthcare facil-
ity practically impossible.
• Privileges were offered to certain social and political groups and denied others.
• Health services were misused by politicians.
• Top positions were given to the nomenklatura.
• Information and data about health and healthcare was twisted and suppressed.
• Patients were treated in an impersonal manner.
• A shadow economy existed for health services.
• Medical personnel were awarded low social status.
Thus, a radical change of the system of healthcare was also a public aim. At the
beginning, people did not appear to worry that “radical changes” would limit the large
package of services that had been accessible free of charge.
2.3.3 Motivation and Relevance of Medical Personnel
Public sentiment tended to blame the system, not the people working in it. In fact,
medical doctors and nurses never lost their prestige, but were regarded (as they regarded
themselves) as professions degraded by the regime.
Several passages in the White Paper confirm this attitude.
“The citizen, in spite of his proclaimed rights, had practically no rights in health
services, neither as a patient nor as a health worker.”
...“If [the system of healthcare] has not yet collapsed, this is only due to
the moral motivation of the greater part of health workers, to which they ad-
hered even under such unfavorable conditions and exerted considerable efforts
to benefit patients and maintain their professional standards. Thanks to this
motivation, the majority of medical branches have not lost complete touch
with the standard of world medicine, in spite of all the barriers that separated
us from the international medical community. However, in the last few years
the moral reserves of our health services have been exhausted”
(Kalina et al. 1991).

205
D E C E N T R A L I Z AT I O N A N D G O V E R N A N C E O F H E A LT H C A R E I N T H E C Z E C H R E P U B L I C I N T H E 1 9 9 0 S
This may also illustrate the important position of health professions at the begin-
ning of reforms. During and after the Velvet Revolution, the popularity of medical
personnel actually increased due to the civic activism of many from the profession.
Particularly medical doctors gained notable political influence over a short time, not
only as a pressure group but as real initiators, designers, and leaders of reforms; also
as politicians in the government, in Parliament and in numerous local councils. Many
sought to reform healthcare not only in the name of medical professionals, but in the
name of the public as well.
2.3.4 Economic Factors
It was clear in the 1980s that the communist economies were not able to compete with
the market economies. The economic gap between the European Union and the former
Czechoslovakia was widening. Large heavy industries (metal and steel, coal, machinery)
dominated the local economy instead of the necessary rise of smaller and more flexible
companies oriented to trade, services, and information technology. Lack of investments
led to obsolete technology in industry as well as in the health sector. Many hospitals were
located in old buildings in need of expensive renovations. The limited opportunities to
sell products in developed countries caused a scarcity of convertible currencies. For the
health sector, it was therefore difficult to import modern health technology and drugs
from the developed market economies. For health workers, access to new technology
and new drugs was seen as an important achievement of the changes of 1989.
2.4 Features of the Healthcare System Contributing to Specific Problems, which Then Became Main Goals of Reform
The main negative features of the healthcare system before 1990, which then became
the main goals of reform, are as follows8 (Jaroš, Kalina et al. 1998):
1. The general health status and mortality rate of the Czech population had steadily
worsened since the end of the 1960s.
2. From 1970 to 1990, healthcare suffered a great lack of financial resources without
regard to actual needs.
3. There was an overall centralization of healthcare, which augmented low efficiency,
causing a great waste of the already limited resources.
4. A rigid state monopoly in the provision of health services eliminated any active
participation by the citizen in the care for his own health as well as denying
awareness of the value and costs of health.

206
D E C E N T R A L I Z AT I O N I N H E A LT H C A R E
5. Healthcare policy was permanently under the control of the Communist Party.
Political preferences took priority over objective and professional criteria and
influenced decisions in resource allocation, organization of health services, and
planning of manpower.
6. Economic incentives were eliminated under a wage structure with barely differ-
entiated, fixed salaries. This situation gave rise to a grey market (various forms
of under-the-table payments, gifts, etc.).
7. There was an absence of any modern system for evaluation of quality and
efficiency in healthcare.
8. Technical equipment and infrastructure were out-dated and obsolete. Only very
limited imports of advanced health equipment or foreign drugs were allowed.
9. Motivation of health personnel deteriorated, and they ceased to identify them-
selves with the healthcare system as a whole.
10. Health promotion was implemented directly, but achieved unsatisfactory results.
11. Progress was measured by quantity rather than quality and/or efficiency.
12. Due to the dogma of “cost-free” healthcare, neither individual nor social values
of health, nor the necessary expenditures for health maintenance were sufficiently
appreciated.
2.5 How Problems Were Understood by Various Parties: the Government, Providers, National Experts, and International Observers (WB, WHO, etc.)
Although in 1990 there was a broad consensus that the healthcare system needed reform
and that changes were inevitable, the views on the principles, character, extent, depth,
and tempo of reform differed from the beginning. Only several principles relevant for
reform were clear and broadly accepted:
• healthcare free of charge at the point of delivery
• free choice of physician and healthcare facility
• decentralization of decision making
• high degree of autonomy for healthcare facilities and healthcare providers
• greater role for communities and municipalities9
• enhanced primary care and the role of general practitioners.10
The second reform draft—the White Paper—approved by the government in De-
cember 1990, signaled a more radical way of change, and several experts working on the
previous document (the Yellow Paper) refused to support it. Neither in the government
itself could a 100 percent consensus be reached, and very soon discrepancies appeared
between the government and Parliament and between the government and providers.

207
D E C E N T R A L I Z AT I O N A N D G O V E R N A N C E O F H E A LT H C A R E I N T H E C Z E C H R E P U B L I C I N T H E 1 9 9 0 S
When the new system of healthcare came fully into practice (on January 1, 1993)
it fixed the permanent heterogeneity of views. Besides the government there were other
powerful players: the GHIF and representatives of providers, particularly the Medi-
cal Chamber. Covert or overt power struggles among these major partners in health
policy continued up to the year 2000. The different views of the center-right coalition
governing from 1992 to 1997 often played an important role both in the government
and Parliament.11
The views of the providers’ representatives soon began to diverge, consequent to
the different interests of various groups (hospitals, ambulatory specialists, GPs, etc.);
among these groups the position of GPs was rather weak.
The views of national experts were also far from homogenous, although in the first
half of 1990s they were not numerous and most were collaborating with the government
to some degree. However there was a time when the MoH did not trust any external
specialists, claiming they were unnecessary. Consequently, some joined other major
players, e.g. GHIF or the providers’ representatives.
Examples of important controversial issues in reform:
• health insurance in itself (versus a kind of NHS); particularly its rapid and poorly
prepared implementation and the high share of the financing from insurance
funds (versus multi-source financing)
• fee-for-service remuneration schemes for all kinds of services—both due to
principle and due to the system’s lack of caps and regulations
• extensive privatization, particularly in ambulatory services
• overspending, overproduction, and over-utilization of services and proposed
cost contain ment mechanisms
• the position of GPs as “gate-keepers” versus free choice and access to secondary
care
• definition (in extent and content) of an essential guaranteed package of health
services
• the plurality of health insurance funds and proposals and the variety of insur-
ance plans in the public sector
In many cases presented here, “heterogeneity of views” reflects different economic
motivations: e.g. providers’ representatives pushed for steps that would put more
money in the health sector and strengthen the autonomy of providers, while objecting
to limits and regulations. The government, particularly in the first half of the 1990s,
sought similar but less radical measures, while the majority of specialists warned seri-
ously against such steps.12
The role of external (international) participants was marginal. The World Bank
loan—offered in 1991 and requiring oversight of the reform process—was rejected by
the government.13 Neither was there political will for a greater involvement by the

208
D E C E N T R A L I Z AT I O N I N H E A LT H C A R E
WHO.14 Programs of bilateral collaboration (e.g. with the United Kingdom, the
Netherlands, and the United States) provided some expertise and experience in certain
areas, but they did not substantially influence government policy and the main course of
reform. The same can be said about PHARE-funded projects and the NERA (National
Economic Research Associates) country study in the second half of 90s (Hoffmayer
1994).
Some foreign specialists lacked sufficient knowledge about the Czech healthcare
system and about the country’s level of development and needs, often not differentiat-
ing the Czech Republic from much less developed Eastern European countries. Other
visiting specialists (including from the WHO) made a positive assessment of the com-
munist healthcare system and offered advice on what ought to be preserved. This was,
of course, politically unacceptable.
3. REFORM
3.1 Analyzing Reform Objectives
The reform project of 1990:
The White Paper, which in 1990 established a basis for healthcare reform, summa-
rized the main reform objectives as follows:
1. The new system of healthcare will be part of a global strategy for health regeneration
and promotion.
Health was not to be merely a matter for the health sector, but should be a priority
for society as a whole. Health should be considered an important value during
complicated, changing, and challenging social and economical circumstances;
therefore individuals, families, and social groups were expected to understand
the value of health and increase their motivation to adopt healthier lifestyles.
An important aim was the introduction of a new system of healthcare as part
of a comprehensive program of health promotion.
2. Healthcare will be based on the free choice of well-informed citizens and commu-
nities.
This principle integrated many new, progressive, and nearly revolutionary ideas.
An emphasis was put on principles of self-protection and promotion of health,
self-care and care within families and communities, as well as on self-help
groups, charities, and NGOs. Active participation of citizens in various bodies
was encouraged through public initiative and control. This corresponded to
broadly accepted ideas about individual responsibility, independence from the
state, and the importance of civil society.
In direct relation to health services, free choice of physician and healthcare
facility were central principles. However, there was a presumption that some

209
D E C E N T R A L I Z AT I O N A N D G O V E R N A N C E O F H E A LT H C A R E I N T H E C Z E C H R E P U B L I C I N T H E 1 9 9 0 S
rights and the participation of citizens would be derived from paying obligatory
health insurance contributions and through optional, additional insurance, or
direct payment for some services.
3. The state will guarantee adequate healthcare to all citizens.
State guarantees were intended as part of the social security of citizens in a
changing society. They included accessibility, equity, free care at the point of
delivery, and a human approach. The term “adequate healthcare” presumed that
an essential package of services would be defined. As it was expected that the
cost of care would rise, state guarantees also included an ultimate guarantee of
financial sustainability for the healthcare system.
4. Monopolies on formulation, implementation, and control of health policy will be
broken up and decentralized, and competition will be introduced in health services.
This objective was based on the following principles:
• State control will be delegated to health insurance funds, professional
organizations, and elected community and city councils.
• Much of the competence of the MoH will be decentralized to district
authorities.
• Huge district and regional complexes, such as the DINHs and RINHs,
will be abolished and dissolved into individual facilities that will form an
essential element of the new system
• Individual health facilities will be legally and economically autonomous,
and due to patients’ choice they will compete for service provision (see also
item 8).
5. Every community shall implement the principles of the state health policy in its ter-
ritory.
The broadly accepted conviction that self-governing communities and towns
(suppressed by the previous regime) should and will play a big role in the new
society came to bear on the health sector as well. The key role was assigned to
future “Councils of Health,” in each community or municipality. Communi-
ties and towns also ought to ensure “adequate” services for their population by
providing or contracting with their own facilities.
6. Every citizen will have the right to choose his physician and healthcare facility.
This was intended to:
• Essentially change the doctor-patient relationship from dependence and
subordination to partnership based on confidence and mutual interest.
• Introduce economic stimuli into the system (on the principle that “money
follows the patient”) and promote competition, leading to higher quality
of services.
7. The monopolistic position of state health services will be abolished. The prevailing
form of healthcare provision will be “public” health services.
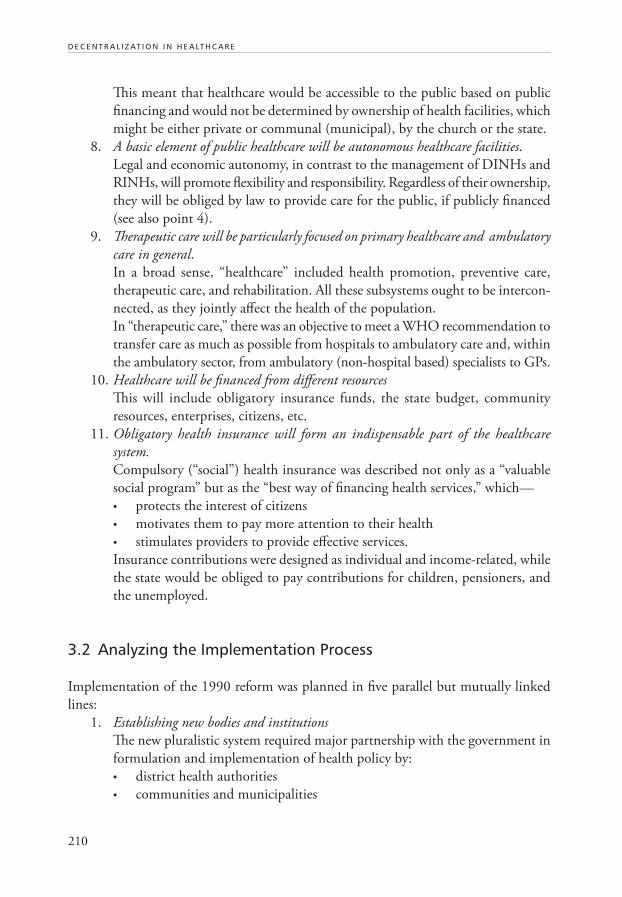
210
D E C E N T R A L I Z AT I O N I N H E A LT H C A R E
This meant that healthcare would be accessible to the public based on public
financing and would not be determined by ownership of health facilities, which
might be either private or communal (municipal), by the church or the state.
8. A basic element of public healthcare will be autonomous healthcare facilities.
Legal and economic autonomy, in contrast to the management of DINHs and
RINHs, will promote flexibility and responsibility. Regardless of their ownership,
they will be obliged by law to provide care for the public, if publicly financed
(see also point 4).
9. Therapeutic care will be particularly focused on primary healthcare and ambulatory
care in general.
In a broad sense, “healthcare” included health promotion, preventive care,
therapeutic care, and rehabilitation. All these subsystems ought to be intercon-
nected, as they jointly affect the health of the population.
In “therapeutic care,” there was an objective to meet a WHO recommendation to
transfer care as much as possible from hospitals to ambulatory care and, within
the ambulatory sector, from ambulatory (non-hospital based) specialists to GPs.
10. Healthcare will be financed from different resources
This will include obligatory insurance funds, the state budget, community
resources, enterprises, citizens, etc.
11. Obligatory health insurance will form an indispensable part of the healthcare
system.
Compulsory (“social”) health insurance was described not only as a “valuable
social program” but as the “best way of financing health services,” which—
• protects the interest of citizens
• motivates them to pay more attention to their health
• stimulates providers to provide effective services.
Insurance contributions were designed as individual and income-related, while
the state would be obliged to pay contributions for children, pensioners, and
the unemployed.
3.2 Analyzing the Implementation Process
Implementation of the 1990 reform was planned in five parallel but mutually linked
lines:
1. Establishing new bodies and institutions
The new pluralistic system required major partnership with the government in
formulation and implementation of health policy by:
• district health authorities
• communities and municipalities
211
D E C E N T R A L I Z AT I O N A N D G O V E R N A N C E O F H E A LT H C A R E I N T H E C Z E C H R E P U B L I C I N T H E 1 9 9 0 S
• health insurance funds (for the first period, a single fund with district
branches was intended)
• professional organizations (medical, dental, pharmaceutical) and other
bodies representing providers (e.g. hospital or GP associations).
2. Changes in the structure and organization of health services15
• dissolution of RINHs and DINHs
• legal and economic autonomy for individual health facilities, hitherto
components of RINHs and DINHs
• formation of a territorial network of health facilities.
3. Changes in financing
• changes to budgetary rules of health facilities (a necessary measure with
regard to their autonomy)
• establishing a multi-resource system of financing
• introduction of compulsory (social) health insurance.
4. Changes in property structure
• transfer of partial ownership of health facilities to communities and mu-
nicipalities
• partial privatization, particularly in ambulatory services, pharmacies, techni-
cal services, etc.
• establishing rules for the foundation of new facilities in the non-state
sector.
5. Changes in professional education
• introduction of new curricula with regard to these priorities: professional
training for primary healthcare, attention to health promotion, preven-
tion and rehabilitation, knowledge and skills in humanitarian sciences and
psychosocial disciplines, modern management, ability to use information,
language skills
• ending monopolies of postgraduate studies (i.e. programs to be run by
universities rather than the MoH institutes).
As for the timetable, all these changes were planned for two years only (1991 and
1992) and all crucial steps were actually implemented in this period. The reform of the
healthcare system was later seen as a “big bang” with a subsequent period of stabilization.
This was already reflected in the Yellow Paper: “It will probably take three or four years
before the new system will be stabilized and another three years to be really efficient.
However, the changes cannot be postponed. The basic steps can and must be done in
the next two years” (Potucek et al. 1990).
Prior requirements were that the system in transition would not have to lose its ele-
mentary capability to provide healthcare, and would avoid any threat to the health and
lives of citizens. To minimize risks of rapid changes, measures were planned as follows:
212
D E C E N T R A L I Z AT I O N I N H E A LT H C A R E
• Each reform step was prepared and tested in local and regional pilot projects.
• Information was disseminated to the public with the aim of building consensus.
• Implementation of prepared steps was to be carried out without hesitation, as
any delay would increase discontent and decrease confidence both of citizens
and health workers.
• Special interest groups cooperated in order to prevent negative tendencies and
enforcement of partial interests.
• Existing institutions were not abolished unless and until their necessary func-
tions could be ensured otherwise.
• Working and living condition of health workers were improved, and their train-
ing and democratic participation in the new system was assured, thus preventing
emigration or departure from the health sector.
With arguments, excitement, and problems, but also spontaneous activity and
collaboration among major parts of the health sector, the 1990 reform scenario was
fulfilled and the new system was roughly completed by 1993.
The first round of the reform: 1990–1994
In a short period of time, the former Soviet system of healthcare (the “Semashko
model”) was replaced by a European pluralist model based on social health insurance
and public-private cooperation in provision (the “neo-Bismarckian model”).16
A. New institutions and organizations were established that participated in the
development and implementation of health policy. The General Health Insur-
ance Fund (GHIF) was established, and, after it, another 26 health insurance
funds appeared in the field. Professional organizations were created by law
(a Chamber of Physicians, Chamber of Dentists, and Chamber of Pharmacists).
Simultaneously, other influential associations of different health service provid-
ers (general practitioners, ambulatory specialists, hospitals, home care centers,
etc.) emerged. Regional and District Institutes of National Health (RINHs
and DINHs) were abolished, and numerous healthcare facilities obtained their
economic and legal autonomy.
B. The state guarantees health services particularly through the health departments
of the district authorities. These departments are headed by district health of-
ficers.
C. De-monopolization and decentralization was introduced, and many health
service providers were privatized, especially in the ambulatory sector.
D. Provision of healthcare was separated from financing. Obligatory health insur-
ance was fully implemented in 1993. Health insurance funds remunerated
providers on a fee-for-service principle. Some investments in hospitals, a part of
the emergency health services and hygienic services were financed by the state
budget (partially through district authorities).

213
D E C E N T R A L I Z AT I O N A N D G O V E R N A N C E O F H E A LT H C A R E I N T H E C Z E C H R E P U B L I C I N T H E 1 9 9 0 S
E. Citizens could freely choose physicians, hospitals, and health insurance funds.
The state guaranteed equal access to a relatively broad range of health services
to every citizen.
F. In 1993, the government accepted the National Health Program as the basic docu-
ment for further development of health promotion and primary prevention.
Reforms happened quickly after its infancy, and with relative success, although it
was not entirely in conformity with the original intention. The proposed multi-source
financing was not sufficiently developed: the greater part of healthcare expenditures were
still covered by insurance contributions and community shares are still relatively small.
Primary care has not been fully appreciated and has been less utilized and funded than
in Western Europe. On the contrary, the cost of expensive, specialized ambulatory care
and hospital care has become increasingly disproportional.
After 1992, there was a strong effort to privatize a maximum number of health
facilities, including hospitals. Nevertheless, the intention to privatize hospitals was also
unsuccessful. Regulatory measures were not applied quickly enough and the numbers
of critical-care beds were not sufficiently reduced. Most large and university hospitals
fell into serious economic difficulties.
Many problems could have been and were foreseen; however, they were not prevented
in time. Since the first government paper on healthcare reform was submitted in 1990
(the application of which should have ended in 1993) no other comprehensive study
was developed that would define targets for Czech healthcare and/or include a program
for implementation – until recently. Therefore, the new healthcare system represented a
set of partial, sometimes contradictory intentions rather than a gradually implemented
conception. Although simplified, organizational charts 2 and 4 in the appendix give an
idea of post-reform healthcare provision and financing.
The second round of reforms: 1995–1997
Instead of stabilizing, the new system encountered many serious problems in the
mid-1990s. They were caused by several factors:
1. A high number of health funds competed against each other and with the
GHIF—many of these small or medium funds came soon to the verge of col-
lapse, which transferred financial difficulties to healthcare providers.
2. The open-ended, fee-for-service remuneration scheme, which motivated provid-
ers to overproduce services, stimulated supply-induced demand and drained
insurance funds.
3. Spending for new medical technology and drugs was excessive.
4. Privatization costs were covered by health insurance.
5. Oversupply and redundancy of services in secondary care (both ambulatory
and bed care).

214
D E C E N T R A L I Z AT I O N I N H E A LT H C A R E
Financial crisis in the health sector stimulated an initiative by the government. In
December 1995, the MoH launched a new program with measures and steps for the
short-, mid-, and long-term horizons. The objectives were as follows:
1. Short-term: use administrative measures to stop spiraling costs.
2. Mid-term:
• Implement cost containment mechanisms through contracts between health
funds and providers.
• Change the remuneration scheme: implement capitation payments for GPs
and service-based functional budgets for hospitals, while FFS was to be kept
only for ambulatory specialists.
• Define the “gate-keeping” position of GPs, and limit free access to secondary
care (e.g. with a by-pass fee).
• Limit the guaranteed package of care; form a space for additional (private)
insurance; introduce more co-payments.
• Rationalize the network of health funds (i.e. decrease their number).
• Stimulate the “sleeping” privatization of hospitals.
• Rationalize the network of hospitals (i.e. decrease their number and number
of beds).17
• Launch a program of quality assurance.
3. Long-term:
• Continue to change remuneration schemes and implement a case-based
payment for hospitals and ambulatory specialists.
• Transfer payment of insurance contributions for people without income
from the state to the respective individual (if possible by increasing social
benefits and pensions) or employed family members.
• Change the system of social health insurance (several alternatives were
offered: a variety of insurance plans, optional private insurance, medical
savings accounts, pre-paid care, or coexistence of all these models).
In the next two years (1996–1997) the government succeeded in stopping spiraling
costs and implementing—at least initiating—other planned steps: cost containment
measures through contracts between health funds and providers; changes in the remu-
neration scheme, and program of quality assurance. Also many collapsing health funds
were closed. However, the whole reform project remained incomplete and then was
stalled completely by the political crisis in the fall of 1997.
Looking back, the practical impact of the second round of reforms in the health
sector was more in financial stabilization than innovative steps. After the 1998 parli-
amentary elections, the reform objectives, proposals, and ideas were abandoned, with
of the quality assurance program the only exception. The next push for reform was not
expected until the reform of public administration in 2003 (see section 3.3).

215
D E C E N T R A L I Z AT I O N A N D G O V E R N A N C E O F H E A LT H C A R E I N T H E C Z E C H R E P U B L I C I N T H E 1 9 9 0 S
3.3 Redistribution of Powers and Responsibilities in Decision Making and Administration: Administrative Decentralization, Devolution, Delegation, and Providers’ Autonomy
Redistribution of powers and responsibilities was a substantial feature of the reform
process in the health sector. The general trend of decentralization in a broader sense is
specified here according to the following definitions:18
Administrative decentralization (de-concentration): decision making is transferred to
a lower administrative level. The rationale for this type of decentralization is that the
need for central administrative bodies can be reduced and local innovations can be easily
implemented. The expected effect is increased effectiveness due to a frontline approach
to problems and opportunities.
Devolution (political decentralization): decision making is transferred to a lower
political level. Devolution brings about more local decision-making power; therefore it
can facilitate local innovations.
Delegation: tasks are allocated to other actors, with the potential advantage of faster
implementation and greater productivity.
Privatization: tasks are transferred from public to private ownership in order to
make activities free from political (or administrative) dependence, more flexible and
innovative. On this type of decentralization see more in section 3.5.
3.3.1 Administrative Decentralization (De-concentration)
In the first period, the DINHs and RINHs were dissolved and the health facilities ob-
tained a high degree of legal and economic autonomy. The central health administration
was incorporated into the District Authorities (DAs) in the form of health departments
headed by District Health Officers. District Health Officers were not directly managed
by the MoH, but were only under methodological guidance and supervision of the
MoH.19
DAs were charged with assuring the state guarantees in health services and
“adequate healthcare” on their territories. Among other things, they had the competence
to approve foundation of and register new health facilities.
Nevertheless, the real executive, controlling, and financial power of the DAs in
healthcare issues was rather vague, and limited by the high degree of autonomy of
providers and health insurance funds (HIFs). DAs appointed directors of district
hospitals and of other facilities belonging to the state network, and they could allocate
some resources to them from the district budget (e.g. for investment). DAs were also
responsible for organizing First Aid Medical Care. In the area of contracting services,
DAs were empowered (by the 1997 Act on Public Health Insurance) to proclaim and

216
D E C E N T R A L I Z AT I O N I N H E A LT H C A R E
conduct tenders for contractual partners of HIFs but HIFs were not obliged to respect
the result of these tenders.
Consequent to the reform of public administration, DAs were abolished by
2003.
3.3.2 Devolution (Political Decentralization)
The 1990 reform draft put a great emphasis on devolution to self-governing communi-
ties and towns (see sections 2.5 and 3.1). This reform objective was subsequently almost
completely abandoned, and devolution has come back onto the agenda only after a
decade, with the reform of public administration.
There were two important steps:
1. The formation of regions (13 in the country + the capital city of Prague as a
special region)—in principle self-governing territories with elected assemblies
and councils, but also performing tasks decentralized from the central admin-
istration (by 2001).
2. The abolition of district administrations and authorities (by 2003) which meant
the transfer of competencies from 76 district authorities to 205 “commissioned
communities” (usually the 76 former district towns and another 129 smaller
towns) but also upwards to Regional Authorities (RAs)20 (see section 1.1 as well
as Chart 7 in the appendix.).
While the reform of public administration deeply affected many areas of public
life, its impact on the health sector was insubstantial, particularly in terms of decen-
tralization. As part of the first step, six health facilities (two big hospitals and four
smaller institutions) were transferred from the MoH to respective RAs. However, after
abolishing district administration, another seven health facilities (all larger mental
hospitals) were transferred to the MoH.21 All district and smaller hospitals and other
health facilities administered by DAs (1,100 in total) were transferred to RAs along with
other competencies in healthcare (see Charts 4 and 5 in the appendix). Communities
and municipalities were not empowered again, and overall the process has seen more
re-centralization than decentralization.
A double role and double competence for regional authorities (self-governing as
well as “transferred” in the sense of decentralized central administration) has compli-
cated the health sector. Hospitals are owned and run by regional authorities through
self-governments,22 while competencies for registration of non-state facilities, tender-
ing contracts with HIFs, and other duties were transferred (see Charts 5 and 7 in the
appendix). This double model of public administration existed in the city of Prague for
a long time, and may prove viable in the new regions as well.

217
D E C E N T R A L I Z AT I O N A N D G O V E R N A N C E O F H E A LT H C A R E I N T H E C Z E C H R E P U B L I C I N T H E 1 9 9 0 S
3.3.3 Delegation
As for delegation, there were three substantial steps launched just in the early years of
the reform (1991–1992) linked with the abolition of the state monopoly in the health
sector (see also sections 2.5 and 3.1).
1. Delegation of Professional Control Over the Medical Profession
and Quality Assurance in General
Professional chambers (of physicians, dentists, and pharmacists) were established by
the law in 1991. The chambers are mandated to support and control their respective
“independent professions.” They are expected to guarantee quality of healthcare through
enforcing professional standards for doctors and pharmacists; they grant licenses neces-
sary for the registration of healthcare facilities with the public administration, and they
address complaints from patients. Membership in these chambers is obligatory even for
professionals employed by state/public services.
Other health professions (nurses, psychologists, rehabilitation workers, etc.) are not
“independent” in the sense of chamber legislation but they play a similar role in profes-
sional issues as “advisors” to public administration. Major associations of providers (of
hospitals, GPs, and independent doctors contracted by HIFs) are by law involved in
central negotiation processes among HIFs, providers, and the state. The Czech Medical
Association (an umbrella organization for medical chambers) in cooperation with the
Czech Medical Chamber, has been developing standards and guidelines for diagnostic
and therapeutic procedures since 1997.
Delegation of professional control has been only partial, as the state is perceived
by the public (and desires to be perceived) as the ultimate guarantee of quality care.
Therefore some delegation and consequent responsibilities have been matters of debate.
Particularly, the Czech Medical Chamber has presented itself as a strong partner to the
state.
2. Delegation of Healthcare Financing
The state founded the GHIF in 1992, but 26 other branch or regional health insurance
funds were are also operating there in the health sectors. Due to financial instability,
their number decreased to 11 in 1997 and 8 in 2003. Patients are free to choose each of
them, as HIFs have to be open to everybody without limitation to any special branch or
territory. All HIFs are obliged to provide the same coverage under the same conditions
as guaranteed by the GHIF. They have the right (not the duty) to contract providers.
Delegation of financing has not been total (some share of state and local budgets
is in capital investment) but very substantial. HIFs administer a high proportion of
health expenditures—namely the GHIF as a major fund (covering 70–75 percent of
the population) has been in some sense more powerful than the government.

218
D E C E N T R A L I Z AT I O N I N H E A LT H C A R E
3. Delegation of Healthcare Provision
The 1992 Act on Non-public Provision of Healthcare abolished the long term state
monopoly, opening doors for providers in private, communal/municipal, church, or
NGO sectors.23 This delegation was a key act in the whole reform facilitating the way
to the pluralistic system. More about it also in the next section.
3.3.4 Functional Decentralization and Providers´ Autonomy
Functional decentralization in the system of care provision began (in 1991, i.e. at a very
early stage of the reform process) as a decomposition of the former RINHs and DINHs.
This did not mean only administrative abolition of RINHs and DINHs and autonomy
for hospitals with polyclinics. Particularly polyclinics were often deconstructed into
autonomous practices that were later privatized.
The delegation of healthcare provision mentioned above (often called “privatizati-
on of provision”) and also the delegation of financing, which separated financing and
delivery of healthcare, contributed substantially to the processes of functional decent-
ralization in the system of care provision and formation of the network of autonomous
health facilities.
Also, many physicians established private practices outside the former polyclinics.
All independent providers work under contracts with health insurance funds. “Private”
in this sense thus means “private provision with public financing.”
The total (rounded) number of health facilities increased in 1995 to 23,800. There
were 1,300 state-owned, mostly bed-care facilities, from which 220 were run by the
MoH and 1,100 by the DAs. Of the 22,500 non-state health facilities, 500 belonged to
municipalities and 22,000 were private, 17,000 of the latter were single doctor practices.
This has not changed significantly since that time.
3.4 Major Players’ and Stakeholders’ Roles, Interests, Contributions, and Mutual Cooperation
3.4.1 Major Players and Stakeholders in the New System of Healthcare
—their Roles, Interests, and Contributions
1. The Ministry of Health
In the new system of healthcare designed in 1990, the MoH was not expected to play a
dominant role. As mentioned elsewhere, after decades of strong state control, there was a
219
D E C E N T R A L I Z AT I O N A N D G O V E R N A N C E O F H E A LT H C A R E I N T H E C Z E C H R E P U B L I C I N T H E 1 9 9 0 S
general tendency rather to diminish the role of the government and its ministries. In the
health sector itself, the vision of a pluralistic system did not allow the MoH any role in
health policy greater than that of one partner among many. Of course, the MoH ought
to have an unavoidable role in the legislative process and it was also expected to be an
institutional leader of reforms, but more in the sense of coordination than of directive
management. Its role in direct administration was expected to be marginal.
The following should illustrate the development from vision to reality: After abolish-
ing the regional administration in 1990, the MoH administers about 220 institutions,
i.e. much more than before (see also section 3.3). This burden, together with new
administrative agendas (privatization, control over HIFs), lack of expert capacity (and,
in some periods, even a reluctance to listen to expert opinion), political discontinuity,
and other factors contributed to the difficulties for the MoH in finding its appropriate
position in the new system.24 Often it failed both in its role in the legislative process
and as an institutional reform leader. On the other side, in spite of being problematic
and unpopular,25 the MoH was able to resolve several critical situations (spiraling costs,
medical strikes, etc.) and, if necessary, to act as an ultimate guarantee of accessibility
and quality of care for the public.
2. The General Health Insurance Fund
The GHIF was established by the 1991 GHIF Act. Due to its dominant position among
other HIFs,26 the GHIF had real financial and political power, but often acted as an
opponent to the MoH in political struggles. This was particularly obvious in the period
of 1993–1995, when the GHIF was reluctant to share data with the MoH or imple-
ment cost containment measures recommended by the MoH; on the other hand, MoH
policy often ignored the GHIF. In the first several years of its existence, the GHIF was
predominantly occupied by developing its organizational structure (about 100 district-
and sub-district branches) and its information system, and it behaved more as a passive
financier of services than as a prudent purchaser. This changed in 1996, and since that
time the GHIF has been managing its finances and its contractual policy cautiously. The
major contribution of the GHIF is in maintaining the financial stability of the health
insurance system and insurance-funded services: in spite of serious difficulties from
1995 to 1997, the system never came to such an imbalance that it would jeopardize
the health needs of the public.
3) Professional chambers
Professional chambers (of physicians, dentists, and pharmacists) were established by the
1991 Chamber Act. The act itself was a matter of discussion between the government
and Parliament.27 The government took issue with the law because it attributed power
to the chambers without clear responsibility. Also, obligatory membership in chambers
even for professionals employed by the state or public services violated government

220
D E C E N T R A L I Z AT I O N I N H E A LT H C A R E
policy. However, Parliament, with the “white coat“ lobby behind it, voted in favor of
the law, leading to lasting tension between chambers and the government. Chambers
were mandated to perform professional control over the “independent” professions—to
guarantee quality of healthcare through appropriate professional standards for doctors
and pharmacists, and to provide licensing for the registration of non-state facilities and
single practices. With the exception of the latter, the professional responsibility of the
chambers did not become visible or transparent until much later. Instead, chambers were
active in advocacy of professional interests, often behaving as a kind of trade union. A
decade passed before the mandate for professional control and quality guarantees were
fulfilled (see charts 4 and 5 in the appendix).
4) Independent providers and their representation
The high degree of provider autonomy and the abolition of the state monopoly in care
provision also determined the position and power of independent providers and their
representatives. Major association of providers (of hospitals, GPs, and independent
doctors contracted by HIFs) together with professional chambers, formed a strong
lobby, which often played a dominant role in the health sector. The pressure for special
interests28 was involved in reform implementation, backing some steps and blocking
others. The fee-for-service remuneration system, the Chamber Act, and privatization
were pushed ahead, while cost containment measures, budget capping, contractual vol-
ume limits, rationalizing of services, and attempts to implement state quality standards
were blocked and rejected.
5) Consumer representation
The idea of more room for “consumer voice and choice,”29 met with many misunder-
standings. Medical chambers usually declared that they were speaking and acting on
behalf of patients. The involvement of the public in HIF boards and hospital advisory
bodies was rather symbolical. Initial reform ideas of “health councils” and an important
role for local communities in the healthcare system were abandoned. As in other sec-
tors, there was no political support for any form of a direct democracy, and the opinion
that citizens ought to assert their interests only through elected political representation
prevailed.
It was many years before a consumer association was established, and when it was,
it was rather militant for a time, blocking and criticizing many reasonable measures
as attacks on consumer rights and claims. The legal platform for consumer advocacy
was given as late as 1997 by the new health insurance law—consumer representation
then became a partner in the central negotiation process among HIFs, providers, and
the state.

221
D E C E N T R A L I Z AT I O N A N D G O V E R N A N C E O F H E A LT H C A R E I N T H E C Z E C H R E P U B L I C I N T H E 1 9 9 0 S
3.4.2 An Overview of Pluralistic Decision Making
(Representation in HIF Boards, the Central Negotiation Process, etc.,
As Legislated by the 1997 Health Insurance Act)30
To illustrate previous the previous section, here is an overview of pluralistic decision
making in practice: (1) composition of boards of health insurance funds, (2) partners in
negotiation about guaranteed basic services and prices, (3) partners in the mechanism
relevant for the elementary network of services and facilities.
1. HIF Boards (see Charts 4 and 5 in the appendix)
a) Central board of the GHIF
• one third: representatives of the government delegated by the MoH, the
Ministry of Labor and Social Affairs (MLSA), and the Ministry of Finance
(MoF)
• one third: representatives of employers, nominated by representative organi-
zations (e.g. the Industrial Chamber of the Union of Trade and Industry
[ICUTI]) and approved by Parliament
• one third: representatives of employees and other insured parties, approved
by Parliament.
b) Local (district, regional) boards of the GHIF
• one half: representatives of employers, nominated by ICUTI
• one half: representatives of employees and other insured parties, approved
by the District Assembly before 2000 and the Regional Assembly after 2000
(representation of public administration is missing at this level).
c) Boards of other HIFs (branch or regional)
• one third: representatives of the government delegated by the MoH, MLSA,
MoF
• one third: representatives of employers, nominated by ICUTI and approved
by Parliament
• one third: representatives of employees and other insured parties, approved
by Parliament.
2. Central negotiation mechanisms
a) Negotiation on the list of items of care (list of procedures):
The list is an essential document for two reasons:
• It includes a precise itemization of guaranteed basic services, which the law
defines only generally.
• It describes conditions for providers for individual items of care, and at-
tributes to each item its value in “points,” which determine remuneration.

222
D E C E N T R A L I Z AT I O N I N H E A LT H C A R E
b) Negotiation partners:
• The GHIF and other HIFs
• professional chambers
• associations of providers (hospitals, GPs, contracted doctors)
• scientific societies (usually branches of the Czech Medical Association)
• associations of the insured (consumer representation—new in 1997).
The MoH itself is not involved in the negotiation process, but it has to review
the results from the viewpoint of legal aptness and public benefit, before it is
officially published.
3) Public tenders for care provision
Public tenders for care provision did not exist before 1997. They were im-
plemented in order to improve the contractual policy of HIFs, to encourage
transparency, and promote public control. Public tenders were intended as a
tool for maintaining and regulating an elementary network of health facilities.
In general, tenders for hospital care are issued by the MoH, tenders for ambula-
tory care by the district before 2000 and the regional authorities after 2000 (see
also chart 4 in the appendix).
Members of the tender commission are as follows:
• a delegate of the MoH or the respective regional authority
• a delegate of the respective professional chamber
• a delegate of the respective HIF
• an expert in the kind of healthcare in question.
Local community and consumer representation have no place in the commission
even if the subject of tender is closely linked to local needs. Moreover, the impact of a
tender can be only symbolic, as HIFs have contractual freedom and are not obliged to
respect the result of the tender.
3.5 Privatization of Provision and Redistribution of Healthcare Infrastructure Property
The 1992 Act on Non-state Provision of Healthcare abolished the state monopoly on
care provision, opening doors for providers in private, communal/municipal, church, or
NGO sectors. Delegation of care provision was a key act in the reform process (see also
section 3.3). In fact, it facilitated provision in the private sector (which has developed
extensively in ambulatory care) while providers in other sectors (communal/municipal,
church, or NGO) have remained marginal. This makes “privatization” an adequate term
for the process.

223
D E C E N T R A L I Z AT I O N A N D G O V E R N A N C E O F H E A LT H C A R E I N T H E C Z E C H R E P U B L I C I N T H E 1 9 9 0 S
Privatization of provision was promoted by separating care delivery from care financ-
ing, and by contractual competencies of new HIFs. The great majority of independent
providers were working under contract with health insurance funds. “Privatization” in
this sense meant development of “private provision–public financing” (Barr 2004).
Privatization of provision followed soon after the decomposition of the former
RINHs and DINHs. This did not mean only administrative abolition of RINHs and
DINHs and autonomy for hospitals with polyclinics. Particularly polyclinics were often
decomposed to single practices that were later privatized. Private contractual doctors
rented rooms in former polyclinic buildings usually transferred to communities or
towns or still state-owned.
Privatizing a building, which was then rented by a group of doctors or another party,
was another method of privatizing ambulatory care.
Physicians who lacked necessary capital to open new practices, rented equipment
from the polyclinics where they had worked previously.
Other than these forms of privatization based on former polyclinics, many physicians
established private practices in rooms rented elsewhere or even in their family houses.
At present, the majority of primary care providers (95 percent) and ambulatory spe-
cialists (74 percent) are private in the sense mentioned above (private provision–public
financing31). Single practices are a dominant form of private care delivery in the am-
bulatory sector. Joint or group practices, centers with a group of closely collaborating
private doctors, or even private centers employing doctors and other medical personnel
are rather exceptional. At present 26 percent of (mostly highly) specialized ambulatory
care is delivered in state, regional, and municipal facilities, mostly hospitals.
After 1992, there was also a strong political effort to privatize hospitals. Neverthe-
less, it has been unsuccessful. Hospital privatization met with serious political as well
as financial obstacles. There are only about 10 small, private, church- or NGO-owned
hospitals in the country with less than 2000 beds (3 percent of total capacity). Debts
and lack of municipal finances for capital investment were the main reasons that mu-
nicipalities were not eager to take over hospitals on their territory, even free of charge.
At present, only 29 (14 percent) of towns and municipal hospitals with 5,700 beds
(8.5 percent) (see also Table 3.9.1. on page 48 and Chart 6 in the Appendix). After
the Social Democrats came to power in 1998, the intention to privatize hospitals was
abandoned. Thus, the major changes in property ownership in the hospital sector were
mere administrative measures in the recent reform of public administration, when
hospitals were transferred from abolished districts to regions.
Pharmacies and health resorts are predominantly private. The pharmaceutical
industry was privatized during the 1990s, and market mechanisms control supply and
demand.

224
D E C E N T R A L I Z AT I O N I N H E A LT H C A R E
3.6 Changes in the Funding System; the Introduction of Social Health Insurance; Multi-source Financing; the Role of the State; Communities, Municipalities, and Other Customers
3.6.1 Economic Performance and Health Expenditure
The level of financial resources allocated to health depends to a large extent on the eco-
nomic performance of the country. It is important, then, to know that the economic
performance of the Czech Republic is relatively high in comparison with other post-
communist countries, but it is still substantially lower than the performance of other
EU countries. During economic transformations, gross domestic product decreased and
gradually regained its original level only in 2000 (Table 4). However, one must consider
the changing quality and structure of the GDP. Economic analysts and politicians are
now admitting that the Czech economy will not reach “Western” levels in the short
period optimistically expected in 1989. The economy has remained burdened for longer
than other transition countries with a large number of poorly performing enterprises,
kept alive by soft loans from state-dominated banks (OECD 2003).
Existing difficulties in the national economy undoubtedly affect the whole health
sector. This means that resources allocated to health will be not sufficient to finance
higher (i.e. West European) quality health services. The health system has faced the task
of maintaining complex and quality healthcare amidst a worsening economic situation.
In spite of that, the quality of service improved without threatening equity. The health
system was under-funded during communism, which changed in 1993 with the introdu-
ction of health insurance. From that year on, the growth of health expenditures is more
or less in line with the economic development of the country. Health expenditures have
reached common European proportions (7–8 percent of GDP—see Table 4). Public
health expenditures as expressed in statistics do not include health expenditures outside
the health sector (e.g. military); therefore the real numbers may be slightly higher. Private
payments are seen as a complementary resource, not reaching 10 percent of total health
expenditures. Private insurance has been insignificant.
Until 1992 health services were financed from the state budget (see Chart 1 in
the appendix). Health budgets were determined centrally and distributed downwards
through the administrative hierarchy with its political priorities. Entitlement was based
on citizenship with minimal cost-sharing. The system was equitable, but obsolete by
Western standards, with low responsiveness and low efficiency. The introduction of
health insurance was a main part of the radical transformation of the health system.
Illness benefits are not paid by health insurance funds and employers, as in Germany,
but from social security, which is also responsible for pensions, unemployment benefits,
and other social benefits. Contributions and expenditures are part of the state budget.

225
D E C E N T R A L I Z AT I O N A N D G O V E R N A N C E O F H E A LT H C A R E I N T H E C Z E C H R E P U B L I C I N T H E 1 9 9 0 S
Social insurance totals 34 percent of wages (26 percent paid by employers). Illness ins-
urance contributions, part of social insurance, are 4.4 percent of wages.
Illness and health insurance are two separate systems—a fact often criticized. Illness
insurance is the only social insurance in the country, which is not compulsory for the
entire population. The self-employed may opt out and consequently not receive benefits
during illness (see Charts 2 and 3 in the appendix).
There are also some differences between employees and the self-employed regarding
health insurance contributions. The self-employed are still a matter of some confusion
to public administration in general (see Table 4).

226
D E C E N T R A L I Z AT I O N I N H E A LT H C A R E
Tab
le 4
.
GD
P a
nd
Hea
lth
Exp
end
itu
re, 1990–2002
Year
19
90
19
91
19
92
19
93
19
94
19
95
19
96
19
97
19
98
19
99
20
00
20
01
20
02
GD
P : c
urr
ent
pri
ces
(1990–100)
100
120.4
134.6
162.9
188.9
220.5
250.2
268.3
293.4
303.8
317.0
347.4
363.4
GD
P : c
on
stan
t p
rice
s (1
990–100)
100
88.4
87.9
88.0
89.9
95.3
99.4
98.9
97.6
98.0
101.2
104.4
106.4
GD
P p
er c
apit
a bas
ed o
n e
xch
ange
rat
e in
US$
3,3
67
2,4
79
2,8
86
3,3
87
3,9
76
5,0
35
5,5
97
5,1
42
5,5
29
5,3
05
4,9
43
5,5
48
6,8
22
GD
P p
er c
apit
a in
pu
rch
asin
g p
ow
er p
arit
y
in U
S$
11,2
62
10,3
70
10,8
75
10,8
06
11,2
69
12,2
05
12,9
95
13,1
61
13,1
75
13,5
53
14,2
77
15,1
94
15,8
13
Infl
atio
n9
.85
6.6
11
.12
0.8
10
.09
.18
.88
.51
0.7
2.1
3.9
4.7
1.8
Tota
l h
ealt
h e
xpen
dit
ure
s (1
bil
lion
CZ
K)
31.3
39.5
45.6
73.1
86.4
100.7
110.7
118.9
129.9
134.9
142.1
158.8
163.9
Tota
l h
ealt
h e
xpen
dit
ure
s (a
s %
of
GD
P)
4.9
95.2
45.4
27.1
67.3
17.2
97.0
67.0
87.0
77.1
57.2
57.4
07.4
Tota
l h
ealt
h e
xpen
dit
ure
s in
PP
P p
er c
apit
a
in U
S$
562
543
589
774
824
890
917
932
931
969
1 0
35
1 1
24
1 1
70
Pu
bli
c h
ealt
h e
xpen
dit
ure
per
cap
ita
in U
S$
540
525
562
734
790
825
848
855
856
887
945
1 0
26
1055
Pu
bli
c h
ealt
h e
xpen
dit
ure
as
% o
f to
tal h
ealt
h e
xpen
dit
ure
96.2
96.7
95.5
94.8
95.9
92.7
92.5
91.7
91.9
91.5
91.3
91.2
90.2
Tota
l in
-pat
ien
t ex
pen
dit
ure
as
% o
f to
tal h
ealt
h
exp
end
itu
re
na
na
na
na
na
29.6
33.8
35.6
35.4
33.9
34.6
36.6
39.3
Tota
l p
har
mac
euti
cal ex
pen
dit
ure
as
% o
f to
tal
hea
lth
exp
end
itu
re
21.0
18.4
21.1
19.4
24.7
25.6
25.5
25.3
25.5
23.0
23.0
24.0
324.6
Sal
arie
s as
% o
f to
tal h
ealt
h e
xpen
dit
ure
na
na
na
na
17.4
16.9
17.8
17.6
17.2
18.5
19.2
20.0
21.4
Pu
bli
c bu
dge
ts (
%)
96.2
96.7
24.3
17.8
16.0
15.0
11.4
9.6
9.1
9.7
9.6
8.6
8.7
Hea
lth
in
sura
nce
fu
nd
s (%
)0.0
0.0
71.2
77.0
77.9
77.7
81.1
82.1
82.8
81.8
81.7
82.6
81.5
Pri
vate
Exp
end
itu
res
(%)
3.8
3.3
4.6
5.2
6.1
7.3
7.5
8.3
8.2
8.5
8.6
8.6
8.3
Sourc
e:
The
Dev
elop
men
t of
Fin
anci
al I
nd
icat
ors
of
Eco
nom
y an
d H
ealt
h S
yste
m u
nti
l 2001, IH
IS a
fter
; d
ata
from
2002 a
re e
stim
ates
.

227
D E C E N T R A L I Z AT I O N A N D G O V E R N A N C E O F H E A LT H C A R E I N T H E C Z E C H R E P U B L I C I N T H E 1 9 9 0 S
3.6.2 General Characteristics of Public Health Insurance
The government, already in 1990, approved the draft of the new healthcare system in the
hope that it was possible to quickly overcome the shortcomings of the previous system.
The government, therefore, decided very shortly after the fall of the communist regime
to move the state-financed system towards a system based on obligatory health insur-
ance. Transformation from a tax-financed system to health insurance was accelerated
by pressure from health professionals, who expected improvements in their incomes.
The GHI financed health services after 1992, but in that year the fund received money
from transfer from state budget, not from insurance contributions. The public health
insurance scheme was introduced fully on January 1, 1993.
There are three types of insured parties according to the type of contribution pay-
ment. For employees, the health insurance contribution is 13.5 percent of pre-tax wages
(see Chart 2 and 3 in the Appendix). The contribution is divided between the employer,
who contributes 9 percent, and employee, who pays 4.5 percent. The second category is
the self-employed, who pay 13.5 percent of 35 percent of their net income before taxa-
tion, with upper and lower limits. For citizens without income (children, pensioners, the
unemployed, women on maternity leave—forming over half the population) the state
budget pays fixed monthly contributions, defined by law as 13.5 percent of the current
minimum wage.32 The whole population is covered by obligatory public health insur-
ance, which assures access to a comprehensive healthcare package (diagnostic procedures,
ambulatory and hospital care including rehabilitation and care for the chronically ill,
prevention, drugs and medical appliances, medical transport services, other prescribed
treatments). Medical care is covered from health insurance funds, while illness benefits
are paid from the state-run social security administration.
Health insurance funds are legally autonomous public organizations, which col-
lect contributions and purchase health services from their contractual providers. The
GHIF was founded with the intention of covering the whole population. In 1992 the
collection of contributions had not yet started, and the GHIF received money from the
state budget. Later that year, Parliament approved an act that allowed the establishment
of other, ‘branch’ health insurance funds. This initiative appealed to the tradition of
plurality of illness insurance funds, abolished by the communist regime. However, the
HIFs formed under this act differ from traditional employer-based funds, because they
are open to everybody and compete with each other. Their number rose surprisingly
quickly during from 1993 to 95. Funds were established by ministries (military, interior)
and large industries (Skoda-Volkswagen, banks, mines). In 1995, there were 27 HIFs
in operation, but this number decreased gradually for financial reasons to only nine
funds in 2003. Citizens have a free choice of insurance funds and can change once a
year. Despite the fact that many members left the GHIF for branch funds, the GHIF
remains the major insurer, covering nearly three-fourths of the population in 2002.

228
D E C E N T R A L I Z AT I O N I N H E A LT H C A R E
3.6.3 Risk Adjustment and Problems of Coverage
In order to prevent risk selection among the insured and to protect funds with high
risks from financial difficulties, insurance contributions are redistributed by a simple
formula. HIFs keep 40 percent of collected contributions, and the other 60 percent along
with all state contributions are subject to redistribution. This risk-adjustment scheme is
simple, with a weighted redistribution dividing insured persons into two age categories:
one share for individuals under 60, and three shares for an individuals 60 and over.
A redistribution scheme of contributions indexed by age and sex has been developed
and proposed, but not approved by Parliament. The GHIF with the highest proportion
of pensioners and lowest income groups benefits most from the redistribution (see
Charts 2 and 3 in the appendix).
Proposals for radical reductions to the healthcare package covered by public health
insurance have not been successful. The introduction of individual “medical saving
accounts,” pushed ahead by former prime minister Vaclav Klaus, did not meet with
broad political acceptance either. It cannot be expected that such radical reform measures
would, even in the future, threaten the financial accessibility of the health services or
disadvantage the poor. Solidarity with the ill and equal access to healthcare are highly
valued in Czech society. Nevertheless, the financial sustainability and over-utilization
of certain services are strong arguments for some regulatory out-of-pocket payments.
The appropriate design of such policies and its political support are not, however, easy
tasks. With improving economic conditions, higher income groups will surely demand
a higher quality of healthcare and more comfortable way of service delivery (private
accommodations, no waiting, etc.). Such demands could be satisfied through improved
performance of the public system, or if not, the space for private medicine has to be
opened.
3.6.4 Development of the Institutional System and Its Relations
to the State
The reality of health insurance in its first years showed that there were serious drawbacks
in the regulation of funds—the naive liberalism of reformers had negative results. Some
insurance funds behaved more like private companies than organizations mandated to
protect public interest. Accountability was vaguely defined, which made it difficult for
state authorities (the MoH and the MoF) to efficiently control use of public resources.
Unrealistic expectations and plans, managerial failures, and missing regulations led to
financial problems with several funds. The funds were abolished, in which case their mem-
bers automatically became members of the GHIF, or merged with financially stronger
funds. The power of the government over the health system increased; one may even

229
D E C E N T R A L I Z AT I O N A N D G O V E R N A N C E O F H E A LT H C A R E I N T H E C Z E C H R E P U B L I C I N T H E 1 9 9 0 S
observe a trend toward re-nationalization of the health system. It should be noted that
governance in Czech funds significantly differs from traditional self-governing systems
of insurance funds in Germany, Austria, or the Netherlands. In the Czech Republic,
the boards of trustees, which consist of representatives of the insured, employers, and
the state, are not elected but appointed. The power of the board is rather weak, and
therefore management accountability may be questioned.
The initial idea was that funds would compete through the spectrum of reimbursed
above-standard services. As insurance contributions are set by law, price competition
is not possible. We may consider this an experiment with a type of managed competi-
tion. At the beginning, the different above-standard services were offered by funds in
competition for new members. Such behavior was necessary for newly established funds
to attract customers initially covered by the GHIF. Later, it became evident that many
funds did not have sufficient resources to cover basic healthcare services. Subsequently, in
1994 reimbursement of above-standard healthcare was prohibited by law, and the space
for competition among funds was narrowed even more by new legislation in 1997. The
plurality of funds has not met expectations, and it would take a new legislative framework
to prove a benefit from it. Currently, many critics do not see the reason for a pluralistic
health insurance system and suggest keeping the GHIF as a single public insurer. The
system of insurance funds is at a crossroads, but who knows which way to go?
3.7 Purchasing and Contractual Policy for Health Funds, Cost Containment Measures, Incentives, Resource Allocation, and Remuneration of Providers
3.7.1 1992–1997
After 1989, the integrated system of national health service was not seen as effective, and
the separation of purchasing and provision functions was introduced. The responsibil-
ity for purchasing lies in the hands of health insurance funds. There are currently nine
health insurance funds. The funds (until mid-1997) reimbursed contractual providers
according to a fee-for-service scheme (the list of health procedures). This list sets the
relative point values of items of services, while monetary values of points were initially set
by individual funds. The point value of an item is calculated according to the estimated
time required to provide the service. With thousands of items, it is an enormous task
to set relative point values without discrepancies. Drugs and medical appliances were
reimbursed according to the price list. With practically no regulation of volume of services
and contracting with all providers, the fee-for-service system caused over-utilization,
redundant medical tests, excessive capacity and cost explosion—unsurprisingly, this led
230
D E C E N T R A L I Z AT I O N I N H E A LT H C A R E
quickly to financial difficulties. Funds decreased the monetary value of points, which
transferred financial problems to providers. In 1996 the GHIF introduced a division of
its budget into separate “chapters” for different types of care (ambulatory care, hospital
care, dental and medical transport, etc.) which became a standard. In July 1997 the
MoH published a new list of health procedures with new corresponding point values.
This list met with criticism both from providers convinced that the new point values
would not cover the real cost of services, and from the funds, which argued that the
collected insurance contributions will not be sufficient to cover the supposed volume
of health services. Finally, the list was rejected and budgets were set.
3.7.2 After 1997
July 1997 saw the beginning of strict regulation and budgeting with the introduction
of the national negotiation framework. Since then, the level of reimbursement has been
negotiated between health insurance funds and organized groups of providers (hospital
associations, unions of physicians, dentists, etc.) Total expenditures are divided among
different sectors. The usual issues are the monetary values of services and the allowed
growth of the expenditure ceiling. Individual funds may offer better reimbursements
than agreed, but not less. GPs are paid by a mixed capitation/fee-for-service system (ap-
proximately 85-90 percent of their income consist of age- and sex-adjusted capitation
payments, the other 10-15 percent is FFS). GPs appear quite satisfied with the capita-
tion system and welcomed its introduction. Ambulatory specialists (AS) are paid by a
FFS scheme with tight total time limits and expenditure ceilings, which for many ASs
means budgeting. Dental services are reimbursed according to a price list. This is the
least regulated sector, as dentists stay only within the total budget for dental services.
This probably stems from the fact that dentists earn a significant part of their incomes
from private payments for above-standard services and dental materials. Reimbursement
for hospital services is based on a simple per-patient charge, with some regard to services
provided. The GHIF ensures that hospitals cannot exceed the income from the previous
year by more than a negotiated percent—a kind of budgeting device. Other funds use
similar strategies; however, the smallest funds usually do not regulate hospitals with a
marginal number of treated enrollees. Outpatient services delivered in hospitals are part
of the hospital budget with the same reimbursement mechanism—per-patient charge
with income ceilings based on the last period and agreed growth. Physicians working in
hospitals are salaried employees. Long-term care institutions are paid per day with total
expenditure ceilings. The reimbursement system may change every half year according
to negotiations. If the negotiation is unsuccessful, as is often the case in the hospital
sector, the government is obliged to set the rules.

231
D E C E N T R A L I Z AT I O N A N D G O V E R N A N C E O F H E A LT H C A R E I N T H E C Z E C H R E P U B L I C I N T H E 1 9 9 0 S
The changes in the reimbursement scheme culminating in July 1997 formed an
essential modification of incentive structure for health providers. The abolishment of the
FFS system halted the tendency to over-utilization. On the contrary, with a more regula-
ted reimbursement scheme, the motivation to minimize the volume and cost of services
emerged. The negative results of budgeting are the rise of waiting lists in hospitals and at
some ASs. This may open the door for corruption, bribery, and under-the-table payment.
In spite of all the consequences mentioned here, there has been evidence that the 1997
measures did not have a negative impact on the health status of the population.
Per-patient payment based on DRG has been planned in hospital services since 1997.
However, the real introduction of a DRG system was postponed every year for six years,
so that expectations for its implementation in the near future have dimmed.
3.7.3 Resource Allocation
The IHIS estimates national health expenditures according to the type of financing
(public/private) and type of service provider (see Table 4). These numbers may be a bit
misleading, as hospitals provide extensive outpatient services, which are hidden in the
chapter on hospital services. The structure of health expenditures and it dynamics are
shown on data from the GHIF, which covers about 70 percent of the population. Many
experts believe that resource allocation is somewhat biased to specialist and hospital
services, whose share of expenditure is growing. Especially, the parallel network of spe-
cialists outside hospitals has been criticized. On the other hand, the share of primary
care is still relatively low, although it has been suggested on many occasions that a shift
towards primary care is needed. The decline in dental expenditures may be attributed
to growth in out-of-pocket payments for these services. Probably the main problem in
resource allocation is the share for pharmaceuticals. Expenditures on pharmaceuticals
increased sharply during economic transition, part explained by the less favorable ex-
change rate for Czech currency. A rapid increase in the 90s is a consequence of large
market liberalization, above all the liberalization of imports from Western countries.
On one hand, this has had many positive effects on mortality and morbidity; on the
other hand, such developments are seen as an important cause of financial problems.
Introduction of the reference price list slowed down drug expenditures but did not
solve the problem. On the provider side, the regulatory capacity of the government and
health insurance funds has not been fully utilized yet. Controversial decisions by the
MoH about reimbursements for certain drugs are regularly questioned by the public.
On the consumer side, a 2003 OECD country review recommended the reduction of
the number of reimbursed drugs, because many reimbursed drugs are usually paid out-
of-pocket in other OECD countries. The current government promised not to increase
co-payments, but under financial constraints it is changing its view.

232
D E C E N T R A L I Z AT I O N I N H E A LT H C A R E
Table 5.
The Structure of Expenditures of the GHIF (%)
Type of Provider 1998 1999 2000 2001
General practitioners 5.0 5.0 5.0 4.9
Dentists 6.2 6.1 5.9 5.6
Other outpatient care 10.3 10.2 10.6 10.3
Hospitals (including outpatient and long-term care) 49.3 49.2 49.3 49.9
Balneology 2.4 2.3 2.2 2.1
Transport and emergency services 1.5 1.7 1.7 1.7
Drugs and medical aids 25.3 24.8 24.2 24.3
Other 1.1 0.7 1.2 1.2
Source: General Health Insurance Fund.
As explained in the previous section, health expenditures of funds are divided among
different providers’ sectors during the negotiation process with providers. This measure
might help contain costs in the short term, but it may become a significant barrier to
shifting resources between providers’ sectors in the long run. Given the power of providers
on one side and the lack of leadership on the regulators side, one might expect resource
allocation policy, once formulated, to be a very painful reform process. Crucial here is
the omission of evidence-based medicine from the resource allocation process.
3.7.4 Health Expenditure and Aging
Health expenditures in developed countries are constantly rising despite cost-contain-
ment efforts. One reason is that health systems face the problem of aging populations.
Dlouhý and Tuckova (2000) predict public healthcare expenditures in the Czech
Republic for the period 1998–2030 by a simple formula: the age structure from the
demographic prognosis of the Czech statistical office is multiplied by specific age-related
expenditures from the GHIF’s annual report. The expected increase in health expendi-
tures due to demographic changes is 6–23 percent, depending on the alternative chosen.
This projection is not as dramatic as it may appear. One percent economic growth per
year will cover such expenditure increase sufficiently. According to a study, the problem
is not thus the fact of an aging population itself, but its possible combination with other
factors, which can expand problems exponentially.

233
D E C E N T R A L I Z AT I O N A N D G O V E R N A N C E O F H E A LT H C A R E I N T H E C Z E C H R E P U B L I C I N T H E 1 9 9 0 S
3.8 Healthcare Financing and Purchasing—Conclusion
The Czech Republic succeeded relatively in deeply reforming the inflexible state system
into a pluralistic health insurance system, albeit with many financial problems. 1990–1996
was the period of major reforms in financing the health system. This period was driven
by ideology, naive radicalism, and insufficient experience with regulation. Since 1997, the
health sector has been more regulated and to some extent stabilized. The health sector
offers better quality and is equitable. Efficiency improvements in healthcare provision are
probably less than expected. What is needed now is a clear vision for the 21st century.
The key recommendations from the OECD (2003) are:
• The excessive capacity of beds and ambulatory specialists has to be reduced.
• Many reimbursed drugs should be paid out-of-pocket. User-fees should be
introduced in a socially acceptable way.
• The private market for non-core activities must be liberalized.
3.9 Changing Patterns of Service Provision
Delivery of curative health services in the CR is shared among providers of primary
healthcare (including home care), specialized ambulatory care, and hospitals. Bed care
comprises specialized therapeutic institutes and spas for adults and children. Hygienic
stations (public health institutes) and pharmacies complete the system of curative care.
The current situation is described by the following table (the structure of healthcare
providers and the motion of patients and desirable referrals between different part of
the system is shown in Chart 6 in the Appendix) (see Table 6).
Patients are free in their choice of physician and a healthcare facility, regardless if
it is a public or private provider. Nevertheless, according to the experience from many
developed countries, the patient should enter the healthcare system through a “gate-
-keeping” GP, but this is not yet ensured by law.
The present network of health facilities is the result of massive decentralization in the
1990s. In the first period (1990–1992), the DINH/RINHs (see chart 1 in the appen-
dix) were dissolved, and health facilities obtained a high degree of legal and economic
autonomy. During the second period (1993–1996) decentralization focused mainly on
ambulatory services. Many polyclinics were divided into individual practices, most of
which were privatized the following year. As well, many physicians established private
offices outside former polyclinics. Today’s structure has not changed significantly.
In the 1960s, the categorization of hospitals into three types was introduced accor-
ding to the capacity and range of specialized wards, however, this hierarchical structure
was abandoned at the very beginning of the reform in 1991. There is at least one hospital
in each district (usually 1–3), and accessibility is considered satisfactory. There may
even be a surplus of beds requiring their reduction (or the reduction of hospitals) or
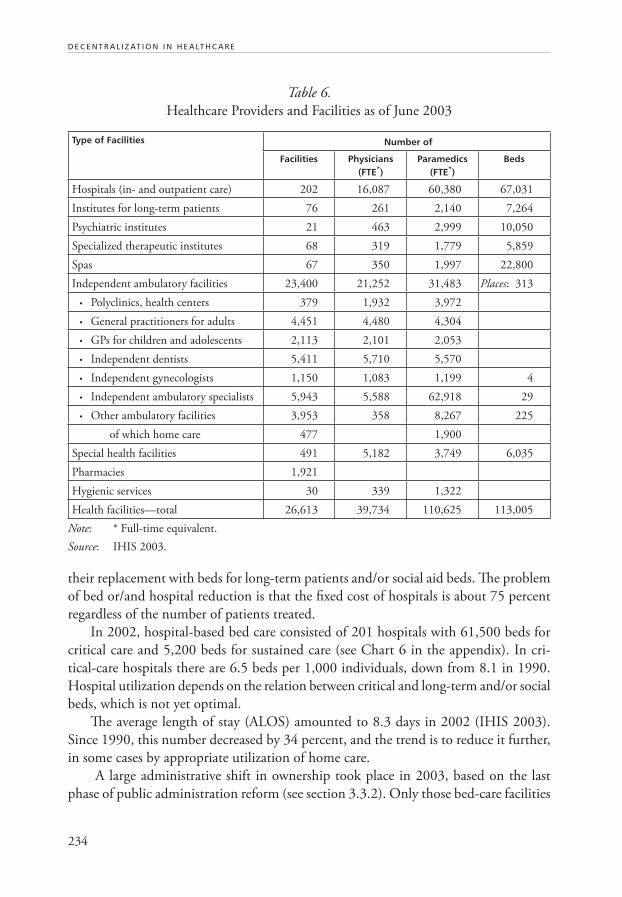
234
D E C E N T R A L I Z AT I O N I N H E A LT H C A R E
their replacement with beds for long-term patients and/or social aid beds. The problem
of bed or/and hospital reduction is that the fixed cost of hospitals is about 75 percent
regardless of the number of patients treated.
In 2002, hospital-based bed care consisted of 201 hospitals with 61,500 beds for
critical care and 5,200 beds for sustained care (see Chart 6 in the appendix). In cri-
tical-care hospitals there are 6.5 beds per 1,000 individuals, down from 8.1 in 1990.
Hospital utilization depends on the relation between critical and long-term and/or social
beds, which is not yet optimal.
The average length of stay (ALOS) amounted to 8.3 days in 2002 (IHIS 2003).
Since 1990, this number decreased by 34 percent, and the trend is to reduce it further,
in some cases by appropriate utilization of home care.
A large administrative shift in ownership took place in 2003, based on the last
phase of public administration reform (see section 3.3.2). Only those bed-care facilities
Table 6.
Healthcare Providers and Facilities as of June 2003
Type of Facilities Number of
Facilities Physicians (FTE*)
Paramedics (FTE*)
Beds
Hospitals (in- and outpatient care) 202 16,087 60,380 67,031
Institutes for long-term patients 76 261 2,140 7,264
Psychiatric institutes 21 463 2,999 10,050
Specialized therapeutic institutes 68 319 1,779 5,859
Spas 67 350 1,997 22,800
Independent ambulatory facilities 23,400 21,252 31,483 Places: 313
• Polyclinics, health centers 379 1,932 3,972
• General practitioners for adults 4,451 4,480 4,304
• GPs for children and adolescents 2,113 2,101 2,053
• Independent dentists 5,411 5,710 5,570
• Independent gynecologists 1,150 1,083 1,199 4
• Independent ambulatory specialists 5,943 5,588 62,918 29
• Other ambulatory facilities 3,953 358 8,267 225
of which home care 477 1,900
Special health facilities 491 5,182 3,749 6,035
Pharmacies 1,921
Hygienic services 30 339 1,322
Health facilities—total 26,613 39,734 110,625 113,005
Note: * Full-time equivalent.
Source: IHIS 2003.
235
D E C E N T R A L I Z AT I O N A N D G O V E R N A N C E O F H E A LT H C A R E I N T H E C Z E C H R E P U B L I C I N T H E 1 9 9 0 S
managed directly by the MoH are considered state owned. Others, belonging to regions,
towns, and municipalities, are regarded as non-state and only the rest, owned by private
persons, churches, NGOs etc., are actually private.
Section 3.5 presented the share of privatized facilities in primary, specialized ambu-
latory, as well as hospital care (in number of beds). In other bed-care facilities, the share
is unbalanced (83 percent of all beds in spas are privatized; none in psychiatric institutes
are none). In institutes for long-term patients the share of privatized beds is 23 percent,
in other specialized therapy institutes the share is 29 percent. Hospice care is exclusively
private (unfortunately there are only 210 beds, run predominantly by churches).
Until 1990, home care in the modern sense was an unknown concept. In the last
ten years, however, home care has developed rapidly. The 450 agencies currently existing
are sufficient to cover the whole territory of the Czech Republic. Autonomous agencies
are able to provide a broad range of services often on behalf of GPs.
In the field of ambulatory care the core segment should be GPs, however patients
prefer ASs to GPs. Healthcare delivery for Czech citizens beyond insurance (by out-of-
-pocket payment) is exceptional; only dentists derive approximately 25 percent of their
income from direct payment from their patients. Economically, this situation is hardly
acceptable, and discussion about other options is ongoing.
3.10 Unintended Consequences of Reform
Ambulatory care is not only sufficient, but clearly exceeds reasonable need. Compared
to developed European countries, the number of patient contacts with ambulatory
doctors is exceedingly high. Czech patients enjoy an average of 14.8 contacts with
ambulatory doctors per year (2.1 with dentists). This frequent contact is mostly with
GPs (5.9 contacts for adults and 7.1 for children). These numbers are at least double the
Western European average. Six contacts with ASs, especially considering that the price
of such a contact is two to ten times higher (according to specialization) than contact
with a GP, are particularly high. Even if the health status of the Czech population is
worse than other developed European countries, these numbers are exaggerated. Most
likely, this is due to the socialist habit of visiting doctors for banal reasons. People are
unaccustomed to treat minor health problems themselves.
On the other hand, FFS payments support the AS efforts to provide the maximum
volume of care: this also explains the high number of ambulatory specialists. In a num-
ber of cases, doctors send patients from one specialist to another in order to increase
specialists’ income (and no doubt, through kickbacks, their own).
The presence of parallel networks for specialized ambulatory care is also problematic.
A private network exists in hospitals, with the same number of doctors. The following
conclusions were drawn:

236
D E C E N T R A L I Z AT I O N I N H E A LT H C A R E
A. The present system disturbs the ordering of patient’s care (“shopping around”).
The central, gate-keeping element of care management—the GP—is absent from
the Czech system. Therefore the system can be risky for patients and quality of
care may decrease.
B. Problems of specialized care and primary care cannot be solved independently.
It is necessary to define competencies and criteria for training and postgradu-
ate education. Bringing the quality of primary care up to Western European
levels would lighten overburdened ASs, who would not have to activate special
know-how and experience in fields treatable at lower levels of the system. With
the help of standards and rules of best practice, it would be useful to establish
GP and AS competencies (see Figure 32 in the appendix).
C. Competing private (out-of hospital) and hospital-based ambulatory care create
other problems. As we see from the experience of several countries, it is possible
to find an acceptable model of cooperation (not competition) on the supply
side. This requires respect for the cultural anchor of national-historic evolution. An
enforced change could lead to unacceptable solutions. As for parallel practices, it
is necessary to establish limits beyond which fruitful cooperation changes into
a heartless struggle for survival. It is also necessary to define clearly, with best
practice standards, what is feasible outside the hospital and what is not.
D. The problem of parallel care would probably be solvable in the frame of a coop-
erative model for hospitals, ASs and GPs. In the interest of better care, hospitals
could facilitate GP and possibly AS access to their patients.
E. The system must be decentralized regarding regions and districts, alongside with
the gradual introduction of a new regional public administration.
F. Insurance funds (especially the GHIF) should clearly set rules for contracting
with ambulatory facilities.
The relevant Czech political forces lack a clear idea about the problems of ambu-
latory care and specialized care. Politicians do not know how to approach and resolve
such issues. Increased awareness is necessary concerning management of the system
and its processes.
3.11 Major Domestic Debates Concerning Healthcare
Debates concerning problems with the healthcare system are professional, political,
and public.
Until 1989 there was limited space for discussions.
Some professional discussions, nevertheless limited by both censorship and self-
censorship, did go on. Published recommendations did not go beyond improving the
existing socialist healthcare system.

237
D E C E N T R A L I Z AT I O N A N D G O V E R N A N C E O F H E A LT H C A R E I N T H E C Z E C H R E P U B L I C I N T H E 1 9 9 0 S
As to the lay public, the regime declared a high level of general satisfaction with
the Czech healthcare system. Public opinion polls were not carried out. The first polls
that baffled this conviction were at the end of 1988, showing that the population was
worried about problems of health and healthcare (as well as the environment). The
results of the polls were published in the press: unimaginable before that.
Debates held by the political representation appeared as late as the second half of the
1980s. Not even the political document of the dissident movement Charter 77 about
healthcare, dating from the end of 80s, stepped out of the frame of the communist
healthcare system. The last communist minister of health ordered an analysis of public
opinion and the positions of medical staff for the first time at the beginning of 1989
(Jaroš, Purkrabek, Sevcik 1989) perhaps under the influence of the first public opinion
poll (in 1988). Professionals, until then not allowed to work in specialized activities,
could for the first time participate in the analysis (results were not published because
of the events connected to the Velvet Revolution).
Even healthcare professionals did not step out of the official scheme, as was shown
by the results of this unpublished analysis, in spite of a rather critical approach towards
the system. The authors defined several organizational insufficiencies and expressed
their dissatisfaction with the low level of respect for the work of medical professionals
(see section 1.4).
The situation changed radically immediately after the Velvet Revolution in No-
vember 1989.
The professional discussions as well as the political decisions of that period were
described in previous sections of this study. From the beginning, cooperation between
decision makers and professionals (researchers) in the field of health economics, policy,
and services has been poor. Political decisions were not usually made on the basis of
professional analyses. There are several reasons for that. Findings must be presented
in a form comprehensible to legislators. Politicians lack the background to grasp the
need for a comprehensive concept of health policy and a vision for its long-term de-
velopment. This concerns not only the highest level of politicians who change from
one election to the next, but also executive officials at all levels of the decision-making
process, including insurance companies. The capacity to deal with professional papers
and groundwork must still be developed. With some exceptions, top decision makers
were unable to formulate a more complex assignment for the professional sphere. The
good use of professional results in recommending policy is uncommon.
The abolition of media censorship has been significant: e.g. the weekly Health
News is read by a broad health public. In the mid-1990s a new health magazine, Czech
healthcare, appeared, which deals with problems in the healthcare system—healthcare
policy, economics, service research, etc. There is a wide spectrum of public activity and
debate on those problems, etc.
A new element has been constituted—public opinion polls—some of which have to
do with healthcare.

238
D E C E N T R A L I Z AT I O N I N H E A LT H C A R E
Trade unions, professional associations, hospitals and, of course, customers—through
insurance funds, especially the public GHIF—play increasingly important roles, though
small compared with their roles in Western nations. All these parties commission or
publish, with varying range and scope, their own analyses.
Materials published by the Ministry of Health are another specific source of in-
formation. Almost all Czech health ministers since 1990 have published some kind of
“concept.” From time to time, both chambers of Parliament ask for studies. Today’s health-
care legislation is a tangible result of debates spawned by this process. Over the last 14
years, the following principal issues have bee discussed (expressed chronologically):
1. The main question in insurance was whether to introduce the neo-Bismarckian
system of obligatory insurance (which could be possibly supplemented by a form
of voluntary insurance) or to adopt and adapt the British system. The tendency
to return to the former Czechoslovak system—from before communism—sug-
gested a system similar to Austria or Holland. The solution was found at the
beginning of 1990. What was lacking in this process was a project of mixing
obligatory and voluntary insurance. The debate was ongoing during the first
half of the 1990s, when the GHIF with its state guarantee and several HIFs
were created. Some bankrupted and were abolished. The present structure of
insurance funds—one + nine—has existed since 1997.
2. Privatization began in mid-1990.33 At first, the question was whether to priva-
tize or not, while in the next period it was rather what and how to privatize.
An agreement was reached that ambulatory services ought to be privatized, and
in subsequent years, a majority were. The neo-Bismarckian model of obliga-
tory insurance made this a natural and logical step. Privatization of hospitals
and other bed facilities, however, was problematic. Difficulties stemmed from
poor access to bank credit and disagreements about the process in general—to
privative activities and properties together or separately? This question has not
been resolved even now, but debate has not had the intensity it had in the first
half of the 1990s. The extent of privatization of different kinds of healthcare
facilities was described in sections 3.5 and 3.9.
3. Remuneration of medical staff—especially doctors—has been a golden thread
the past 14 years. It came out of the underestimation of the value of medical
personnel under the previous system and, of course, compared to developed
countries. During the first two years of transition, debates were related to new
methods of payment (capitation payments, FFS, etc.). The first liberal system,
based on an FFS system, was found inappropriate, and in 1997 it was changed
(to capitation in primary care, combined payments for ambulatory specialists,
budgets in hospitals, etc.). A less than exhaustive debate on waste before and
after the change took place. An official document from the MoH admitted
that—after the implementation of the changes—healthcare was diminished by

239
D E C E N T R A L I Z AT I O N A N D G O V E R N A N C E O F H E A LT H C A R E I N T H E C Z E C H R E P U B L I C I N T H E 1 9 9 0 S
30 percent, without affecting overall health status. At present, when the gover-
nment is seeking ways to reduce public debt, debates aim at setting amounts
of compensation for providers. The main parties in those debates are providers
themselves, their trade unions, the MoH, and insurance funds. There was also
a debate on the problem of doctors’ rights to strike in public healthcare.
4. Reimbursement for services provided from insurance funds is an issue closely
linked to the first. One aspect concerns delaying payments that threaten (par-
ticularly) ambulatory doctors with insolvency. Another aspect is the amount
of payments. Insurance funds complain about considerable debts, paid tar-
dily, which, in sum, amount to a huge amount of money. Insurance funds
consequently delay payments to providers. Hospitals in particular do not pay
suppliers, and this leads to crisis in which (for example) distributors refuse to
supply hospitals with drugs. The system of reimbursement for hospitals has
changed twice; now a system of DRG is being prepared, not without problems
(see Figures 28 and 29 in the appendix).
5. With varying intensity, the issue of patient co-payments has been debated
throughout the period. The beginning of the debate was connected to an alar-
ming finding on the rapid ageing of the population and on a fast increase in the
costs of the provided care. A similar debate was taking place in many OECD
countries, which published several studies on such topics. The issue of indivi-
dual saving accounts was suggested—on the model of Singapore. This scheme
dominated and several other solutions have been shadowed, such as payments
for the direct access to specialized (secondary) ambulatory care without referral
from a GP; similarly, payment for “accommodation services” (catering, etc.)
and the like. It has to do with necessary changes in obligatory health insurance
and with an undefined guaranteed healthcare package, which should not include
95 percent of all care as is the case today. Excluded care could be covered by
voluntary insurance or out-of-pocket. Unfortunately, this debate is political.
The topic is politically abused—economic analyses and arguments are used very
scarcely. Until 1998, liberal governments did not dare to address this problem,
although in the first five years after the Velvet Revolution the willingness of
the population for massive change was extremely high. The social democratic
government continues to promise free care as a core element of their policy. As
economic problems erode the current healthcare system, debate will no doubt
reopen.
6. A wide range of economic problems have been debated over the last 14 years;
some discussed here, such as the problem of abuse of ambulatory care, over-con-
sumption of drugs and low levels of compliance with their use (see section 3.9).
7. At the end of the 1990s, a new topic appeared: the relation between doctors
and patients. Patients began to demand to be active partners and not only

240
D E C E N T R A L I Z AT I O N I N H E A LT H C A R E
subjects of paternalistic care. The physicians’ lobby has shown strong resistance—
especially to questions of malpractice—but the situation has been gradually
moving toward a Western European model. Obligatory membership in medi-
cal chambers—legally required to supervise medical standards and ethics—has
significantly affected such issues. Although these professional organizations
act as trade unions, there are two strong actual trade unions with voluntary
membership: one for all medical professionals, another for physicians only. On
the other side, the three organizations representing patients coordinate their
activities rather poorly; they are mostly left-wing and tend to constantly raise
new, poorly reasoned requirements. The media, especially print, has played a
positive role, pointing out the necessity to reduce physicians’ autonomy and
their paternalistic approach to patients.
8. The absence of a long-term concept for the entire healthcare system is the final
topic. Most health ministers have submitted ideas on reform, but none have
had had time to carry them through. Few concepts were based on sufficient
qualified analytical groundwork, not only economic, but legislative, sociologi-
cal, and technical as well. We are still waiting for a developed and convincing
healthcare concept.
4. CONCLUSION: COUNTRY-SPECIFIC EXPERIENCE
4.1 Advantages and Disadvantages of the Highly Decentralized, Pluralistic System
As was presented in section 3.3, redistribution of powers and responsibilities in decision
making, administration, and financing was an important feature of reform. Administra-
tive decentralization, devolution, delegation, and provider autonomy touched all parts
of the system to a large degree.
Whether all of these types of decentralization in service provision, financing, man-
agement, and administration were needed, and what their outcomes were, is another
question. To find an answer, we must look at several aspects of the problem.
Many steps toward decentralization in the first period of reform were logical reac-
tions to the centralized and bureaucratic system under the communist regime, either
in the health sector itself or in the country as a whole. The general reactive trend was
unavoidable and understandable; however, looking back, steps were often poorly con-
sidered and less than effective
However, these types of decentralization may have been inseparable from the trans-
formation of the Semashko model into the neo-Bismarckian model. However even in

241
D E C E N T R A L I Z AT I O N A N D G O V E R N A N C E O F H E A LT H C A R E I N T H E C Z E C H R E P U B L I C I N T H E 1 9 9 0 S
countries with the English “Lord Beveridge model,” similar features of development and
reform could be traced to the 1990s, such as the separation of delivery and financing,
higher autonomy for providers, decentralization of management, etc.
Undoubted disadvantages of early, rapid, and massive decentralization were (at least
in the first years of the new system):
• a lack of a bold responsibility in all parts and dimensions of the system
• no culture of negotiation among the major players
• lack of mandate to promptly “repair” initial faults of the system
• difficulties in implementing “regulation” in a broader sense, i.e. not only cost
containment mechanisms but structural and capacity regulation measures,
quality control, etc.
On the other side, the system:
• was able to resist short-term political interests and particular concerns
• stimulated development of services and medical technology
• met the health needs of the population and contributed substantially to improv-
ing health status.
After several years, major players seemed to learn their roles and cooperate more
smoothly than before. From the end of the 1990s to 2002, the system seemed to stabilize.
However, it might be at the cost of “frozen reforms” (as many potentially destabilizing
factor were not successfully dealt with—more about this in section 4.2).
In 2003 a new destabilizing factor occurred, linked to the transfer of administrative
and managerial competencies to new self-governing regions in the frame of the reform
of public administration.34 The focus of attention was on the problem of smaller state
hospitals previously run by the central administration in districts, which were transferred
from the state to self-governing regions—with huge debts and without appropriate
resources to cover them. The most critical situation was treated by contributions from
the state budget, but this was only the tip of the iceberg, pointing to many deeper
unsolved problems, e.g. the surplus of critical care hospital beds, the sustainability of a
dense network of small hospitals, overlapping services, a hospital remuneration scheme
and hospital financing in general.
Even this step in decentralization could have positive consequences, at least in one
aspect. Theoretically, self-governing regions can be successful in rationalizing hospital
capacity within their territory; something the central administration was unable to cope
with. Currently, a method known as “regional centralization” has been discussed, mean-
ing a single organization for hospital administration and management to be formed in
each region. Smaller hospitals would lose some of their autonomy. Interestingly, this
idea is close to the pre-reform model, abolished in 1990, of District/Regional Institutes
of National Health (see section 2.1 and Chart 1 in the appendix).35

242
D E C E N T R A L I Z AT I O N I N H E A LT H C A R E
4.2 Financial Sustainability
In the mid 1990s, the system of healthcare faced a serious financial crisis due to uncon-
trolled and spiraling costs. As was explained in section 3.2, this provoked a second round of
reforms aimed at optimizing health service provision, financing, and utilization. Although
longer term goals and objectives were not reached due to political discontinuity, the
hot problem of financial sustainability was successfully addressed. From the economic
viewpoint, the system seemed to stabilize until very recently. However, after 6 years it
became apparent that the 1996–1997 measures did not address deeper risk factors in
the system. Hospitals debts and the increasing deficit of the GHIF has again raised the
question of the financial sustainability of the Czech system of healthcare.
First attempts to respond merely involved more money. However, facing an enor-
mous deficit (almost seven percent of GDP in 2003) the government cannot afford
other expenditures, and to shift the burden onto insured persons and employers in
the form of higher health insurance contributions would have negative political and
economic effects.
The system in itself is very costly and still has a tendency to overproduction and
over-utilization, because of the large capacity of services and high generosity towards
consumers. Therefore it can drain additional resources without being “fed.” For the sake
of financial sustainability, it is necessary to introduce other reform steps both on the
supply side and the demand side:
• On the supply side, rationalize the dense network of services in secondary
care, both critical care hospital beds and special ambulatory services through
introducing multiplicity and overlapping hospital-based and outpatient care.
• On the demand side, rationalize consumer behavior by rigidly defining the
essential guaranteed package of services.
The financial imbalance of 2003 may provoke a third round of reforms, which
would mean revitalizing the frozen process and reviewing abandoned and uncompleted
plans from the second round.
4.3 The Position of Patients and Professionals in the System
What was the real contribution of the “decade of reform” to citizens’ lives and health?
Without a doubt, better health is the major contribution. From patients’ perspective
benefits include freedom of choice, free access to a wide range of services, and higher
quality of care, particularly thanks to advanced medical technology, a wide range of
pharmaceuticals from the international market, and increased qualification of doctors
and other personnel.

243
D E C E N T R A L I Z AT I O N A N D G O V E R N A N C E O F H E A LT H C A R E I N T H E C Z E C H R E P U B L I C I N T H E 1 9 9 0 S
That the first five years of the new system of healthcare stimulated service devel-
opment was a benefit for both sides, i.e. both for patients, doctors, and other health
workers. This changed after 1997 cost-containment measures: different kinds of stimuli
influenced care provision since then, and doctors and hospitals are less motivated in
treating patients. Consequently, long waits for treatment at ambulatory specialists and
for non-acute surgery in hospitals has resulted, leading to the unpleasant return of
under-the-table payments so common under communism.
In spite of this, the system is very comfortable for consumers and promotes over-uti-
lization. The average of 14.8 visits to a doctor per citizen per year is far above comparable
indicators in developed Europe, and it reflects factors other than real health needs, such
as administrative requirements, abuse of illness benefits, and psychosocial habits (poor
case management, as well).
In the health sector in general “consumers’ voice and choice” is weaker than that of
providers. Even after 12 years, patients’ position in the system is far from that of well-
informed, responsible consumer and respected partner. Freedom of choice is neither based
on accessible information about quality and efficiency nor on transparent mechanisms
of quality assurance. The reluctance of providers plays the largest role in this.
Although the position of providers’ representatives seems quite strong, it is practi-
cally impossible to meet their needs. Regulative measures and limits in provision and
remuneration for care also promote dissatisfaction among doctors (and other medical
personnel). There is a widely shared feeling (articulated also by medical chambers and
trade unions in the health sector) that recent developments do not meet the expectations
of health workers, who see themselves as forced to “sponsor” the financial difficulties
of the healthcare system.
The new system of healthcare in the Czech Republic has brought about many ad-
vantages and new opportunities both for patients and medical professionals, but these
advantages must be balanced in a financially sustainable system. The current crossroads
calling for a third round of reforms also points to the fact that if a third round was taken
seriously, it might be painful for both sides.
4.4 Market Principles, Equity, and Efficiency
The introduction of market principles into the system of healthcare provision and
financing was a political slogan for many years in the 1990s. It was declared a reform
principle by the ruling center-right parties and a public threat by the opposition. In both
cases, it was mostly an exaggeration. The market principles really implemented were
quite modest, and they did not go beyond the concept of a regulated market described
in the scholarship on health economy.
However during the first several years the word “regulated” was not emphasized.
Competition among providers, privatization, free FFS contracts between providers and

244
D E C E N T R A L I Z AT I O N I N H E A LT H C A R E
health funds, as well as other market factors, all stimulated development of services and
opened new opportunities both for patients and providers. On the other side, this led
to spiraling costs and financial crisis in the mid 1990s. The subsequent discourse em-
phasized “regulation” more than “market,” with the positive and negative consequences
mentioned elsewhere in this chapter. Still, not all regulatory measures worked against
market principles. The Czech experience may show that the concept of a regulated market
is viable, although there are different views about the balance to be struck.
Neither the new system as a whole nor its market elements led to the same equal
access to care assured by social health insurance schemes. In general, principles of equity
and solidarity were never abandoned or neglected. The reform process has been, from
this viewpoint, a dynamic balance between equity and solidarity on one hand and market
principles and efficiency on the other. This is not specific to the Czech Republic, as all
European systems of healthcare cannot stay removed from each other.
4.5 Stabilization or Continuing Reform?
Professor R. G. Feachem, an eminent WB expert, once called the Czech reform of the
health sector reform “a big bang followed by years of stabilization” (Feachem 1994).
More than a decade after the “big bang,” there may be evidence that the new system
of healthcare has been able to fulfill its central mission: to provide good—and improv-
ing—health. However, this conclusion cannot be taken as proof that the reform was the
only possible correct path: we may imagine that reforms of another type would have
similar positive and negative consequences, perhaps only on a different time-scale.
It is also clear that “stabilization” does not mean an “endstate.” If in-built risk fac-
tors remain unaddressed, stabilization can be only temporary. Reform should continue,
probably not in the form of an another big bang, rather in a process of “incremental
reforms,” in which the Czech Republic as a new EU member will face and have to solve
similar problems as other EU countries.
REFERENCES
Barr, N. 2004. Economics of the Welfare State. Oxford: Oxford University Press.
Beckmann, M. and J. Nemec. 1997. “Healthcare Systems in Transition in Eastern
Europe: the Czech Case.” In Health Policy Reform: National Variations and Globaliza-
tion, edited by C. Altenstetter and J.W. Björkmann. New York: Macmillan Press.
Dlouhý, M. and L.Tuckova. 2000. “Projekce vydaju z pohledu starnuti populace.”
Zdravotni politika a ekonomika 5.
245
D E C E N T R A L I Z AT I O N A N D G O V E R N A N C E O F H E A LT H C A R E I N T H E C Z E C H R E P U B L I C I N T H E 1 9 9 0 S
European Observatory on Healthcare Systems. 2000. Healthcare System in Transition:
Czech Republic. Copenhagen: WHO.
Feachem, R.G. 1994. “Health and Healthcare.” In Comparative Public Policy. New
York: Macmillan.
Havlik, R, J. Jaroš and E. Stehlikova. 1991. Vyvoj nazoru na premeny ve zdravotnictvi
ve svetle sociologickych vyzkumu [Trends in Opinion on Changes in Healthcare in
Sociological Research]. Prague: USLOZ.
Hoffmayer, U. and T. McCarthy. 1994. Financing Healthcare. Dordrecht/Boston/Lon-
don: Kluwer.
Institute of Health Information and Statistics (IHIS). 1992. Historical Yearbook of
Healthcare: Czechoslovakia. Prague: IHIS.
Jaroš, J. 1993. “The Czech Healthcare System.” The Health System Journal 103.
———. 1994. “Ma ceske zdravotnictvi koncepci?” [Does the Czech Healthcare System
have a Concept?]. ZdN [Health Weekly] 13.
———. 1995. Uhrady zdravotnich sluzeb—problemy a moznosti reseni [Reimburse-
ment of Health Services—Problems and Possible Solutions]. Prague: NHU
CAV-CERGE.
———. 1998. Moznosti regulace odborne ambulantni pece [Ways of Regulating Ambula-
tory Services]. Prague: Minister of Health.
Jaroš, J. et al. 1998. Healthcare in the Czech Republic: Delivery and Financing. Prague:
OECD and the Czech Association for Health Services Research.
Jaroš, J., M. Purkrabek, and S. Sevcik. 1989. Sociologicke problemy zdravotni pece v CSR
a projekty jejich reseni [Sociological Problems of Healthcare in the CSR and Projects
for their Solution]. Prague: USLOZ.
Jaroš J. and D. Towell. 1992. “Strange Route: the Czech Healthcare System.” The Health
System Journal 102.
Kalina, K. 1992. Guide to the New System of Healthcare. Prague: ANIMA.
———. 1997. “Approaches to Cost Containment, Equity and Efficiency in Health-
care.” Zdravotnictví a zdravotní pojištění [Healthcare and Health Insurance Journal]
1–2: 14.
Kalina, K. et al. 1991. Draft of the New System of Healthcare in the Czech Republic (the
“White Paper”). Prague: Ministry of Health.
———. 1995. “Containing Costs in Healthcare.” Zdravotnicke noviny [Health Weekly],
Part I-32: 3; Part II-33: 3.

246
D E C E N T R A L I Z AT I O N I N H E A LT H C A R E
McKee, M., M. Bobak, and K. Kalina. 1994. “Health Systems in Transformation.” The
Croatian Journal of Public Health 5.
OECD. 2003. Economic Surveys. Prague: OECD.
Potucek, M. et al. 1990. Draft of the Reform of Healthcare (the “Yellow Paper”). Prague:
Ministry of Health.
Preker, A. and R. Feachem. 1995. Market Mechanisms and the Health Sector in Central
and Eastern Europe. World Bank Technical Paper 293.
World Health Organization (WHO). 2001. Highlights on Health in the Czech Republic.
A WHO “Europaper.” Available online at www.who.dk/Document/E73486.pdf
NOTES
1 The contents of the study and its abstract are available online at www.oecd.org.
2 The sources of all data are: European WHO Health for All Database (at www.hfadb.who.dk/hfa);
OECD Health Data, 2003 Edition (at www.oecd.org); Czech Statistical Office—CSO—(at www.
czso.cz); Institute of Health Information and Statistics (at www.uzis.cz); General Health Insurance
Fund (at www.vzp.cz), and our own calculations (due to scarce space, we do not quote sources of data
individually).
3 Comparison of performances is only tentative.
4 Major factors connecting political changes and health reforms at the beginning of transition included:
(1) the release of data about the health status of the population and other relevant information, which
had been blocked by the communist regime; (2) open public debate about key problems in the health
sector; (3) the formation of a pro-reform movement inside the health sector, which backed changes
and gave a platform for collecting experts capable of formulating them; (4) new, pro-reform political
garniture coming into power.
5 Social policy used experience from abroad in a larger extent, and particularly the reform of social
services, launched in 1997 by the social democratic government, was based on a high degree on the
international collaboration.
6 The Ljubljana Charter (1996)—a WHO political document on healthcare reform in the WHO
European region.
7 For more about Czech attitudes to the World Bank and WHO, see section 2.5.
8 See also Chart 1 in the appendix.
9 Differently from other principles mentioned, this principle was later abandoned.
10 Although this principle was never abandoned totally, its implementation met many difficulties and
has remained uncompleted.
11 For more about the different views of major players, see section 3.4. See also Chart 2 in the
appendix.
12 These topics will be discussed further in sections 3.1.1 and 3.4.

247
D E C E N T R A L I Z AT I O N A N D G O V E R N A N C E O F H E A LT H C A R E I N T H E C Z E C H R E P U B L I C I N T H E 1 9 9 0 S
13 Reasons for the rejection were: (1) the prudent financial policy of the government in general:
avoiding loans and approaching debts cautiously; (2) underestimation of health sector needs by
influential economic ministers in the government; (3) mistrust of “uninformed” views from abroad
and consequent reluctance to accept WB expert intervention into national policy—in spite of the
fact that the WB philosophy was quite close to Czech reform concepts.
14 WHO was identified with socialist ideology and was therefore hardly acceptable to the liberal-
conservative politicians that dominated during the key period from 1991 to 1997. These ideological
attitudes were also the reason for declining to join the Ljubljana Charter in 1996. In spite of this
ideological controversy, the WHO principles of equity and solidarity were to a great extent included
in the new healthcare system (obligatory health insurance, extensive coverage, etc.).
15 See organizational Charts 1, 2, and 4 in the appendix.
16 See Chart 1, 2, and 4 in the appendix.
17 In May of 1997, the MoH launched a program for the restructuring of the hospital bed fund. The
target was to reduce critical-care beds from 7 to 5 per 1,000 individuals and increase long-term beds
to 2 per 1,000 individuals. Surplus beds were to be transferred to social services or sold, and there was
a plan to transform up to 30 minor hospitals into social institutes. The MoH was to simultaneously
support primary care and home care and implement measures halting supply-induced utilization of
hospitals. The draft of the rationalization of bed capacities was elaborated based on ALOS analysis
and occupancy ratios, and negotiated in several rounds with each district authority. Methodologically,
a detailed analysis of the health status of the population and of the technologies abbreviating ALOS
was to be performed. However, even the most sophisticated approach could be rejected by the public.
The idea of hospital rationalization presents a very sensitive political problem, which has already
inspired counter-pressure from politicians, local health administrators and, last but not least, from
the affected health personnel.
18 See Shakarishvili G., Presentation at the OSF Institute meetin, Budapest, 2001
19 See organizational Chart 4 in the appendix.
20 Districts are still used for statistical and other specific reasons.
21 Before 1990, ten regions existed in Czechoslovakia, and regional authorities ran almost all large and
university hospitals. In 1990 this regional structure and administration was abolished and all these
health facilities were transferred to the MoH, which before had only controlled a handful of similar
institutions. Thus, by 2003, after all the reforms, the MoH controlled about 220 institutions—much
more than in 1990.
22 This transfer of former state hospitals to regional governments has been seen rather ironically by
many, as facilities were privatized from one day to the next that did not meet requirements of the
1992 Act on Private Provision of Healthcare. This resulted in illegal healthcare and under-the-table
payments.
23 The legal requirement on “non-state” providers of care were in principle as follows: (1) personal
license given by the Medical Chamber to a responsible physician regarding his qualification; (2)
approval of medical equipment, also by the Medical Chamber; (3) authorization of premises by
hygiene service; (4) registration of a “non-state health facility” by the respective District Authority
after fulfilling the first three requirements (see Charts 4 and 5 in the appendix).
24 After the first free parliamentary elections in 1990 the Ministry of Health and Social Affairs was
divided into two separate institutions: the Ministry of Health and the Ministry of Labor and Social
Affairs. For many reasons this was not a beneficial decision, and it formed many inter-ministerial

248
D E C E N T R A L I Z AT I O N I N H E A LT H C A R E
problems, e.g. discontinuity of services or missing links between health insurance and illness benefits
(see Charts 2 and 3 in the appendix).
25 Among its strongest critics were the professional associations, other provider representatives (which
substantially influenced the public and the media) and the Parliamentary committee for health and
social affairs.
26 The director general of the GHIF was approved by Parliament—particularly in certain periods, the
GHIF had broader and more articulated parliamentary backing than the MoH.
27 In this case the draft of the law originated in Parliament by the constitutional right of legislative
initiative of Parliament members.
28 Note that professional and provider representation in general saw a weaker voice for GPs than for
hospitals and medical specialists.
29 WHO Ljubljana Charter, 1996
30 Law No. 48/1997 Coll.
31 There is a marginal subset consisting mainly of specialists and dentists working in Prague and other
big cities on a cash payment basis.
32 Minimum wage increases, usually every year or two, by order of the government, in connection to
increasing salaries in the public sector.
33 Privatization was not mentioned in the first reform paper (the Yellow Paper) but played a role in the
second draft (the White Paper).
34 Principles of the reform of public administration are presented in section 3.3.
35 The reform of public administration in itself was poorly prepared and chaotically implemented. The
first 9 months of the new regional arrangement displayed many disturbing consequences (in health as
well as culture, social services, infrastructure, territorial planning, etc.). The new trend toward “regional
centralization” is also appearing in other areas.

249
D E C E N T R A L I Z AT I O N A N D G O V E R N A N C E O F H E A LT H C A R E I N T H E C Z E C H R E P U B L I C I N T H E 1 9 9 0 S
ANNEX 1: Health Indicators
Table A1.
Crude Death Rate per 1,000 Individuals
Male 1980 1985 1990 1991 1992 1993 1994 1995 1996 1997 1998 1999 2000 2001 2002
• CR 13.7 13.4 13.2 12.7 12.3 11.8 11.7 11.7 11.3 11.3 11.0 11.0 11.0 10.8 11.0
• EU avg. 11.0 10.9 10.4 10.4 10.2 10.4 10.1 10.2 10.2 10.0 10.0 10.0 9.8
• CSEC avg. 11.5 11.8 11.8 12.0 12.1 12.1 12.1 12.2 12.1 12.1 11.9 11.8 11.5 11.6 11.7
Female
• CR 12.6 12.0 11.8 11.5 11.0 11.1 11.1 11.1 10.6 10.6 10.3 10.4 10.3 10.3 10.3
• EU avg. 10.0 10.1 9.9 9.9 9.8 10.0 9.7 9.9 9.9 9.8 9.8 9.9 9.7
• CSEC avg. 9.8 10.1 9.8 10.0 9.9 10.0 10.0 10.0 10.1 10.0 9.9 9.9 9.7 9.7 9.8
Figure A1.
Crude Death Rate per 1,000 Individuals
1980
1985
1990
1991
1992
1993
1994
1995
1996
1997
1998
1999
2000
2001
2002
9
10
11
12
13
14
Male
CR EU avg. CSEC avg.
1980
1985
1990
1991
1992
1993
1994
1995
1996
1997
1998
1999
2000
2001
2002
9
10
11
12
13
14
Female
CR EU avg. CSEC avg.

250
D E C E N T R A L I Z AT I O N I N H E A LT H C A R E
Table A2.
SDR Cerebro-vascular Diseases per 100,000 Individuals
Male 1980 1985 1990 1991 1992 1993 1994 1995 1996 1997 1998 1999 2000 2001 2002
• CR 253.0 252.2 237.4 221.8 205.1 192.2 187.4 176.4 163.3 145.2 150.4 151.3 156.5 148.6 144.7
• EU avg. 135.0 119.6 96.7 97.8 92.5 90.0 85.5 82.9 80.0 76.7 75.5 72.3 69.0
• CSEC avg. 170.9 169.9 165.0 165.3 163.5 176.7 173.2 170.3 172.8 172.2 175.0 172.9 167.9 165.4
Female
• CR 203.7 203.5 179.4 163.8 154.1 151.2 145.6 134.8 124.4 111.0 123.4 123.6 121.9 122.5 119.5
• EU avg. 110.0 97.2 79.5 79.6 75.5 73.5 70.4 67.4 65.0 62.3 61.0 58.9 56.3
• CSEC avg. 145.2 141.6 131.4 131.2 127.6 137.6 134.1 133.7 134.9 133.6 137.3 136.3 131.6 129.3
Figure A2.
SDR Cerebro-vascular Diseases per 100,000 Individuals
1980
1985
1990
1991
1992
1993
1994
1995
1996
1997
1998
1999
2000
2001
2002
50
100
150
200
250
300
Male
CR EU avg. CSEC avg.
1980
1985
1990
1991
1992
1993
1994
1995
1996
1997
1998
1999
2000
2001
2002
50
100
150
200
250
300
Female
CR EU avg. CSEC avg.

251
D E C E N T R A L I Z AT I O N A N D G O V E R N A N C E O F H E A LT H C A R E I N T H E C Z E C H R E P U B L I C I N T H E 1 9 9 0 S
Table A3.
Live Births per 1,000 Individuals
1980 1985 1990 1991 1992 1993 1994 1995 1996 1997 1998 1999 2000 2001 2002
CR 14.9 13.1 12.6 12.6 11.8 11.7 10.3 9.3 8.8 8.8 8.8 8.7 8.9 8.9 9.1
EU avg. 13.0 11.9 12.0 11.7 11.5 11.2 10.9 10.8 10.8 10.8 10.7 10.7 10.7
CSEC avg. 17.2 16.3 14.0 13.5 12.8 12.3 11.3 11.2 11.0 10.6 10.4 10.2 10.2 10.9
Table A4.
Annual Population Growth (Difference Between Crude Death and Live Births)
1980 1985 1990 1991 1992 1993 1994 1995 1996 1997 1998 1999 2000 2001 2002
CR death 13.1 12.7 12.5 12.1 11.7 11.4 11.4 11.4 10.9 10.9 10.6 10.7 10.6 10.5 10.6
Live births 14.9 13.1 12.6 12.6 11.8 11.7 10.3 9.3 8.8 8.8 8.8 8.7 8.9 8.9 9.1
An. Growth 1.8 0.4 0.1 0.5 0.1 0.3 –1.1 –2.1 –2.1 –2.1 –1.8 –2.0 –1.7 –1.6 –1.5
Figure A3.
Live Births per 1,000 Individuals
Figure A4.
Annual Population Growth
1980
1985
1990
1991
1992
1993
1994
1995
1996
1997
1998
1999
2000
2001
2002
8
10
12
14
16
18
CR EU avg. CSEC avg.
1980
1985
1990
1991
1992
1993
1994
1995
1996
1997
1998
1999
2000
2001
2002
8
10
12
14
16
Live birth Cr death

252
D E C E N T R A L I Z AT I O N I N H E A LT H C A R E
1980
1985
1990
1991
1992
1993
1994
1995
1996
1997
1998
1999
2000
2001
2002
0.0
0.5
1.0
1.5
2.0
2.5
CR EU avg. CSEC avg.
Table A5.
Total Fertility Rate
1980 1985 1990 1991 1992 1993 1994 1995 1996 1997 1998 1999 2000 2001 2002
CR 2.1 2.0 1.9 1.9 1.7 1.7 1.4 1.3 1.2 1.2 1.2 1.1 1.2 1.2 1.2
EU avg. 1.8 1.6 1.6 1.5 1.5 1.5 1.5 1.5 1.5 1.5 1.5 1.5 1.5 1.5
CSEC avg. 2.2 2.2 1.9 1.9 1.8 1.7 1.7 1.6 1.5 1.4 1.4 1.4 1.4 1.3
Table A6.
Maternal Deaths per 100,000 Live Births
1980 1985 1990 1991 1992 1993 1994 1995 1996 1997 1998 1999 2000 2001 2002
CR 10.0 10.0 8.4 17.8 12.3 12.4 15.0 6.2 7.7 5.5 6.6 10.1 9.9 3.3 3.2
EU avg. 13.1 8.6 7.8 7.3 7.4 5.8 6.6 6.1 7.1 5.8 6.6 5.2 5.6
CSEC avg. 37.4 37.1 26.8 23.1 21.1 21.4 22.3 19.6 15.3 16.9 15.2 15.6 14.5 13.0
Figure A5.
Total Fertility Rate
Figure A6.
Maternal Deaths per 100,000 Live Births
1980
1985
1990
1991
1992
1993
1994
1995
1996
1997
1998
1999
2000
2001
2002
0
510
15
20
25
CR EU avg. CSEC avg.
30
35
40

253
D E C E N T R A L I Z AT I O N A N D G O V E R N A N C E O F H E A LT H C A R E I N T H E C Z E C H R E P U B L I C I N T H E 1 9 9 0 S
Table A7.
SDR Ischaemic Heart Disease, All Ages per 100,000 Individuals
Male 1980 1985 1990 1991 1992 1993 1994 1995 1996 1997 1998 1999 2000 2001 2002
• CR 410.3 438.8 439.1 413.8 402.0 383.3 364.2 355.4 318.1 298.5 274.3 270.2 256.0 252.5 242.5
• EU avg. 225.9 215.1 185.6 185.7 179.8 180.0 169.5 168.0 162.3 155.4 153.4 147.3 139.8
• CSEC avg. 243.1 262.4 269.5 274.8 275.5 281.6 275.7 270.6 265.4 267.0 266.3 265.2 252.1 247.7
Female
• CR 218.7 224.1 219.9 216.0 199.5 201.0 195.2 191.9 174.2 160.5 143.5 146.9 137.0 135.6 133.9
• EU avg. 100.3 96.2 86.4 86.8 84.3 84.8 80.3 79.4 76.9 74.2 73.4 70.6 66.9
• CSEC avg. 126.9 138.6 139.7 142.5 139.8 146.4 145.3 142.8 141.8 144.0 146.6 147.9 142.4 139.0
Figure A7.
SDR Ischaemic Heart Disease per 100,000 Individuals
1980
1985
1990
1991
1992
1993
1994
1995
1996
1997
1998
1999
2000
2001
2002
50100
150200250300
Male
CR EU avg. CSEC avg.
350
400450500
1980
1985
1990
1991
1992
1993
1994
1995
1996
1997
1998
1999
2000
2001
2002
50100
150200250300
Female
CR EU avg. CSEC avg.
350
400450500

254
D E C E N T R A L I Z AT I O N I N H E A LT H C A R E
Table A8.
SDR Chronic Liver Disease and Cirrhosis per 100,000 Individuals
Male 1980 1985 1990 1991 1992 1993 1994 1995 1996 1997 1998 1999 2000 2001 2002
• CR 27.5 26.4 34.7 32.5 29.1 25.7 25.3 25.5 24.6 24.7 26.3 26.2 25.2 25.7 25.5
• EU avg. 33.1 28.2 23.8 23.9 23.2 22.7 22.1 21.4 20.9 20.4 19.9 19.3 19.3
• CSEC avg. 29.8 33.0 33.9 35.5 37.7 39.9 41.5 42.5 40.5 41.6 42.5 40.4 39.0 38.8
Female
• CR 9.1 8.7 9.6 9.7 9.5 8.6 8.6 8.6 8.2 8.9 9.6 8.5 9.2 9.0 9.4
• EU avg. 11.9 10.6 9.7 9.7 9.4 9.4 9.2 8.9 8.7 8.5 8.2 8.2 8.1
• CSEC avg. 12.5 13.4 13.2 13.8 14.2 15.4 15.4 15.9 14.8 15.4 15.8 14.8 14.3 15.0
Figure A8.
SDR Chronic Liver Disease and Cirrhosis per 100,000 Individuals
CR EU avg. CSEC avg.
1980
1985
1990
1991
1992
1993
1994
1995
1996
1997
1998
1999
2000
2001
2002
5
10
15
20
25
30
Male
35
40
45
CR EU avg. CSEC avg.
1980
1985
1990
1991
1992
1993
1994
1995
1996
1997
1998
1999
2000
2001
2002
5
10
15
20
25
30
Female
35
40
45

255
D E C E N T R A L I Z AT I O N A N D G O V E R N A N C E O F H E A LT H C A R E I N T H E C Z E C H R E P U B L I C I N T H E 1 9 9 0 S
Table A9.
Viral Hepatitis Incidence per 100,000 Individuals—Both Sexes
1980 1985 1990 1991 1992 1993 1994 1995 1996 1997 1998 1999 2000 2001 2002
CR 107.9 50.4 28.3 20.7 21.7 18.1 18.4 19.6 30.3 20.6 19.7 22.4 19.3 16.8 15.1
EU avg. 25.6 27.7 31.4 29.2 28.2 25.4 23.9 23.8 24.9 24.5 22.0 20.7
CSEC avg. 148.3 119.0 133.2 110.4 84.0 81.6 84.6 77.0 54.7 46.1 42.5 46.8 46.8
Figure A9.
Viral Hepatitis
Figure A10.
TB Indicidence
CR EU avg. CSEC avg.
1980
1985
1990
1991
1992
1993
1994
1995
1996
1997
1998
1999
2000
2001
2002
0
20
40
60
80
100120
140
160
CR EU avg. CSEC avg.
1980
1985
1990
1991
1992
1993
1994
1995
1996
1997
1998
1999
2000
2001
2002
0
10
20
30
40
50
60
70

256
D E C E N T R A L I Z AT I O N I N H E A LT H C A R E
Table A10.
Percent of Regular Daily Smokers, Age 15+
1993 1994 1996 1999 2000 2001 2002
Male 32.2 43.0 32.8 30.1 36.2 26.4 30.9
Female 21.3 31.0 20.2 17.3 22.0 20.4 18.1
Table A11.
Pure Alcohol Consumed per Capita, Age 15+
1980 1985 1990 1991 1992 1993 1994 1995 1996 1997 1998 1999 2000 2001 2002
CR 16.0 15.7 16.3 15.6 16.5 15.7 15.9 15.8 16.1 16.5 16.4 16.5 16.3 16.2
EU avg. 15.4 13.6 12.7 12.3 12.1 11.8 11.7 11.5 11.2 11.4 11.1 11.1 11.1
CSEC avg. 12.6 11.6 10.3 10.1 10.0 10.0 9.9 9.8 9.7 9.9 9.4 9.5 9.5 9.4
Figure A11.
Daily Smokers
Figure A12.
Alcohol Consumed
CR EU avg. CSEC avg.
1980
1985
1990
1991
1992
1993
1994
1995
1996
1997
1998
1999
2000
2001
2002
8
10
12
14
16
18
Male Female
1993 1994 1996 1994 1999 2000 2002
0
10
20
30
40
5060
70
80

257
D E C E N T R A L I Z AT I O N A N D G O V E R N A N C E O F H E A LT H C A R E I N T H E C Z E C H R E P U B L I C I N T H E 1 9 9 0 S
Table A12.
Physicians per 100,000 Individuals
1980 1985 1990 1991 1992 1993 1994 1995 1996 1997 1998 1999 2000 2001 2002
CR 225.7 257.7 270.6 267.5 267.9 286.4 293.2 299.5 298.4 311.2 303.0 307.8 336.9 344.5 389.8
EU avg. 217.6 266.6 291.4 299.6 305.9 315.8 324.1 327.6 334.7 338.3 338.2 344.5 348.5 350.8
CSEC avg. 200.5 222.6 236.8 236.3 238.4 238.9 240.9 244.3 247.9 249.1 249.4 250.2 250.2 250.6
Table A13.
GPs per 100,000 Individuals
1980 1985 1990 1991 1992 1993 1994 1995 1996 1997 1998 1999 2000 2001 2002
CR 68.2 72.3 72.6 69.8 69.6 68.2 69.2 70.0 68.3 67.8 67.9 68.2 71.9 72.3 72.2
EU avg. 86.3 92.1 100.3 100.2 101.1 101.5 100.4 102.9 102.0 101.7 101.8 101.2 101.0
CSEC avg. 51.8 57.7 67.5 60.3 65.8 65.9 65.6 65.8 64.8 65.8 67.5 67.7 68.5 69.6
Figure A13.
Physicians per 100,000 Individuals
Figure A14.
GPs per 100,000 Individuals
CR EU avg. CSEC avg.
1980
1985
1990
1991
1992
1993
1994
1995
1996
1997
1998
1999
2000
2001
2002
200
225
250
275
300
325
350
375
400
CR EU avg. CSEC avg.
1980
1985
1990
1991
1992
1993
1994
1995
1996
1997
1998
1999
2000
2001
2002
40
50
60
70
80
90
100
110
120

258
D E C E N T R A L I Z AT I O N I N H E A LT H C A R E
Table A14.
Bed Occupancy Rate in Acute Care Hospitals (%)
1980 1985 1990 1991 1992 1993 1994 1995 1996 1997 1998 1999 2000 2001 2002
CR 81.8 80.8 69.6 69.0 70.2 71.6 73.0 72.6 74.1 71.8 70.8 67.7 70.7 70.5 72.1
EU avg. 76.5 76.8 77.0 77.2 77.4 77.3 77.1 77.5 77.2 76.9 77.9
CSEC avg. 83.7 82.2 76.0 72.9 73.2 71.8 73.9 74.5 75.6 75.5 74.5 71.3 71.5 72.0
Table A15.
Private Inpatient Hospital Beds as Percent of All Beds
1992 1993 1994 1995 1996 1997 1998 1999 2000 2001 2002
CR 0.3 1.7 3.8 6.5 8.3 9.4 9.6 9.8 10.4 10.4 31.4
EU avg. 20.1 20.8 21.7 22.5 22.4 22.2
CSEC avg. 0.1 0.2 0.5 0.8 1.1 1.2 1.4 1.5 1.7 1.6
Figure A15.
Bed Occupancy Rate
Figure A16.
Private Hospital Beds
CR EU avg. CSEC avg.
1980
1985
1990
1991
1992
1993
1994
1995
1996
1997
1998
1999
2000
2001
2002
65
70
75
80
85
CR EU avg. CSEC avg.
1992
1993
1994
1995
1996
1997
1998
1999
2000
2001
2002
0
5
15
25
35
10
20
30

259
D E C E N T R A L I Z AT I O N A N D G O V E R N A N C E O F H E A LT H C A R E I N T H E C Z E C H R E P U B L I C I N T H E 1 9 9 0 S
Table A16.
Hospital Beds per 100,000 Individuals
1980 1985 1990 1991 1992 1993 1994 1995 1996 1997 1998 1999 2000 2001 2002
CR 1,085 1,099 1,092 1,069 1,035 1,005 982 922 897 877 862 847 855 858 831
EU avg. 964 917 799 748 724 702 687 673 664 648 640 629 622
CSEC avg. 801 810 811 803 770 766 749 732 727 706 684 669 663 657
Figure A17.
Hospital Beds per 100,000 Individuals
CR EU avg. CSEC avg.
1980
1985
1990
1991
1992
1993
1994
1995
1996
1997
1998
1999
2000
2001
2002
600
700
900
1,100
800
1,000
1,200

260
D E C E N T R A L I Z AT I O N I N H E A LT H C A R E
Table A17.
Percent of Population Aged 0–14 Years
Male 1980 1985 1990 1991 1992 1993 1994 1995 1996 1997 1998 1999 2000 2001 2002
• CR 24.6 24.6 22.6 22.0 21.4 20.8 20.2 19.6 19.1 18.6 18.2 17.7 17.3 16.9 16.6
• EU aver. 22.7 20.4 19.1 18.9 18.8 18.6 18.5 18.3 18.1 17.9 17.9 17.8 17.7
• CSEC aver. 25.6 25.4 24.6 24.2 23.8 23.3 22.9 22.4 22.0 21.5 21.0 20.5 19.9 19.2
Female
• CR 22.1 22.1 20.4 19.8 19.2 18.7 18.2 17.6 17.2 16.8 16.3 16.0 15.6 15.3 14.9
• EU aver. 20.4 18.3 17.2 17.1 17.0 16.9 16.8 16.6 16.4 16.3 16.3 16.1 16.0
• CSEC aver. 23.4 23.2 22.4 22.0 21.6 21.1 20.7 20.2 19.8 19.3 18.9 18.4 17.9 17.3
Figure A18.
Percent of Population Aged 0–14 Years
Male
CR EU avg. CSEC avg.
1980
1985
1990
1991
1992
1993
1994
1995
1996
1997
1998
1999
2000
2001
2002
13
15
19
23
17
21
25
27
Female
CR EU avg. CSEC avg.
1980
1985
1990
1991
1992
1993
1994
1995
1996
1997
1998
1999
2000
2001
2002
13
15
19
23
17
21
25
27

261
D E C E N T R A L I Z AT I O N A N D G O V E R N A N C E O F H E A LT H C A R E I N T H E C Z E C H R E P U B L I C I N T H E 1 9 9 0 S
Table A18.
Percent of Population Aged 65+
Male 1980 1985 1990 1991 1992 1993 1994 1995 1996 1997 1998 1999 2000 2001 2002
• CR 10.8 9.2 9.7 9.9 9.9 10.0 10.2 10.3 10.5 10.6 10.8 10.9 10.9 10.9 11.0
• EU aver. 11.3 10.9 11.6 11.8 12.0 12.2 12.4 12.7 12.9 13.1 13.1 13.3 13.5
• CSEC aver. 8.8 8.0 8.5 8.7 8.9 9.1 9.2 9.4 9.6 9.8 10.0 10.1 10.3 10.6
Female
• CR 16.0 14.4 15.2 15.4 15.5 15.7 15.8 16.0 16.2 16.3 16.4 16.5 16.6 16.6 16.6
• EU aver. 16.5 16.4 17.5 17.7 17.9 18.0 18.2 18.3 18.5 18.6 18.7 18.9 18.9
• CSEC aver. 12.5 11.9 12.8 13.0 13.4 13.6 13.8 14.0 14.3 14.5 14.7 14.9 15.1 15.6
Figure A19.
Percent of Population 65+
Male
CR EU avg. CSEC avg.
1980
1985
1990
1991
1992
1993
1994
1995
1996
1997
1998
1999
2000
2001
2002
6
8
12
16
10
14
18
20
Female
CR EU avg. CSEC avg.
1980
1985
1990
1991
1992
1993
1994
1995
1996
1997
1998
1999
2000
2001
2002
6
8
12
16
10
14
18
20

262
D E C E N T R A L I Z AT I O N I N H E A LT H C A R E
Table A19.
Live Births per 1,000 Individuals
Male 1980 1985 1990 1991 1992 1993 1994 1995 1996 1997 1998 1999 2000 2001 2002
• CR 15.9 13.9 13.3 13.3 12.5 12.4 10.9 9.8 9.3 9.3 9.3 9.2 9.4 9.4 9.6
• EU aver. 13.8 12.6 12.7 12.3 12.2 11.8 11.5 11.3 11.4 11.4 11.3 11.2 11.2
• CSEC ave. 18.0 16.8 14.7 14.2 13.4 13.0 12.5 11.8 11.6 11.3 11.0 10.8 10.8 10.5
Female
• CR 14.0 12.4 11.9 11.8 11.1 11.1 9.8 8.8 8.3 8.3 8.3 8.3 8.3 8.4 8.6
• EU aver. 12.3 11.3 11.4 11.1 11.0 10.7 10.4 10.3 10.3 10.3 10.2 10.1 10.2
• CSEC aver. 16.3 15.2 13.3 12.8 12.1 11.6 11.3 10.6 10.4 10.0 9.8 9.6 9.6 9.3
Figure A20.
Live Births per 1,000 Individuals
Male
CR EU avg. CSEC avg.
1980
1985
1990
1991
1992
1993
1994
1995
1996
1997
1998
1999
2000
2001
2002
8
10
16
12
14
18
20
Female
CR EU avg. CSEC avg.
1980
1985
1990
1991
1992
1993
1994
1995
1996
1997
1998
1999
2000
2001
2002
8
10
16
12
14
18
20

263
D E C E N T R A L I Z AT I O N A N D G O V E R N A N C E O F H E A LT H C A R E I N T H E C Z E C H R E P U B L I C I N T H E 1 9 9 0 S
Table A20.
Life Expectancy at Birth, in Years
Male 1980 1985 1990 1991 1992 1993 1994 1995 1996 1997 1998 1999 2000 2001 2002
• CR 66.8 67.1 67.6 68.3 68.8 69.3 69.5 69.8 70.5 70.6 71.2 71.5 71.8 72.1 72.2
• EU aver. 70.7 71.9 73.1 73.2 73.5 73.6 74.1 74.2 74.5 74.9 75.0 75.2 75.5
• CSEC aver. 66.7 66.8 67.0 66.8 66.8 67.0 67.1 67.3 67.6 67.8 68.2 68.6 69.2 69.4
Female
• CR 73.9 74.4 75.5 75.9 76.3 76.5 76.7 76.8 77.6 77.6 78.2 78.3 78.6 78.7 78.8
• EU aver. 77.5 78.6 79.8 80.0 80.3 80.3 80.7 80.8 81.0 81.3 81.3 81.4 81.7
• CSEC aver. 73.9 74.2 75.0 75.0 75.2 75.3 75.4 75.6 75.7 76.0 76.3 76.5 76.9 77.2
Figure A21.
Life Expectancy at Birth, in Years
Male
CR EU avg. CSEC avg.
1980
1985
1990
1991
1992
1993
1994
1995
1996
1997
1998
1999
2000
2001
2002
66
68
74
70
72
76
78
80
82
Female
CR EU avg. CSEC avg.
1980
1985
1990
1991
1992
1993
1994
1995
1996
1997
1998
1999
2000
2001
2002
66
68
74
70
72
76
78
80
82

264
D E C E N T R A L I Z AT I O N I N H E A LT H C A R E
ANNEX 2: Socio-economic Indicators
Table A21.
Healthcare Costs of Health Insurance Funds in 2001
in %
Total Healthcare Costs 100.0
• General Practitioners* 5.3
• Private Ambulatory Specialists 11.6
• Stomatological Care 5.9
• Prescribed Medicaments and aids 24.3
Other—not specified costs** 5.0
Hospitals and other bed-facilities 48.0
• From which Inpatient Care (at least) 31.2
• Hospital Outpatient Care (up to) 16.7
Notes: * GP for adults + children + gynecologists.
** Including spas, treatment abroad, transport, etc.
Figure A22.
Healthcare Costs of Health Insurance Funds in 2001
General Practitioners*
Private Ambulatory Specialists
Stomatological Care
Prescribed Medicaments and aids
Other—unspecified costs**
From which Inpatient Care (at least)
Hospital Outpatient Care (up to)24.3
5.9
11.6
5.316.7
31.2
5.0
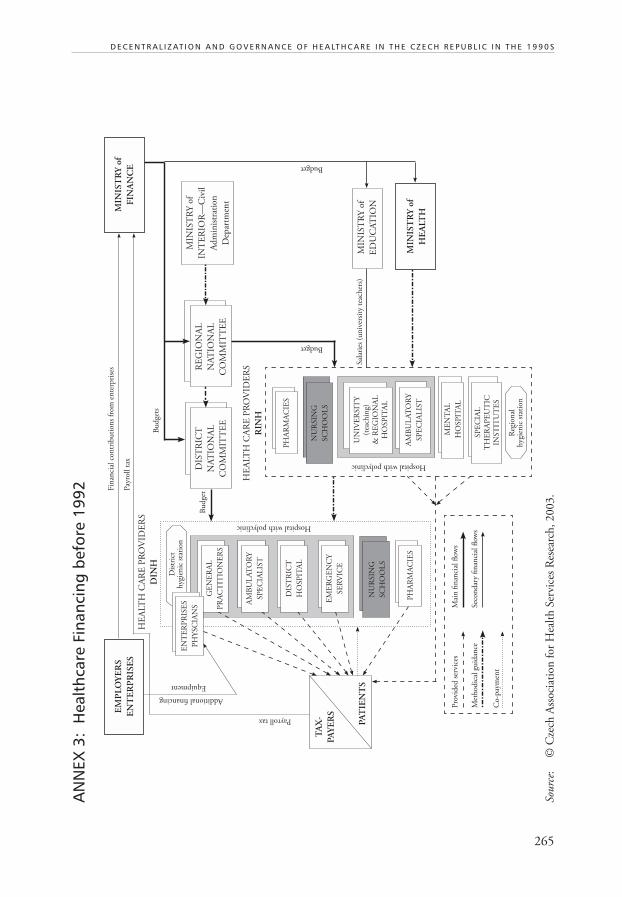
265
D E C E N T R A L I Z AT I O N A N D G O V E R N A N C E O F H E A LT H C A R E I N T H E C Z E C H R E P U B L I C I N T H E 1 9 9 0 S
AN
NEX
3:
Hea
lthc
are
Fina
ncin
g be
fore
199
2
Sourc
e:
© C
zech
Ass
oci
atio
n f
or
Hea
lth
Ser
vice
s R
esea
rch
, 2003.
RE
GIO
NA
L
NA
TIO
NA
L
CO
MM
ITT
EE
DIS
TR
ICT
NA
TIO
NA
L
CO
MM
ITT
EE
HE
ALT
H C
AR
E P
RO
VID
ER
S
RIN
H
HE
ALT
H C
AR
E P
RO
VID
ER
S
DIN
H
MIN
IST
RY
of
FIN
AN
CE
MIN
IST
RY
of
INT
ER
IOR
—C
ivil
Ad
min
istr
atio
n
Dep
artm
ent
MIN
IST
RY
of
HE
ALT
H
MIN
IST
RY
of
ED
UC
AT
ION
Bu
dge
ts
Bu
dge
t
Budget
Budget
Sal
arie
s (u
niv
ersi
ty t
each
ers)
Pay
roll t
ax
Fin
anci
al c
on
trib
uti
on
s fr
om
en
terp
rise
s
Payroll tax
EM
PL
OY
ER
S
EN
TE
RP
RIS
ES
Additional financing
Equipment
TA
X-
PA
YE
RS
PA
TIE
NT
S
PH
AR
MA
CIE
S
NU
RSIN
G
SC
HO
OL
S
EN
TE
RP
RIS
ES
PH
YSC
IAN
S
Dis
tric
th
ygie
nic
sta
tion
GE
NE
RA
L
PR
AC
TIT
ION
ER
S
AM
BU
LA
TO
RY
SP
EC
IAL
IST
DIS
TR
ICT
HO
SP
ITA
L
EM
ER
GE
NC
Y
SE
RV
ICE
NU
RSIN
G
SC
HO
OL
S
PH
AR
MA
CIE
S
Reg
ion
alh
ygie
nic
sta
tion
SP
EC
IAL
TH
ER
AP
EU
TIC
INST
ITU
TE
S
ME
NT
AL
HO
SP
ITA
L
AM
BU
LA
TO
RY
SP
EC
IAL
IST
UN
IVE
RSIT
Y(t
each
ing)
& R
EG
ION
AL
HO
SP
ITA
L
Hospital with polyclinic
Hospital with polyclinic
Pro
vid
ed s
ervi
ces
Mai
n fi
nan
cial
flow
s
Met
hod
ical
gu
idan
ceSec
on
dar
y fi
nan
cial
flow
s
Co-p
aym
ent
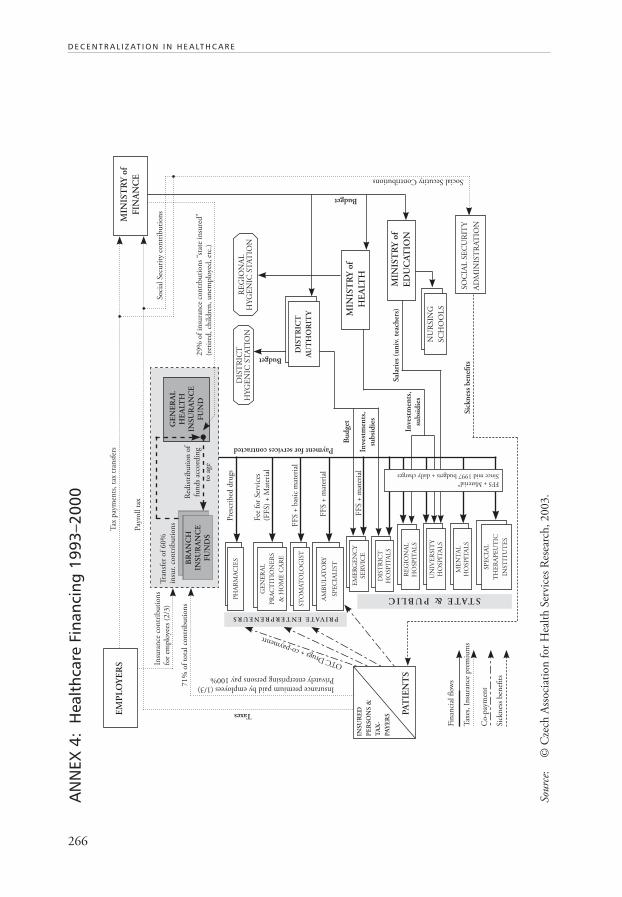
266
D E C E N T R A L I Z AT I O N I N H E A LT H C A R E
AN
NEX
4:
Hea
lthc
are
Fina
ncin
g 19
93–2
000
Sourc
e:
© C
zech
Ass
oci
atio
n f
or
Hea
lth
Ser
vice
s R
esea
rch
, 2003.
GE
NE
RA
LH
EA
LTH
INS
UR
AN
CE
FU
ND
PH
AR
MA
CIE
S
ST
OM
AT
OL
OG
IST
EM
ER
GE
NC
Y
SE
RV
ICE
DIS
TR
ICT
HO
SP
ITA
LS
RE
GIO
NA
L
HO
SP
ITA
LS
UN
IVE
RSIT
Y
HO
SP
ITA
LS
ME
NT
AL
HO
SP
ITA
LS
MIN
IST
RY
of
FIN
AN
CE
EM
PL
OY
ER
S
Fin
anci
al fl
ow
s
Co-p
aym
ent
Tax
es, In
sura
nce
pre
miu
ms
Sic
kn
ess
ben
efits
STATE & PUBLIC
PRIVATE ENTERPRENEURS
FFS + Material*
Since mid 1997 budgets + daily charges
PA
TIE
NT
S
INS
UR
ED
PE
RS
ON
S &
TA
X-
PA
YE
RS
GE
NE
RA
L
PR
AC
TIT
ION
ER
S
& H
OM
E C
AR
E
DIS
TR
ICT
HY
GE
NIC
ST
AT
ION
RE
GIO
NA
LH
YG
EN
IC S
TA
TIO
N
BR
AN
CH
INS
UR
AN
CE
FU
ND
S
MIN
IST
RY
of
ED
UC
AT
ION
MIN
IST
RY
of
HE
ALT
H
SO
CIA
L S
EC
UR
ITY
AD
MIN
IST
RA
TIO
N
NU
RSIN
G
SC
HO
OL
S
DIS
TR
ICT
AU
TH
OR
ITY
AM
BU
LA
TO
RY
SP
EC
IAL
IST
SP
EC
IAL
TH
ER
AP
EU
TIC
INST
ITU
TE
S
Budget
Budget
Bu
dge
t
Pay
roll t
ax
Tax
pay
men
ts, ta
x tr
ansf
ers
71%
of
tota
l co
ntr
ibu
tion
s
Insu
ran
ce c
on
trib
uti
on
sfo
r em
plo
yees
(2/3
)
Pre
scri
bed
dru
gs
Taxes
Fee
for
Ser
vice
s(F
FS)
+ M
ater
ial
FF
S +
bas
ic m
ater
ial
FF
S +
mat
eria
l
FF
S +
mat
eria
lIn
vest
men
ts,
sub
sid
ies
Inve
stm
ents
,su
bsi
die
s
OTC Drugs + co-paymentt
Insurance premium paid by employees (1/3)Privately enterprising persons pay 100%
Tra
nsf
er o
f 60%
insu
r. c
on
trib
uti
on
s
Red
istr
ibu
tion
of
fun
ds
acco
rdin
g
to a
ge
Soci
al S
ecu
rity
con
trib
uti
on
s
29%
of
insu
ran
ce c
on
trbu
tion
s “s
tate
in
sure
d”
(ret
ired
, ch
ild
ren
, u
nem
plo
yed
, et
c.)
Sic
kn
ess
ben
efits
Sal
arie
s (u
niv
. te
ach
ers)
Social Secutity Contributions
Payment for services contracted

267
D E C E N T R A L I Z AT I O N A N D G O V E R N A N C E O F H E A LT H C A R E I N T H E C Z E C H R E P U B L I C I N T H E 1 9 9 0 S
AN
NEX
5:
Hea
lthc
are
Fina
ncin
g a
fter
200
3
Sourc
e:
© C
zech
Ass
oci
atio
n f
or
Hea
lth
Ser
vice
s R
esea
rch
, 2003.
GE
NE
RA
LH
EA
LTH
INS
UR
AN
CE
FU
ND
PH
AR
MA
CIE
S
ST
OM
AT
OL
OG
IST
EM
ER
GE
NC
Y
SE
RV
ICE
DIS
TR
ICT
HO
SP
ITA
LS
RE
GIO
NA
L
HO
SP
ITA
LS
UN
IVE
RSIT
Y
HO
SP
ITA
LS
ME
NT
AL
HO
SP
ITA
LS
MIN
IST
RY
of
FIN
AN
CE
EM
PL
OY
ER
S
Fin
anci
al fl
ow
s
Co-p
aym
ent
Tax
es, In
sura
nce
pre
miu
ms
Sic
kn
ess
ben
efits
STATE & PUBLIC
PRIVATE ENTERPRENEURS
Budgets + daily charges per caseP
AT
IEN
TS
INS
UR
ED
PE
RS
ON
S &
TA
X-
PA
YE
RS
GE
NE
RA
L
PR
AC
TIT
ION
ER
S
& H
OM
E C
AR
E
DIS
TR
ICT
HY
GE
NIC
ST
AT
ION
RE
GIO
NA
LH
YG
EN
IC S
TA
TIO
N
BR
AN
CH
INS
UR
AN
CE
FU
ND
S
MIN
IST
RY
of
ED
UC
AT
ION
MIN
IST
RY
of
HE
ALT
H
SO
CIA
L S
EC
UR
ITY
AD
MIN
IST
RA
TIO
N
NU
RSIN
G
SC
HO
OL
S
RE
GIO
NA
L
AU
TH
OR
ITY
AM
BU
LA
TO
RY
SP
EC
IAL
IST
SP
EC
IAL
TH
ER
AP
EU
TIC
INST
ITU
TE
S
Bu
dge
ts
Budgets
Bu
dge
t
Pay
roll t
ax
Tax
pay
men
ts, ta
x tr
ansf
ers
77%
of
tota
l co
ntr
ibu
tion
s
Insu
ran
ce c
on
trib
uti
on
sfo
r em
plo
yees
(2/3
)
Pre
scri
bed
dru
gs
Taxes
Cap
itat
ion
fee
+F
FS
85–90 : 1
5–10%
Inve
stm
ents
,su
bsi
die
s
Inve
stm
ents
,su
bsi
die
s
OTC Drugs + co-paymentt
Insurance premium paid by employees (1/3)Privately enterprising persons pay 100%
Tra
nsf
er o
f 60%
insu
r. c
on
trib
uti
on
s
Red
istr
ibu
tion
of
fun
ds
acco
rdin
g
to a
ge
Soci
al S
ecu
rity
con
trib
uti
on
s
23%
of
insu
ran
ce c
on
trbu
tion
s “s
tate
in
sure
d”
(ret
ired
, ch
ild
ren
, u
nem
plo
yed
, et
c.)
Sic
kn
ess
ben
efits
Sal
arie
s (p
rofe
sso
rs)
Social Security contributions
Payment for services contracted
Defi
ned
par
t of
all
taxe
s fr
om
th
e re
gion
Pri
ce lis
t + c
o-p
aym
ent
70 : 3
0%
FF
S +
Tota
l ti
me
lim
itan
d E
xpen
dit
ure
cei
lin
g
FF
S +
mat
eria
l

268
D E C E N T R A L I Z AT I O N I N H E A LT H C A R E
AN
NEX
6:
Adm
inis
trat
ive
Com
pete
ncie
s 19
93–2
002
Sourc
e:
© C
zech
Ass
oci
atio
n f
or
Hea
lth
Ser
vice
s R
esea
rch
, 2003.
GE
NE
RA
L H
EA
LTH
INS
UR
AN
CE
FU
ND
PH
AR
MA
CIE
S
ST
OM
AT
OL
OG
IST
EM
ER
GE
NC
Y
SE
RV
ICE
DIS
TR
ICT
HO
SP
ITA
LS
RE
GIO
NA
L
HO
SP
ITA
LS
UN
IVE
RSIT
Y
HO
SP
ITA
LS
ME
NT
AL
HO
SP
ITA
LS
EM
PL
OY
ER
S
Con
trol, a
ud
it, su
per
visi
on
Con
trac
ts
Ele
ctio
n
Reg
ula
tion
etc
.
STATE & PUBLIC
PRIVATE ENTERPRENEURS
GE
NE
RA
L
PR
AC
TIT
ION
ER
S
& H
OM
E C
AR
ER
EG
ION
AL
HY
GE
NIC
ST
AT
ION
BR
AN
CH
INS
UR
AN
CE
FU
ND
S
MIN
IST
RY
of
ED
UC
AT
ION
MIN
IST
RY
of
HE
ALT
H
CZ
EC
H M
ED
ICA
L
ASSO
CIA
TIO
N—
Spec
iali
zed
sec
tion
s
DIS
TR
ICT
AU
TH
OR
ITY
AM
BU
LA
TO
RY
SP
EC
IAL
IST
SP
EC
IAL
TH
ER
AP
EU
TIC
INST
ITU
TE
S
1/3
in
sure
e *
1/3
em
plo
yer
* 1/3
sta
te—
MoH
, M
oF,
ML
SA
Boar
ds
of
tru
stee
s (3
0 m
emb.)
+ S
up
ervi
sory
boar
ds
(9)
PA
RL
IAM
EN
T
INSU
RE
E
EM
PL
OY
EE
CIT
IZE
NS
MIN
IST
RY
of
FIN
AN
CE
MIN
IST
RY
of
LA
BO
R a
nd
SO
CIA
L A
FF
AIR
S
ME
DIC
AL
CH
AM
BE
RS
Exp
ert
com
mis
sion
s
Met
hod
ical
gu
idan
ce
Info
rmat
ion
Ad
min
istr
atio
n
Co
mp
lain
s: M
ed.C
ham
ber
s, M
oH
,In
sura
nce
Fu
nd
s, R
egio
nal
Au
th.
Sup
ervi
sory
boar
d o
nly
CONTRACTS
Qu
alit
y, c
om
pla
ints
,p
rofe
ssio
nal
co
mp
eten
ce
LICENCESfor non-stateHC facilities
GA
UR
AN
TE
Eo
f ca
re f
or
citi
zen
s
RE
GIS
TR
AT
ION
Bas
ed o
n l
icen
ses
DIS
TR
ICT
HY
GE
NIC
ST
AT
ION
Good practice guidelines
CA
RE
ST
AN
DA
RD
S
GO
OD
PR
AC
TIC
E
Fo
un
der
Fo
un
der

269
D E C E N T R A L I Z AT I O N A N D G O V E R N A N C E O F H E A LT H C A R E I N T H E C Z E C H R E P U B L I C I N T H E 1 9 9 0 S
AN
NEX
7:
Adm
inis
trat
ive
Com
pete
ncie
s in
200
3
Sourc
e:
© C
zech
Ass
oci
atio
n f
or
Hea
lth
Ser
vice
s R
esea
rch
, 2003.
GE
NE
RA
L H
EA
LTH
INS
UR
AN
CE
FU
ND
PH
AR
MA
CIE
S
ST
OM
AT
OL
OG
IST
EM
ER
GE
NC
Y
SE
RV
ICE
DIS
TR
ICT
HO
SP
ITA
LS
RE
GIO
NA
L
HO
SP
ITA
LS
UN
IVE
RSIT
Y
HO
SP
ITA
LS
ME
NT
AL
HO
SP
ITA
LS
EM
PL
OY
ER
S
Con
trol, a
ud
it, su
per
visi
on
Con
trac
ts
Ele
ctio
n
Reg
ula
tion
etc
.
STATE & PUBLIC
PRIVATE ENTERPRENEURS
GE
NE
RA
L
PR
AC
TIT
ION
ER
S
& H
OM
E C
AR
ER
EG
ION
AL
HY
GE
NIC
ST
AT
ION
BR
AN
CH
INS
UR
AN
CE
FU
ND
S
MIN
IST
RY
of
ED
UC
AT
ION
MIN
IST
RY
of
HE
ALT
H
CZ
EC
H M
ED
ICA
L
ASSO
CIA
TIO
N—
Spec
iali
zed
sec
tion
s
RE
GIO
NA
LA
UT
HO
RIT
Y
AM
BU
LA
TO
RY
SP
EC
IAL
IST
SP
EC
IAL
TH
ER
AP
EU
TIC
INST
ITU
TE
S
1/3
in
sure
e *
1/3
em
plo
yer
* 1/3
sta
te—
MoH
, M
oF,
ML
SA
Boar
ds
of
tru
stee
s (3
0 m
emb.)
+ S
up
ervi
sory
boar
ds
(9)
PA
RL
IAM
EN
T
INSU
RE
E
EM
PL
OY
EE
CIT
IZE
NS
MIN
IST
RY
of
FIN
AN
CE
MIN
IST
RY
of
LA
BO
R a
nd
SO
CIA
L A
FF
AIR
S
ME
DIC
AL
CH
AM
BE
RS
Exp
ert
com
mis
sion
s
Met
hod
ical
gu
idan
ce
Info
rmat
ion
Ad
min
istr
atio
n
Co
mp
lain
s: M
ed.C
ham
ber
s, M
oH
,In
sura
nce
Fu
nd
s, R
egio
nal
Au
th.
Sup
ervi
sory
boar
d o
nly
CONTRACTS
Qu
alit
y, c
om
pla
ints
,p
rofe
ssio
nal
co
mp
eten
ce
LICENCESfor non-stateHC facilities
GA
UR
AN
TE
Eo
f ca
re f
or
citi
zen
s
RE
GIS
TR
AT
ION
Bas
ed o
n l
icen
ses
DIS
TR
ICT
HY
GE
NIC
ST
AT
ION
Good practice guidelines
CA
RE
ST
AN
DA
RD
S
GO
OD
PR
AC
TIC
E
Fo
un
der
Fo
un
der
Sel
f-go
vern
ing
bod
y
AD
MIN
IST
RA
TIO
N

270
D E C E N T R A L I Z AT I O N I N H E A LT H C A R E
AN
NEX
8: O
rgan
izat
ion
of H
ealt
hcar
e Pr
ovid
ers
as o
f 20
03
Sourc
e:
© C
zech
Ass
oci
atio
n f
or
Hea
lth
Ser
vice
s R
esea
rch
, 2003.
Stom
atolo
gist
s
1 p
er 1
,700 i
nd
ivid
ual
s
GP
’s f
or
chil
dre
n
1 p
er 1
,050 c
hil
dre
n 0
–14
Hom
e C
are
477 a
gen
cies
1,9
00 lic
ense
d n
urs
es
GP
’s g
ynae
colo
gist
s
1 p
er 4
,400 w
om
en 1
5+
PR
IVA
TE
Am
bu
lato
ry s
pec
iali
sts
7,6
72 p
hys
icia
ns
Am
bu
lato
ry s
pec
iali
sts
in
ou
tpat
ien
t d
ept.
of
hosp
ital
s
7,3
53 p
hys
icia
ns
66,6
68 b
eds
in 2
01 h
osp
ital
s
8,7
43 p
hys
icia
ns
in w
ard
s
1,9
00
Ph
arm
acie
s
86 I
nst
itu
tes
of
Pu
bli
c H
ealt
h
645 p
hys
icia
ns
68
Bal
neo
logi
cal h
ealt
h r
esort
s
343 p
hys
icia
ns
22,9
72 b
eds
237
Spec
iali
zed
th
erap
euti
c in
stit
ute
s
1,0
38 p
hys
icia
ns
23,3
52 b
eds
201 GENERAL HOSPITALSH
OSP
ITA
L C
AR
E
Pre
ferr
ed d
irec
tion
s
Oth
er d
irec
tion
s of
refe
rral
s
Ref
erra
ls, P
atie
nt’s
moti
on
GP
’s f
or
adu
lts
1 p
er 1
,650 a
du
lts
15+

271
D E C E N T R A L I Z AT I O N A N D G O V E R N A N C E O F H E A LT H C A R E I N T H E C Z E C H R E P U B L I C I N T H E 1 9 9 0 S
AN
NEX
9:
Publ
ic A
dmin
istr
atio
n an
d Lo
cal G
over
nmen
t as
of
2003
Sourc
e:
© C
zech
Ass
oci
atio
n f
or
Hea
lth
Ser
vice
s R
esea
rch
, 2003.
CO
NS
TIT
UT
ION
AL
CO
UR
T
SU
PR
EM
EC
OU
RT
PR
ES
IDE
NT
Ele
cted
by
Par
liam
ent
for
5 y
ears
(2002)
GO
VE
RN
ME
NT
PA
RL
IAM
EN
T
HO
US
E o
fR
EP
RE
SE
NT
AT
IVE
S200 M
Ps
Ele
ctio
n f
or 4
yea
rs(2
002)
SE
NA
TE
81 S
enat
ors
Ele
ctio
n f
or 6
yea
rs(1
/3 e
ach 2
nd y
.)M
INIS
TE
RS
UP
PE
R C
OU
RT
S
RE
GIO
NA
L C
OU
RT
S
Dis
tric
t co
urt
s
ADMINISTRATIVE JURISDICTION
JUD
ICIA
RY P
OW
ERLE
GIS
LAT
IVE
POW
EREX
ECU
TIV
E PO
WER
Stat
e adm
inist
ratio
n
Dis
tric
tb
ran
ches
Exe
cuti
on
of
sele
cted
Stat
e A
dm
inis
trat
ion
Exe
cuti
on
of
Stat
e A
dm
inis
trat
ion
Com
mis
sion
ed a
ctiv
itie
sof
the
Stat
e A
dm
inis
trat
ion
MA
YO
RC
ou
nci
lPR
ESID
EN
TC
ou
nci
l
MA
YO
RC
ou
nci
l
Min
istr
yof
Inte
rior
MA
YO
RC
ou
nci
l
CA
PIT
AL
PR
AG
UE
ASSE
MB
LY
13
RE
GIO
NS
RE
GIO
NA
L A
SSE
MB
LY
elec
ted
for
4 y
ears
(2002)
Reg
. offi
ce
elec
tion
elec
tion
59
3 C
om
mis
sio
ned
Co
mm
un
itie
sL
OC
AL
ASSE
MB
LY
elec
ted
for
4 y
ears
(2002)
elec
tion
5,6
51
Co
mm
un
itie
sL
OC
AL
ASSE
MB
LY
elec
ted
for
4 y
ears
(2002)
CI
TI
ZE
NS
–V
OT
ER
S
SELF–GOVERNMEAL POWER
App
rova
l by
Sen
ate
COMMUNITIES76 DISTRICTSREGIONSREPUBLIC
LEVEL of STATE ADMINISTRATION
Fu
nct
ion
al h
iera
rch
y
Ele
ctio
n b
y boar
d
Ele
ctio
n b
y vo
ters
Ap
poin
tmen
t