decentralization and the budget for … · 2.4 social welfare provision in context of thai state...
TRANSCRIPT

Thailand
Faculty of Economics,Thammasat University
National Economic andSocial Development Board
DECENTRALIZATION AND
THE BUDGET FOR SOCIAL SERVICES
AT TAMBON ADMINISTRATIVE
LEVEL

ISBN: 978-974-466-441-9
Copyright: Economic Research and Training Center (ERTC)
Faculty of Economics, Thammasat UniversityAny part of this may be freely reproduced with the appropriate acknowledgment.
Design and layout: FSPNetwork company limitedPrinted in Thailand
Economic Research and Training Center (ERTC)
Faculty of Economics, Thammasat University
2 Prachan Road, Bangkok 10200, ThailandTel: 0-22240147-9 / 0-841545911
Fax: 0-22240146
E-mail: [email protected]
Cover images: © UNICEF Thailand /2009/M Thomas© UNICEF Thailand /2009/C Kanoknan
© UNICEF Thailand /N Rodraksa

Economic Research and Training CenterFaculty of Economics, Thammasat University
National Economic and Social Development Board
Supported by
UNICEF Thailand
DECENTRALIZATION AND THE BUDGETFOR SOCIAL SERVICES AT
TAMBON ADMINISTRATIVE LEVEL
Thailand

© U
NIC
EF
Tha
iland
/200
9/M
Tho
mas
TABLE OF CONTENTS
Table of Contents iv
List of Tables vi
List of Figures viii
List of Abbreviations ix
Chapter 1 Introduction 1-11.1 The Need to Follow Up Decentralized Budget and Social Spending 1-2
1.2 Objectives of this Study 1-4
1.3 Scope of the Study 1-5
Chapter 2 Decentralization Theoretical Framework and 2-1Selected Literature Review
2.1 What is Decentralization? 2-3
2.2 Definitions of Social Welfare and Social Services 2-7
2.3 New Approaches to Social Service Provision: Public Sector and 2-8
Community-Based Groups
2.4 Social Welfare Provision in Context of Thai State 2-10
2.5 Selected Review of Decentralization in Thailand and 2-12
Suggested Theme of Research
Chapter 3 The Structure of Thailand’s Public Administration and 3-1Decentralization Context
3.1 The Structure of Thailand Public Administration 3-2
3.2 Decentralization in Context of Thailand 3-3
3.3 Recent Change of Fiscal Decentralization in Thailand 3-8
Chapter 4 Analysis of Budget Flows 4-14.1 Structure of Budget Flow Path to LGUs 4-5
- The Budget Flows from the Department of 4-9
Local Administration (DLA)
- The Budget Flows from the PAOs 4-12
- The Budget Flows from the Line Ministries 4-12
- The Budget Flows from the Provincial Level 4-13
4.2 On the Local Government Revenue 4-10
4.3 On the importance of General Grant 4-13
Chapter 5 Availability of Budget Resources within the TAOs’ Boundary: 5-1Lessons Learned from the 13 Selected TAOs
5.1 Criteria to Select the Sampled TAOs 5-2
5.2 Budget Flow and Sources of Fund Providing Social Services 5-3
in the TAOs
5.3 The Transfer of Child Care Center and Education Services to TAOs 5-12
5.4 The Education Budget Allocation to TAOs 5-14
5.5 The Transfer of Public Health Service to TAOs 5-18
5.6 The Public Health Budget Allocation to TAOs 5-20
5.7 The Proportion of Social Service Budget 5-29
5.8 The Transfer of Elderly and People with Disabilities Care to TAOs 5-33
5.9 The Other Sources of Budget Allocation to TAOs 5-34
Chapter 6. Results from Field Survey and Factors for Successful 6-1Administrative and Budgetary System
6.1 Public Understanding of the Duties of the TAO 6-2
6.2 Public Impression of the TAO’s Involvement 6-5
in Improving Social Services
6.3 People’s Assessment of Current Local Problems 6-7
6.4 Public Participation in the Recent Election 6-9
6.5 Public Participation in Proposing Annual Plan or Projects to TAOs 6-12
6.6 Public Participation in Implementing TAO Project 6-14
6.7 Public Participation in TAO-Organized Activities 6-16
Chapter 7. Factors for Successful Administrative and Budgetary System 7-17.1 Framework for TAO’s Successful Administrative and 7-2
Budgetary System
7.2 TAO’s Administrative and Budgetary Models 7-5
7.3 The Relationship between the Level of Public Satisfaction and 7-11
Public Participation
7.4 The Relationship between Public Satisfaction and 7-12
Per Capita Expenditure for Social Service Functions
7.5 Best Practices for Successful TAO Performance in Administration 7-13
and Budgeting
7.6 Synthesis 7-17
Chapter 8. Conclusions and Policy Recommendations 8-18.1 Summary of Findings 8-4
8.2 Policy Recommendations 8-7
List of References
Appendix A. The Interim Government Policies towards Decentralization A-A
Appendix B. Description on Live Well and Happily Development Strategy A-B
Appendix C. Details of Social Service Budget Passed through PAOs A-C
Appendix D. Questionnaire A-D
iv v

vi vii
LIST OF TABLES
Table 3.1 Functions to be Transferred to Local Administrative, 3-5
Classified into 6 Broad Categories and by Type of Work
Table 3.2 List of the Social Welfare Functions to be Transferred to LGUs 3-6
Table 4.1 Budget Allocation at National Level, FY2003-FY2007 4-3
Table 4.2 Social Service Expenditure of Various Ministries at 4-4
Provincial Level (exclude Bangkok), FY2004-FY2006
Table 4.3 Budget for Provincial Area 4-10
Table 4.4 Grant Allocation to LGUs, FY2000-FY2007 4-12
Table 5.1 Division of TAOs for Field Survey 5-2
Table 5.2 Aggregate Financial Resources on Social Services through 5-4
the Sampled TAOs, 2006
Table 5.3 On-Budget of the Sampled TAOs 5-6
Table 5.4 Off-Budget of TAOs 5-7
Table 5.5 Share of On-Budget and Off-Budget for Social Services of 5-8
the Sampled TAOs in 2006
Table 5.6 Budget from PAOs, Total Amounts and Their Share of 5-9
Aggregate Budget, 2004-2006
Table 5.7 Budget from Line Ministries, Total Amount and 5-10
its Share of Aggregate Budget, 2004-2006
Table 5.8 Disaggregation of Central Expenditure Program at 5-11
TAOs Level, FY 2006
Table 5.9 Number of Schools transferred to the LGUs under 5-14
the Account II Program
Table 5.10 Educational Budgets Allocated by Various Ministries and 5-15
its Share of Total Social Services Expenditure
Table 5.11 Proportion of Public Health Budget Allocated 5-21
by Various Ministries Compared with all of Social Services
Table 5.12 Health Volunteers’ Budget, 2004 to 2006 5-22
Table 5.13 Number of Health Volunteers and Health Volunteers 5-24
Budget in the Selected 13 TAOs
Table 5.14 Number of Expected Health Volunteers to the Current 5-25
Number of Volunteers in TAOs’ Boundaries
Table 5.15 Proportion of Social Security and Welfare Budget 5-29
Table 5.16 Proportion of Housing and Community Service Compared 5-30
with all of Social Services
Table 5.17 Budget Allocation for Religion, Culture and Recreation Services 5-32
Table 5.18 Budget Allocation from SML & CEO Governor 5-35
Table 6.1 People’s Understanding of the Duties of the TAO 6-4
Table 6.2 Public Impression of the Sampled TAOs’ Involvement in 6-6
Improving Social Services
Table 6.3 People’s Assessment of Current Local Problems 6-8
Table 6.4 Cross Tabulation Among Socio-Economic Factors and People 6-10
Participation in TAO Election
Table 6.5 Cross Tabulation Among Socio-economic Factors and Public 6-13
Participation in Proposing Annual Plan or Projects to TAO
Table 6.6 Cross Tabulation Among Socio-Economic Factors and 6 -15
Public Participation in Implementing TAO projects
Table 6.7 Cross Tabulation Among Socio-Economic Factors and 6-17
Public Participation in TAO Organized Activities
Table 7.1 Factors for Successful Performance in Administration and 7-16
Budgeting Following the TAPE Framework

viii
LIST OF FIGURES LIST OF ABBREVIATIONS
Figure 2.1 Definition of Social Welfare 2-7
Figure 2.2 Network of Social Welfare Provision 2-9
Figure 3.1 Administrative Structure of the Royal Thai Government 3-3
Figure 4.1 Budget Flow Paths to TAOs and Community Level 4-6
Figure 4.2 Size of Local Government Revenue 4-11
Figure 4.3 Local Revenue Structure 4-11
Figure 4.4 Share of Grant Allocation to LGUs 4-13
Figure 4.5 Grant Allocation to PAOs, Municipalities, and TAOs through 4-13
DLA Classified by Grant Types
Figure 4.6 How General Grants are allocated 4-14
Figure 7.1 Gap between Citizen Demands and Government Resources 7-3
and Capacities
Figure 7.2 The Relationship between the Level of Satisfaction of People 7-12
and Level of Participation
Figure 7.3 The Relationship between People Satisfaction and Per Capita 7-13
TAO’s Expenditure Budget on Social Services
Box 1 Example of Budget Flow to Schools in TAOs’ Area 5-16
Box 2 The Role of Public Health Volunteers and Procedures of 5-27
Decentralized Public Health Care Budget
BMA The Bangkok Metropolitan Administration
DOLA Department of Local Administration
LGU Local Government Unit
NDC National Decentralization Committee
NGO Non-Governmental Organization
PAO Provincial Administrative Organization
TAO Tambon Administrative Organization
ix

CHAPTER1INTRODUCTION
© U
NIC
EF
Tha
iland
/200
9/M
Tho
mas

chapter 1
DECENTRALIZATION AND THE BUDGET FOR SOCIAL SERVICES AT TAMBON ADMINISTRATIVE LEVEL Introduction
chapter 1
1.1 THE NEED TO DECENTRALIZE BUDGET AND SOCIAL SPENDING
The public sector in Thailand has undergone dramatic changes since the Constitution of
1997 mandated certain public sector reforms. One mandate was the decentralization and
devolution of certain responsibilities from central agencies to local governmental units (LGUs).
Another mandate involved certain political reforms in accordance with democratic
principles, including new election rules (both national and local), new ways of voting (e.g.
proportional voting and the introduction of party-list MPs), and government support for
political parties. The Constitution recognizes people’s right to question politicians and their
right to propose laws or amendments. New institutions were introduced as “independent
and neutral” public organizations to ensure fair elections and prevent corruption.
The Constitution of 1997 mandated the creation of a national body to take responsibility for
fiscal reform in accordance with the principle of decentralization. Two years later, the
Decentralization Act of 1999 created the National Decentralization Committee, which
specified the functions to be devolved from central government agencies to local
authorities, as well as the process and time-frame for doing so. Specifically, 245 functions
were chosen to be devolved within 10 years.1 To support a smooth transition, the
decentralization plan specified the transfer of both fiscal and other resources to local
governmental units from central governmental agencies. The decentralization plan states
that the local governments, in total, should command not less than 35 percent of the
government’s net revenue by the end of 2006.2
Naturally, LGUs usually allocated a major portion of their budget to public infrastructure
such as roads and buildings, with only small portion to social services. This may be
attributed to limited infrastructure investment of government in rural and remote areas in
the past. Nonetheless, the spending patterns of LGUs are not static and can change over
time according to social needs. Analysts have noted that the budget composition of LGUs in
the future may not follow previous trends. The demand for public infrastructure may
decrease over the course of development while the demand for social services may
increase. The demand is particularly intense in the areas of human capital development,
health, and welfare. Everybody recognizes higher education as the way to increase human
productivity. Children want to have a decent school nearby and desire the opportunity to
learn computer skills and foreign languages. Women are seeking work outside the home to
supplement family income. The elderly are living longer and want decent health care. The
fact that the percentage of elderly is increasing over time poses another challenge to local
governments in Thailand.
- 2 - 3
1 At the time of writing (mid-2006) there are signs that a) devolution of functions from central to local
governments will not meet the target, about 180 tasks have been transferred and some 65 tasks still in hands of
central government agencies; and b) the revenue assignment to local governments in total may be about
26 percent of the central government revenues – which is far from the target of 35 percent.2 The prefix ‘net’ revenue is used here to distinguish between the ‘gross’ and ‘net’ revenue concepts and for the
sake of precision. A portion of tax revenue must be refunded (for instance, the value added tax in the case of
exports), in this sense, the collected revenue will be overestimated to a certain extent.
3 A quotation from Reddy (2001, p.111) reads, “a widespread claim in recent years has been that the devolution
of authority and responsibility for the provision of services within states, to lower levels of government, is likely
to enhance the quality and cost-effectiveness of services. The rationales which have been provided for this view
include the argument that lower levels of government are more likely to be effectively held to account by service
recipients, and that services provided by local government can better reflect variations in local delivery
conditions and community preferences. However, there is also reason for expressing some caution about the
conception that decentralization can be a panacea, and to qualify the conditions under which it is likely to be
effective.”
Public infrastructure tends to be at the top of the TAOs’ agenda in the beginning. Yet over
the course of development, the share of the budget allocated to social services may be
expected to increase. There are, however, differences in the patterns of expenditure.
Institutional and cultural factors such as leadership style may account for such differences.
New initiatives and new types of service delivery may be introduced by leading local
agencies. This is the subject of a study by a research team under the supervision of Charas
Suwanmala and Somchai Ruechupan, supported by the Thailand Research Fund.
Innovative local administrators might have taken some risks while hundreds of other local
managers chose to take a conservative wait-and-see approach– only to adopt changes after
seeing the success of their forerunners. Some LGUs were able to draw upon additional
resources from other sources, such as the private sector, civic groups, NGOs and the
provincial CEO provincial.
The decentralized budget in the area of social development is of particular interest to social
scientists, especially those who would like to trace its effect on the quality of life of children,
the elderly, and disadvantaged groups. How LGUs interact with other local agencies,
including community groups, NGOs, and business forums is highly interesting to social
scientists. Part of this study will try to learn about the management of TAOs in providing
social services. How the government budget flows to local units and how the funds are
utilized by different TAOs are also among the subjects of interest. Considering the
thousands of LGUs in Thailand, we should expect to see variety in implementation due to
geographical, social, and cultural differences between regions. Differences in the state of
development may be another factor causing differences in the budget allocation.
The decentralized budget in the area of social services is of particular interest as these
budget items are closely related to people’s quality of life. In principle, decentralization will
enhance the efficiency of public services; theorists predict that local governments will
provide more efficient services.3 This assumes a degree of accountability, demand-
responsiveness, and a competitive atmosphere within the local administration. Therefore,
an empirical study that examines what actually happens in the field is desirable. Findings
from empirical research would be useful for policy makers, planners, and central
monitoring agencies.
Since local government units are given a more prominent role under the decentralization
program, it is important to keep track of how LGUs adapt to meet society’s expectations.
How LGUs cooperate with other government agencies and community-based groups is also
interesting to follow. Another area of interest is improvements in the capacity of LGUs, i.e.
innovative management, and their social impact. Since the Decentralization Act of 1999
the budget allocation to support local government increased rapidly, largely in the form of
intergovernmental grant.

chapter 1
DECENTRALIZATION AND THE BUDGET FOR SOCIAL SERVICES AT TAMBON ADMINISTRATIVE LEVEL Introduction
chapter 1- 4 - 5
1.2 OBJECTIVES OF THIS STUDY
This study attempts to examine the decentralized budget with particular reference to social
service expenditures based on primary survey data and secondary empirical data. The
study employs both a quantitative analysis of decentralized budget and qualitative
investigation based on case studies of Tambon Administrative Organizations (TAOs).4
The objectives of this study are:
1. To investigate the implementation of decentralization in Thailand with emphasis
on the changing role of LGUs as social service providers. Since the term “social
services” can be interpreted differently, it is desirable to define the term as
precisely as possible. In this context, we adopt the UN definition of social services
which encompasses education, health, water and sanitation, family planning, and
nutrition. It has been suggested that we allow for a second definition, the national
definition of social services. We compare the functions devolved to TAOs under the
national definition with the general definition of social services such as given by
the United Nations, and the Ministry of Social Development and Human Security.
2. To obtain an insight into the devolution of functions/responsibilities and how the
government has allocated the fiscal resources to LGUs for social services. Both
revenue transfer and grants support LGUs, ensuring that social service
expenditures are well-distributed across the country, i.e. to both poor and rich
regions.
However, some social services are still performed by central government agencies.
Therefore, it is important to keep track of the social service provided on both the
national- and local- levels to see the whole picture. The study will determine which social
services functions are provided by each type of local organizations, i.e. PAOs,
municipalities, and TAOs.
3. To obtain an insight into the total budget available for social services delivered by
TAOs. TAOs are selected for our case study as they are relatively new compared to
other LGUs (TAOs were established in 1995 or later), and they are important by
sheer numbers (there are nearly 7,000 units). How TAOs perform as providers of
social services, how they make use of the decentralized budget, and how they
mobilize additional financial resources are all interesting subjects. Another
subject is how they cooperate with other entities, including community-based
4 Tambon is a sub-district administration unit under supervision of Amphur (District), normally one Tambon
comprises of 10-20 villages; the population of an average Tambon may be around 5,000 people. In the Thai
context, TAOs are generally assumed to be “rural” whereas municipality is an “urban” area – yet that is only
a rough guideline. It may be true many Tambons might be properly characterized as urban, especially those
adjacent to municipalities. In fact, a dichotomy between rural and urban can be imprecise given the fact that
urbanization has been progressing over time. To provide a sketch of local administration in Thailand, it would
be useful to consider the following figures: there are over 6,900 units of TAOs but only about 1,200
municipalities and 75 provincial administrative organizations, and 2 special types of local administration. It is
safe to say that TAOs are important institutions responsible for the provision of public services to about
two-thirds of Thai citizens, especially those in rural areas.
5 SML refers to small-medium-large sizes of loan projects provided to villages depending on sizes of villages.
This policy was initiated during the Taksin administration.
groups. It is commonly expected that the demand for social services increases over
the course of development and that the demand for public infrastructure may
saturate after some point. In economic terms, demand for social services is
income-elastic. Thus, we are expecting to see a higher percentage of the budget
allocated to education, health, welfare programs, and the social safety net.
Another objective is to study the alternative sources of financing, through LGUs
collaboration with other agencies or other TAOs, or NGOs. The process of
collaboration and how community-based groups participate in LGUs’ activities will
be documented. This part may be difficult to state in quantitative term but can be
plausibly described in qualitative terms. The “nation of an area-baseddevelopment” has gained public recognition, as evidenced by the large number of
new development programs under the rubric of “empowerment program,” e.g.,
the village funds, annual budget support of village under “SML.”5 Along with
administrative and fiscal decentralization, there has been another development in
the regional administration under the program called the “Chief Executive Officer
(CEO)-provincial governor.” These programs have caused a jump in the budget
available for “area-based” agencies. In the new institutional setting, there may be
budget sharing and joint activities between LGUs and other institutions. In
symbols, the total budget is xi + xi’, where xi is the social budget transferred from
central agencies to support LGUs’ activities and xi’ stands for the additional fiscal
resource that LGUs obtain from other institutional partners, for instance, the CEO-
provincial administration and community-based funds.
1.3 SCOPE OF THE STUDY
1. The research team will conduct documentary research into the decentralizationpolicy in Thailand, including the devolution of authority and transfer of fiscal
resources to support local governance. A dynamic overview of the local
government role will be presented, i.e. the relative size of local government before
and after the Constitution of 1997. Recalling recent institutional changes, most
TAOs were established after 1995 (after the TAO Act 1994), and in 1999 nearly
1,200 of the Sanitary Districts had their status upgraded to “Tambon
Municipalities.” The Constitution of 1997 strengthened all types of local
administration and their revenues have increased rapidly since 2001. There has
been an increase in general grants, which TAOs are free to spend however they
choose–yet, there are some conditional grants that come with specific
responsibilities. It is fair to say that TAOs generally have the autonomy to spend
their resources as they choose, so social investment and budget allocation may
differ accordingly from one TAO to another.
2. The research team will investigate the flow of government funds to the TAO levelthat support the delivery of social services. One area of interest is how the TAOs
changed their services over the past five years in quantitative and qualitative terms.

chapter 1
DECENTRALIZATION AND THE BUDGET FOR SOCIAL SERVICES AT TAMBON ADMINISTRATIVE LEVEL Introduction
chapter 1- 6
Public participation is one of the key feature that should be promoted so that the
services provided by TAOs are relevant and in accordance with the needs of local
citizens. TAOs can also play the role of catalyst to promote trust and networking
among people in community. TAOs may cooperate with civic groups or NGOs.
There may be additional funds and financial support for TAO’s activities through
cooperation with other agencies. Thus, the research team shall investigate and
document (from case studies in the field) how stakeholders are involved in the
provision of social services at sub-national levels.
3. The research team will document the budget spent by TAOs, especially the budget
spent on social development. This covers the decentralized budget that supports
TAOs and the actual spending by TAOs on social services.
4. The research team shall conduct case studies on 13 TAOs (from 4 regions, viz.,
North, Northeast, Central, and Southern regions) to gain an insight into the budget
allocations and how the TAOs performed their activities. Another area worth
investigating is the utilization of services, i.e. whether the activities initiated by
TAOs met the needs of people, and to what extent people actually participated.
Thus, the research team may assess the social impacts of service delivery by TAOs.
The study is concerned primarily with children, women, the elderly, and
disadvantaged groups. The research team will act as facilitator and coordinator
among the case study TAOs to exchange learning experiences, by organizing
forums and focus group meetings in each region between the team and TAOs’
administrative body.
5. After data collection, analysis and synthesis, the research team will provide policy
recommendations and guidance for the use of decentralized budgets with respect
to social development. The case studies of the best-practice TAOs may reveal
useful lessons and examples for other TAOs: how best to make use of the budget
to support carefully designed social development projects, how to avoid
duplicating mistakes (if any), and how best to stimulate public participation in the
TAO’s activities.
The research team shall take a role of facilitator to garner trust and cooperation between
TAOs and civil society organizations, private sector organizations, and community leaders.
Mutual understanding and learning is an important factor in promoting further
cooperation. There may be alternative financial resources to support further social
development considered relevant and important by the community. Smooth management
and development must build upon trust and social capital existing within the community,
but it needs to find the right way to mobilize them.
CHAPTER2DECENTRALIZATION
THEORETICAL FRAMEWORK
© U
NIC
EF
Tha
iland
/Y R
atar
asar
n

chapter 2
DECENTRALIZATION AND THE BUDGET FOR SOCIAL SERVICES AT TAMBON ADMINISTRATIVE LEVEL Decentralization Theoretical Framework
chapter 2- 2 - 3
Decentralization has been considered a mechanism of public reform that would improvethe quality and effectiveness of services delivered by the government in many developingcountries. The decentralization initiative has received strong support from internationalorganizations. Many developing countries have begun to transfer fiscal and adminsitrativeauthority from the central government to lower levels of government. The reasons fordecentralization vary from country to country, as have the planning and policyarrangements for decentralization. The diversity of political structures, economicdevelopment, and institutional and social factors make it difficult to design a universalsolution to decentralization for all countries. However, the fundamental characteristic ofdecentralization in every country is the basic design of the program, namely, whatdecentralization is and what its scope will be. This section discusses basic similarities ofdecentralization in developing countries which set the policy framework to be extended toThailand.
Decentralization can simplify complex bureaucratic procedures, and can increasegovernment officials’ sensitivity to local conditions and needs. Moreover, decentralizationcan help national government ministries reach a larger numbers of local areas withservices; allow greater political representation for diverse political, ethnic, religious, andcultural groups in decision-making; and relieve top managers in central ministries ofroutine tasks, allowing them to concentrate on policy. In some countries decentralizationmay create a geographical focus on the local level, coordinating national, state, provincial,district, and local programs more effectively, and provide better opportunities for localresidents to participate in decision-making. By allowing local experimentation,decentralization may lead to more creative, innovative, and responsive programs. It canalso increase political stability and national unity by allowing citizens to have better controlover public programs at the local level. But decentralization is not a panacea, and it doeshave potential disadvantages.
A drawback of decentralization is that it can result in the loss of economies of scale and ofcontrol over scarce financial resources by the central government. Weak administrative ortechnical capacity at the local level may result in services being delivered less efficientlyand effectively in some areas of the country. Administrative responsibilities may betransferred to the local level without adequate financial resources, making equitabledistribution or provision of services more difficult. Decentralization can sometimes makecoordination of national policies more complex and may allow functions to be captured bylocal elites. Project and program planners must be able to assess the strengths andweaknesses of public and private sector organizations in performing different types offunctions.
The success of decentralization depends on proper training in decentralized administrationfor both national and local officials. Local governments often require technical assistance,as well as assistance from local non-governmental groups in the planning, financing, andmanagement of decentralized functions.
Centralization and decentralization are not mutually exclusive conditions. In mostcountries an appropriate balance between centralization and decentralization is essentialto the effective and efficient functioning of the government. Not all functions can or shouldbe financed and managed in a decentralized fashion. Even when the national government
decentralizes responsibilities, it usually still sets important policies and adopts a moresupervisory role. The government must create or maintain the conditions that enable localunits of administration or nongovernmental organizations to take on more responsibilities.Central ministries will have crucial roles in promoting and sustaining decentralization bydeveloping appropriate and effective national policies and regulations for decentralizationand strengthening local institutional capacity to assume responsibility for new functions.
2.1 WHAT IS DECENTRALIZATION? 1
Traditionally, decentralization in developing countries has been economic: reforms havefocused largely on increasing the role of the market in the economy and using the publicsector to promote development as well as provide services. Now, however, decentralizationin developing countries is increasingly political: public reforms have aimed at devolvingauthority over government functions to subnational authorities. Decentralization is thusa broad term encompassing a variety of institutional relationships. The definition ofdecentralization as given by Rondinelli (1999) is
[the] transfer of authority and responsibility for public functions from the centralgovernment to subordinate or quasi- independent government organizations or theprivate sector–covers a broad range of concepts. Each type of decentralization–political, administrative, fiscal, and market–has different characteristics, policyimplications, and conditions for success.
The policy makers of the national government must carefully consider these factors beforedeciding whether to reorganize financial, administrative, or service delivery systems.
Thus, there are many types of decentralization that can appear in different and possiblyoverlapping forms. Types of decentralization are:
1. political decentralization;2. administrative decentralization; and3. fiscal decentralization.
1. POLITICAL DECENTRALIZATION
Political decentralization gives local citizens and their elected representatives more powerin local decision-making. Sometimes political decentralization is viewed as tool to supportdemocratization by giving citizens or their representatives more influence in formulatingand implementing policies. The fundamental argument for political decentralization is thatgreater public participation in decision-making leads to a better-informed citizenry anddecisions that are more relevant to the diverse interests of the public than those that wouldbe made nationally. This argument assumes that the selection of representatives from localelectoral jurisdictions allows people to better know their political representatives, whobetter know the needs and desires of their constituents. Political decentralization alone,however, can not guarantee the efficiency and accountability of local representatives.Strengthening the participation of both individuals and interest groups is necessary to counterbalance the influence of local politicians.
1 This section draws heavily from Rondinelli, Dennis, “What Is What is Decentralization,” in Concept of FiscalDecentralization and Worldwide Overview Topic 1, Decentralization Briefing Notes, World Bank, 1999.

chapter 2
DECENTRALIZATION AND THE BUDGET FOR SOCIAL SERVICES AT TAMBON ADMINISTRATIVE LEVEL Decentralization Theoretical Framework
chapter 2
2. ADMINISTRATIVE DECENTRALIZATION
Administrative decentralization aims to assign responsibility for providing various servicesamong the different levels of government. Even the planning, financing, and managementof certain functions can be devolved from the central government to the local level.Administrative decentralization basically has three major forms: deconcentration,delegation, and devolution (each with different characteristics).
3. FISCAL DECENTRALIZATION
Fiscal decentralization is a core component of decentralization. It can be used as anindicator of how far decentralization has progressed. If local governments are to carry outdecentralized functions effectively, they must have adequate revenue–raised locally ortransferred from the central government–as well as the authority to make expendituredecisions. Fiscal decentralization can take many forms, including:
• Self- financing or cost recovery through user charges;• Co-financing or co-production, in which users participate in providing services
and infrastructure through monetary or labor contributions;• Expansion of local revenue capacity through locally levied taxes;• Intergovernmental transfers of revenue from taxes collected by the central
government to local governments for general or specific uses;• Guaranteed loans to local governments
In many developing countries local governments or executive units possess the legalauthority to impose taxes, but the tax base is so weak and the dependence on centralgovernment subsidies so immense that no attempt is made to exercise that authority. Suchpractices might undermine the philosophy of decentralization. If local governments are notfinancially self-reliant and must depend on revenue from the central government, they canlose their autonomy since such revenue often has spending conditions attached to it.
Fiscal decentralization has emerged as the focus of public sector reform in manydeveloping countries. However, there is little theoretical literature that attempts toconceptualize the issue broadly or comparatively accoss the developing world.2 Thescarcity of research reflects the small fiscal role local government has traditionally playedin most developing countries. Also many developing countries, particularly in Asia, havebeen highly centralized. Local government was recently introduced through colonizationand development assistance.3 Developing countries that launch a decentralization programoften face slow progress. Decentralization may be discouraged by the national developementplan if it is strategically based on central planning, large scale investment, andindustrialization to capture economies of scale and promote of economic growth. As resultfiscal decentralization is often neglected from the national policy agenda.
Changing political and economic conditions have induced many developing countries tobegin decentralization programs. Shortfalls in economic development and inequality in thedistribution of benefits from national economic development are part of this trend.Additionally, many developing countries have realized that the inefficient performance of
the public sector has created fiscal problems for national development. There are at leastthree economic explanations for this trend towards fiscal decentralization:
1. Economic efficiency: in countries with significant variations in economic, social,or environmental conditions, the central government would likely fail to provideservices that would match local conditions. Yet under decentralization, thegovernment can adjust public service expenditures to suit local preferences in away that it could not under centralization. Local government thus becomes anagent that provides relevant services to identifiable recipients.
2. Revenue mobilization: local government has a comparative advantage inaccessing some parts of the tax base, particularly property taxes and user charges.In addition, the property tax also serves as proxy for benefits received for localservices. Thus the property tax can be used as a price to match the value of theservice to the area with the cost of the service.
3. Better cooperation and coordination: the pricing of local services through localtaxation not only makes public service more efficient but it can also stimulate newpractices in management, particularly cooperation among administrators indelivering services. Local administrators have an incentive to lower the cost ofservices by cooperating with other local governments. This is relevant in countrieswhere there are many and small local government units.
The design of a new fiscal decentralization program must consider certain key elements.These include:
1. an adequate environment enabling decentralization;
2. the strengthening of financial capacity by assigning proper revenue sources forlocal government;
3. assignment of an appropriate set of local government functions;
4. an adequate intergovernmental fiscal transfer system; and
5. adequate access to capital markets for borrowing or issuing bonds.
An adequate environment enabling decentralization begins with a legal framework ateither the consitutional or legislative level. The legal framework must provide certain rightsand responsibilities and a minimum level of autonomy for local government. In other words,the decentralization program must be built upon an adequate legal foundation. However,a legislative mandate by itself cannot guarantee a successful fiscal decentralizationprogram. There are many other factors including national political will, resistance from thebureaucratic system, public understanding, etc.
The strengthening of local governments’ financial capacity is essential to the success offiscal decentralization. Because local governments must be independent of centralgovernment directives, they should finance their expenditure from their own revenue sourcesas much as possible. Full financial independence may not be neccesary since thegovernment might have certain policies for local governments to follow. However, thereusually are some problems with raising revenue locally. First, the revenue assigned by thecentral government is never sufficient to meet all local requirements. Second, localgovernments rely on unproductive revenue sources that barely cover the cost of collection.Third, there is less incentive to collect local revenue to finance expenditure if localadministrators are afraid of losing political popularity. Fourth, local revenue suffers fromserious design problems which might be too complex and make collection ineffective.
- 4 - 5
2 See, for instance, World Bank (2000), “World Development Report 1999/2000 Entering 21st Century,” World
Bank, Washington D.C.; and Urban Policy and Economic Development: An Agenda for the 1990s, World Bank,
Washington D.C.3 Paul Smoke (2001), “Fiscal Decentralization in Developing Countries: A Review of Current Concepts and
Practice,” U.N. Research Institutes for Social Development, pp. 2.

chapter 2
DECENTRALIZATION AND THE BUDGET FOR SOCIAL SERVICES AT TAMBON ADMINISTRATIVE LEVEL Decentralization Theoretical Framework
chapter 2
The solution is to assign stable revenue sources to local governments which are not incompetition with the central tax base.
The assignment of an appropriate set of local government functions is essential in the initialstages of decentralization. A first step of decentralization, then, is to identify the publicservice responsibilities that should be devolved to local governments. The criteria thatdetermine which functions are to be devolved to local governments are as follows:
1. Functions that provide geographically concentrated benefits should be assigned tolocal governments, such as fire protection, garbage collection and disposal, waterpollution treatment, etc. These services provide benefits only to residents of theimmediate neighborhood or community.
2. Functions subject to economy of scale should be assigned to the level ofgovernment that can provide the economy of scale. Economies of scale usuallyaccrue when a capital-intensive project can spread its cost over a large number ofbeneficiaries. For example, building a sewage plant that serves a wide regionmay be more cost-effective than having each local jurisdiction build its owntreatment plant.
3. Functions should be assigned to the level of government that promotes citizenaccess and public participation. This criterion ensures legitimacy andaccountability of the government in performing a particular function.
4. Functions should be assigned to governments that can effectively manage them.This means that the local governments should have adequate authority andmanagement capability to perform the functions.
The above criteria give us only general view of how to assign public service functions tolocal governments; sometimes there are even conflicting implications for assignment ofgovernmental functions to lower levels of government. The central government must firstdecide the rules and purposes of devolving functions to local government. Once theagreement is made the actual transfer of functions can begin.
An intergovernmental fiscal transfer system is necessary to ensure that local governmentshave adequate financial resources, since their ability to raise revenue rarely meets theirexpenditure needs. The central government can close the gap through intergovernmentaltransfer. It is vital that the central government develop clear objectives and a clear revenuetranfer formula. Policy makers must consider: a) the degree of vertical and horizontalimbalance that the transfer of funds might create; b) the use of transfer money to solveinter-jurisdictional spillovers; c) the use of funds to mitigate the imbalance between fiscalneeds and capacity.
Establishing adequate access to capital markets is essential to local government’sindependence from the central government. There are many sources for local governmentsto finance their expenditure besides central revenue transfer. Possible sources includei) bond financing (once local fiscal integrity is established and capital markets develop);ii) the commercial banking system; iii) a central special purpose bank. Which of theseoptions is appropriate for a country depends on many factors such as the fiscal discipline ofthe local government. The local government should not have free access to financial marketif the rules and regulations controlling borrowing are not properly designed, since it mayaffect macroeconomic stability and crowd out private investment, as has happened in manydeveloping countries.
Fiscal decentralization has escalated in many developing countries along withdemocratization and economic development. The above discussion summarizes theexperience and fundamental procedures of fiscal decentralization applicable to developingcountries. Before a nation can move to fiscal decentralization, it must decide what theappropriate role of the public sector will be in any given case. It makes sense to decidewhich level of government should take responsibility for key public functions. Fiscaldecentralization is appropriate when there are variations in demand for public servicesacross local jurisdictions. But getting the most from fiscal decentralization requires a well-planned and well-designed process integrating all of the factors discussed above.
2.2 DEFINITIONS OF SOCIAL WELFARE AND SOCIAL SERVICES
This study uses the United Nation’s definition of social welfare and social services. TheUnited Nation defines social welfare as those activities that provide for people’s basic needs.Therefore, welfare is a comprehensive system that provides social services that can helpindividuals or groups to meet a basic standard of living, health and social relationships.4
The 20/20 Initiative defines basic social services as basic education, primary health careand family planning, low-cost water and sanitation, and nutrition.
The Thailand Social Work and Social Welfare Development Plan No. 3 (1997-2001) andNo. 4 (2002-2006) give social welfare a broader meaning than the strategic developmentplan which uses a narrower definition, “to assist and to relieve.” The details of bothdefinitions show in Figure 2.1.5
- 6 - 7
4 Rapeepan Kumhom, et al.,, The Directions and Social Welfare System in Thailand, Human Resource Security
and Development, 2005, p. 11.5 Ibid, p.1-2.
Broad Definition
1. Health2. Education3. Housing4. Jobs (to be employed
and earn income.)5. Social Security
- Social Insurance- Social Assistance
6. Entertainment7. Social Services
Social Welfare
Narrow Definition
- Social Assistance- Social Relief
Figure 2.1 Definition of social welfare

chapter 2
DECENTRALIZATION AND THE BUDGET FOR SOCIAL SERVICES AT TAMBON ADMINISTRATIVE LEVEL Decentralization Theoretical Framework
chapter 2
2.3 NEW APPROACHES TO SOCIAL SERVICE PROVISION:PUBLIC SECTOR AND COMMUNITY-BASED GROUPS
Economists are warned to distinguish between normative and positive analysis. Positiveanalysis refers to description and explanation of what is. Yet economic models are oftenbased on theoretical conjecture and on assumptions, which may be unrealistic.Researchers are encouraged to conduct empirical research to verify or to falsify theoreticalconjecture. The Decentralization Principle is a theoretical conjecture that local levels ofgovernment would provide public services more efficiently than would centralizedagencies. However, empirical study is necessary to determine whether the policiesimplemented according to the decentralization principle actually lead to more efficientservices and ultimately a higher standard of living. The school of public choice in particularseverely criticizes multiple dimensions of “governmental failure.” Policy studies by natureare normative in the sense that they state “what ought to be” and “how best to improve thesituation.”
Another school of thought called “New institutional economics” suggests that it is importantto investigate the “institutions” and “players” involved – in our context, that includes TAOs,central government agencies, community-based groups, business groups, and NGOs. Theterm “institution” as used by analysts includes rules, social norms, incentives, (imperfect)information, the perception of agencies, and the relationships between agencies (say,principals and agents).
Past experience tells us that neither market-based nor state-dominated approachseffectively provide solutions to equity and efficiency problems associated with socialwelfare provision.6 Development processes are multidimensional, i.e., they involvecontributions of several service delivery units: state government, local government, theprivate sector, and communities. The interactive roles and structural interdependency amongthese units is an important issue.
As shown in Figure 2.1, there are four main players: state government, local government,private sector organizations,7 and communities. An important feature of the developmentnetwork is that people and communities are at the center of development process. Second,every player has the opportunity to communicate with one another either directly orindirectly via intermediaries. Communication here is used in a broad sense: voice,signaling, resource transfer, and all possible sorts of economic and social interaction.
The goals of social service provision in the development process are as follows:
• To use scarce resources efficiently• To promote equity• To increase community participation in decision-making and development• To devolve a certain degree of fiscal autonomy, roles, and responsibilities to local
government and communities.
Douglas North (2001),8 one of the leaders of the new institutional economics, suggests thateconomic development is not the result of an increase in factor inputs alone; much of thesuccess, based on historical evidence, was due to institutional determinants and culturalheritage. One may raise question: what kinds of institutional framework will produceefficient outcome? North suggests five conditions as follows:
• the continuous interaction between institutions and organizations in the economicsetting of scarcity
• a competition atmosphere that forces organizations to continually invest in newskills and knowledge to survive
• that the institutional framework provides the right incentive structure thatdictates the kinds of skills and knowledge
• that perceptions are derived from the mental constructs of the players• the economies of scope, complementarities, and network externalities of an
institutional matrix
Sacco and Zamagni (2001) employ the notion of civil economy, the role of reciprocity andsocial capital as the social determinants which drive the progress of social development.There seems to be a link between LGUs and “other players” in the tambon, includingcommunity-based groups. Potential gains in efficiency and the quality of living mayresult from:
• Operational efficiency: the supply of social services might perfectly match demand(or need) of the local population. Given local autonomy and the notion that “onesize does not fit all,” we should expect that the supply as provided by LGUs verywell match the demand. Yet, this is only a conjecture – researchers will have toexplore the cases in practice.
- 9- 8
Figure 2.2 Network of social welfare provision
6 For review, see Colclough 1996, Portes 1997, and Reddy and Vandemoortele 1996.7 In our analysis, Non-Governmental Organizations (NGOs) are included in the private sector.
8 Douglas North 2001 “The process of economic change,” in Germano Mwabu, et.al. eds Social Provisions inLow-Income Countries: New Patterns and Emerging Trends, Oxford University Press.
People andCommunity Based
Organization
LocalGovernment
PrivateSector
CentralGovernment

chapter 2
DECENTRALIZATION AND THE BUDGET FOR SOCIAL SERVICES AT TAMBON ADMINISTRATIVE LEVEL Decentralization Theoretical Framework
chapter 2
• Equality of access: social services provided by LGUs are accessible to the localpopulation and the services are fully utilized (i.e. the public participates inactivities)–in other words, programs or projects satisfy the criterion of policyeffectiveness.
• Synergy: the activities conducted by LGUs are complementary or helpful for localpeople and they stimulate joint activities by community members, for example,a team that recycles waste turning it into “gold.”
2.4 SOCIAL WELFARE PROVISION IN CONTEXT OF THAI STATE
Thailand Constitution 2007
Thailand’s 2007 Constitution9, [chapter 3, rights and liberties of Thai people, part 8 and 9(section 49-55)] describes the rights and liberties of Thai people to education, public healthservices and welfare. Every Thai person enjoys an equal right to receive not less than twelveyears of education, provided by state, of acceptable quality, and without charge. Likewise, aperson enjoys an equal right to receive standard public health services, and the indigentshall have the right to receive free medical treatment from public health care centers. Thepublic health service should be provided thoroughly and efficiently. The state is also chargedwith the prevention, and/or prompt eradication, of harmful contagious diseases.
Children and youth shall enjoy the right to receive physical, mental and intellectualdevelopment training in a suitable environment. Children, youth, women and familymembers have the right to State protection from violence and unfair treatment, and a rightto medical treatment or rehabilitation when such violence does occur. Children and youthwith no guardian shall receive appropriate care and education from State.
A person who is over sixty years but with insufficient income to live on has the right topublic welfare payments and access to public facilities. These same rights extend to thedisabled and homeless, of any age, under similar circumstances.
The 2007 Thai Constitution [Section 5, directive principles of fundamental state policies,part 4 (section 80)] also specifies social, public health, education and culture policies. Theseprovisions include:
1. protecting and developing children and youths, promoting childhood nourishmentand education; promoting the equality between women and men, creating,reinforcing and developing family integrity and the strength of communities;providing aid and welfare to the elderly, the indigent, the disabled and thedestitute, both to better their quality of life and to help them to becomeself-reliant.
2. Promoting, supporting and developing a public health system that promotes thepublic’s sustainable health; providing and promoting standardized and efficientpublic health services; encouraging both the private sector and communities inparticipating in health promotion; providing legal protection to qualified healthcare providers;
3. developing quality education systems at all levels in line with economic and socialchanges; preparing the national education plan; providing quality teachers andeducators capable of meeting world standards;
4. promoting and supporting the delegation of powers to local governments,communities, religious organizations and the private sector in order to increasetheir participation in educational management;
5. encouraging and supporting research, and disseminating all research results fundedby the State;
6. encouraging and supporting the common culture of the nation to promote nationalunity, and disseminating and making known the arts, tradition and culture of boththe nation and the localities.
Promoting Social Welfare Provision Act
Originally, the Promoting Social Welfare Provision Act was issued in 200310 in order topromote social welfare provision at all levels in Thailand. This act defines “social welfare”as “The social service provision system related to the prevention of poor social welfareservices, and to developing and promoting society security. This provision should beappropriate, equitable and should be able to serve the basic needs of people in order toestablish both a good quality of life and self reliance. The social service provision systemincludes education, health care, housing, job provision and income support, recreationalprograms, justice systems and general social service provision. All provisions have to beconcerned with human dignity, human rights and people participation at all levels of socialwelfare provision.” The social welfare organizations are government social welfareproviders and non-government organizations.
According to this act, the promoting social welfare provision committee’s main duties areproposing the social welfare provision policy and social welfare provision development plansto the cabinet, and setting the standards of social welfare provision. In order to providesocial welfare to people at all levels, each province will also have a promoting social welfareprovision committee. In addition, a “promoting social welfare provision fund” has beenset up under this act. The budget of this fund comes from many sources, such as thegovernment’s endowment fund, the government’s annual budget, donations, foreign aid,and money and assets which is belong to the fund by law and earned interest.
Moreover, in 2007, the interim government amended the first promoting social welfareprovision act of 2003, with the second promoting social welfare provision act. The secondact added “community welfare organizations” as one of the social welfare organizations.11
The community welfare organization is a locally based organization established in order toprovide social welfare to their community members. This organization may provide socialwelfare of the community welfare organization network and has been certified to providesocial welfare service according to the act. Thus, the social welfare organizations nowinclude three types of groups, government social welfare service providers, non-government organizations and community welfare organizations.
- 10 - 11
9 Foreign Law Bureau, Office of Council of State, Unofficial Translation Constitution of the Kingdom of ThailandB.E. 2550 (2007), www.krisdika.go.th.
10 Promoting Social Welfare Act, 2003.11 Promoting Social Welfare Act (the second act), 2007.

chapter 2
DECENTRALIZATION AND THE BUDGET FOR SOCIAL SERVICES AT TAMBON ADMINISTRATIVE LEVEL Decentralization Theoretical Framework
chapter 2
2.5 SELECTED REVIEW OF DECENTRALIZATION IN THAILAND ANDSUGGESTED THEMES OF RESEARCH
In the TDRI Annual Conference 2004, Direk Patmasiriwat presented a paper12 thatreviewed the process of decentralization in Thailand over the past decade. The Constitutionof 1997 and the Decentralization Act of 1999 specify that the government must decentralizepower and responsibilities from a number of central government agencies to localadministrations. Over the past years, a number of functions and responsibilities have beensuccessfully devolved from central agencies to LGUs (local government units) –yet thestatus quo remains in some areas (i.e., no devolution). Currently, the hot political debate isthe requirement that LGUs’ budget commands at least 35% of government total revenueby 2006 -- as stipulated by the Decentralization Act. It is unlikely to achieved, since thepercentage was only 25% in 2005–leaving too large a gap to fill within one year. The authorassesses the policy achievements as well as the obstacles. The achievements includeinstitutional development, improvements in management capability, innovation andinitiative, better service delivery, and public satisfaction. The obstacles include: i) differentconcepts are being used (i.e., decentralization, delegation, and deconcentration as adoptedby different government departments) leading to different interpretations and confusion;ii) little or no cooperation between LGUs in joint-investment projects which have a clearadvantage in economies-of-scale; and iii) institutional inertia and reluctance to give upresponsibilities which suggests that a strong power remains within (some) centralgovernment agencies.
According to his evolutionary and institutional economic approach, the author discussesthe ways to move forward:
a) using equalization grants to address increasing inequalities in economic well-being across regions;
b) using the overlapping functions and responsibilities to supplement one another,for instance the CEO governor program and local administration
c) using LGUs to regulate the stress on the environment, especially in industriallycongested areas;
d) transferring responsibility for education and public health, even though thetransfer is only in the initial stages
e) improving the managerial skill and knowledge of LGU leaders and staff, bytransferring knowledge from leading local organizationts to less advanced LGUsthrough a learning-by-doing process.
Recently, a number of issues have been studied by several authors. In 2001, DLADLAreported five research studies on capacity building, appropriate structure of localadmininistration, public participation, revenue allocation, and performance measurement.
One issue is local financing. Presently, the municipality development fund is the singleloan-source from which local governments are able to finance deficit spending. Privatefinancial institutions such as commercial banks are typically aware of credit and defaultrisks as a result of imperfect information on the part of borrowers. A financial institution
which could guarantee credit for commercial banks that approve loans to local governmentunits might resolve this problem (Ruechupan, 2002). Moreover, tax decentralization wouldraise the private sector’s confidence in local governments’ ability to pay back loans.Ruechupan further suggests that in the long-run local government units need to uncoveradditional sources of income to expand their tax base, such as land and property taxes.
Allocating financial resources to local governmental units is one of the most importantissues in fiscal decentralization. To ensure efficient social services delivery and appropriateallocation of financial resources to functions, a calculation of the cost factors andmodification factors which reflects the true cost of providing basic services is fundamental(Varanyuwattana, 2004).
The readiness of local government units is also a major concern. The wide variety offunctions to be transferred means that local governments must be ready in all dimensions,not only in their understanding of decentralization, but also in their human resources andskills. Tanchai (2002) argues that the progress of decentralization may be impeded byinsufficient preparation, unclear objectives, and overlapping functions. This view is in linewith Webster’s report in 2002 on “The Road Forward for Thai Decentralization.” He arguesthat the TAO is too small for efficient and effective service provision. More feasible levelswould be the district, preferably even the province, so TAOs should be amalgamated intolarger units. Provincial administrative organizations (PAOs) should concentrate onstrategic planning and capacity-building, while many aspects of service delivery may beentrusted to sector-specific boards.
12 The paper was revised further and published at Thammasat Economic Journal in 2005.
- 13- 12

CHAPTER3THE STRUCTURE OFTHAILAND’S PUBLIC
ADMINISTRATION ANDDECENTRALIZATION CONTEXT
© U
NIC
EF
Tha
iland
/200
9/M
Tho
mas

chapter 3
DECENTRALIZATION AND THE BUDGET FOR SOCIAL SERVICES AT TAMBON ADMINISTRATIVE LEVEL The Structure of Thailand’s Public Administration and Decentralization Context
chapter 3- 2 - 3
The kingdom of Thailand is a unitary state. The Thai bureaucratic system is composed ofthree levels of administration: central, regional, and local (as shown in Figure 3.1).
3.1 THE STRUCTURE OF THAILAND’S PUBLIC ADMINISTRATION
Thailand has gone through a public sector reform program that has continuously progressedover the last 20 years. One objective of the reform program is to make public administrationmore efficient and more accountable to the people. The result of the reform program can beseen in the structure of Thailand’s regional and local administration, as described indetail below.
REGIONAL ADMINISTRATION
The regional administration is an extension of the central government to the provinciallevel. The chief administrator is a provincial governor appointed by the Ministry of theInterior. The governor cooperates with field officers from various ministries. The provincialgovernor is directly under the command of the Ministry of the Interior, whereas fieldofficers are under the command of their respective ministries. Thus, the provincialgovernor does not in fact have “formal and real authority” to command the field officersfrom different ministries1.
Recently, the central government has reformed regional administration by authorizing theprovincial governor to control and command the provincial field officers from all ministries.Still, the problem remains how to reallocate funds initially appropriated for the lineministries at the provincial level to the provincial governor.
LOCAL GOVERNMENT ADMINISTRATION
Local governments in Thailand are established by the constitution. The structure of localgovernment administrations has been designed to maintain independence between units,although there is an upper unit of local administration within each province to serve asa coordinator and to assist other local governments in delivering public services. There are7,857 units of local government altogether, which can be classified into five categories.They are:2
• Provincial Administrative Organization (PAO: 75 units), which serve as the upperunit of local government within province;
• Municipality (1,156 units);• Sub-district (Tambon) Administrative Organization (TAO: 6,624 units);• Bangkok Metropolitan Administration (BMA); and• Pattaya City.
Of the other nations that have conducted decentralization programs, few havedecentralized to as many local governments units as has Thailand. The more than 7000local government units vary greatly both in terms of size (as measured by the population
governed) and in fiscal capacity. Statistically, about 70 percent of local governments,especially TAOs, govern small communities with populations of less than 5,000. Most of thesmall TAOs are ill-prepared for self-governance. Therefore, few local governments inThailand can provide public services efficiently and effectively. Only the originalmunicipalities are capable of and have experience with financial self-management.Moreover, one can expect that as the decentralization program progresses to all localgovernments they will encounter even greater challenges in delivering public services, anddeeper crises in fiscal discipline and financial management.
Figure 3.1 shows the administrative structure of the Thai government. Note theestablishment of the National Decentralization Committee (NDC) under the prime minister’soffice. This new agency is responsible for setting policy guidelines toward decentralization.The authority of the NDC would supplant that of the Department of Local Administration(DLA), which has directly supervised local governments for decades. Under the newadministrative structure, the responsibilities of the NDC include determining which functionsand central personnel will be devolved from the line agencies of the central government tolocal governments, the design of a revenue transfer formula, and monitoring and evaluatingthe devolution of administrative functions and the impact on local people.
1 For definition of formal and real authority, see Aghion and Tirole (1997).2 Latest figures provided by Department of Local Administration, Ministry of Interior.
Figure 3.1 Administrative structure of the Royal Thai Government
Central Administration Local Administration
The Cabinet
Ministry ofInterior
Department of LocalAdministration
ProvincialGovernors
Districts
Villages
NationalDecentralizationCommittee (NDC)
BangkokMetropolitan
Administration
ProvincialAdministrativeOrgaanizations
(PAO)
Municipalities
Pattaya City
TambonAdministrativeOrgaanizations
(TAO)
3.2 DECENTRALIZATION IN CONTEXT OF THAILAND
Prior to the promulgation of the Constitution in 1997, the central government playeda major role in the political process, determining budget allocations by planning andprogramming all expenditures, including environmental management. The centralgovernment was also responsible for the design and collection of the majority of bothnational and local taxes.

chapter 3
DECENTRALIZATION AND THE BUDGET FOR SOCIAL SERVICES AT TAMBON ADMINISTRATIVE LEVEL The Structure of Thailand’s Public Administration and Decentralization Context
chapter 3
However, after the introduction of the Constitution of 1997 the public sector in Thailandhas undergone dramatic change. The Constitution of 1997 laid the foundation fordecentralization and set the guidelines for public sector reforms. One principle of the policyreforms involves decentralization and devolution of responsibilities from central agencies.A national body (the National Decentralization Committee: NDC) was established to takeresponsibility for fiscal reform in accordance with the decentralization principle. Theduties of the committee include designing a revenue transfer formula for all localgovernment units to finance local public expenditures and determining the functions ofcentral government that must be devolved to local governments. Since decentralization isan ongoing process which continually requires adjustment, the law requires revision ofthe decentralization plan every five years. The committee is also obliged to submitrecommendations for changing laws to the central government.
In accordance with the principle stipulated by the Constitution of 1997, the DecentralizationAct B.E. 2542 (1999) was enacted. It specifies the functions to be devolved from centralgovernment agencies to local authorities and the time-frame for doing so. Three directiveswere issued under the Decentralization Act, namely:
1. Functions that are identified as appropriate to local governments must betransferred and that such transfer is mandatory for the central agencies currentlyinvolved;
2. The government must allocate a sufficient portion of the budget from the centralrevenue to local government units so that such units could perform thetransferred functions;
3. The establishment of the National Decentralization Committee (NDC) to monitorthe progress of decentralization and to ensure that devolution is taking placeas planned.
Subsequently, the NDC identified 245 functions classified into 6 major programs to betransferred to local government units and specified a time frame to do so. In addition, theBudget Bureau has cooperated with the NDC by reassigning portions of the budget thathad been previously allocated to ministries/departments to LGUs. The devolutionprogram involves 50 departments under 11 ministries. The details of these 6 programs aresummarized below:
1. Public Infrastructure: 87 activities from 17 departments to be transferred;
2. Local Services Related to Quality of Living: 103 activities from 26 departmentto be transferred;
3. Civil and Community Ordering, and Peace Maintenance: 17 activities from9 departments to be transferred;
4. Planning, Investment Promotion, Business, and Tourism: 19 activities from6 departments to be transferred;
5. Natural Resources and Environment Management and Conservation: 17 activitiesfrom 9 departments to be transferred;
6. Art, Culture, Tradition, and Local Wisdom: 2 activities from 1 department to betransferred.
- 4 - 5
Table 3.1 Functions to be transferred to local administration, classified into 6 broadcategories and by types of work
Broad Category ofFunctions to be
Devolved to LocalAdministration
Example of activitiesRelated Central
Agencies Work / Activities
Public Infrastructure 87 topics; 7 ministriesand 17 departments
Transport andcommunication
Public works
Public facilities
Road construction, roadmaintenance, bridge, canal,bus station
Irrigation, pipe-water,
Marketplace, city planning
Quality of life Occupational training
Social welfare
Sport and exercisepromotion
Educational services
Public health
Program for occupationaltraining
Care for children, elderly,disabled, and HIV-infected
Public park, recreationalsites, sporting facilities, fieldand stadium
LGUs can provide schooleducation – provided theypass certain guidelines
Primary health care, diseaseprevention, and healthpromotion
Social order andcommunity safety
17 topics;6 ministries and9 departments
Disaster prevention andrelief
Public safety Registration of animals,motor vehicles, andbusiness enterprisesGiven power to set fine forviolators
Commerce planning,investment andtourism promotion
19 topics;5 ministries and6 departments
Local planning,investment plan,tourism promotion
Integrated developmentplanning
Data collection andinformationdissemination
Long-term plan, annualoperation plan with localparticipation
Joint projects / programsbetween LGUs andprovincial administration,provincial clusters
Local tourism information
Natural resourcesand environment
17 topics;4 ministries and9 departments
Forest protectionEnvironmentalprotection andpollution prevention
Monitoring public land
Monitoring the forestWaste collection,wastewater treatment
Prevention of encroachmenton public land
Arts, culture, localwisdom and custom
2 topics;1 department
Historical heritageFolk museum
Source: Office of the National for Decentralization; www.dloc.go.thNote: This plan was formally approved by the Decentralization Committee on June 25th, 2001. Altogether there are
245 functions to be devolved to local administration, involving 11 ministries and 50 departments.

chapter 3
DECENTRALIZATION AND THE BUDGET FOR SOCIAL SERVICES AT TAMBON ADMINISTRATIVE LEVEL The Structure of Thailand’s Public Administration and Decentralization Context
chapter 3
Many social welfare services are categorized under the quality of life program. Thiscategory encompasses such activities as job promotion, quality of life improvement fordisadvantage groups, recreation, education, public health services, and the development ofresidential and slum areas. The transfer of these functions is to proceed gradually to ensurethat there would be no interruption of the services during the transfer process. TheNational Decentralization Committee (NDC) designed the timetable and procedures for alllevels of central agencies in charge of devolving “planned transferred functions.” Finally,the transfer of each function is designated as “compulsory” or as “discretionary” accordingto local conditions.
A brief summary of the plan for devolution of social welfare functions from centralgovernment agencies to LGUs is presented in Table 3.2
- 6 - 7
Table 3.2 List of the social welfare functions to be transferred to LGUs
CategoryInvolved Central Agencies Transferred FunctionsBeginningYear of theTransfer
Department of CommunityDevelopment,Ministry of the Interior
1. Job Promotion1.1 support activities to take
benefit from watershed hold1.2 create jobs for occupation
groups1.3 support activities of
economically self-sustainedvillages
1.4 capital support for savingsgroups’ activities
1.5 support activities of women’sdevelopment group
2001 Localdiscretionary
Department of Skilled Labor,Ministry of Labor andSocial Welfare
Department of IndustryPromotion, Ministry of Industry
Department of CommunityDevelopment, Ministry of theInterior
Department of Social Welfare,Ministry of Labor andSocial Welfare
Department of Basic Education,Ministry of Education
Department of ExtendedEducation, Ministry of Education
1. Occupation survey
1. Handcraft and householdindustry promotion
1. Child development centers
1. Pension money for elderly2. Pension money for handicapped3. Pension money for AIDs patients4. Elderly service center5. Child and juvenile welfare
(Lunch and milk provision)
1. Primary education preparation(ages 4-6)
2. Primary education3. Secondary education4. Grants for supplementary food
(milk)
1. Local libraries and village readingcenters
2001
2002
2001
2001
When LGUspass the
readinessevaluation
2001
Localdiscretionary
Localdiscretionary
Compulsory
Compulsory
CompulsoryLocal
discretionary
Table 3.2 (Cont.) List of the social welfare functions to be transferred to LGUs
CategoryInvolved Central Agencies Transferred FunctionsBeginningYear of theTransfer
Permanent Secretary Office ofMinistry of Education
Police Department, Office ofPrime Minister
1. Child lunch programs
1. Education for hill tribe children
2001
2001
Compulsory
Compulsory
The above table provides general information regarding functions that have beentransferred to LGUs under the decentralization plan. Public health is an exception, sincethere is no mandate for its transfer to local government units. There is debate as to how thepublic health services should be removed from existing centralized system to LGUs –particularly since the TAOs would serve as providers rather than purchasers of service fortheir people. The initial draft of the plan intended to ensure the TAOs’ rights to freely seeksuitable health service providers from either existing public health service units or privatehospitals. The central government introduced the national public health assuranceprogram which resulted in centralization of the public health services program. Some TAOs,however, supplement the public health service by incorporating their own health centerwith public health service units of the Ministry of Public Health. Some TAOs also provideprimary public health care services for people out of their own budget, although thisfunction is limited to giving information about health care and promoting basic health.
The last column of the table indicates the degree of obligation the LGUs have in performingthe transferred functions. The directive is intended to ensure that local people will continueto receive the services either provided by or under the supervision of the LGUs. The transferof some functions to local government units is mandated to ensure the quality of life.
The devolution of functions from line agencies to LGUs is only the beginning of thedecentralization process. Social services are one of many public services that will betransferred to lower level of public management to promote efficiency and accountability tothe local people. Although decentralization is seen as tool to enhance local participationand the accountability of the local administration, the central government still has aprominent role to play in financially supporting LGUs and ensuring the smooth devolutionof functions. Without improvements in the financial condition of LGUs, it is not feasiblefor LGUs to perform the transferred functions as they have scarce revenue resources.In funding public services, it is necessary to consider the social and economic impact ofpublic sector reform. A major result of the reform program is significant changes in thebudgetary system permitting several pathways of funding to lower levels of administration,particularly the TAO level. The new system of funding down to the TAO level is expected tohave an economic and social impact at local level.
Compared to decentralization in other nations, Thailand appears to follow a similar model.Thailand’s decentralization program aims to enhance economic efficiency in order to attainmaximum social welfare subject to flow of fiscal resources and functions. However, theprogram faces continual resistance from many line agencies of the central government asthey are afraid of losing their autonomy and budget allocation. As a result, the programhas had limited progress even though it was mandated by the Constitution of 1997.Decentralization encompasses several aspects that would enhance local government

chapter 3
DECENTRALIZATION AND THE BUDGET FOR SOCIAL SERVICES AT TAMBON ADMINISTRATIVE LEVEL The Structure of Thailand’s Public Administration and Decentralization Context
chapter 3- 8 - 9
autonomy: the devolution of functions, the re-allocation of revenue and the re-assignmentof personnel from the central government. Progress on the devolution of functions has beensatisfactory. Of the 245 functions targeted for transfer, 177 have actually been transferred.3
Considering the types of functions devolved reveals that the largest number of functionstransferred to local governments are social service-related functions (103 out of 245programs). This aim is underscored by the ability of local governments to respond to localsocial welfare needs more effectively than central agencies.
Yet the most ambitious target of the decentralization scheme is to transfer more than35 percent of net government revenue by the fiscal year 2006 to local governments. Therevenue target has created fiscal pressure on the central government’s budget process.In retrospect, the actual revenue allocation for local government did not reach the intendedtarget. The actual revenue transfer was only 25.2 percent in fiscal year 2006. The slowpace of budget allocation has disrupted the continuity of functions devolution. The sluggishincrease of local revenue resources is due to several reasons: the structure of localgovernment revenue is not compatible with the economic structure of each type of localgovernment, and existing revenue sources such as taxation and charges are notappropriately designed to cope with modern economic structures. In addition, the revenuetransfer formula that the central government has used for the last five years for the fiscaldecentralization program does not take into account the revenue imbalance across localgovernment units. The main focus of the formula is to increase the share of revenue forlocal governments relative to the revenue of the central government, but no criteria hasbeen implemented to counter revenue inequality both horizontally and vertically.
In practice, the local governments must respond to the transfer of functions and revenue byrestructuring their bureaucratic system to absorb the transferred resources. The law alsorequires restructuring of the bureaucratic system in public services by transferringpersonnel to local governments, to prevent overlap and to increase local capacity. However,this process has advanced very little. As a result, the quality of many of the devolvedfunctions has declined and local governments do not have the financial capacity ormanpower to improve it.
3.3 RECENT CHANGES TO FISCAL DECENTRALIZATION IN THAILAND
As mentioned above, decentralization is one of the major principles under the Constitution1997 that would empower people to achieve self-rule and self-reliance, using theircommunity resources with some support from the government. Under this scheme, localgovernments are expected to play a major role as popular institutions for self-rule and toprovide a training ground for democratic administration.
However, the political incidents that occurred on October 19th, 2006 resulted in thedissolution of the Constitution of 1997. But the reform committee has ruled that the lawsissued in accordance with principles of the constitution are not dissolved. Thus, the plansand procedures of the Decentralization Act of 1999 remain intact. Subsequently, an interimgovernment was appointed to oversee public administration until a new electedgovernment can be established. The interim government has announced that thedecentralization process is one of the policies that deserves attention and continuity, as
stated in the Policy Statement to the Council of Ministers, “In line with the democraticprocess so as to enable the localities to be self-sufficient and administer themselves inaccordance with the wishes of the people in the respective local communities.”4 In addition,Interim Prime Minister General Surayud Chulanont presented his policy statement to thenational legislative assembly on November 3, 2006 supporting the decentralizationpolicy. The policies he proposed, supporting the decentralization process, social welfareand social service provision, are detailed in Appendix A.
An unresolved problem for policy makers is the share of revenue for LGUs required by theDecentralization Act. The interim government has altered the Decentralization Act of 1999,which requires the budget of LGUs to be at least 35 percent of total net governmentrevenue, because it is clear that the government can not provide funds to meet the target.The Decentralization Act No. 2 (2006) was approved by the National Legislative Assemblyand announced in the Royal Gazette on January 8th, 2007. The Decentralization Act No.2(2006) has postponed the time frame to achieve the revenue target of 35 percent. However,the new law does not specify a target year for this to be achieved. The new law states thatthe share of LGUs’ revenue and subsidies relative to the central government’s revenue shallnot be less than that of FY 2007’s target of 25 percent and that the amount of fundstransferred shall correspond to the activities transferred to the local governments.
Under the amended Decentralization Act, the government is no longer bound to increaserevenue for the LGUs to 35 percent of total net revenue unless more functions are devolvedto the LGUs. The size of the local funds can remain at existing levels. The amendment putsthe LGUs in a difficult financial position, forcing them to balance the revenue andexpenditure.
3 Report from NDC on progress of decentralization procedure and plan in 2006. 4 Policy Statement to the Council of Ministers, 3 October 2006.

CHAPTER4ANALYSIS OF
THE BUDGET FLOWS
© U
NIC
EF
Tha
iland
/200
9/M
Tho
mas

chapter 4
DECENTRALIZATION AND THE BUDGET FOR SOCIAL SERVICES AT TAMBON ADMINISTRATIVE LEVEL Analysis of the Budget Flows
chapter 4
This chapter presents the budget structure for social services on three levels, i.e., thenational level, the provincial level, and the TAO level. To get an overview of how fiscalresources are allocated for social service provision, we first look at the social serviceexpenditures for nine relevant ministries during the period from fiscal year 2003 to fiscalyear 2007. Next, we identify the patterns and trends of social services expenditures at theprovincial level, excluding Bangkok. Finally, we analyze the flow of budget allocations toLGUs as well as their revenue structure.
At the national level, there are nine main ministries involved in social service delivery: theMinistry of Public Health, the Ministry of Education, the Ministry of Social Development andHuman Security, the Ministry of the Interior, the Ministry of Labor, the Ministry of Justice,the Ministry of Sport and Recreation, the Ministry of Culture, and the Ministry ofAgriculture and Cooperatives.
Table 4.1 shows the social service expenditures of the nine ministries from fiscal year 2003to fiscal year 2007. During the past five years, social service expenditures have risenconsistently from 659.1 billion baht in 2003 to 821.6 billion baht in 2005 and to 1072.7billion baht in 2007. On average, social service expenditures account for 56.3 percent ofthe total government budget.
Among the social service-related ministries, the Ministry of Education has received thelargest share of the government budget (26.4 percent in FY2007), followed by the Ministryof Interior (16.7 percent in FY2007), the Ministry of Agriculture and Cooperatives (6.1percent in FY2007), and the Ministry of Public Health (5.8 percent in FY2007).
Three ministries, the Ministry of Social Development and Human Security, the Ministry ofCulture, and the Ministry of Sport and Recreation, have received a stable but minimal levelof budget allocation for social service expenditures from the government (less than1 percent during the past four fiscal years), because the majority of welfare functions havebeen transferred to LGUs after the introduction of decentralization.
Table 4.1 Budget Allocation at National Level, FY2003-FY2007.
1. Ministry of Public Health 42.3 11.6 45.2 11.5 45.2 9.4 52.8 9.8 62.3 9.7(6.4) (5.5) (5.5) (5.9) (5.8)
2. Ministry of Education 158.7 43.6 158.0 40.3 203.9 425 225.5 41.9 282.7 43.8(24.1) (19.3) (24.8) (25.2) (26.4)
3. Ministry of Social 3.9 1.0 4.7 1.0 6.0 1.1 8.6 1.3Development and (0.5) (0.6) (0.7) (0.8)Human Security*
4. Ministry of Interior 82.4 22.6 102.8 26.2 139.0 29.0 160.7 29.9 179.4 27.8(12.5) (12.5) (16.9) (17.9) (16.7)
5. Ministry of Labor 16.1 4.4 13.0 3.3 17.7 3.7 18.8 3.5 25.2 3.9(2.4) (1.6) (2.2) (2.1) (2.4)
6. Ministry of Justice 2.0 0.6 11.4 2.9 11.8 2.5 12.5 2.3 13.9 2.2(0.3) (1.4) (1.4) (1.4) (1.3)
7. Ministry of Sport and 2.5 0.6 2.4 0.5 3.0 0.6 3.4 0.5Recreation* (0.3) (0.3) (0.3) (0.3)
8. Ministry of Culture* 2.2 0.6 2.5 0.5 2.9 0.5 4.2 0.6(0.3) (0.3) (0.3) (0.4)
9. Ministry of Agriculture 62.7 17.2 53.2 13.6 52.4 10.9 55.6 10.3 65.4 10.1and Cooperatives (9.5) (6.5) (6.4) (6.2) (6.1)
Total 9 Social Services 364.2 100.0 392.4 100.0 479.6 100.0 537.9 100.0 645.1 100.0Related Ministries
Total Government 659.1 (55.3) 820.3 (47.8) 821.6 (58.4) 896.2 (60.0) 1,072.7 (60.1)Expenditure
Unit: Billion Baht
Amount %
2003 2004 2005 2006 2007
Amount % Amount % Amount % Amount %
Note: 1) Numbers in parentheses are share to total government expenditure.
2) *These ministries are established in year 2004.
Source: Budget Bureau.
Ministries
-2 - 3

chapter 4
DECENTRALIZATION AND THE BUDGET FOR SOCIAL SERVICES AT TAMBON ADMINISTRATIVE LEVEL Analysis of the Budget Flows
chapter 4
Table 4.2 reveals the following facts about social service expenditures at the provinciallevel (excluding Bangkok):
• The total social service budget has accounted for approximately 44.3 percent ofthe total government budget at the provincial level (or 3.2 percent of GDP) duringthe past three fiscal years.
• Social services expenditures have increased relative to the entire government budgetover time.
• Education has received the largest share of the social services budget (32.1percent), followed by health expenditures (8 percent), and by social security andwelfare expenditures (2.5 percent).
• Social service expenditures on housing and community have steadily decreasedsince FY2004 because the government initiated a low-cost housing project, namely“Baan-Aur-Ar-Thorn,” supervised by the National Housing Authority.
• Social service expenditures on security have decreased relative to the total socialservice expenditure. A straightforward explanation for the decrease is thatgovernment converted the security budget to “central funds”1 in response to thedecentralization program.
Next, we examine the flow of budget allocation to LGUs under the existing publicadministration and the new budget reform program. The budget allocation to LGUs iscomplicated because of public sector reforms which reassign functional responsibilitiesacross all relevant ministries. The most significant aspect of public sector reform is theintroduction of the decentralization program in 1999, which has caused the reallocation ofthe budget from various departments to LGUs, including TAOs. Many of the public servicesthat were traditionally provided by central agencies have been devolved to LGUs in terms ofboth the activities performed and the size of expenditures. Following the flow of the budgetallocations allows us to track expenditures for all social services provided at the TAO level.
4.1 STRUCTURE OF BUDGET FLOW TO LGUS
After the introduction of decentralization in Thailand, the process of budget allocation to allministries and line agencies was altered. The change in budget allocation is partly due tothe transfer of functions from line agencies to LGUs, which left the line agencies of manyministries ineligible to receive the revenue to perform such functions from the nationalbudget. The emergence of various service providers and budget processes requires a shiftfrom a linear pattern of budget allocation to a more complicated scheme in accordancewith existing laws. These laws will remain in effect, even after decentralization.
Prior to the decentralization program only line ministries had the authority to providepublic services to people. When the decentralization program was promulgated, a largeportion of the budget previously allocated to the line ministries was instead re-allocated toLGUs. Nevertheless, no LGU is eligible to receive funding directly from the national budgetappropriation, except for the Bangkok Metropolitan Administration and Pattaya City,because of budget regulations established by the Budget Process Act of 1959. As aconsequence, all of the funds allocated to LGUs from the national budget must pass through
Edu
cati
on14
4,99
333
.82.
3-
13.9
165,
840
31.5
2.4
14.4
177,
176
31.1
2.3
6.8
% t
o To
tal S
ocia
l70
.073
.374
.0Se
rvic
es E
xpen
ditu
re
Hea
lth
31,9
227.
40.
5-
15.8
42,9
688.
20.
634
.648
,407
8.5
0.6
12.7
% t
oTo
tal S
ocia
l15
.419
.020
.2Se
rvic
es E
xpen
ditu
re
Soci
al S
ecur
ity
and
20,0
804.
70.
3-
40.8
9,53
91.
80.
1-
52.5
6,29
61.
10.
1-
34.0
Wel
fare
% t
o To
tal S
ocia
l9.
74.
22.
6Se
rvic
es E
xpen
ditu
re
Hou
sing
and
8,21
41.
90.
1-
40.4
5,59
61.
10.
1-
31.9
4,87
50.
90.
1-
12.9
Com
mun
ity
% t
o To
tal S
ocia
l4.
02.
52.
0Se
rvic
es E
xpen
ditu
re
Rel
igio
us C
ultu
ral
1,82
40.
40.
012
.52,
310
0.4
0.0
26.6
2,71
90.
50.
017
.7an
d R
ecre
atio
nal
% t
o To
tal S
ocia
l0.
91.
01.
1Se
rvic
es E
xpen
ditu
re
Tota
l Soc
ial S
ervi
ces
207,
033
48.2
3.3
- 19
.022
6,25
242
.93.
39.
323
9,47
342
.03.
15.
8
Tota
l Bud
get
429,
346
100.
06.
8-
12.1
526,
975
100.
07.
622
.756
9,80
910
0.0
7.4
8.1
Nom
inal
GD
P6,
322,
212
100.
09.
46,
917,
953
100.
09.
47,
669,
640
100.
010
.9
Uni
t: M
illio
n B
aht
Func
tion
Am
ount
% o
fTo
tal
Bud
get
% o
fG
DP
Gro
wth
FY20
04FY
2005
FY20
06
Am
ount
% o
fTo
tal
Bud
get
% o
fG
DP
Gro
wth
Am
ount
% o
fTo
tal
Bud
get
% o
fG
DP
Gro
wth
Tabl
e 4.
2So
cial
ser
vice
s ex
pend
iture
fro
m v
ario
us m
inis
trie
s at
pro
vinc
ial l
evel
(exc
lude
d Ba
ngko
k), F
Y200
4-FY
2006
1 Central funds include budgets for emergency needs (e.g., natural disasters) and uncategorized items. It merely
requires approval from a cabinet minister to disburse the funds.
- 4 - 5

chapter 4
DECENTRALIZATION AND THE BUDGET FOR SOCIAL SERVICES AT TAMBON ADMINISTRATIVE LEVEL Analysis of the Budget Flows
chapter 4
the departmental level, namely, through the Department of Local Administration (DLA) ofthe Ministry of the Interior.
Recently, the Budget Bureau changed budget appropriation according to three dimensionswhich are agenda-based, function-based, and area-based. The flow of government fundingfor each level of government agencies is shown in Figure 4.1. The first channel of budgetallocation flows to the ministerial level. The ministerial level budget is targeted atexpenditure programs that serve the government’s economic and social developmentobjectives: for example, poverty alleviation, education, and public health programs. Theministerial level budget is then distributed across the departments of each ministry.The budget at the departmental level will be allocated according to the function of eachdepartment. Subsequently, much of the budget is further allocated to the provincial orregional offices. This budget can then be used to solve problems and support activities atthe provincial level. Besides the central budget for the ministerial and departmental levels,the provincial governor receives a separate budget allocation for development programswithin the province. Finally, the annual expenditure budget appropriation must allocatea portion to support the decentralization program as mandated by the Decentralization Actof 1999. Given the regulatory structure of budget allocation, the funding of TAOs can beconceptualized as flowing through four separate channels, as follows:
I. THE BUDGET FLOW THROUGH THE DEPARTMENT OF LOCAL ADMINISTRATION(DLA)
As mentioned above, LGUs are not allowed to receive direct allocation from the nationalannual budget appropriation under the current national and local budgeting laws andregulations2. LGUs can only receive national budget allocations from the DLA of theMinistry of the Interior. The DLA monitors the LGUs and provides technical assistance totheir operations, such as providing public services and improving revenue generation.One of DLA’s primary duties is to transfer revenue allocations that support local publicservice provision to all LGUs. LGUs receive their revenue through two major channels:1) surcharged and shared taxes, and 2) grants. The difference between tax revenue andgrants from the central government is that the government may allocate surcharged andshared tax revenue to LGUs without submitting them to the national fiscal reserve. Unlikethe tax revenue, the central grant allocation for LGUs must be part of the annual budgetscrutinized by parliament. Both revenue sources are allocated as a block grant to theNational Decentralization Committee (NDC), which determines how to distribute the budgetamong the various types of LGU. The revenue distribution formula will be used by the DLAas the criterion in disbursing the funds.
Unlike the DLA, the NDC formulates the budget allocation criteria as the decentralizationpolicy-maker. The NDC is composed of three equal groups: the first group is made up of therepresentatives of the government line agencies related to the functions being devolved tothe LGUs; the second group is made up of the representatives from each type of LGU; thelast group is made up of experts from various fields related to decentralization. One of thecore functions of the committee as directed by the Decentralization Act is to devise theformula for allocating central revenue to LGUs.
At present, all LGUs have the same three main sources of revenue: locally collectedrevenue, centrally surcharged and shared tax revenue, and grants or subsidies from thegovernment. Among the LGUs revenue sources, the surcharged and shared tax revenue isthe most important revenue source (see Figure 4.3). Locally collected revenue for Bangkok
Figure 4.1 Budget Flow Paths to LGUs and Community Level
Villages andCommunities
Level
Line Ministries(e.g. Ministry of
Interior)
NationalDecentralizationCommittee (NDC)
Central Fund (underAnnual Expenditure
Budgeting)
DepartmentLevel of Line
Ministries
Department ofLocal
Administration
Provincial Governors andGovernment Special
Programs(e.g. Village Funds, SML,Good Being Society etc.)
RegionalOffices
BangkokMetropolitan
Administration(BMA)
TambonAdministrativeOrganization
(TAO)
MunicipalitiesProvincialAdministrativeOrganization
(PAO)
PattayaCity
National BudgetAllocation
Note: Bangkok Metropolitan Administration and Pattaya City are only two LGUs that can receive direct budget
allocation from annual government expenditure budgeting
2 Budget Process Act of 1959.
- 6 - 7

chapter 4
DECENTRALIZATION AND THE BUDGET FOR SOCIAL SERVICES AT TAMBON ADMINISTRATIVE LEVEL Analysis of the Budget Flows
chapter 4
Metropolitan Administration (BMA), municipalities, TAOs, and Pattaya City consists of bothtax and non-tax revenues. Local tax revenue comes from building and land taxes, landdevelopment taxes, signboard taxes, animal slaughter taxes, and bird nest taxes. TheProvincial Administrative Organizations (PAOs) have the sole authority to collect thegasoline sales tax and hotel charges. Locally collected non-tax revenues include license feesand fines, sales of assets fees, revenue from utilities, and miscellaneous sources of revenue.
Centrally collected revenue for LGUs consists of surcharged taxes and fees. Shared taxesare taxes that the government and the LGUs collect from the same tax base, although it isbelieved that this tax is more effectively collected at the central level rather than local level.The government collects such taxes and redistributes the revenue to local governmenteither partially or entirely, depending on the type of the tax revenue. The taxes shared withlocal government include the value added tax (VAT), the specific business tax, excise taxes,motor vehicle taxes, land registration fees, gambling taxes, mineral and petroleum taxes,airport fees, and underground water fees.
In addition to conventional tax revenue sharing, LGUs also receive general and specificgrants from the government. The grant allocation system suffers from at least two majorproblems. First, the amount available each year is quite unpredictable due to changes ingovernment policy. Second, the criteria for allocating grants is not systematic. Therefore, itis no easy task for LGUs to effectively plan their expenditures. Initially, the formula for grantallocation follows a cautious design, taking into account the theoretical aspects ofsupporting and monitoring the activities of LGUs. Yet once it is submitted for approval to theNDC, composed of both local representatives and line agency officials, the grant allocationformula becomes a political issue. Since the representatives have their own interests indecentralization, the actual distribution is highly arbitrary and politicized.
Central grants are provided to LGUs for two purposes: to increase the revenue capacity andto promote spending on functions that provide social services or improve the quality of life,according to certain guidelines. In order to increase local revenue capacity, the governmentallocates general grants without conditions to LGUs, which they can spend according totheir discretion. Yet to ensure that LGUs provide basic social services, the governmentprovides general grants with specific purposes as follows:
• Grants for supplementary food (milk) • Grants for handicapped people pension• Grants for school’s luncheon • Grants for Aids patient pension• Grants for pre-school children center • Grants for social service center• Grants for elderly pension • Grants for elderly assistance center
In addition to the general grants, with or without specific purposes, the governmentallocates specific project-based grants for certain LGUs if their development projectsconform to government policy. Examples include solar cells, water supply, electricity, and soon. The allocation of specific grants is done on an ad hoc basis and is highly politicized.
II. THE BUDGET FLOW THROUGH THE PAOS
The DLA also allocates part of the budget to PAOs to enable them to support other LGUswithin the province. The PAO is responsible for functions that overlap more than two LGUswithin the province and projects that are beyond the capacity of a single LGU to finance onits own. The PAO can assist LGUs in delivering some social services but it can not perform
the function itself.3 Each PAO has the authority to determine how to allocate its receivedbudget to each TAO and municipality within the province.
III.THE BUDGET FLOW THROUGH THE LINE MINISTRIES
There are several line ministries which have functions to deliver at the TAO level, the mostimportant of which are the Ministry of Social Development and Human Security(responsible for the Caring Society Agenda and the Strengthen Society Agenda), theMinistry of Education, and the Ministry of Public Health (responsible for the health securitysystem funded at the tambon level). These ministries have their line agencies and their ownbudget to work with people at the TAO level according to their ministries’ policies. Besidesthese line ministries, there are some independent public agencies which also providesupport for people at the TAO level. These independent public agencies are kept separatefrom the regular departments in order to provide more flexibility in management and toprovide an additional source of financial support besides the government budget. Thepublic organizations that assist people at the TAO level include the CommunityOrganizations Development Institute of The Ministry of Social Development and HumanSecurity, the Office of Promoting Health Fund under the Ministry of Public Health, andso on.
IV. THE BUDGET FLOW THROUGH THE PROVINCIAL LEVEL
One weakness of Thailand’s current budgetary system is the concentration of authority atthe departmental level of the ministry. Under this system, the decision-making authority forany budget request rests with the officers at the departmental level. Some expendituresmay not reflect the needs and problems at the provincial level. The previous governmentattempted to alleviate this problem by providing a channel of budget allocation directlyfrom the central fund to the provincial level, ensuring that a certain amount of fundingwould be available at the provincial level. The provincial governors are responsible for thefunds and decide how the money will be spent, since they are better informed about theproblems and issues that need attention.
Additionally, this part of the budget also distributes funding for area-based projectsaccording to government policy, such as the “Live Well and Happily Society Project,” the“Village Fund” and the “Alleviating Poverty Project.”4 This budget allocation was previouslyunder the authority of the departmental level of each ministry. However, after the publicreform program of the previous government administration, the government has set asidea certain portion of the national budget for provincial governors to support projects whichspecifically serve the provincial area. This part of the budget still exists under the interimgovernment; only its objectives and allocation methods have changed to better servegovernment policy objectives.
3 For existing social service budget which is passed through PAOs, see Appendix C.4 The description of the Live Well and Happily Society Strategy is presented at Appendix B.
- 8 - 9
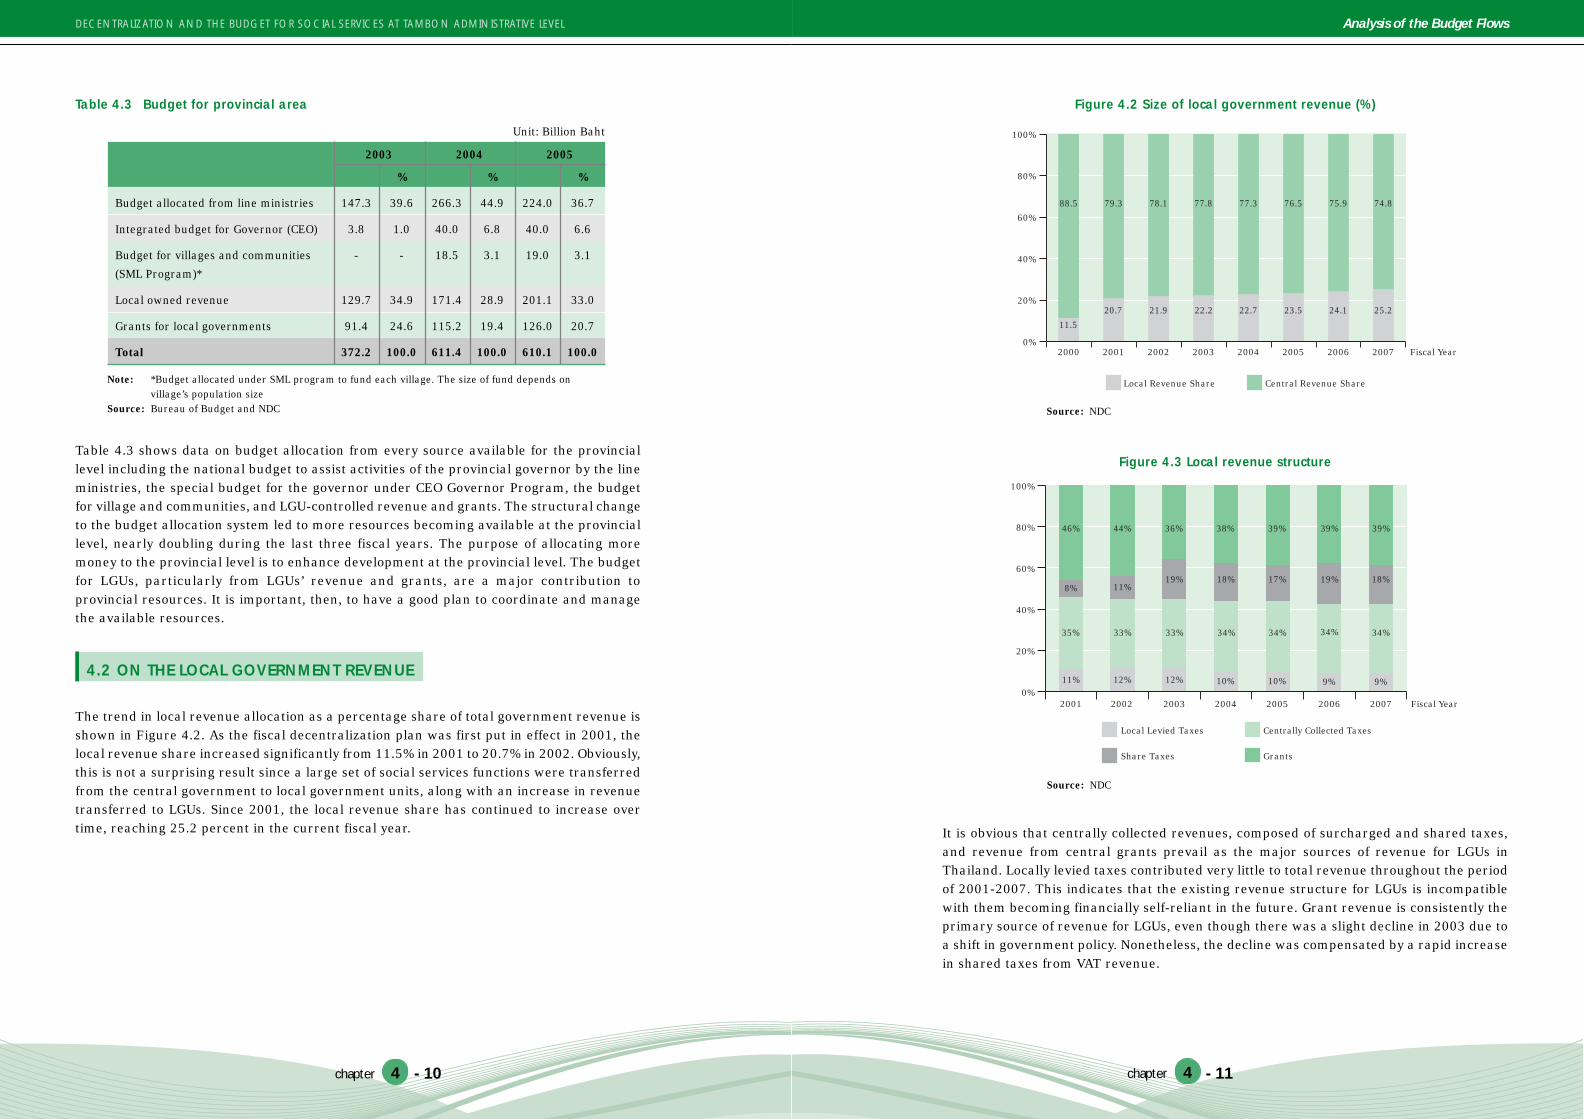
chapter 4
DECENTRALIZATION AND THE BUDGET FOR SOCIAL SERVICES AT TAMBON ADMINISTRATIVE LEVEL Analysis of the Budget Flows
chapter 4
Table 4.3 shows data on budget allocation from every source available for the provinciallevel including the national budget to assist activities of the provincial governor by the lineministries, the special budget for the governor under CEO Governor Program, the budgetfor village and communities, and LGU-controlled revenue and grants. The structural changeto the budget allocation system led to more resources becoming available at the provinciallevel, nearly doubling during the last three fiscal years. The purpose of allocating moremoney to the provincial level is to enhance development at the provincial level. The budgetfor LGUs, particularly from LGUs’ revenue and grants, are a major contribution toprovincial resources. It is important, then, to have a good plan to coordinate and managethe available resources.
4.2 ON THE LOCAL GOVERNMENT REVENUE
The trend in local revenue allocation as a percentage share of total government revenue isshown in Figure 4.2. As the fiscal decentralization plan was first put in effect in 2001, thelocal revenue share increased significantly from 11.5% in 2001 to 20.7% in 2002. Obviously,this is not a surprising result since a large set of social services functions were transferredfrom the central government to local government units, along with an increase in revenuetransferred to LGUs. Since 2001, the local revenue share has continued to increase overtime, reaching 25.2 percent in the current fiscal year.
Table 4.3 Budget for provincial area
Unit: Billion Baht
2003
%
2004 2005
% %
Note: *Budget allocated under SML program to fund each village. The size of fund depends onvillage’s population size
Source: Bureau of Budget and NDC
Budget allocated from line ministries 147.3 39.6 266.3 44.9 224.0 36.7
Integrated budget for Governor (CEO) 3.8 1.0 40.0 6.8 40.0 6.6
Budget for villages and communities - - 18.5 3.1 19.0 3.1
(SML Program)*
Local owned revenue 129.7 34.9 171.4 28.9 201.1 33.0
Grants for local governments 91.4 24.6 115.2 19.4 126.0 20.7
Total 372.2 100.0 611.4 100.0 610.1 100.0
It is obvious that centrally collected revenues, composed of surcharged and shared taxes,and revenue from central grants prevail as the major sources of revenue for LGUs inThailand. Locally levied taxes contributed very little to total revenue throughout the periodof 2001-2007. This indicates that the existing revenue structure for LGUs is incompatiblewith them becoming financially self-reliant in the future. Grant revenue is consistently theprimary source of revenue for LGUs, even though there was a slight decline in 2003 due toa shift in government policy. Nonetheless, the decline was compensated by a rapid increasein shared taxes from VAT revenue.
- 11- 10
Figure 4.2 Size of local government revenue (%)
Source: NDC
100%
0%2000 2001 2002 2003 2004 2005 2006 2007 Fiscal Year
Local Revenue Share Central Revenue Share
88.5 79.3 78.1 77.8 77.3 76.5 75.9 74.8
11.5
20.7 21.9 22.2 22.7 23.5 24.1 25.2
80%
60%
40%
20%
Figure 4.3 Local revenue structure
Local Levied Taxes Centrally Collected Taxes
2001 Fiscal Year2002 2003 2004 2005 2006 2007
100%
0%
80%
60%
40%
20%
Share Taxes Grants
11% 12% 12% 10% 10% 9% 9%
35% 33% 33% 34% 34% 34% 34%
8% 11%19% 18% 17% 19% 18%
46% 44% 36% 38% 39% 39% 39%
Source: NDC

chapter 4
DECENTRALIZATION AND THE BUDGET FOR SOCIAL SERVICES AT TAMBON ADMINISTRATIVE LEVEL Analysis of the Budget Flows
chapter 4
The proportion of revenue from each source reveals that centrally collected taxes and grantsare the most prominent sources of revenue for LGUs in Thailand. There is only a smallchange in the share of revenue from centrally collected taxes from 2001, the first year ofdecentralization, to 2007, the most recent year. Only revenue from shared tax whichincludes the VAT revenue allocation and the motor and vehicle tax, shows a rapid increasein its share relative to total local government revenue. A related issue is the steady decreasein locally collected revenue relative to total revenue (see Figure 4.3).
- 12
Table 4.4 Grant allocation to LGUs, FY2000-FY2007
4.3 ON THE IMPORTANCE OF THE GENERAL GRANT
To be a general grant, fiscal resources from the central government must support theprovision of social services and give the LGUs fiscal authority. Figure 4.6 provides an ideahow general grants are allocated. At the first stage, general grants are allocated to PAOs,Municipalities, and TAOs at the share of 10, 40, and 50 percent, respectively. Demographicdata seems to suggest that the above shares are proportional to population size and thearea of social service delivery. Among each type of LGU, fiscal resources are allocated
- 13
Type of Allocation 2000 2001 2002 2003 2004 2005 2006 2007
1.Grants for LGUs: 30,966 40,954 50,212 66,084 91,438 110,611 126,013 139,374
(32.3) (22.6) (31.6) (38.4) (21.0) (13.9) (10.6)
PAOs, Municipalities,
TAOs 22,799 31,890 42,747 57,318 80,159 97,293 110,214 123,575
(39.9) (34.0) (34.1) (39.8) (21.4) (13.3) (12.1)
Pattaya 724 1,372 374 957 1,297 1,412 1,604 1,604
(89.6) -(72.7) (155.9) (35.5) (8.9) (13.6) (0.0)
BMA 7,443 7,692 7,091 7,809 9,983 11,905 14,195 14,195
(3.3) -(7.8) (10.1) (27.8) (19.3) (19.2) (0.0)
2.Budget for Devolved
functions/activities 3,833 32,332 27,062 – – – – –
(743.4) -(16.3) – – – – –
Total 34,799 73,286 77,273 66,084 91,438 110,611 126,013 139,374
(110.6) (5.4) -(14.5) (38.4) (21.0) (13.9) (10.6)
Million baht
Source: Budget BureauNote: Figures in Parentheses indicate percentage change from previous year
– means there is no budget allocated
It can be seen from Table 4.4 that the budget allocated to LGUs increased substantially from34,799 million baht in fiscal year 2000 to nearly 140,000 million baht in fiscal year 2007.Subsidies for PAOs, Municipalities, and TAOs soared from merely 22,799 million baht toover 123,000 million baht during the same period. An additional amount allocated tosupport LGUs in providing functions devolved from line agencies increased considerablyfrom 3,833 million baht in fiscal year 2000 to 27,062 million baht in fiscal year 2002.
Considering the distribution of grants among all LGUs, more than 80 percent of the granttotal has been allocated to PAOs, municipalities, and TAOs. This is a clear indication of thegovernmentûs attempt to make these three local entities responsible for social serviceprovision (Figure 4.4).
Figure 4.4 Share of grant allocation to LGUs
BMA PAOs, Municipalities, TAOs
2001 Fiscal Year2002 2003 2004 2005 2006 2007
100%
0%
80%
60%
40%
20%
Pattaya
19.5 14.4 11.8 12.1 10.2 11.3 10.2
79.7 84.9 86.7 86.5 88.5 87.5 88.7
Source: NDC
Figure 4.5 Grant allocation to PAOs, Municipalities, and TAOsthrough DLA classified by grant types
General Grants Grant with Specific Purposes
2001 Fiscal Year2002 2003 2004 2005 2006 2007
100%
0%
80%
60%
40%
20%
Specific Grant
40.6 60.0 45.3 36.1 49.3 45.8 51.0
23.7
7.136.9 49.0
49.644.8 41.5
35.7% 32.9
17.8 14.9
1.19.4 7.5
Share (%)
Source: NDC

chapter 4
DECENTRALIZATION AND THE BUDGET FOR SOCIAL SERVICES AT TAMBON ADMINISTRATIVE LEVEL Analysis of the Budget Flows
chapter 4- 14
according to socio-economic factors, namely population size, size of provincial income, andarea of coverage. It seems theoretically reasonable to incorporate these factors whenallocating money to LGUs within each type. Nonetheless, allocating money on an equalbasis seems at odds with efficiency, on the grounds that the marginal utility of the last bahtgiven to a poor LGU is still higher than that to a rich one.
The dissimilarity in the set of factors used for distributing money within each type of LGUmerits comment. For instance, allocation among PAOs is based on four criteria, whereasallocation among municipalities is based on just equality and population. The publicinterests of transparency and accountability would be better served if the DLA providedinformation on how it allocates fiscal resources to LGUs. The DLA does not provide the clearcriteria on how they allocate the LGU’s revenue. The DLA would withhold some of theinformation on how the grants are allocated to LGUs. As result some portion of the grant,particularly specific grants are selectively provide to some LGUs. Currently, DLA does notprovide clear criteria on how the LGU’s revenue is allocated. Information on how the grantsto LGUs are allocated is incomplete. As a result, some portion of the grants, particularlyspecific grants, are selectively provided to some LGUs.
Figure 4.6 How general grants are allocated
Source: DLA
30% Equal basis40% Population basis30% Number of village basis
General Grants(100%)
PAOs(10%)
Municipalities(40%)
TAOs(50%)
50% Equal basis20% Population basis10% GPP basis20% Area basis
50% Equal basis50% Population basis
CHAPTER5AVAILABILITY OF BUDGET
RESOURCES WITHIN THE TAO:LESSONS LEARNED FROM
THE 13 SELECTED TAOS
© U
NIC
EF
Tha
iland
/N R
odra
ksa

chapter 5
DECENTRALIZATION AND THE BUDGET FOR SOCIAL SERVICES AT TAMBON ADMINISTRATIVE LEVEL Availability of Budget Resources within the TAO: Lessons Learned from the 13 Selected TAOs
chapter 5
The fiscal information discussed in the previous chapter reveals important insights intohow the budget resources flow from the government’s line agencies to be spent within theTAOs’ boundaries. The data can be disaggregated to show what types of activities havereceived spending within the TAOs. This chapter aims to disaggregate the data into eachfunding source to reveal how the financial resources have been spent in greater detail.
The data reveals that the government line agencies continue to have an active role inproviding social services within the TAOs’ boundaries. This may due to the fact that somefunctions remain the central line agencies’ responsibility. Some of the function to betransferred remain under scrutiny and further preparation for devolution. For example,only a small fraction of Thailandûs schools of have been transferred to TAOs, and teachersand staff still receive their salaries from the Ministry of Education. Meanwhile, many of thepublic services to be transferred have been renamed or redefined by the central lineagencies to avoid the transfer. In addition, large portions of the ministry level budgetexpenditure in the TAOs result from the expanded scope of activities of many centralagencies to supplement the TAOs’ tasks. A typical example of this kind of activity is thepublic health service budget that covers expenditure for both health care centers anduniversal health security program.
5.1 CRITERIA TO SELECT THE SAMPLED TAOS
The sampled TAOs are selected according to the following criteria. We first classify TAOsinto four main groups, based on two dimensional attributes: their fiscal position and theirefficiency in providing social services. Table 5.1 shows the classification of TAOs in detail.
The rich TAOs have an average budget more than 20 million baht during 2004-2006 fiscalyear periods. TAOs in Group 1 have high income from both locally collected revenue andrevenue transferred sources from central government, and have received awards for goodgovernance. TAOs in Group 2 are considerately poorer in their fiscal position, having lessthan 15 million baht of budget, but have received the award for efficient public serviceprovision by the King Pradjadhipok’s Institute (KPI), and Good Governance reward fromNational Decentralization Committee (NDC). The TAOs in Groups 3 and 4 differ in the size oftheir budget but provide public services that are in need of considerable improvement.1
The TAOs in the first two categories provide high-quality public services based on the TAPE
Table 5.1 Division of TAOs for Field Survey
Quality of
Services
Fiscal Position
Rich Poor
Good
Need Improvement
1 2
3 4
Source: Author
1 The sampled TAOs in this group selected from the ranking of TAO’s performance provided by DLA.
model of good governance (transparency, accountability, participation, and efficiency).In addition, some of the selected TAOs conduct extended activities for special groups ofpeople such as hill tribe people and migrants. Group 2 would be the most interesting group,to learn how they decide to provide service functions to their people even with limitedresources. Such TAOs might provide a model to disseminate to TAOs in the rest of thecountry. In addition, the other groups might also offer us a great deal of information onwhat parameters contribute to better social services under different conditions.
Using the criteria described above, we selected TAOs for this study as follows:
Group 1: Suthep TAO from Chiang Mai province; Kok Gloy TAO and Tai Muang TAOfrom Phang Nga province, which has was selected to represent TAOs fromthe are impacted by the tsunami disaster;
Group 2: Bang Pra TAO from Chacheongsao province; Kok Petch TAO fromMahasarakham province; and Hyuan TAO, from Phayao province;
Group 3: Sao Hin TAO from Mae Hong Sorn province; and Nong Kung TAO from SriSa Ket province;
Group 4: Na Kaem TAO from Prachinburi province; Aou Luk Tai TAO from Krabiprovince; and Tha Sala TAO from Loei province; and Laem Son TAO fromSatun province.
5.2 BUDGET FLOW AND SOURCES OF FUNDS PROVIDING SOCIAL SERVICESIN THE TAOS
The study on the TAOs’ operations of public services and social welfare begins withidentifying the sources of funding available to TAOs. This is necessary to fully understandthe capabilities and limitations of public service delivery by TAOs and other public agencies.Ultimately, this would indicate the effectiveness of public services operated by the TAOs andother involved agencies. Investigation of the finances available at the TAO level reveals sixsignificant sources of funds:
1. Budget allocation for on and off TAOs’ budget;2. Grants for social services from each PAO to TAOs;3. Budget from various ministries spent within the TAOs’ boundaries (which is
considerably the largest amount spent on social services);4. Budget for public health volunteers;5. SML’s budget directly from the government and the CEO’s budget which depend on
the governor’s decision; and6. Budget from non-government organization (NGOs) which has an effect on TAOs’
social welfare. The NGOs not only acknowledge and develop various skills for peoplein community but also make a major contribution in empowering the community.
- 2 - 3
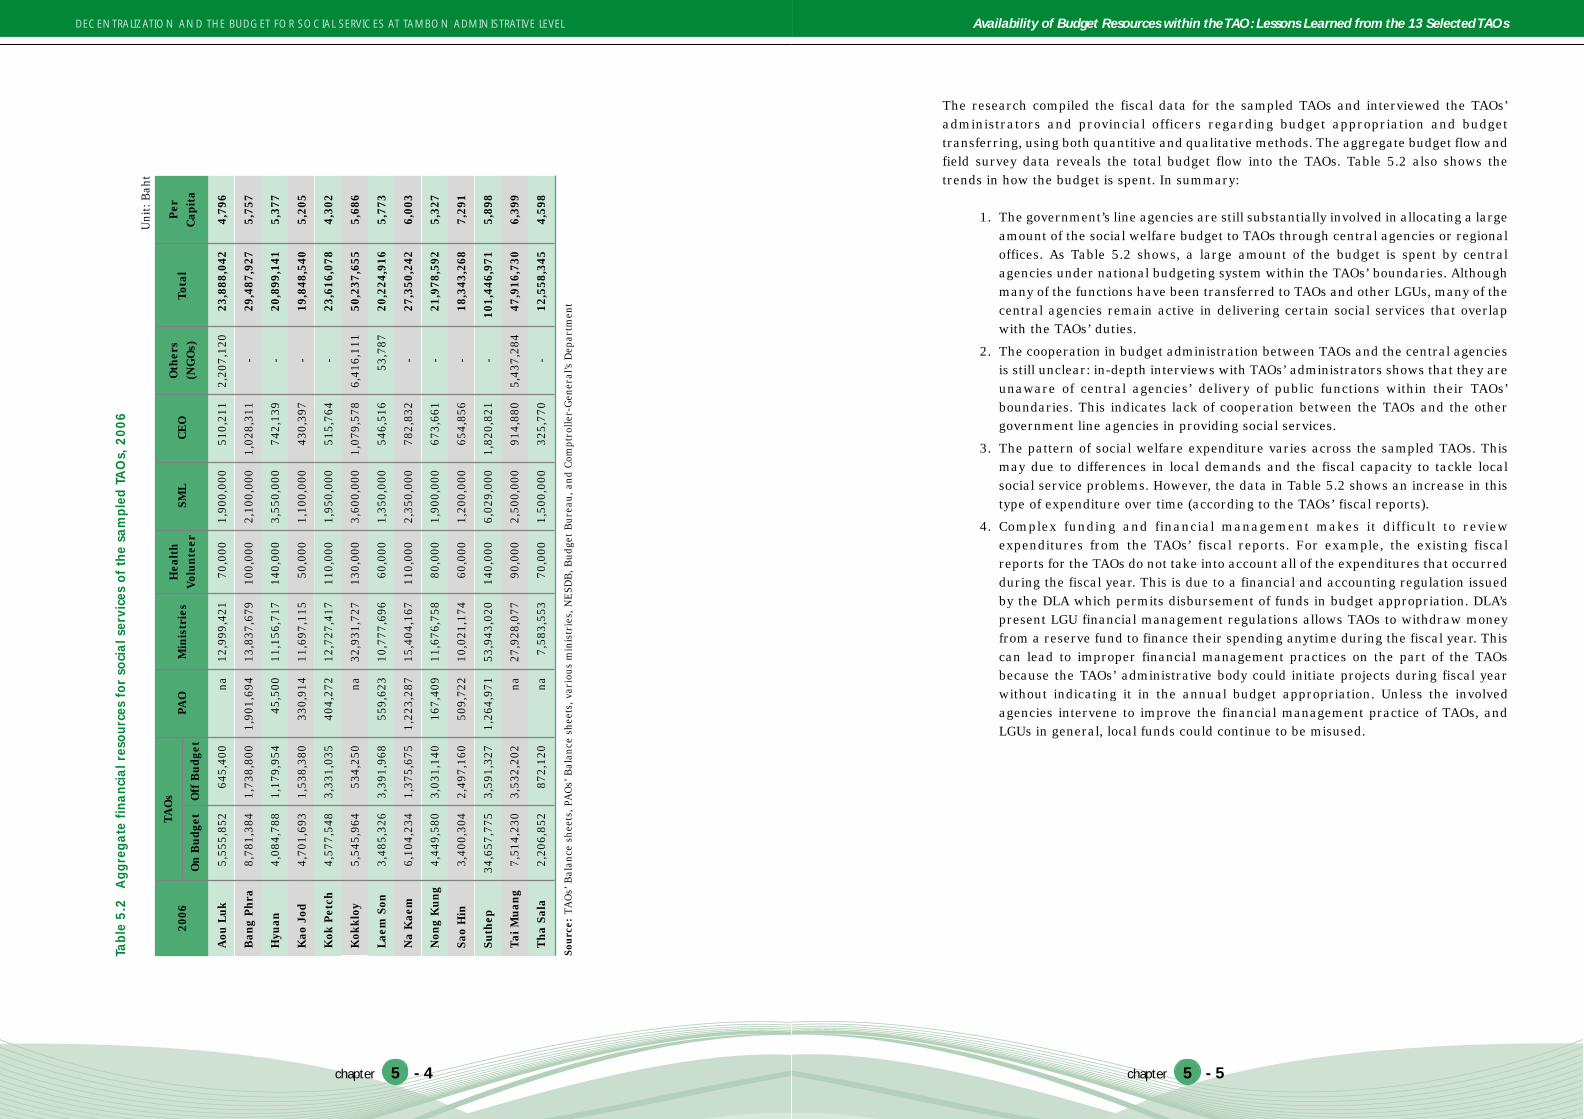
chapter 5
DECENTRALIZATION AND THE BUDGET FOR SOCIAL SERVICES AT TAMBON ADMINISTRATIVE LEVEL Availability of Budget Resources within the TAO: Lessons Learned from the 13 Selected TAOs
chapter 5
The research compiled the fiscal data for the sampled TAOs and interviewed the TAOs’administrators and provincial officers regarding budget appropriation and budgettransferring, using both quantitive and qualitative methods. The aggregate budget flow andfield survey data reveals the total budget flow into the TAOs. Table 5.2 also shows thetrends in how the budget is spent. In summary:
1. The government’s line agencies are still substantially involved in allocating a largeamount of the social welfare budget to TAOs through central agencies or regionaloffices. As Table 5.2 shows, a large amount of the budget is spent by centralagencies under national budgeting system within the TAOs’ boundaries. Althoughmany of the functions have been transferred to TAOs and other LGUs, many of thecentral agencies remain active in delivering certain social services that overlapwith the TAOs’ duties.
2. The cooperation in budget administration between TAOs and the central agenciesis still unclear: in-depth interviews with TAOs’ administrators shows that they areunaware of central agencies’ delivery of public functions within their TAOs’boundaries. This indicates lack of cooperation between the TAOs and the othergovernment line agencies in providing social services.
3. The pattern of social welfare expenditure varies across the sampled TAOs. Thismay due to differences in local demands and the fiscal capacity to tackle localsocial service problems. However, the data in Table 5.2 shows an increase in thistype of expenditure over time (according to the TAOs’ fiscal reports).
4. Complex funding and financial management makes it difficult to reviewexpenditures from the TAOs’ fiscal reports. For example, the existing fiscalreports for the TAOs do not take into account all of the expenditures that occurredduring the fiscal year. This is due to a financial and accounting regulation issuedby the DLA which permits disbursement of funds in budget appropriation. DLA’spresent LGU financial management regulations allows TAOs to withdraw moneyfrom a reserve fund to finance their spending anytime during the fiscal year. Thiscan lead to improper financial management practices on the part of the TAOsbecause the TAOs’ administrative body could initiate projects during fiscal yearwithout indicating it in the annual budget appropriation. Unless the involvedagencies intervene to improve the financial management practice of TAOs, andLGUs in general, local funds could continue to be misused.
Aou
Luk
5,55
5,85
264
5,40
0na
12,9
99,4
2170
,000
1,90
0,00
051
0,21
12,
207,
120
23,8
88,0
424,
796
Ban
g P
hra
8,78
1,38
41,
738,
800
1,90
1,69
413
,837
,679
100,
000
2,10
0,00
01,
028,
311
-29
,487
,927
5,75
7
Hyu
an4,
084,
788
1,17
9,95
445
,500
11,1
56,7
1714
0,00
03,
550,
000
742,
139
-20
,899
,141
5,37
7
Kao
Jod
4,70
1,69
31,
538,
380
330,
914
11,6
97,1
1550
,000
1,10
0,00
043
0,39
7-
19,8
48,5
405,
205
Kok
Pet
ch4,
577,
548
3,33
1,03
540
4,27
212
,727
,417
110,
000
1,95
0,00
051
5,76
4-
23,6
16,0
784,
302
Kok
kloy
5,54
5,96
453
4,25
0na
32,9
31,7
2713
0,00
03,
600,
000
1,07
9,57
86,
416,
111
50,2
37,6
555,
686
Laem
Son
3,48
5,32
63,
391,
968
559,
623
10,7
77,6
9660
,000
1,35
0,00
054
6,51
653
,787
20,2
24,9
165,
773
Na
Kae
m6,
104,
234
1,37
5,67
51,
223,
287
15,4
04,1
6711
0,00
02,
350,
000
782,
832
-27
,350
,242
6,00
3
Non
g K
ung
4,44
9,58
03,
031,
140
167,
409
11,6
76,7
5880
,000
1,90
0,00
067
3,66
1-
21,9
78,5
925,
327
Sao
Hin
3,40
0,30
42,
497,
160
509,
722
10,0
21,1
7460
,000
1,20
0,00
065
4,85
6-
18,3
43,2
687,
291
Suth
ep34
,657
,775
3,59
1,32
71,
264,
971
53,9
43,0
2014
0,00
06,
029,
000
1,82
0,82
1-
101,
446,
971
5,89
8
Tai M
uang
7,51
4,23
03,
532,
202
na27
,928
,077
90,0
002,
500,
000
914,
880
5,43
7,28
447
,916
,730
6,39
9
Tha
Sal
a2,
206,
852
872,
120
na7,
583,
553
70,0
001,
500,
000
325,
770
-12
,558
,345
4,59
8
Uni
t: B
aht
2006
TAO
s
On
Bud
get
Per
Cap
ita
Off
Bud
get
PAO
Min
istr
ies
Hea
lth
Volu
ntee
rSM
LC
EO
Oth
ers
(NG
Os)
Tota
l
Sour
ce:
TAO
s’ B
alan
ce s
heet
s, P
AO
s’ B
alan
ce s
heet
s, v
ario
us m
inis
trie
s, N
ESD
B, B
udge
t B
urea
u, a
nd C
ompt
rolle
r-G
ener
al’s
Dep
artm
ent
Tabl
e 5.
2A
ggre
gate
fin
anci
al r
esou
rces
for
soc
ial s
ervi
ces
of th
e sa
mpl
ed T
AO
s, 2
006
- 4 - 5

chapter 5
DECENTRALIZATION AND THE BUDGET FOR SOCIAL SERVICES AT TAMBON ADMINISTRATIVE LEVEL Availability of Budget Resources within the TAO: Lessons Learned from the 13 Selected TAOs
chapter 5
Table 5.3 shows that the TAOs’ own budget as a percentage of its total budget during fiscalyears 2004-2006 is the second largest budget source, relative to other sources of budgetflow within the TAOs’ boundaries. Furthermore, almost all of the selected TAOs wereallocated more budget during 2004-2006. However, the proportion of on-budget to the totalsocial services budget shows no consistency among the 13 sampled TAOs. This may be dueto variations in the local demand for social services; TAOs have to appropriate their budgetaccording to the needs of their people.
Aou Luk 2,297,960 4,118,060 5,555,852
(16.82) (18.20) (23.26)
Bang Phra 4,914,573 7,050,531 8,781,384
(29.33) (27.04) (29.78)
Hyuan 2,686,560 2,626,190 4,084,788
(18.06) (14.86) (19.55)
Kao Jod 5,457,972 504,060* 4,701,693
(35.08) (3.26) (23.69)
Kokkloy 4,340,058 6,788,990 5,545,964
(14.19) (12.20) (11.04)
Kok Petch 1,263,945 1,864,320 4,577,548
(8.76) (9.45) (19.38)
Laem Son 2,659,905 2,226,770 3,485,326
(20.80) (8.50) (17.23)
Na Kaem 2,100,347 5,046,125 6,104,234
(11.76) (20.32) (22.32)
Nong Kung 1,657,613 3,177,135 4,449,580
(18.32) (18.65) (20.25)
Sao Hin 2,724,994 3,212,046 3,400,304
(23.03) (19.42) (18.54)
Suthep 22,232,087 35,182,450 34,657,775
(30.95) (36.22) (34.16)
Tai Muang 6,603,980 12,357,847 7,514,230
(20.98) (21.64) (15.68)
Tha Sala 951,120 735,380 2,206,852
(13.37) (7.46) (17.57)
Table 5.3 On-budget of the sampled TAOs
TAO2004 2005 2006
Unit: Baht (Percentage)**
Note: * This is due to the TAO could not allocate budget for fiscal year 2005 in time; therefore, the administrators
carried forward the budget to the next year.
** Numbers in parenthesis are percentage share to aggregate financial resources.
Source: Various financial report of each sampled TAO.
Note: * Numbers in parentheses are percentage share to aggregate financial resources.
** No Budget Allocation
Source: Various financial report of each sampled TAO.
Table 5.4 Off-budget of TAOs
Aou Luk 418,860 831,920 645,400
(3.07) (3.68) (2.7)
Bang Phra 619,380 1,520,040 1,738,800
(3.70) (5.83) (5.90)
Hyuan 788,630 586,200 1,179,954
(5.30) (3.32) (5.65)
Kao Jod 1,144,520 1,927,748 1,538,380
(7.36) (12.45) (7.75)
Kok Petch 2,651,130 2,689,023 3,331,035
(18.38) (13.63) (14.1)
Kokkloy 117,390 147,825 534,250
(0.38) (0.27) (1.06)
Laem Son 2,004,238 11,296,757 3,391,968
(15.67) (43.12) (16.77)
Na Kaem 1,286,655 1,375,675
-** (5.18) (5.03)
Nong Kung 867,950 1,014,775 3,031,140
(9.59) (5.96) (13.79)
Suthep 1,786,840 1,934,966 3,591,327
(2.49) (1.99) (3.54)
Tai Muang 2,240,363 3,389,102 3,532,202
(7.12) (5.93) (7.37)
Sao Hin 1,364,876 1,676,548 2,497,160
(11.54) (10.14) (13.61)
Tha Sala 196,800 522,600 872,120
(2.77) (5.3) (6.94)
TAO2004 2005 2006
Unit: Baht (Percentage)*
In addition to their on-budget financing, TAOs can draw money from off-budget sources.Funds from off-budget sources are composed of withdrawals from reserved funds, centrallyallocated general grant with specific purposes, and specific grants. Table 5.4 reports thetotal off-budget spending and its proportion to total social services expenditure in eachTAO. The main source of this budget is from the central government’s allocation of generalgrant with specific purposes; mostly pensions for the elderly, people with disabilities, AIDspatients, and food supplements for school children. The data shows that the off-budget is
- 6 - 7

chapter 5
DECENTRALIZATION AND THE BUDGET FOR SOCIAL SERVICES AT TAMBON ADMINISTRATIVE LEVEL Availability of Budget Resources within the TAO: Lessons Learned from the 13 Selected TAOs
chapter 5
less significant than the on-budget in each TAO. However, off-budget spending is generallyincreasing, except in Aou Luk TAO, Kao Jod TAO and Hyuan TAO, where the off-budget hasan uncertain pattern which may be due to the central government allocation formula basedon population. Nonetheless, the off-budget spending has increased in recent years becausethe TAOs use it as political measure to gain popularity, shifting the financial burden for thisspending category to central grant allocation.
Considering the whole budget during the previous three fiscal years reveals that the totaloff-budget spending relative to the whole budget varies but generally increases among theselected 13 TAOs. The variation in off-budget spending might have a negative effect onsocial welfare strategy and policy planning since the chief executive will not be certain ofthe budget allocation. The budget for social welfare might not be sufficient in the followingfiscal year, having a negative impact on short-and long-term strategic planning. Theincrease in general grants with specific purposes to TAOs might result from the centralgovernmentûs support for pension funds. The TAOs simply submit a list of names of eligiblepersons to request money from the central agencies. The TAOs usually receive the fundseven if some of the people are not eligible for pensions. This practice has turned the centraldistribution of pension funds into a political instrument for local politicians, in that they canexploit the pension agenda to gain political popularity with the local people.
The percentage of the budget, both on- and off-, spent on social services was the highest inLaem Son TAO (61.2%), followed by Bang Phra TAO (58.8%) and Tai Muang TAO (57.3%),while it was the lowest in Kok Kloy TAO (24.5%), Ao Luktai (37.3%) and Kao Jod (41.7%).
However, social welfare expenditures, both on- and off-, is the highest in Ao Luktai TAO,Suthep TAO and Kok Kloy TAO (90%); followed by Kao Jod TAO, Bang Phra TAO, Na KaemTAO and Hyuan TAO (80%); Tai Muang TAO and Tha Sala TAO (70%); Nong Kung TAO, SaoHin TAO and Kok Petch TAO (60%); and is lowest in Lam Son TAO (50%).
Aou Luk 33.4 3.9 37.3
Bang Phra 49.1 9.7 58.8
Hyuan 33.5 9.7 43.2
Kao Jod 31.4 10.3 41.7
Kokkloy 22.4 2.2 24.5
Kok Petch 24.7 18.0 42.7
Laem Son 31.0 30.2 61.2
Na Kaem 37.9 8.5 46.4
Nong Kung 26.4 18.0 44.5
Sao Hin 30.1 22.1 52.3
Suthep 50.6 5.2 55.8
Tai Muang 39.0 18.3 57.3
Tha Sala 35.1 13.9 49.0
Table 5.5 Share of on-budget and off-budget for social services of the sampledTAOs in 2006
Unit: Percent
- 9
TAOs On Budget/Total budget
Off Budget/Total budget
Total socialservice budget/
Total budget
Note: There is something missing in the total off-budget since the raw data for each TAO is varied and the format is
unfamiliar; for example, some TAOs classified their budget completely but the others are not. Therefore, some
mistakes might appear in the data .
Source: Calculated from fiscal reports of the sampled TAOs
Table 5.6 Budget from PAOs, total amounts and their share of TAOs’ aggregate budget,2004-2006
Aou Luk na na na
Bang Phra na 2,519,598 1,901,694
(9.66) (6.45)
Hyuan 70,585 79,484 45,500
(0.47) (0.45) (0.22)
Kao Jod na 328,424 330,914
(2.12) (1.67)
Kokkloy na na na
Kok Petch 110,996 347,233 404,272
(0.77) (1.76) (1.71)
Laem Son na 513,639 559,623
(1.96) (2.77)
Na Kaem 1,191,870 1,859,745 1,223,287
(6.67) (7.49) (4.47)
Nong Kung na 463,536 167,409
(2.72) (0.76)
Sao Hin 203,705 485,771 509,722
(1.72) (2.94) (2.78)
Suthep na 898,785 1,264,971
(0.93) (1.25)
Tai Muang na na na
Tha Sala na na na
TAO2004 2005 2006
Unit: Baht (Percentage)
Note: Numbers in parenthesis are percentage share to aggregate financial resources.
Source: Various financial reports of the sampled PAOs.
- 8

chapter 5
DECENTRALIZATION AND THE BUDGET FOR SOCIAL SERVICES AT TAMBON ADMINISTRATIVE LEVEL Availability of Budget Resources within the TAO: Lessons Learned from the 13 Selected TAOs
chapter 5
The Provincial Administrative Organization (PAO) is the upper tier LGU within eachprovince. It is responsible for functions beyond lower tiers units (i.e., municipalities andTAOs) and for general assistance to any LGUs that needs it. Table 5.6 shows the budgetallocated from Provincial Administrative Organization (PAO) to support the TAOs’ activities.The data shows that the amount of budget available from the PAOs has a small impact onthe whole budget, relative to the total budget in each TAO. Moreover, as seen in the tableabove, only two TAOs, Na Kaem TAO in Prachin Buri in 2004 and 2005 and Bang Phra TAOin Cha Choeng Sao in 2005 and 2006, had more than five percent provincial budget whereasthe rest had less than than five percent.
Table 5.7 Budget from line ministries, total amount and its share of TAOs’ aggregatebudget, 2004-2006
Aou Luk 10,083,029 12,126,851 12,999,421
(73.79) (53.60) (54.42)
Bang Phra 11,029,963 12,596,716 13,837,679
(65.82) (48.31) (46.93)
Hyuan 11,079,138 10,668,959 11,156,717
(74.46) (60.38) (53.38)
Kao Jod 8,838,021 11,544,227 11,697,115
(56.80) (74.55) (58.93)
Kokkloy 23,299,028 31,724,025 32,931,727
(76.16) (57.02) (65.55)
Kok Petch 10,247,361 12,695,171 12,727,417
(64.34) (71.04) (53.89)
Laem Son 7,808,837 10,139,286 10,777,696
(61.07) (38.70) (53.30)
Na Kaem 14,377,672 14,157,774 15,404,167
(80.49) (57.01) (56.32)
Nong Kung 8,026,308 10,217,105 11,676,758
(88.70) (59.96) (53.13)
Sao Hin 7,316,579 9,642,350 10,021,174
(61.84) (58.30) (54.63)
Suthep 47,539,747 52,791,508 53,943,020
(66.19) (54.35) (53.17)
Tai Muang 20,204,906 27,477,281 27,928,077
(64.18) (48.11) (58.28)
Tha Sala 5,824,845 6,952,138 7,583,553
(81.89) (70.57) (60.39)
TAO2004 2005 2006
Unit: Baht (Percentage)
Note: Numbers in parenthesis are percentage share of aggregate financial resources
Source: Comptroller General Department, Ministry of Finance
Table 5.7 illustrates that the budget allocated by line ministries to TAOs has the mostinfluence on administration and social welfare service in every TAOs. The most importantrole of the government line agencies, either ministry level or regional level, is to performmissions different from the TAOs’ in order to avoid duplication of services. In practice, it isdifficult to clearly distinguish mission designation between TAOs and other government lineagencies. The field survey unveiled that many of the government line agencies basicallyonly adjusted or revised missionûs titles. However, nothing changed, neither the practicalwork nor transfer of administrative authority from the line agencies to the localadministrative level.
The budget allocated by various ministries to TAOs increased from 2004 to 2006. However,the ministries’ budget as a proportion of the total TAOs’ budget decreased during the sameperiod. It started at 45 percent and declined all three years. This implies that variousministries have transferred more of their duties and budget to DLA and thus the budgetallocated by ministries makes up a smaller proportion of the whole budget within theTAOs’ boundaries.
Aou Luk 64.8 28.7 1.2 4.1 1.2 100.0
Bang Phra 63.1 27.3 3.4 4.7 1.4 100.0
Hyuan 55.3 37.7 2.6 2.3 2.1 100.0
Kao Jod 69.5 24.3 2.4 1.6 2.2 100.0
Kokkloy 53.3 39.3 3.3 2.9 1.3 100.0
Kok Petch 73.7 20.8 2.2 1.9 1.5 100.0
Laem Son 60.9 30.1 4.7 2.8 1.5 100.0
Na Kaem 58.7 31.0 2.0 6.5 1.8 100.0
Nong Kung 73.8 20.0 2.3 2.1 1.7 100.0
Sao Hin 65.2 26.4 4.0 3.4 1.0 100.0
Suthep 44.8 38.1 12.7 1.7 2.8 100.0
Tai Muang 53.3 39.3 3.2 2.9 1.3 100.0
Tha sala 65.0 28.3 1.7 2.7 2.3 100.0
Total 57.2 33.0 5.1 2.9 1.8 100.0
Table 5.8 Disaggregation of central expenditure program at TAOs Level, FY 2006
TAOs Education PublicHealth
SocialWelfare
Housing andCommunities
Religious,culture andRecreation
Total
Source: Calculated by authors
Unit: Percent
The aggregate data of central line agencies’ expenditures in the sampled TAOs’ boundariescan be dispersed into the various types of expenditures. The expenditure categories areeducation, public services, social welfare services, housing and communities, and religious,culture and recreation programs. Details of each expenditure program are discussedbelow.
- 10 - 11

chapter 5
DECENTRALIZATION AND THE BUDGET FOR SOCIAL SERVICES AT TAMBON ADMINISTRATIVE LEVEL Availability of Budget Resources within the TAO: Lessons Learned from the 13 Selected TAOs
chapter 5
5.3 The Transfer of Child Care Center and Education Services to TAOs
The Thai Constitution of 1997, Article 284, mandated that Thailand enact a“Decentralization Plan and Procedure Act” to provide a framework for decentralization.The Decentralization Plan and Procedure Act states that the government must transferchild care and educational services, both formal and informal educational system, to localgovernment units (LGUs). The National Decentralization Committee (NDC) has laid out aplan to transfer child care centers to LGUs from the relevant government agencies, such asthe Public Welfare Department and the Religious Affairs Department2. With thecooperation of the budget bureau, the transfer scheme has proven quite successful. Manychild care centers have been transferred to LGUs, particular at the tambon administrativeorganization (TAO) level. The government simply removed the budget for child care from itsagencies and added to the LGUs’ grant allocation.
However, one shortcoming of the child care center transfer program has been the standardof the services. The field survey of sampled TAOs shows that the child care centers havewide coverage; TAOs provide service to nearly every child in the jurisdiction. However, theTAOs do not receive any assistance from related government agencies to improve thequality of the services. Since the government cut the budget to its agencies for child carecenters, the staff of the agencies have been transferred or removed from the function. Thus,the quality of the child care center service is left up to the initiative of the TAOs’administrators, which depends on their understanding of the importance of the service.
5.3.1 Educational Service Transfer Program
The Decentralization Plan and Procedure Act also requires that the Ministry of Educationdevolve educational services to the LGUs. Specifically, the Provincial AdministrativeOrganizations (PAOs) would be responsible for higher educational function whilemunicipalities and TAOs would be responsible for primary and secondary school. TheNational Decentralization Committee has followed the guidance of the law and begunnegotiations with the Ministry of Education to transfer the education services to LGUs.Concerned by LGUs’ limited budget and inadequate management capability in providingeducation services, the Ministry of Education has set certain criteria for the LGUs to meetbefore transfer can begin.3 LGUs are required to have an adequate educational budget andcommitment to providing educational services manifested in their development plan.Eventually, the two agencies agreed in principle that the first batch, or account, of schoolsthat will be transferred will not be more than three units to each PAO, two to eachmunicipality, and only one to each TAO, if the LGUs met the standards. Also the LGUs mustmaintain the same quality of education services as before the transfer. A special action planwas drafted by special sub-committee set up by the National Decentralization Committee toexpedite the transfer of the education function to LGUs.
5.3.2 Directions for the transfer of educational service to LGUs
Education services are supposed to devolve to the LGUs in order to allow the LGUs toparticipate in educational service delivery. Traditionally, all educational service functionsare the responsibility of the Office of the Basic Education Commission (OBEC). However, theDecentralization Plan and Procedure Act specifies that the LGUs have the right to beinvolved in educational service provision. But it is not in compliance with the NationalEducation Act of 1999 which indicates that LGUs can participate in educational servicesonly when they are proven ready to provide the service. Consequently, the Ministry ofEducation is reluctant to accept the transfer scheme of the National DecentralizationCommittee yet it cannot resist because the committee’s plan is mandatory. The Ministry ofEducation has used delaying tactics to prolong the process. Unlike that of other functions,the transfer of educational services does not have a time constraint, since poormanagement of the process could result in complex and negative effects on both thestudents and the educational system. Therefore, progress has been slow, as indicated bythe limited number of schools which have actually been devolved to the LGUs.
The most difficult issue is the transfer of personnel management (mostly teachers and schoolstaff). In Thailand’s educational history, there have been many disputes between theMinistry of Education and the Ministry of Interior over supervision of education. Accordingto the decentralization plan, all educational personnel, i.e. teachers, are to be transferredto the LGUs. Many teachers still have a bad impression of the Ministry of the Interior andhave resisted the transfer because devolution would place education under the authority ofthe DLA which is under the Ministry of Interior. Initially, all teachers and school staff wereintended to be under the supervision of the LGUs, but afterward the teachers staged aprotest against the resolution and submitted petition to the Ministry of Education and theDecentralization Committee. To settle the dispute, the Decentralization Committee decidedto allow educational personnel voluntarily to choose whether to be under the LGUs’supervision or remain with the Ministry of Education.
In addition, all school assets (buildings and properties), including all liabilities, will betransferred to the LGUs. Thus, LGUs will have the opportunity to receive additional fundingfrom the central government to keep all properties in good condition.
5.3.3 The Recent Situation of the School Transfer Program
According to the transfer criteria, the schools to be transferred are listed in 2 accounts:4
Account I and II. All schools listed in Account I have already been transferred to LGUs.Only 15 schools have been transferred to TAOs. 10 of 279 schools listed in Account II havebeen transferred to TAOs.5
2 Detail can seen in the national decentralization plan of 2001.3 The Ministry of Education notification on Criterion and Evaluation for Basic Education Transferring to the LGUs
of 29 September 2003.
4 Account I is the lists of schools which will be transferred according to the agreement between Decentralization
Committee and Ministry of Education. Not more than 3 schools will be transferred to Provincial Administrative
Organizations. Not more than 2 schools will be transferred to Municipalities. Not more than 1 school will be
transferred to TAO. Total schools under account I is 69. Account II is the lists of schools that are voluntarily
willing to be under LGUs (not included in Account I.)5 These schools are: Aounang TAO in Krabi; Muangwan and Phuhan TAOs in Khonkaen; Bangkonom TAO in
Ayuthaya; Kokchanai TAO in Pathalung; Nonkoa, Srisurin and Muensri TAOs in Surin; Wangnamkao TAO in
Sukhothai; and Bankoa TAO in Udonthani. Moreover, there are 5 more special account schools[0] which met the
criteria of the qualified committee of the Ministry of Education in 2007: Muengpan and Shrinekao TAOs in
Chiengrai; Kukod TAO in Pathumthanee; Yanyao TAO in Sukhothai; and Hueymeg TAO in Udonthani.
- 13- 12

chapter 5
DECENTRALIZATION AND THE BUDGET FOR SOCIAL SERVICES AT TAMBON ADMINISTRATIVE LEVEL Availability of Budget Resources within the TAO: Lessons Learned from the 13 Selected TAOs
chapter 5
Research into the TAOs’ budget allocation and field survey also reveals that TAOs whichhave not met the criteria for transfer continue to provide assistance to their schools, forinstance, they allocate some of their budget to support school activities. This assistanceincludes the budget for supplementary food (milk) and study materials per the schools’requirements.
5.4 The Education Budget Allocation to TAOs
Table 5.10 shows details of educational spending in the sampled TAOs. The figures arecalculated by dividing the total education budget by the number of children aged 0-13within the province. We used the total education budget allocated from various ministries tothe provincial level. To convert to the TAO level, we multiplied the budget per child on theprovincial level by the number of children aged 0-13 within the TAO’s area. The result is theaverage educational budget from central agencies within the TAO’s boundaries.
According to Table 5.10, the educational plan’s budget receives the greatest portion of allfive social service functions. The educational plan’s budget averaged 53.71, 62.80, and61.65 percent in the fiscal years 2004, 2005, and 2006, respectively. The educationalbudget allocation reflects the importance of educational social services. Among the 13sampled TAOs, Kok Petch TAO, Sri Sa Ket and Nong Kung TAO, Maha Sarakham spent thelargest proportion of their budget on education during the last three years, whereas SuthepTAO, Chiangmai allocated the smallest proportion on education. This may due to the factthat the schools in the three TAOs in rural areas have to take responsibility in deliveringeducation for their children. In contrast, Suthep TAO has a smaller fiscal burden supportingthe service since it located next to the city of Chiang Mai which provides education forchildren in the surrounding TAOs. Box 1 describes an example of budget allocation forschool in case of Bang Phra TAO. The information identifies the channels of budget flowfrom the central budgeting system and financial assistance provided by the TAO to supportschool activities.
Regular 230 9 2 219
Special 62 1 1 60
Total 292 10 3 279
Table 5.9 Number of Schools transferred to the LGUs under the Account II Program
Source: Report from the National Decentralization Committee 4/2007
Note: As of August 23, 2007
- 14
School Type Total TransferredWithdraw
from the planNet
- 15
Table 5.10 Educational budgets allocated by various ministries andits share of total social services expenditure
Aou Luk 6,306,920 7,980,536 8,422,682
(62.55) (65.81) (64.79)
Bang Phra 4,788,222 8,074,405 8,735,612
(43.41) (64.10) (63.13)
Hyuan 4,050,673 5,907,283 6,165,540
(46.40) (55.37) (55.26)
Kao Jod 5,336,621 7,934,788 8,134,510
(60.38) (68.73) (69.54)
Kokkloy 11,779,806 17,425,241 17,549,781
(50.56) (54.93) (53.29)
Kok Petch 7,347,820 9,419,569 9,374,500
(71.70) (74.20) (73.66)
Laem Son 4,277,752 6,258,331 6,563,220
(54.78) (61.72) (60.90)
Na Kaem 5,566,933 8,770,523 9,035,836
(38.72) (61.95) (58.66)
Nong Kung 5,344,200 7,526,534 8,621,908
(66.58) (73.67) (73.84)
Sao Hin 4,118,691 6,296,188 6,532,554
(56.29) (65.30) (65.19)
Suthep 15,901,721 24,375,986 24,175,144
(33.45) (46.17) (44.82)
Tai Muang 10,254,828 15,275,872 14,892,766
(50.75) (55.59) (53.33)
Tha Sala 3,651,888 4,785,030 4,931,945
(62.70) (68.83) (65.03)
Average 6,825,083 10,002,330 10,241,231
(53.71) (62.80) (61.65)
TAO 2004 2005 2006
Unit: Baht (Percentage)
Education
Note: Numbers in parenthesis are the percentage of total
social service expenditures.
Source: Calculated from data of CGD.

chapter 5
DECENTRALIZATION AND THE BUDGET FOR SOCIAL SERVICES AT TAMBON ADMINISTRATIVE LEVEL Availability of Budget Resources within the TAO: Lessons Learned from the 13 Selected TAOs
chapter 5
Bang Phranet Rojana Oupathum School is located on Moo 5 Thambol Bang Phra,Muang, Chachoeng-Sao and established in 1935. This school was bestowed agrant-in-aid, 1000 Baht, in the year 1972 and a subsidized budget from theGovernment Lottery Office in order to construct a school building. Now, the schoolbelongs to the Ministry of Education, Office of Basic Education Committee,Chachoeng-Sao Education Service Area 1 Office.
Box 1
Example of Budget Flow to Schools in TAOs’ Area
13 teachers’ salary(25,000 Baht per person)
A subsidy spent on childcare center’s basiceducational operations(per person)
A grant-in-aid spent onelementary students’basic educationaloperations (per person)
A grant-in-aid spent onbasic factors to poorstudents
Supplementary food fee(Milk)
Lunch fee
Sports’ promotion project
Child Care Centre Project
Private Donation
Revenue Sources of Bang Phranet Rojana Oupathum School
Source: Bang Phra TAO and Office of Basic Education Committee
Unit: Baht
3,900,000 3,900,000 3,900,000 3,900,000
Na Na 47,800 80,178
Na Na 158,400 196,704
Na Na Na 14,720
216,600 470,535 485,850 Na
190,800 425,500 253,000 Na
25,500 0 0 Na
0 0 27,500 Na
800,000
Office of BasicEducationCommittee
Office of BasicEducationCommittee
Office of BasicEducationCommittee
Office of BasicEducationCommittee
Bang Phra TAO
1997’s Charity
Types of Revenue 2004 2005 2006 2007 Note
- 17- 16
As in the above table, we encountered that all of 13 teachers look after 227students; moreover, the average teacher’s salary is 25,000 baht/person and the totalis 3,900,000 baht/year; according to the Office of Basic Education Area 1. Thedescriptions of expenditures are the followings:
1. There are 83 students in Child Care Centre allocated a general grant.The list of basic education operation’s expenditure (per person) is 300 baht/person in the educational year 2006 and 483 baht/person in theeducational year 2007.
2. There are 114 students studying in the elementary allocated by generalgrant and the list of basic education operation’s expenditure is 550 baht/person, 684 baht/person in the educational year 2006 and 2007subsequently.
3. There are 32 poor students who were allocated a general grant and the listof basic education operation’s expenditure is 230 baht/person from theOffice of Basic Education Committee.
We are unable to report the actual number of the expected budget that should havebeen allocated to schools that belonged to the Ministry of Education because thebudget allocation system of the office of Basic Education Committee Area 1 is stillambiguous. On the other hand, the Educational Service Area Office always plansoff-budget expenditure to operate various missions that it has ordered. In case thereis a remaining budget, it will be allocated to every school for researching.
Followings are the descriptions of Bang Phra TAO’s revenue that allocated socialservices to Bang Phranet Rojana Oupathum School; according to the educationalplan:
1. Supplementary food fees (milk) altogether cost 216,600 baht, 470,535 bahtand 485,850 baht during the three budget years, 2004-2006.
2. Lunch fees cost altogether 190,800 baht, 425,500 baht and 253,000 bahtduring the three budget years, 2004-2006.
3. Local sports promotion project was subsidized by Bang Phra TAO and cost25,500 baht, altogether.
4. Child Care Centre Project was subsidized by Bag Phra TAO in the year 2005and cost 27,500 baht, altogether.
Additionally, in the year 1997, there was some other grant-in-aid to supply manytechnology applicationts such as a computer laboratory and language laboratorycosting 800,000 baht, altogether.

chapter 5
DECENTRALIZATION AND THE BUDGET FOR SOCIAL SERVICES AT TAMBON ADMINISTRATIVE LEVEL Availability of Budget Resources within the TAO: Lessons Learned from the 13 Selected TAOs
chapter 5
5.5 The Transfer of Public Health Service to TAOs
5.5.1 The Role of TAOs in Health Care Service
Under the Decentralization Plans and Procedures Act, TAOs have been assigned four rolesin health care service provision which cover support, prevention, treatment andrehabilitation. However, the government has also introduced the Universal Health CareProgram to provide public health services to cover all citizens in parallel with thedecentralization process. The program gives Thai people the opportunity to access anextensive public health care program. In consequence, the TAOs with scarce fiscal resourceshave limited themselves to the support and prevention functions in order to avoidduplication of services, and play only supportive role in the other public health services.The field survey found that TAOs cooperate actively with district health care centers undersupervision of the Ministry of Public Health to provide the health check-ups and advice onindividual health care. The district health centers normally perform much of their servicesthrough the village health volunteers that live in the areas.
Currently, the TAOs and the National Health Security Office (NHSO), which is in charge ofthe Universal Health Care program, have agreed to a pilot program to transfer the districthealth care centers nationwide to the supervision of the TAOs. Under this program, theTAOs and the NHSO have set up a local health security fund to subsidize the district healthcare centers. The basic principle of health care service is that service within TAOs’boundaries should belong to the TAOs as a center of activity and pool the budget from eachof the government’s health care service line agencies, because the TAOs know the demandof people in their area better than the others. By working together, they can reduce theduplication of effort or operations without cooperation. As such the pilot program aims toshare the cost of the basic health care program provided by the district health care center.The NHSO would allocate a portion (37.50 baht per person in the TAO) of the UniversalHealth Care program that it receives from the government. Likewise, the TAO wouldcontribute an amount equal to 10 percent of the total funds received from the NHSO tospend for its health care services. As of 2007, 35 district health care centers have beentransferred to the TAOs with 16 more units underway.
TAOs have made a lot of progress on the preceding health care center transfer program.Several of the sampled TAOs allocate more of their budget to support health care centersthan agreed. The TAOs spend the additional money to buy additional health care servicefrom the private sector to insure health care for people in their areas.
Some of the TAOs have even expanded their health care service provision according todemands of each area, for instance, occupational development programs (massage for health),community health care development programs and dental care. The most common healthcare prevention programs found in the survey were dengue fever prevention program,annual health check up for elderly, and so on.
5.5.2 Local Personnel and Health Care Service at TAO Level
Currently, some health care personnel have voluntarily transferred to work under TAOs.However, they will lose their pension fund and have to work under TAO framework within
the TAO area only until they retire. If they have any problems, they will not be able totransfer to other areas.
Actually, the personnel transfer criteria should transfer positions instead of the personnelthemselves. If they do not voluntarily transfer to TAOs but their position has already beentransferred, they will have two choices, either resign or find a new position. The criteria forthe transfer of health care personnel should not follow the education service personneltransfer because they will face problems similar to the ones face by educational personnelcurrently.
5.5.3 The Government Role in Health Care Service at TAO Level
The Ministry of Public Health should allocate additional budget to support the currentspending of the transferred health care centers, such as the expense for utilities (water andelectricity) and materials. These expenses are not included in the TAO grants yet (whichcurrently include just salaries and welfare of the personnel).
5.5.4 How to improve Health Care Service Capacity
Currently, the health care service provision at TAO level operates according to the interestof chief executive of each TAO. The TAO administrative level and health care officers shouldbe trained in health care service. Thus, they will understand and perform their health careduties better.
The TAO should establish community health care plan to improve their capacity in healthcare service provision.
The health care database should be developed so that it can be used by both TAOs and theother health care line agencies. The best way to develop the data base would be an onlinesystem which others would be able to access easily.
The health care database should list the people who are not registered but live in the area,because they are not under the health security plan. Finally, the health care costs will bethe burden of the health care centers.
The system for transferring patients from health care centers to community hospitalsshould be clarified. After transferring health care center to TAOs, the health care net maybe changed because it will depend on the TAO instead. The health care centers may have totransfer the patients outside their health care net. In this case, TAOs will have to absorb thecosts by themselves.
- 19- 18
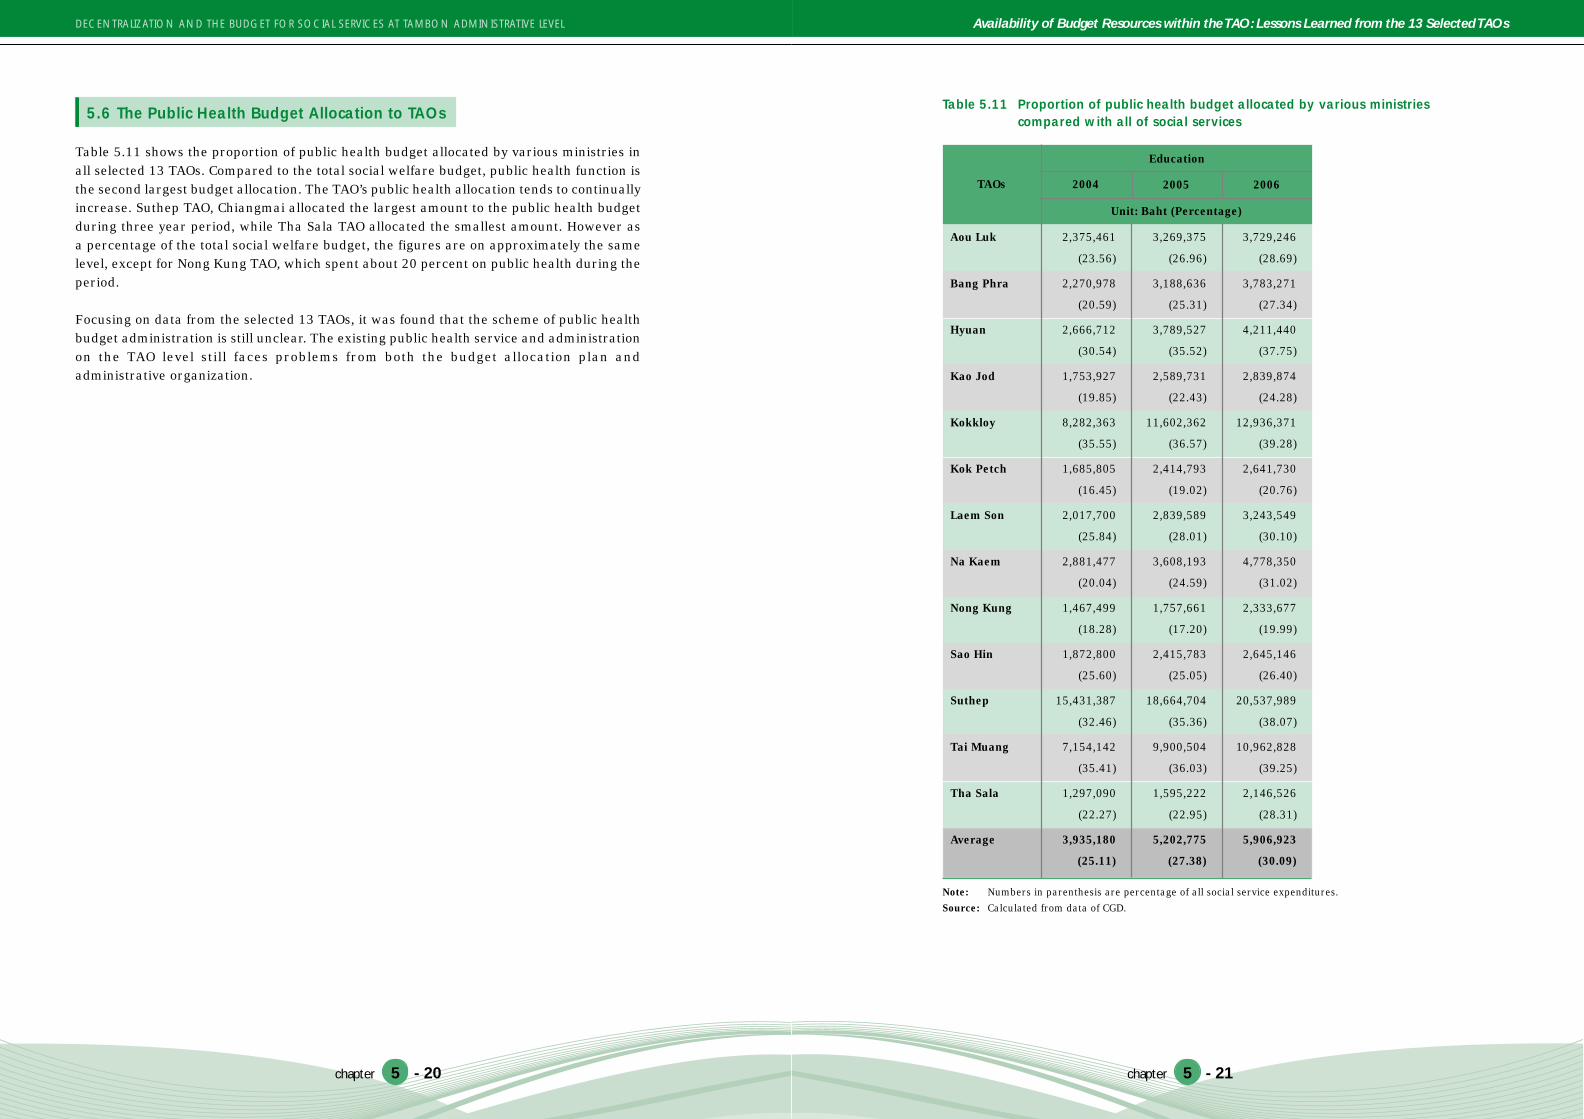
chapter 5
DECENTRALIZATION AND THE BUDGET FOR SOCIAL SERVICES AT TAMBON ADMINISTRATIVE LEVEL Availability of Budget Resources within the TAO: Lessons Learned from the 13 Selected TAOs
chapter 5
5.6 The Public Health Budget Allocation to TAOs
Table 5.11 shows the proportion of public health budget allocated by various ministries inall selected 13 TAOs. Compared to the total social welfare budget, public health function isthe second largest budget allocation. The TAO’s public health allocation tends to continuallyincrease. Suthep TAO, Chiangmai allocated the largest amount to the public health budgetduring three year period, while Tha Sala TAO allocated the smallest amount. However asa percentage of the total social welfare budget, the figures are on approximately the samelevel, except for Nong Kung TAO, which spent about 20 percent on public health during theperiod.
Focusing on data from the selected 13 TAOs, it was found that the scheme of public healthbudget administration is still unclear. The existing public health service and administrationon the TAO level still faces problems from both the budget allocation plan andadministrative organization.
Table 5.11 Proportion of public health budget allocated by various ministriescompared with all of social services
Aou Luk 2,375,461 3,269,375 3,729,246
(23.56) (26.96) (28.69)
Bang Phra 2,270,978 3,188,636 3,783,271
(20.59) (25.31) (27.34)
Hyuan 2,666,712 3,789,527 4,211,440
(30.54) (35.52) (37.75)
Kao Jod 1,753,927 2,589,731 2,839,874
(19.85) (22.43) (24.28)
Kokkloy 8,282,363 11,602,362 12,936,371
(35.55) (36.57) (39.28)
Kok Petch 1,685,805 2,414,793 2,641,730
(16.45) (19.02) (20.76)
Laem Son 2,017,700 2,839,589 3,243,549
(25.84) (28.01) (30.10)
Na Kaem 2,881,477 3,608,193 4,778,350
(20.04) (24.59) (31.02)
Nong Kung 1,467,499 1,757,661 2,333,677
(18.28) (17.20) (19.99)
Sao Hin 1,872,800 2,415,783 2,645,146
(25.60) (25.05) (26.40)
Suthep 15,431,387 18,664,704 20,537,989
(32.46) (35.36) (38.07)
Tai Muang 7,154,142 9,900,504 10,962,828
(35.41) (36.03) (39.25)
Tha Sala 1,297,090 1,595,222 2,146,526
(22.27) (22.95) (28.31)
Average 3,935,180 5,202,775 5,906,923
(25.11) (27.38) (30.09)
TAOs 2004 2005 2006
Unit: Baht (Percentage)
Education
Note: Numbers in parenthesis are percentage of all social service expenditures.
Source: Calculated from data of CGD.
- 20 - 21

chapter 5
DECENTRALIZATION AND THE BUDGET FOR SOCIAL SERVICES AT TAMBON ADMINISTRATIVE LEVEL Availability of Budget Resources within the TAO: Lessons Learned from the 13 Selected TAOs
chapter 5
Table 5.12 Health volunteers’ budget, 2004 to 2006
Aou Luk 45,000 45,000 60,000
(0.38) (0.27) (0.33)
Bang Phra 52,500 52,500 70,000
(0.38) (0.23) (0.29)
Hyuan 67,500 67,500 90,000
(0.21) (0.12) (0.19)
Kao Jod 75,000 75,000 100,000
(0.45) (0.29) (0.34)
Kokkloy 52,500 52,500 70,000
(0.74) (0.53) (0.56)
Kok Petch 105,000 105,000 140,000
(0.15) (0.11) (0.14)
Laem Son 45,000 45,000 60,000
(0.35) (0.17) (0.30)
Na Kaem 37,500 37,500 50,000
(0.24) (0.24) (0.25)
Nong Kung 105,000 105,000 140,000
(0.71) (0.59) (0.67)
Sao Hin 60,000 60,000 80,000
(0.66) (0.35) (0.36)
Suthep 97,500 97,500 130,000
(0.32) (0.18) (0.26)
Tai Muang 82,500 82,500 110,000
(0.57) (0.42) (0.47)
Tha Sala 82,500 82,500 110,000
(0.46) (0.33) (0.40)
TAOs2004 2005 2006
Unit: Baht (Percentage)
Note: Numbers in parenthesis are percentage of all social service expenditures.
Source: Field surveyed by author.
The public health volunteers’ budget, as shown in Table 5.12, contributes less than1 percent of the total funds available in TAOs’ boundaries. The formula for allocating thisbudget uses an “equality basis,” i.e. all villages equally receive 10,000 baht. Initially theMinistry of Public Health allocated 7,500 baht per village and raised it to the current levelin 2006.
Clearly, the equality basis allocates funds without consideration of how many people live ineach village. However, empirical research finds that the organization responsible forbudget administration may differ from one TAO to another. For instance, the basic healthcare center of each village is responsible for budget administration and management insome TAOs while in others the TAOs themselves are responsible for the fund management.The non-specified budget administrator causes uncertain budget allocation, inefficient orconfused use of the money and also creates misunderstandings among the healthvolunteers concerning how to use the money properly and efficiently in both the short- andlong-term.
The purpose of the budget for health volunteers is to support public health care servicesand to promote health care. However, many of the sampled TAOs lack the capability tomanage and organize the budget properly. Though many of the sampled TAOs shows theintention to perform the functions they did not have well-trained staffs to handle thisfunction. The most common practice of the TAOs is to provide additional budget tosupplement the budget for health volunteers’ activities.
- 22 - 23

chapter 5
DECENTRALIZATION AND THE BUDGET FOR SOCIAL SERVICES AT TAMBON ADMINISTRATIVE LEVEL Availability of Budget Resources within the TAO: Lessons Learned from the 13 Selected TAOs
chapter 5
Table 5.13 displays the budget for public health volunteers. When we consider public healthvolunteers expenditure in TAOs’ boundary, the allocated budget has never met the realdemand because the criteria for budget allocation is the number of villages regardless ofthe actual population. This affects the quality of health volunteer services in some TAOs,particularly those with large populations.
For instance, Suthep TAO has fourteen villages and the largest population within eachvillage, while Hyuan TAO has much less population than Suthep TAO. Hence, Suthep TAO’sbudget for public health volunteers per capita is hardly enough, especially when comparedto Hyuan TAO and other TAOs which less population. Suthep TAO’s budget for public healthvolunteers is less than 10 baht per person whereas Hyuan TAO’s is over 25 baht per person.
Another problem with the budget allocated to public health volunteers is the complicatedcriteria that set the program according to the ratio of households per health volunteer. Thecriteria do not specify the number of members in each household, leading to an insufficientnumber of health volunteers in areas where the average size of the household is larger.A lack of proper public health services can be anticipated in such areas.
82,2
97,9
60
Aou
Luk
752
,500
52,5
0070
,000
4,83
44,
837
4,98
110
.86
10.8
514
.05
Ban
g P
hra
1075
,000
75,0
0010
0,00
04,
878
4,97
55,
122
15.3
815
.08
19.5
2
Hyu
an14
105,
000
105,
000
140,
000
3,90
33,
901
3,88
726
.90
26.9
236
.02
Kao
Jod
537
,500
37,5
0050
,000
3,54
63,
770
3,81
310
.58
9.95
13.1
1
Kok
kloy
1397
,500
97,5
0013
0,00
08,
523
8,66
58,
836
11.4
411
.25
14.7
1
Kok
Pet
ch11
82,5
0082
,500
110,
000
5,54
35,
532
5,49
014
.88
14.9
120
.04
Laem
Son
645
,000
45,0
0060
,000
3,43
33,
463
3,50
313
.11
12.9
917
.13
Na
Kae
m11
82,5
0082
,500
110,
000
4,50
14,
524
4,55
618
.33
18.2
424
.14
Sao
Hin
645
,000
45,0
0060
,000
2,43
62,
485
2,51
618
.47
18.1
123
.85
Suth
ep14
105,
000
105,
000
140,
000
16,9
7817
,145
17,1
996.
186.
128.
14
Tai M
uang
967
,500
67,5
0090
,000
7,36
27,
394
7,48
89.
179.
1312
.02
Tha
Sal
a7
52,5
0052
,500
70,0
002,
716
2,73
02,
731
19.3
319
.23
25.6
3
Tabl
e 5.
13N
umbe
r of
hea
lth v
olun
teer
s an
d he
alth
vol
unte
ers
budg
et in
the
sele
cted
13
TAO
sU
nit:
Bah
t
TAO
S N
umbe
r of
villa
ges
Am
ount
of
allo
cate
d bu
dget
(B
aht)
Num
ber
of p
opul
atio
n H
ealt
h vo
lunt
eers
bud
get
per
capi
ta
2004
2005
2006
2004
2005
2006
2004
2005
2006
Not
e:1.
Eac
h vi
llage
was
allo
cate
d 7,
500
baht
in 2
004
and
2005
and
10,
000
baht
in 2
006
2. R
atio
is h
ealt
h vo
lunt
eer:
pop
ulat
ion
(hou
seho
ld),
1:10
Sour
ce:
http
://ph
c.m
oph.
go.t
h/ph
c/ a
nd c
alcu
late
d by
res
earc
hers
.
Table 5.14 Number of expected health volunteers to the current number of volunteersin TAOs’ boundaries
Aou Luk 917 7 4,981 92 105
Bang Phra 1,526 10 5,122 153 65
Hyuan 1053 14 3,887 105 277
Kao Jod 951 5 3,813 95 51
Kokkloy 2436 13 8,836 244 260
Kok Petch 866 11 5,490 87 119
Laem Son 770 6 3,503 77 56
Na Kaem 1,224 11 4,556 122 56
Nong Kung 983 8 4,126 98 70
Sao Hin 590 6 2,516 59 24
Suthep 3050 14 17,199 305 234
Tai Muang 1,806 9 7,488 181 180
Tha Sala 721 7 2,731 72 67
TAOs NumberHousehold
Numberof Villages
Population
Expectednumber of
HealthVolunteers
ExistingPublicHealth
Volunteers
Note: The table shows only the number of registered volunteers; the actual number of volunteers may be higher.
Ratio: Health volunteers: population (used household unit), 1:10
Source: http://203.157.7.19/phc/t_tambon.php?ProvinceID=50&DistrictID=5001
- 24 - 25

chapter 5
DECENTRALIZATION AND THE BUDGET FOR SOCIAL SERVICES AT TAMBON ADMINISTRATIVE LEVEL Availability of Budget Resources within the TAO: Lessons Learned from the 13 Selected TAOs
chapter 5
Table 5.14 shows that the actual number of volunteers working in several TAOs issignificantly less than the standard 1:10 set by the Ministry of Public Health: Bang PhraTAO; Na Khem TAO; Kao Jod TAO; Tha Sala TAO; Nong Kung TAO; Suthep TAO; Sao HinTAO; and Leam Son TAO. Furthermore, the actual numbers of volunteers may not correlatewith TAOs’ development. For instance, Suthep TAO has few public health volunteers thanSao Hin TAO, even though it is located in an urban area whereas Sao Hin TAO is located ina remote area. Consequently, the variation in the number of volunteers is not related towhether the place of work is urban or rural, but it depends on the spirit, cooperation and,willingness of each health volunteer. Besides, no compensation is paid to health volunteersthat might lead to limited sacrifice. It is not strongly advised to provide monetarycompensation to health volunteers but there should be some other form of compensation,such as public recognition or in-kind compensations, to keep their morale high and showpublic appreciation of their dedication.
Box 2
The Role of Public Health Volunteers and Procedures ofDecentralized Public Health Care Budget
Since 1998, The Ministry of Public Health has allocated budget to DOLADLA in orderto organize public health service activities. To illustrate this, some of the budget wasprovided to public health volunteer club using a block grant method. The objective isto create working structure of public health service through the kind cooperation ofthe local public health volunteers which become the outstanding advantage becausethe local people realize the current problems and have the feel of the local area.DLA is responsible for the above budget; therefore, it determines the budgetallocation for public health and will be free to solve the urgent or current problems.
According to the promotion of decentralization policy and public health careadministration, there have been always allocated to community by using the villageitself as a standard. Each villages was provided 7,500 baht on the average. Since1999, The Ministry of Public Health allocated more budget; as a result, each villagewas provided 10,000 baht on the average and TAO is responsible for budgetadministration and operation. Nevertheless, the Ministry of Public Health stated ageneral policy of operation as follow:
1. Develop local people’s potential group; in other words, budget wasallocated to improve the community leader, and/or local organization tohave more capability and skill of public health management.
2. Local public health solution group; for instance, this is an opportunity forpublic health care official to approach the local problems. In addition, theyhave the right to determine and have the authority to estimate the fieldwork empowering the local administration and management.
3. Public health management group in the primary health care center set upto satisfy local public heath care requirement; according to the condition ofpersonnel and other resources in the area.
To withdraw budget in order to run activities as the specific three conditions mustbe approve by 1) one representative from public health volunteer club 2) one villageleader or village committee in the village 3) one of other community leader in thevillage or TAOs’ council member. Those three representatives must agree toapprove the budget withdraw and the official working at the public health centermust keep the evidence in the village. According to the procedure and regulation ofwithdrawing budget, the best result is the public health volunteer club has moresignificant role in the term of budget determination, project plan and operation.However, at the beginning, the public health care officers and the related healthorganizations played the role of assistant and partner who provided public healthcare service to people.
- 26 - 27

chapter 5
DECENTRALIZATION AND THE BUDGET FOR SOCIAL SERVICES AT TAMBON ADMINISTRATIVE LEVEL Availability of Budget Resources within the TAO: Lessons Learned from the 13 Selected TAOs
chapter 5
5.7 The Proportion of Social Service Budget
Table 5.15 indicates that the social security and welfare budget has been declining duringlast three years in every one of our 13 selected TAOs. By 2006 the average budget for socialsecurity and welfare in the selected 13 TAOs was only 3.5 percent of the total social servicesbudget; furthermore, Tha Sala TAO, Leoi had the smallest budget for social security andwelfare, 126,470 baht, in 2006.
Since parliament legislated the decentralization of authority to local area in 1997’sThai constitution, during the last three years (2004-2006), there has been aminimum budget for public health volunteer club to compare with other providedpublic services by DOLADLA; although, public health care is regarded as the mostimportant mission and has a strong affect to people living happily and comfortably.
Furthermore, there are a few problems about allocating budget to public healthvolunteer club and organizing of volunteers in each village; for instance, the ratio ofa volunteer and a household is 1:10. However, presently, all over Thailand, there areonly 825,683 volunteers while there is no specific numbers of members in eachhousehold which may caused short of public health volunteers in each area.Consequently, the above allocation raised several public health care services such asinaccessible health care services, inefficient or limited health care services,minimum remuneration for volunteer which led to reluctant to participate the clubnor TAOs’ inability to allocate budget whereas public health volunteer club isexpanding around the local area.
Table 5.15 Proportion of social security and welfare budget
Aou Luk 1,020,844 393,700 160,570
(10.12) (3.25) (1.24)
Bang Phra 1,413,951 786,939 463,777
(12.82) (6.25) (3.35)
Hyuan 1,597,270 481,638 291,474
(18.30) (4.51) (2.61)
Kao Jod 1,440,353 601,584 279,379
(16.30) (5.21) (2.39)
Kokkloy 2,214,382 1,396,646 1,070,917
(9.50) (4.40) (3.25)
Kok Petch 910,788 463,158 280,194
(8.89) (3.65) (2.20)
Laem Son 1,038,558 604,582 501,521
(13.30) (5.96) (4.65)
Na Kaem 2,272,392 556,904 308,223
(15.81) (3.93) (2.00)
Nong Kung 832,933 528,937 271,431
(10.38) (5.18) (2.32)
Suthep 12,803,611 7,574,402 6,824,951
(26.93) (14.35) (12.65)
Sao Hin 1,093,679 547,578 398,143
(14.95) (5.68) (3.97)
Tai Muang 1,912,740 1,191,784 907,541
(9.47) (4.34) (3.25)
Tha Sala 655,191 249,329 126,470
(11.25) (3.59) (1.67)
Average 2,246,669 1,182,860 914,199
(13.69) (5.41) (3.50)
TAOs 2004 2005 2006
Unit: Baht (Percentage)
Social security and Welfare
Source: Calculated from data of CGD
- 28 - 29

chapter 5
DECENTRALIZATION AND THE BUDGET FOR SOCIAL SERVICES AT TAMBON ADMINISTRATIVE LEVEL Availability of Budget Resources within the TAO: Lessons Learned from the 13 Selected TAOs
chapter 5
Aou Luk 243,997 307,943 527,747
(2.42) (4.35) (4.06)
Bang Phra 2,451,598 375,129 654,423
(22.23) (5.20) (4.73)
Hyuan 313,177 343,040 253,332
(3.59) (2.37) (2.27)
Kao Jod 130,853 180,434 189,013
(1.48) (1.64) (1.62)
Kokkloy 710,706 933,032 957,215
(3.05) (3.02) (2.91)
Kok Petch 194,532 226,099 243,444
(1.90) (1.92) (1.91)
Laem Son 331,931 319,524 307,054
(4.25) (3.03) (2.85)
Na Kaem 3,419,364 981,225 1,001,377
(23.78) (7.07) (6.50)
Nong Kung 268,615 225,340 247,768
(3.35) (2.43) (2.12)
Sao Hin 163,997 299,502 343,845
(2.24) (3.57) (3.43)
Suthep 2,252,884 835,187 895,155
(4.74) (1.70) (1.66)
Tai Muang 613,894 796,173 811,184
(3.04) (2.95) (2.90)
Tha Sala 140,094 208,961 202,472
(2.41) (2.91) (2.67)
Average 864,280 463,968 510,310
(6.04) (3.24) (3.05)
TAOs 2004 2005 2006
Unit: Baht (Percentage)
Housing and Community
Source: Calculated from data of CGD
Table 5.16 Proportion of housing and community service compared with all ofsocial services
Table 5.16 provides information on the budget allocated for housing and communityservices budget in the local area. It is ranked the least important of the social services;additionally, the budget allocated by the ministries has been declining. For instance, duringthe past three years, some of the selected TAOs allocated budget for housing andcommunity services was less than two percent. The smallest budget was in Kao Jod TAO,189,013 baht in 2006 or only 1.62 percent of the entire social servicesû budget. Thisfunction was previously performed by central agencies but after devolving the function toLGUs, including the TAOs, the budget burden, as shown on the annual budget allocation ofthe TAOs’, has increased. On the contrary, the budget allocation of the central lineagencies has gradually declined.
- 30 - 31

chapter 5
DECENTRALIZATION AND THE BUDGET FOR SOCIAL SERVICES AT TAMBON ADMINISTRATIVE LEVEL Availability of Budget Resources within the TAO: Lessons Learned from the 13 Selected TAOs
chapter 5
Aou Luk 135,808 175,297 159,176
(1.35) (1.45) (1.22)
Bang Phra 105,214 171,607 200,596
(0.95) (1.36) (1.45)
Hyuan 102,707 147,471 234,931
(1.18) (1.38) (2.11)
Kao Jod 176,266 237,690 254,339
(1.99) (2.06) (2.17)
Kokkloy 311,771 366,744 417,442
(1.34) (1.16) (1.27)
Kok Petch 108,415 171,551 187,548
(1.06) (1.35) (1.47)
Laem Son 142,896 117,259 162,352
(1.83) (1.16) (1.51)
Na Kaem 237,506 240,929 280,380
(1.65) (1.70) (1.82)
Nong Kung 113,063 178,633 201,973
(1.41) (1.75) (1.73)
Sao Hin 67,411 83,300 101,486
(0.92) (0.86) (1.01)
Suthep 1,150,144 1,341,227 1,509,781
(2.42) (2.54) (2.80)
Tai Muang 269,302 312,949 353,758
(1.33) (1.14) (1.27)
Tha Sala 80,581 113,596 176,140
(1.38) (1.63) (2.32)
Average 230,853 281,404 326,146
(1.45) (1.50) (1.70)
TAOs 2004 2005 2006
Unit: Baht (Percentage)
Religion, Culture, and Recreation Services
Source: Calculated from data of CGD
Table 5.17 Budget allocation for religion, culture and recreation services Table 5.17 reports on the portion of the budget allocated to religious, cultural andrecreational services budget in the selected 13 TAOs. The allocation has been less than2 percent of the allocation for all social welfare. During the past three years, religious,cultural, and recreational services has received the smallest allocation, both in terms ofbaht or the percentage of all social services.
Moreover, the data from Table 5.17 reveals that the spending on religious, cultural andrecreational activities has no certain pattern. There was no planning to administer thespending properly, nor effective rules to allocate the budget.
5.8 The Transfer of Elderly and People with Disabilities Care to TAOs
In addition to transferring of basic education, and public health care primary responsibilityfor care of the elderly and people with disabilities has been transferred to tambonadministrative organizations (TAOs) as well. These functions originally belonged to the PublicWelfare Department of the Ministry of the Interior; later they were moved to the Ministry ofSocial Development and Human Security. All TAOs are responsible for providing continuouscare to the elderly and people with disabilities. The main care task is to provide a monthlywelfare pension to the elderly and people with disabilities. It is the TAOs’ responsibility toprovide the list of people who are eligible to receive pensions. The central governmentallocates a specific purpose grant to the TAOs for elderly pensions (500 baht per personmonthly) according to certain criteria. The basic criterion is to provide assistance toindividuals who are over 60 and too poor to support themselves. The evidence from fieldsurveys and documentary research shows that the number of elderly who receive pensionhas been increasing in recent years. Since younger people of working age migrate fromtheir village to work in the cities or the other provinces, the elderly are left at home with noone to take care of them.
In addition, the field survey results reveal that many sampled TAOs distort the mainobjective of providing pensions to the elderly. Local politicians often use the elderly pensionas a political tool to gain votes in the election by distributing pensions to every person over60 regardless of their eligibility. Thus, the actual provision of elderly pensions at the LGUlevel can be a problem for the government because it comes from the government’s annualexpenditure budget.
Meanwhile, many of the TAOs in our sample have an innovative scheme to care for theelderly by combining it with the community health care services under the supervision ofthe village health care center. This way, the TAOs not only distribute the pension money butalso give regular health check-ups to the elderly. The village health volunteers supported bythe ministry of public health thus monitor the health of the elderly in addition to theirregular health care provision.
TAOs are also responsible for care of the people with disabilities. The TAOs follow certaincriteria, from registering the people with disabilities at the hospital to distributing the peoplewith disabilities pension money. However, the TAOs could improve their performance inimproving the quality of life of the people with disabilities by providing occupationaltraining programs and other services. Currently, many government line agencies with
- 32 - 33

chapter 5
DECENTRALIZATION AND THE BUDGET FOR SOCIAL SERVICES AT TAMBON ADMINISTRATIVE LEVEL Availability of Budget Resources within the TAO: Lessons Learned from the 13 Selected TAOs
chapter 5
better capabilities provide similar services, such as the Provincial Social Development andHuman Security Agency. Therefore, the TAOs are reluctant to provide the same services forthe people with disabilities, avoiding duplication of service provision.
5.9 The Other Sources of Budget Allocation to TAOs
Two additional sources of budget directly allocated by the government to TAOs are 1) theSML budget, which is mostly spent on occupational development and 2) the CEO Governorprogram budget, which is allocated according to the discretion of provincial governor.
During 2004-2006, the SML and CEO budgets received by TAOs increased. The SML andCEO budgets have also increased as a proportion of the entire budget allocated to the sampledTAOs during the same period.
Thus far, we have examined the budget for social services, as it flows through the variouschannels, or line agencies, to the TAOs. To complement this desk research, the next chapterpresents empirical evidences derived from field survey to gain insights on people’sperception and attitude towards the role of TAO and their satisfaction concerning socialservice provision in the sample areas.
Table 5.18 Budget allocation from SML & CEO governor
Aou Luk 68,421 1,937,456 2,410,211
(0.50) (8.56) (10.09)
Bang Phra 118,678 2,314,393 3,128,311
(0.71) (8.88) (10.61)
Hyuan 149,048 3,604,366 4,292,139
(1.00) (20.40) (20.54)
Kao Jod 81,176 1,143,144 1,530,397
(0.52) (7.38) (7.71)
Kokkloy 521,346 3,931,834 4,679,578
(1.70) (7.07) (9.31)
Kok Petch 69,560 2,054,519 2,465,764
(0.48) (10.41) (10.44)
Laem Son 234,526 1,434,930 1,896,516
(1.83) (5.48) (9.38)
Na Kaem 110,013 2,399,355 3,132,832
(0.62) (9.66) (11.45)
Nong Kung 94,713 2,106,543 2,573,661
(1.05) (12.36) (11.71)
Sao Hin 176,723 1,476,667 1,854,856
(1.49) (8.93) (10.11)
Suthep 161,021 6,213,490 7,849,821
(0.22) (6.40) (7.74)
Tai Muang 450,328 2,783,160 3,414,880
(1.43) (4.87) (7.13)
Tha Sala 87,994 1,588,865 1,825,770
(1.24) (16.13) (14.54)
TAOs2004 2005 2006
Unit: Baht (Percentage)
Source: CGD and www.thaitambon.com
- 34 - 35

CHAPTER6RESULTS FROM FIELD SURVEY
ON THE TAO’S PERFORMANCEAND BUDGET ALLOCATION
© U
NIC
EF
Tha
iland
/200
9/C
Kan
okna
n

chapter 6
DECENTRALIZATION AND THE BUDGET FOR SOCIAL SERVICES AT TAMBON ADMINISTRATIVE LEVEL Results from Field Survey on the TAO’s Performance and Budget Allocation
chapter 6
This research conducts case studies on 13 TAOs (from four regions, viz., North, Northeast,Central, and Southern regions) to gain an insight into the budget allocations and how theTAOs performed their activities. Another area which this research investigates is theutilization of services, i.e. whether the activities initiated by TAOs met the needs of people,and to what extent people actually participated. The study is concerned primarily withchildren, women, the elderly, and disadvantaged groups.
This chapter reports the empirical results from a field survey on the following aspects ofdecentralization: public understanding of the duties of the TAO, public perception of therole of the TAO in providing social services, public perception of local problems, and publicparticipation in the TAO. We use the results of the survey to discuss the best practice modelsin local administration.
The most significant responsibility of the TAO is to provide social services which improvethe quality of life of the population in both urban and rural areas, especially the poor.Decentralization involves both the devolution of administrative authority and the transferof fiscal resources to local administrative organizations. The TAO is the lowest level of localadministration and often best understands local needs. Decentralization is not just the transferof fiscal resources, it is also the creation of democracy at the community level. Ultimatelythis means the TAO will be accountable.
Therefore, the questionnaire probes the respondents’ understanding of the responsibilitiesof the TAO as well as the quality of the social services provided by the TAO afterdecentralization. The questionnaire also asked the respondents to evaluate the TAO’sinvolvement in social services provision, and to identify their current local problems. Thisanalysis could reveal how TAO works on social service provision in its own area.
6.1 PUBLIC UNDERSTANDING OF THE DUTIES OF THE TAO
According to Table 6.1, people in all of the sampled TAOs understand that the mainresponsibilities of TAO are road maintenance and social service provision. In most of thesampled TAOs, between 83.3 percent and 100.0 percent of the people understand thatroad maintenance is the responsibility of the TAO (except in TAO E, which has a limitedbudget so it is not capable of providing either road maintenance or basic construction,only 42 percent of people understand that road maintenance is the duty of TAO), whilepeople in most of the sampled TAOs are not aware that education and electric pump stationprovision are TAO duties (except for education services in TAO G (83 percent) and TAO M(75 percent)). On the other hand, the in-depth research shows that while people are awarethat education is the responsibility of the TAO, they are not aware that the electric pumpwater supply is as well. This is because there are other appropriate water supply systemsavailable in the area; for example, TAO C utilizes mountain water supply system which wasinstalled by another organization and needs no maintenance.
According to the in-depth research, there are four main variables affecting the publicattitude towards the social services provided by the TAO. The first factor is the role of chiefexecutive; for example, the chief executive of TAO G attempts to formulate development
policies using people as the center of development which results in a high level of people’sunderstanding of the TAO’s responsibilities. Second is the role of the TAO officials; forexample, the officers in TAO D fail to promote the provision of social services. This results ina low level of understanding and has a negative effect on participation as well. Third aresocial institutions in the community such as the temple in TAO I where people to jointogether in activities.
- 2 - 3
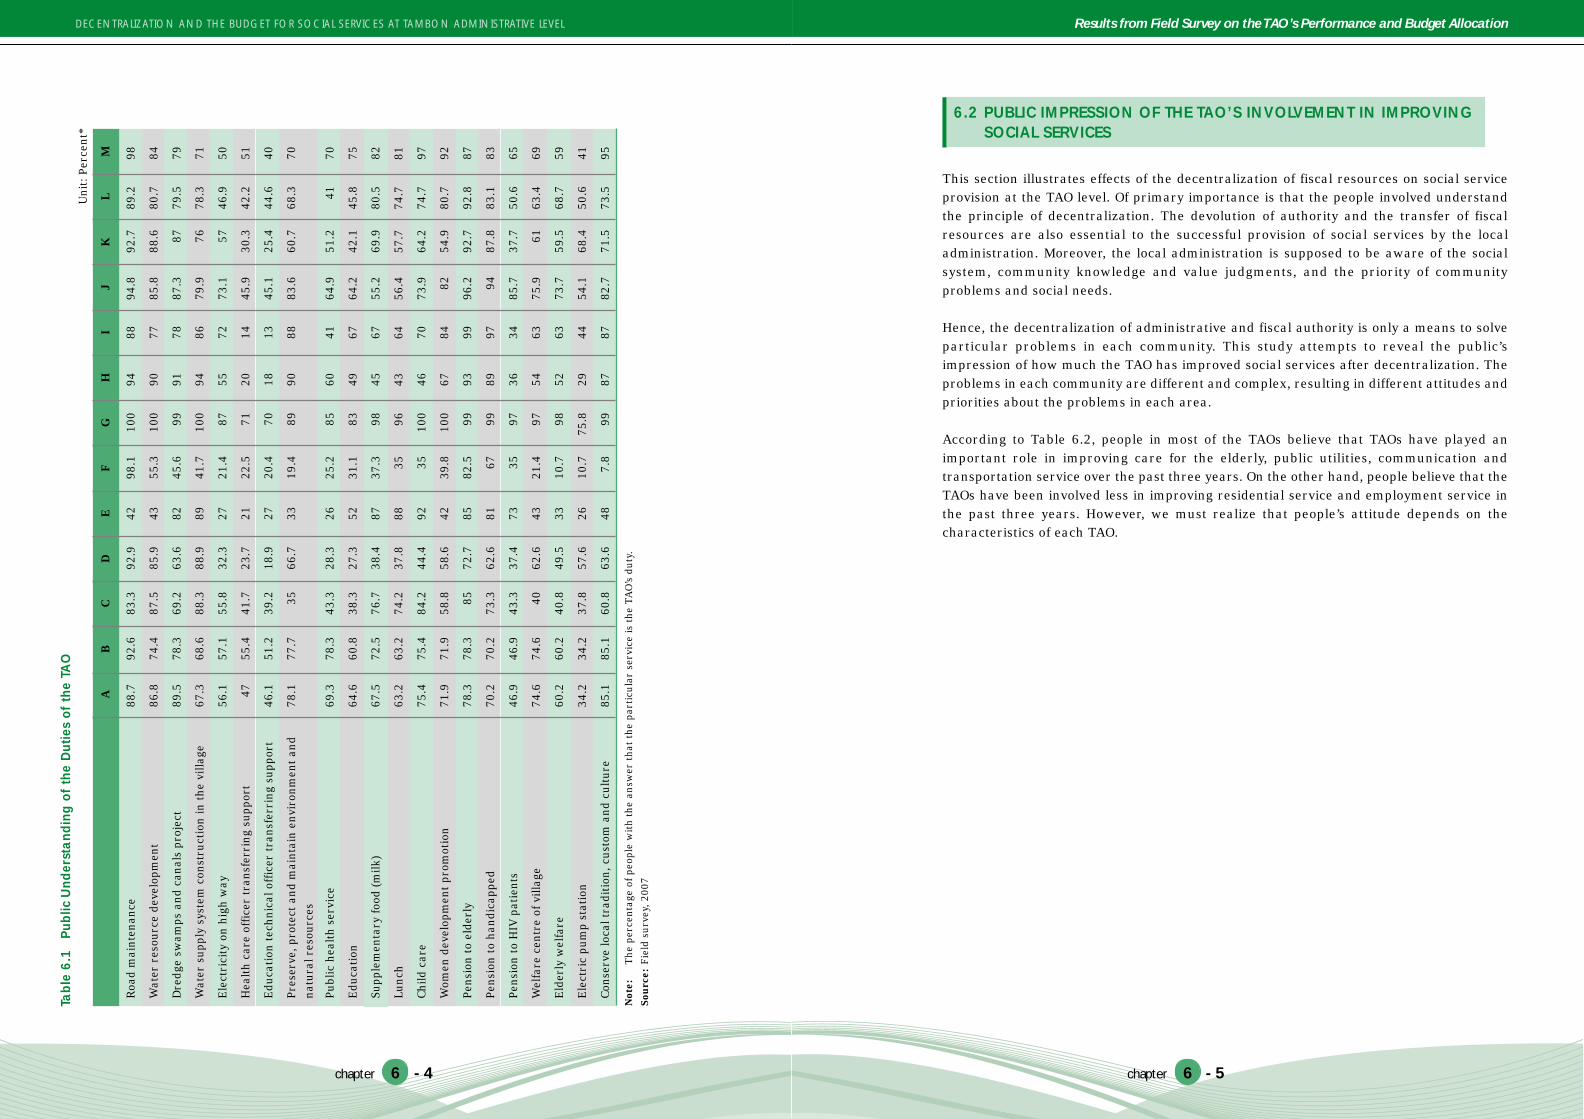
chapter 6
DECENTRALIZATION AND THE BUDGET FOR SOCIAL SERVICES AT TAMBON ADMINISTRATIVE LEVEL Results from Field Survey on the TAO’s Performance and Budget Allocation
chapter 6
6.2 PUBLIC IMPRESSION OF THE TAO’S INVOLVEMENT IN IMPROVINGSOCIAL SERVICES
This section illustrates effects of the decentralization of fiscal resources on social serviceprovision at the TAO level. Of primary importance is that the people involved understandthe principle of decentralization. The devolution of authority and the transfer of fiscalresources are also essential to the successful provision of social services by the localadministration. Moreover, the local administration is supposed to be aware of the socialsystem, community knowledge and value judgments, and the priority of communityproblems and social needs.
Hence, the decentralization of administrative and fiscal authority is only a means to solveparticular problems in each community. This study attempts to reveal the public’simpression of how much the TAO has improved social services after decentralization. Theproblems in each community are different and complex, resulting in different attitudes andpriorities about the problems in each area.
According to Table 6.2, people in most of the TAOs believe that TAOs have played animportant role in improving care for the elderly, public utilities, communication andtransportation service over the past three years. On the other hand, people believe that theTAOs have been involved less in improving residential service and employment service inthe past three years. However, we must realize that people’s attitude depends on thecharacteristics of each TAO.
- 5- 4
Tabl
e 6.
1Pu
blic
Und
erst
andi
ng o
f th
e D
utie
s of
the
TAO
Uni
t: P
erce
nt*
AB
CD
EF
GH
IJ
KL
M
Not
e:T
he p
erce
ntag
e of
peo
ple
wit
h th
e an
swer
tha
t th
e pa
rtic
ular
ser
vice
is t
he T
AO
’s d
uty.
Sour
ce:
Fiel
d su
rvey
, 200
7
Roa
d m
aint
enan
ce88
.792
.683
.392
.942
98.1
100
9488
94.8
92.7
89.2
98
Wat
er r
esou
rce
deve
lopm
ent
86.8
74.4
87.5
85.9
4355
.310
090
7785
.888
.680
.784
Dre
dge
swam
ps a
nd c
anal
s pr
ojec
t89
.578
.369
.263
.682
45.6
9991
7887
.387
79.5
79
Wat
er s
uppl
y sy
stem
con
stru
ctio
n in
the
vill
age
67.3
68.6
88.3
88.9
8941
.710
094
8679
.976
78.3
71
Ele
ctri
city
on
high
way
56.1
57.1
55.8
32.3
2721
.487
5572
73.1
5746
.950
Hea
lth
care
off
icer
tra
nsfe
rrin
g su
ppor
t47
55.4
41.7
23.7
2122
.571
2014
45.9
30.3
42.2
51
Edu
cati
on t
echn
ical
off
icer
tra
nsfe
rrin
g su
ppor
t46
.151
.239
.218
.927
20.4
7018
1345
.125
.444
.640
Pres
erve
, pro
tect
and
mai
ntai
n en
viro
nmen
t an
d78
.177
.735
66.7
3319
.489
9088
83.6
60.7
68.3
70na
tura
l res
ourc
es
Publ
ic h
ealt
h se
rvic
e69
.378
.343
.328
.326
25.2
8560
4164
.951
.241
70
Edu
cati
on64
.660
.838
.327
.352
31.1
8349
6764
.242
.145
.875
Supp
lem
enta
ry fo
od (m
ilk)
67.5
72.5
76.7
38.4
8737
.398
4567
55.2
69.9
80.5
82
Lunc
h63
.263
.274
.237
.888
3596
4364
56.4
57.7
74.7
81
Child
car
e75
.475
.484
.244
.492
3510
046
7073
.964
.274
.797
Wom
en d
evel
opm
ent
prom
otio
n71
.971
.958
.858
.642
39.8
100
6784
8254
.980
.792
Pens
ion
to e
lder
ly78
.378
.385
72.7
8582
.599
9399
96.2
92.7
92.8
87
Pens
ion
to h
andi
capp
ed70
.270
.273
.362
.681
6799
8997
9487
.883
.183
Pens
ion
to H
IV p
atie
nts
46.9
46.9
43.3
37.4
7335
9736
3485
.737
.750
.665
Wel
fare
cen
tre
of v
illag
e74
.674
.640
62.6
4321
.497
5463
75.9
6163
.469
Eld
erly
wel
fare
60.2
60.2
40.8
49.5
3310
.798
5263
73.7
59.5
68.7
59
Ele
ctri
c pu
mp
stat
ion
34.2
34.2
37.8
57.6
2610
.775
.829
4454
.168
.450
.641
Cons
erve
loca
l tra
diti
on, c
usto
m a
nd c
ultu
re85
.185
.160
.863
.648
7.8
9987
8782
.771
.573
.595

chapter 6
DECENTRALIZATION AND THE BUDGET FOR SOCIAL SERVICES AT TAMBON ADMINISTRATIVE LEVEL Results from Field Survey on the TAO’s Performance and Budget Allocation
chapter 6
6.3 PEOPLE’S ASSESSMENT OF CURRENT LOCAL PROBLEMS
As reported in Table 6.3, people in most of the sampled TAOs believe that they have thefewest problems with the care of patients with chronic illnesses and the care of the peoplewith disabilities. They also believe that they face few problems with child care and theyhave security in life and property. This indicates that TAOs in most of the sampled area canprovide social services well enough in the aspects of chronic illness care, people withdisabilities care, children care, and security in life and property.
On the other hand, employment and occupation are ranked as the biggest problems in mostof the sampled TAOs. Drugs and gambling are ranked next highest. This indicates that theTAOs in the sample are still not able to provide employment and occupation service andcannot eliminate or reduce the problem of drugs and gambling in the community.
In any case, different TAOs have different priorities concerning local problems, dependingupon the characteristics and nature of each TAO. For instance, the lack of housing is thehighest ranked problem for TAO F, which is very far away from the city, whereas this is nothighly ranked in the other sampled TAOs, especially TAO M which takes good care of itspeople’s residential needs.
Stan
dard
of h
ealt
h ca
re a
nd s
ervi
ce57
.576
.270
.761
.353
.849
.390
.159
.169
.177
.071
.857
.654
.8
Sani
tati
on fo
r pr
esch
ool a
ge58
.676
.469
.560
.353
.647
.181
.056
.969
.179
.172
.657
.055
.0
Sani
tati
on fo
r sc
hool
age
56.4
77.2
70.4
61.0
55.6
47.7
79.2
57.5
69.1
77.0
73.0
57.6
55.4
Eld
erly
car
e60
.276
.272
.167
.067
.253
.777
.474
.274
.576
.673
.863
.669
.0
Edu
cati
on54
.275
.673
.062
.953
.349
.382
.456
.761
.276
.671
.059
.663
.2
Loca
l env
iron
men
tal m
anag
emen
t51
.070
.470
.259
.753
.660
.285
.570
.965
.586
.069
.264
.863
.6
Publ
ic u
tilit
y, C
omm
unic
atio
n an
d Tr
ansp
orta
tion
67.6
74.2
70.9
58.4
69.4
64.2
78.2
70.2
70.6
86.9
68.8
69.8
66.6
Secu
rity
in li
fe a
nd p
rope
rty
45.6
67.4
65.1
55.3
54.8
49.1
79.8
54.1
55.0
77.8
6943
.651
.0
Com
mun
ity
empo
wer
men
t54
.272
.472
.561
.855
.851
.978
.460
.061
.081
.370
.246
.851
.2
Em
ploy
men
t47
.866
.065
.859
.347
.446
.579
.054
.854
.073
.864
.843
.048
.2
Res
iden
ce44
.663
.064
.656
.651
.147
.577
.653
.850
.173
.164
.243
.850
.6
Tabl
e 6.
2Pu
blic
Impr
essi
on o
f th
e Sa
mpl
ed T
AO
s’ In
volv
emen
t in
Impr
ovin
g So
cial
Ser
vice
sU
nit:
Per
cent
*
Not
e:*T
he fi
gure
s in
the
tab
le a
re t
he p
erce
ntag
e of
sco
res
that
eac
h TA
O c
an g
et fr
om e
ach
soci
al s
ervi
ce p
rovi
sion
.
The
full
scor
e fo
r ea
ch s
ocia
l ser
vice
pro
visi
on p
er in
terv
iew
ee is
5 p
oint
s in
eac
h TA
O.
Sour
ce:
Fiel
d su
rvey
, 200
7
AB
CD
EF
GH
IJ
KL
M
- 6 - 7

chapter 6
DECENTRALIZATION AND THE BUDGET FOR SOCIAL SERVICES AT TAMBON ADMINISTRATIVE LEVEL Results from Field Survey on the TAO’s Performance and Budget Allocation
chapter 6
Not
e: *
The
figu
res
in t
he t
able
are
the
per
cent
age
of s
core
s of
the
deg
ree
of c
urre
nt lo
cal p
robl
ems
in e
ach
TAO
.
The
full
scor
e fo
r ea
ch c
urre
nt lo
cal p
robl
em p
er in
terv
iew
ee is
5 p
oint
s in
eac
h TA
O. I
f the
per
cent
age
of s
core
s is
less
, tha
t m
eans
peo
ple
have
less
pro
blem
.
Sour
ce:
Fiel
d su
rvey
, 200
7
Lack
of r
esid
ence
8.2
16.3
11.2
6.0
6.7
38.4
8.4
1.5
8.4
2.6
6.5
2.2
23.2
Em
ploy
men
t an
d O
ccup
atio
n11
.717
.419
.110
.020
.936
.122
.33.
110
.516
.921
.14.
626
.9
Child
ren
care
7.5
9.8
2.9
4.3
16.1
33.7
5.5
0.6
7.2
4.6
6.8
2.3
19.6
Yout
h12
.117
.86.
613
.313
.432
.315
.58.
616
.29.
614
.94.
521
.4
Eld
erly
car
e10
.310
.03.
46.
17.
631
.54.
27.
68.
46.
47.
84.
921
.4
Han
dica
pped
5.7
7.9
2.3
3.6
6.1
30.5
3.4
05.
03.
87.
21.
621
.7
Chro
nic
dise
ase
pati
ent
4.1
6.9
2.4
1.3
5.1
28.4
4.5
05.
32.
27.
11.
425
.8
Publ
ic h
ealt
h ca
re6.
810
.211
.35.
26.
729
.39.
00.
59.
23.
97.
72.
718
.6
Edu
cati
on9.
08.
814
.37.
535
.228
.18.
40.
86.
94.
07.
72.
918
.8
Env
iron
men
t an
d po
lluti
on10
.615
.65.
212
.28.
828
.99.
45.
316
.16.
17.
43.
618
.2
Lack
of p
ure
wat
er a
nd e
lect
ric
9.7
7.0
18.8
9.7
10.5
28.9
26.0
10.9
13.7
7.1
18.7
11.2
20.7
Com
mun
icat
ion
and
Tran
spor
tati
on7.
012
.114
.34.
18.
528
.410
.13.
916
.73.
213
.67.
218
.2
Dru
gs a
nd G
ambl
ing
15.4
16.1
4.6
13.4
10.5
24.5
12.8
11.9
17.6
8.3
8.8
8.0
18.6
Secu
rity
in li
fe a
nd p
rope
rty
12.2
12.2
1.7
7.5
8.3
27.4
6.5
6.3
11.9
1.7
9.8
3.3
17.6
Tabl
e 6.
3Pe
ople
’s A
sses
smen
t of
Curr
ent L
ocal
Pro
blem
sU
nit:
Per
cent
AB
CD
EF
GH
IJ
KL
MTA
Os
6.4 PUBLIC PARTICIPATION IN THE RECENT ELECTION
Public participation is an important principle and essential to the democratic system.In theory, the government will acknowledge everyone’s opinion and give everyone anopportunity to participate in decision-making.
Individuals, organizations, and social groups are a part of the power of local administrativeorganizations because people can gather together to brainstorm, plan, take action, assessand reap the benefits. Local individuals, organizations and social groups must realize that“the local administration is theirs” and it is their job to make a better society forthemselves. As long as they are devoted to society, the local administrative organizationmust give them an opportunity to create a greater society and let them play their own rolesin society.
Among the 13 TAOs in the field survey, 92.9 percent of the sample participated in the recentelection (Table 6.4). TAO F had the highest participation, and TAO H and M had the secondhighest. On the other hand, TAO B had the lowest participation, 78.5 percent.
A surprising result is that people paid less attention to the TAO election in developed areas,such as TAO A and TAO B, than in the other sampled TAOs. According to the statistical data,TAO B had the lowest rate of participation, 78.5 percent, followed by TAO A which had thesecond lowest, 86.0 percent. In contrast, people living in rural areas such as TAO F paymore attention to the TAO election (98.0 percent). The most common excuse given by peoplewho did not vote was their belief that the election would not have a significant effect ontheir lives. Other excuses given were having a name missing, having recently moved to thetambon, age problems, and so on.
- 8 - 9

chapter 6
DECENTRALIZATION AND THE BUDGET FOR SOCIAL SERVICES AT TAMBON ADMINISTRATIVE LEVEL Results from Field Survey on the TAO’s Performance and Budget Allocation
chapter 6
Moreover, public participation includes not only participation in the election, but alsoparticipation in the decision-making of the TAO. The in–depth interviews revealed thatTAO G urges people to participate in its decision-making by sending out its mobile unitonce a month. The chief executive and the local leaders meet to set goals for the term. Afterthey have identified the people’s needs, they discuss how to address them with officials fromthe government line agencies, such as policemen, technical agriculture officials, health careofficials, and official from other important organizations. The mobile unit provides somesocial services such as health care and even hair cuts. However, the main objective is tooffer people a chance to discuss their problems and propose solutions to them. This mobileunit takes turns going to different villages each month, thus benefiting everyone in the areaequally. Unfortunately, after elections the chief executive may be replaced so the processmight not be continued. Yet if people are aware of their rights and duties, they maycontinue to participate in the TAO’s decision-making by themselves, which is better forlong-term development.
Various factors such as age, education level, occupation and income level have beenexamined for their effect on participation in the recent election. The results show that agehas significance at 0.05 Chi-squared (Table 6.4). Compared to the other socio-economicfactors, age has the strongest influence on electoral participation, with significance in9 out of 13 TAOs. The second strongest factor is educational level, which was significant in6 out of 13 TAOs.
The analysis also showed that age, education level, occupation, and income level had nostatistically significant influence in TAO A on the decision to participate in the recentelection.
Age
ny
yy
yna
yn
yy
yn
y9
Edu
cati
onn
yn
ny
yy
ny
nn
yy
6
Occ
upat
ion
ny
ny
ny
yy
yn
yn
y7
Inco
me
nn
nn
nna
nn
ny
nn
n1
Per
cent
age
of p
arti
cipa
ted
peop
le86
78.5
9587
.994
9895
.297
95.
196
.397
9296
in T
AO
ele
ctio
n
Tabl
e 6.
4Cr
oss
Tabu
latio
n A
mon
g So
cio-
econ
omic
Fac
tors
and
Peo
ple
Part
icip
atio
n in
TA
O E
lect
ion
Rem
arks
:y
mea
ns fa
ctor
from
var
iabl
e ha
s si
gnifi
canc
e le
vel t
owar
ds p
eopl
e pa
rtic
ipat
ion.
nm
eans
fact
or fr
om v
aria
ble
has
no s
igni
fican
ce le
vel t
owar
ds p
eopl
e pa
rtic
ipat
ion.
nam
eans
tec
hnic
al e
rror
s in
dat
a pr
oces
sing
occ
urs;
so
it is
inca
pabl
e to
dra
w a
con
clus
ion.
Sour
ce:
Fiel
d su
rvey
, 200
7
Num
bers
of
area
whi
chfa
ctor
var
iabl
es h
ave
effe
cts
on e
lect
ion
part
icip
atio
n
AB
CD
EF
GH
IJ
KL
M
- 10 - 11

chapter 6
DECENTRALIZATION AND THE BUDGET FOR SOCIAL SERVICES AT TAMBON ADMINISTRATIVE LEVEL Results from Field Survey on the TAO’s Performance and Budget Allocation
chapter 6
6.5 PUBLIC PARTICIPATION IN PROPOSING THE ANNUAL PLAN ORPROJECTS TO TAOS
As shown in Table 6.5, TAO I had the highest rate of participation in proposing annual plansor projects to the TAO (72.7 percent). TAO E had the second highest rate (66 percent). At theother extreme, TAO B had the lowest percentage of people participating in proposing theannual plan or projects to TAO (15.7 percent).
Among the 13 sampled TAOs, socio-economic factors (age, education level, occupation andincome level) have little effect on participation in proposing annual plans or projects toTAO. The strongest socio-economic factor is age, which has a significant influence onparticipation in proposing the annual plan or projects in 5 of the 13 TAOs (at 0.05significance level Chi-squared).
Apparently, there is no relation at all between the four socio-economic factors and publicparticipation in proposing annual plans or projects to TAO in 6 TAOs. In addition, thepercentage of people who participate in proposing annual plans or projects to TAO is verylow. In 9 of the TAOs the rate of participation is less than 50 percent of the sample.
In conclusion, age, education level, occupation and income level factors do not have asignificant influence on people’s decision to participate in proposing annual plans or projectsin all 13 TAOs. More importantly, if people choose not to participate in proposing annualplans or projects to the TAO or express what they really need, this will lead to the ineffectiveprovision of social services. In general, local people can propose annual plans through thecommunity or village meeting which is held regularly.
As the in-depth interviews showed, not only does TAO E have abundant agriculturalresources, tourist attractions and a developed city, but it also has a high level ofparticipation in proposing the annual plan or TAO projects.
Tabl
e 6.
5Cr
oss
Tabu
latio
n A
mon
g So
cio-
econ
omic
Fac
tors
and
Pub
lic P
artic
ipat
ion
in P
ropo
sing
the
Ann
ual P
lan
or P
roje
cts
to T
AO
Age
yy
nn
yn
ny
nn
ny
n5
Edu
cati
onn
nn
nn
nn
nn
nn
yn
1
Occ
upat
ion
nn
nn
ny
ny
nn
nn
n2
Inco
me
nn
nn
nna
nn
ny
nn
n1
Per
cent
age
of p
arti
cipa
ted
peop
le34
.815
.736
.724
.266
27.2
31.3
6225
.629
.952
72.7
16.8
prop
osin
g an
nual
pla
nor
pro
ject
s to
TA
Os
Num
bers
of
area
whi
chfa
ctor
var
iabl
es h
ave
effe
cts
on p
eopl
epr
opos
ing
annu
al p
lan
AB
CD
EF
GH
IJ
KL
M
Rem
arks
:y
mea
ns fa
ctor
from
var
iabl
e ha
s si
gnifi
canc
e le
vel t
owar
ds p
eopl
e pa
rtic
ipat
ion.
nm
eans
fact
or fr
om v
aria
ble
has
no s
igni
fican
ce le
vel t
owar
ds p
eopl
e pa
rtic
ipat
ion.
nam
eans
tec
hnic
al e
rror
s in
dat
a pr
oces
sing
occ
urs;
so
it is
inca
pabl
e to
dra
w a
con
clus
ion.
Sour
ce:
Fiel
d su
rvey
, 200
7
- 12 - 13
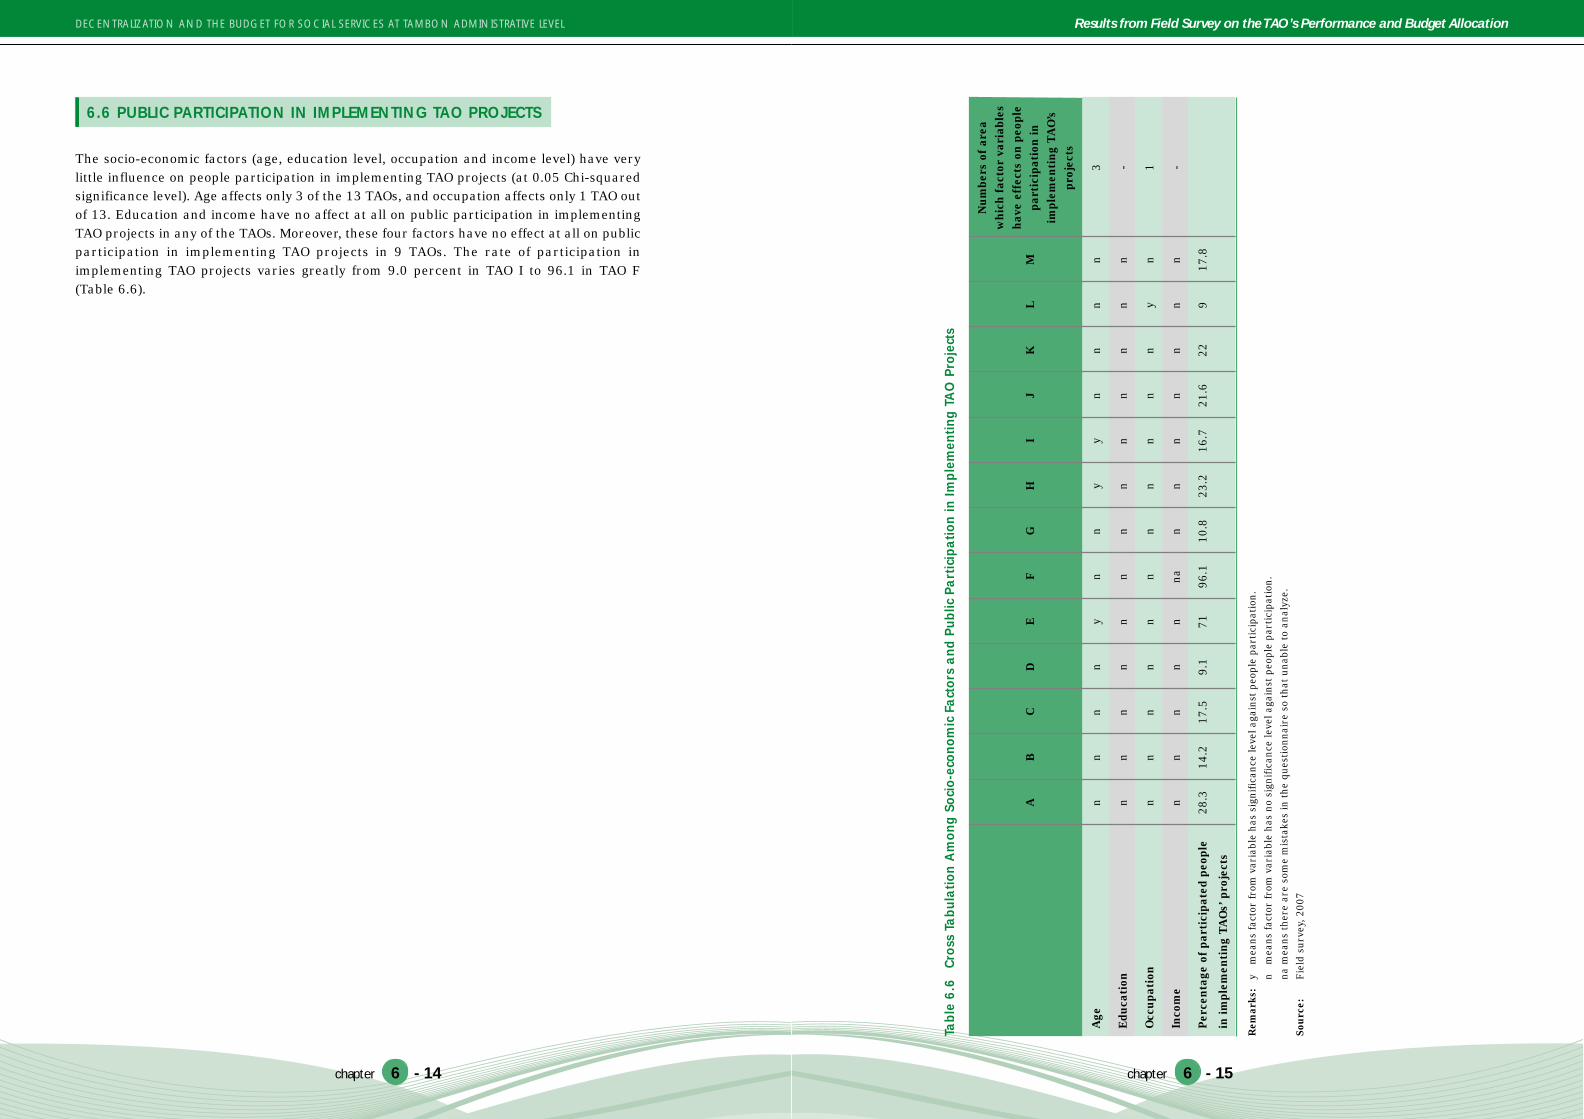
chapter 6
DECENTRALIZATION AND THE BUDGET FOR SOCIAL SERVICES AT TAMBON ADMINISTRATIVE LEVEL Results from Field Survey on the TAO’s Performance and Budget Allocation
chapter 6
6.6 PUBLIC PARTICIPATION IN IMPLEMENTING TAO PROJECTS
The socio-economic factors (age, education level, occupation and income level) have verylittle influence on people participation in implementing TAO projects (at 0.05 Chi-squaredsignificance level). Age affects only 3 of the 13 TAOs, and occupation affects only 1 TAO outof 13. Education and income have no affect at all on public participation in implementingTAO projects in any of the TAOs. Moreover, these four factors have no effect at all on publicparticipation in implementing TAO projects in 9 TAOs. The rate of participation inimplementing TAO projects varies greatly from 9.0 percent in TAO I to 96.1 in TAO F(Table 6.6).
Tabl
e 6.
6Cr
oss
Tabu
latio
n A
mon
g So
cio-
econ
omic
Fac
tors
and
Pub
lic P
artic
ipat
ion
in Im
plem
entin
g TA
O P
roje
cts
Age
nn
nn
yn
ny
yn
nn
n3
Edu
cati
onn
nn
nn
nn
nn
nn
nn
-
Occ
upat
ion
nn
nn
nn
nn
nn
ny
n1
Inco
me
nn
nn
nna
nn
nn
nn
n-
Per
cent
age
of p
arti
cipa
ted
peop
le28
.314
.217
.59.
171
96.1
10.8
23.2
16.7
21.6
229
17.8
in im
plem
enti
ng T
AO
s’ p
roje
cts
Rem
arks
:y
mea
ns fa
ctor
from
var
iabl
e ha
s si
gnifi
canc
e le
vel a
gain
st p
eopl
e pa
rtic
ipat
ion.
nm
eans
fact
or fr
om v
aria
ble
has
no s
igni
fican
ce le
vel a
gain
st p
eopl
e pa
rtic
ipat
ion.
nam
eans
the
re a
re s
ome
mis
take
s in
the
que
stio
nnai
re s
o th
at u
nabl
e to
ana
lyze
.
Sour
ce:
Fiel
d su
rvey
, 200
7
Num
bers
of
area
whi
ch f
acto
r va
riab
les
have
eff
ects
on
peop
lepa
rtic
ipat
ion
inim
plem
enti
ng T
AO
’spr
ojec
ts
AB
CD
EF
GH
IJ
KL
M
- 14 - 15

chapter 6
DECENTRALIZATION AND THE BUDGET FOR SOCIAL SERVICES AT TAMBON ADMINISTRATIVE LEVEL Results from Field Survey on the TAO’s Performance and Budget Allocation
chapter 6
6.7 PUBLIC PARTICIPATION IN TAO-ORGANIZED ACTIVITIES
The socio-economic factors (age, education level, occupation and income level), have littleinfluence on public participation in TAO-organized activities (at 0.05 Chi-squaredsignificance level). Age affects only 4 out of 13 TAOs, where it has the highest influence onparticipation. Moreover, these four factors have no effect at all on public participation inTAO-organized activities in 6 of the TAOs. The rate of participation in TAO-organizedactivities is more than 50 percent in all of the sampled TAOs (Table 6.7).
In conclusion, age seems to be the most influential socio-economic factor affecting publicparticipation in TAO decision-making (elections, proposing the annual plan, andimplementing TAO projects). The other socio-economic factors (education level, occupationand income level) have little influence on participation in TAO decision-making.
Tabl
e 6.
7Cr
oss
Tabu
latio
n A
mon
g So
cio-
econ
omic
Fac
tors
and
Pub
lic P
artic
ipat
ion
in T
AO
-Org
aniz
ed A
ctiv
ities
Age
ny
nn
yn
ny
nn
ny
n4
Edu
cati
onn
nn
yy
nn
nn
nn
yn
3
Occ
upat
ion
nn
nn
nn
nn
ny
nn
n1
Inco
me
yn
nn
nna
nn
nn
nn
n1
Per
cent
age
of p
arti
cipa
ted
peop
le65
.255
.563
7486
98.1
78.3
7576
.953
.799
8669
.3
in T
AO
s’ O
rgan
ized
Act
ivit
ies
Rem
arks
:y
mea
ns fa
ctor
from
var
iabl
e ha
s si
gnifi
canc
e le
vel a
gain
st p
eopl
e pa
rtic
ipat
ion.
nm
eans
fact
or fr
om v
aria
ble
has
no s
igni
fican
ce le
vel a
gain
st p
eopl
e pa
rtic
ipat
ion.
nam
eans
the
re a
re s
ome
mis
take
s in
the
que
stio
nnai
re s
o th
at u
nabl
e to
ana
lyze
.
Sour
ce:
Fiel
d su
rvey
, 200
7
Num
bers
of
area
whi
ch f
acto
rva
riab
les
have
eff
ects
on p
eopl
epa
rtic
ipat
ion
in T
AO
s’or
gani
zed
acti
viti
es
AB
CD
EF
GH
IJ
KL
M
- 16 - 17

CHAPTER7FACTORS FOR SUCCESSFUL
ADMINISTRATIVE ANDBUDGETARY SYSTEM
© U
NIC
EF
Tha
iland
/Y R
atar
asar
n

chapter 7
DECENTRALIZATION AND THE BUDGET FOR SOCIAL SERVICES AT TAMBON ADMINISTRATIVE LEVEL Factors for Successful Administrative and Budgetary System
chapter 7
7.1 FRAMEWORK FOR TAO’S SUCCESSFUL ADMINISTRATIVE ANDBUDGETARY SYSTEM
A review of other developing countries that have experience with social development fundsconcluded that such funds will generally be used effectively under the following conditions:
1. Public demands are engaged, i.e. operations require a high degree of localinvolvement;
2. The operations must be transparent and hence accountable;3. The funds must be carefully targeted to needy groups; and4. The funds must have relative autonomy in operation.
The most important condition is the involvement of the beneficiary groups in both themanagement and operation of the funds.1 From international experience it appearspossible to deliver public services efficiently and effectively even under poorly functioningpublic administration if there is a qualitative involvement of the local people. Thus, it isinteresting to investigate whether TAOs seriously consider stimulating popularparticipation in their decision-making and in the delivery of social services.
Normally, the public demand on governmental social services increases with economicdevelopment and rises drastically in times of economic crisis, which affects people with thelow incomes especially. As the public demand for social services increases and thegovernment no longer has the capacity or resources to meet them, the gap betweengovernment capacity and public demands widens substantially (Figure 7.1). Thegovernment must develop policy options to alleviate or reduce this gap.
The government should use the TAPE management framework2 in its decision-making toensure the well-being of its people. Under the TAPE model of management, the T stands fortransparency, A stands for accountability, P stands for participation, and E stands forefficiency and effectiveness. Public administration of the government should implementclear public policies that exhibit TAPE in order to gain credibility and trust.
There are several possible ways to alleviate the gap between government resources/capacities and public demands. The first is to apply the principles of new publicmanagement (NPM)3. NPM improves transparency, accountability, and participation. At thesame time NPM also promotes economic reform by eliminating those government policiesand programs that are not cost-efficient.
Second, promoting public participation can reduce the gap between public demands andthe government resources. By getting involved in the LGU’s affairs, people may realize thattheir government does not have unlimited budget and usually does not have enough money.Then they may reduce their demands on the government or they may volunteer to do somework in order to reduce the cost. Public participation is very important. LGUs need toencourage people to be involved in their government, leading to long-term and sustainabledevelopment.
Third, non-profit organizations (NPOs) and non-governmental organizations (NGOs) canalso provide much of the needed social services. NPOs and NGOs can support thecommunity and government in terms of both monetary and non-monetary assistance. Thus,the coordination between the LGUs and NPOs/NGOs may alleviate the gap between theavailability of government resources and public demand.
This study will employ the TAPE framework (transparency, accountability, participation,and efficiency-effectiveness) as the basis for analysis of the best (or worst) practice model ofthe TAO community behavior. In general, TAOs which are successful in their administrationand budget fall under the TAPE framework. The descriptions of TAPE model are as follows:
Transparency implies openness, communication, and accountability. Transparency isone means of holding public officials accountable and fighting corruption. Transparentprocedures include open meetings, financial disclosure statements, freedom of informationlegislation, budgetary review, audits, etc.
- 2 - 3
Figure 7.1 Gap between citizen demands andgovernmental resources and capacities
Citizen demand
Government Resourcesand Capability
- Transparency- Accountability- Participation- Efficiency & Effectiveness
Time
Level of Demand andAvailability of Resources
Source: Adapted from Nakamura (2005)
1 Bird and Vaillancourt, (1998), p 10.2 Akira Nakamura, “Local Government and Local Governance Amidst Declining Public Trust in Government:
From a Japanese Perspective,” The paper delivered at the 20th General Assembly, The Eastern Regional
Organization for Public Administration, Hanoi, Vietnam, October 9 to 14, 2005, p. 10-11. 3 NPM is the process of running government like a business.

chapter 7
DECENTRALIZATION AND THE BUDGET FOR SOCIAL SERVICES AT TAMBON ADMINISTRATIVE LEVEL Factors for Successful Administrative and Budgetary System
chapter 7
There is less opportunity for TAO officials to abuse the system for their own self-interest ifTAO meetings are open to the public, if the budget and financial statements can bereviewed by anyone, and if laws, rules and decisions are open to discussion.
Transparency cannot exist as a purely one-way communication. People who are interestedin a certain issue will try to influence the decisions. Transparency creates regularparticipation in the political process by the public. In modern democracy, there are manyways to influence the decisions at all levels in society. Elections allow people to rulethemselves as well as make major changes in the political course.
Transparency is the opposite of privacy; an activity is transparent if all information aboutit is open and freely available. If the administration makes decision secretly, corruption canoccur easily. Information of ordinary interest to the community should be made freelyavailable.
Accountability means that TAO’s executive is accountable to the people. The TAO’sexecutive is obliged to inform people about the TAO’s past or future actions and decisions,to justify them, and to suffer punishment in the event of misconduct.
For the TAO’s executive, accountability means acknowledging responsibility for all actions,products, services, decisions, and policies (including their administration, governance andimplementation) within the authority of their position, and the obligation to report, explainand answer for the resulting consequences4.
Elections are the most direct method of ensuring accountability, empowering people tomonitor and restrain their representatives. An election campaign gives a candidate forchief executive the chance to explain and describe his policies, purposes and goals if he iselected. Moreover, by voting for someone else, people can use elections to sanction anexecutive who misbehaved or failed to act as a representative.
Another method of accountability is the inquiry session. People in the community can meetwith the TAO’s executive to seek explanation of any specific plans or policies and to uncoverany inappropriate conduct. This mechanism is aimed at communicating with people in thecommunity and leads to accountability.
Whether the TAO administration is accountable depends on whether voices from people inthe community, which is outside the public sector, are heard. Moreover, the TAO is obligedto empower people with political rights and ensure that the voice of the people in thecommunity is heard in the policy-making process.
Participation: refers to various methods people may have to influence political,economic, or management decisions. People should be able to participate in the TAO’sdecisions directly proportional to the degree that a particular decision affects them. Forwell-informed participation to occur, some level of transparency is necessary.
Participatory democracy is a term that emphasizes the broad involvement of people in thedirection operation of their political system. Any democracy would rely on the participation
of its citizens5. People should not participate in the political system merely by voting andleaving the actual governance to politicians. People should be able to participate in theTAO’s decision-making itself because the decisions that the TAO makes affect people in thecommunity directly.
Participatory democracy attempts to create opportunities for all people to make meaningfulcontributions to decision-making, and tries to broaden the range of people who have accessto such opportunities. In addition to participatory democracy, community-based activitywithin civil society is very important. A strong civil society (non-governmental public based)is a precondition for the development of a strong liberal democracy.
Efficiency and Effectiveness is one of the TAOs’ aims. The executive has to ensurethat the resources available to local government are used in the optimum way to deliverbetter public services, according to local priorities.
The pressure to achieve value for money is coming at local governments from all sides.The central government is determined that public services become both more effectiveand more efficient. People are reluctant to see their taxes increase without seeing anaccompanying benefit to themselves. Competing demands for high-priority services such aseducation and social services means that TAOs have to manage their resources efficiently tomeet citizen expectations.
It is unsurprising then that many organizations are increasingly looking for innovative anddaring ways to respond to these pressures. These include introducing new ways of working,including closer collaboration between the local government and the population, reducingcosts and improving efficiency, transforming organizational structures to build capacityand entering into partnerships with the private sector to add value to the services theydeliver.
7.2 TAO’S ADMINISTRATIVE AND BUDGETARY MODELS
The TAO’s administrative and budgetary systems can be classified into four models(described below) based on the institutional factors of each TAO, according to the empiricalresults of the fields survey. Though all of the TAOs are under the same administrativeregulations issued by the Ministry of Interior, the executive body of each TAO has thefreedom to use their management skills to innovate in their administration. The resultsfrom the empirical work can be summarized into the following categories:
1. PUBLIC PARTICIPATION MODEL
The chief characteristic of the public participation model is that the people are involved inTAO decision-making. The advantage of this model is that people can propose their realneeds to the TAO so that it will know exactly what they are. Thus, the TAO will be able toprovide social services and social welfare according to the public voice. Moreover, peoplewill learn about the democratic process in their communities as well as the roles and dutiesof the TAO. People will also learn that they must help themselves first and not just wait for
- 4 - 5
4 Accountability is often used in concepts such as answerability, enforcement, responsibility, blameworthiness,
liability, and account-giving. 5 The Greek demos and kratos combine to suggest that “the people rule.”

chapter 7
DECENTRALIZATION AND THE BUDGET FOR SOCIAL SERVICES AT TAMBON ADMINISTRATIVE LEVEL Factors for Successful Administrative and Budgetary System
chapter 7
help from the TAO or someone else. By participating in TAO decision-making, people willbecome more aware of the budgetary constraints faced by the TAO. Then they mayvoluntarily reduce or limit their demands for social services or they may volunteer to dosome work in order to reduce the cost.
On the other hand, the disadvantage of this model is the TAO may lack a long-termdevelopment plan for the community if the decisions of the TAO are based solely on people’sneeds in that period. Normally, people might demand only what they need at that point butmight not think about community development in the long-run. They may need someguidance from the chief executive to plan the development of the community in the long-run.From the survey sample, people can participate in decision-making in many ways as follows.
When the chief executive of the TAO understands the importance of public participation indecision-making, the TAO educates people and encourages them to participate in the TAOplanning process. The TAO disseminates information about the roles and duties of TAO tothe public. There is support for people to form mutual interest groups such as occupationalgroups, elderly groups, children’s groups, etc. The TAO cooperates with the leaders of thecommunity, such as the village committee, the heads of the villages and the head of thedistrict, to educate the people. Thus, they can organize their own activities with moneysubsidized from the TAO. The TAO lets these organizations be operated by their membersaccording to the nature of the group. In the process of making TAO’s development plan,each group/organization and people in the village will propose and prioritize their plansthrough the village meeting. Then, each village will present its proposal in the communitymeeting before submitting it to the TAO. The TAO will summarize all the proposals from thiscommunity meeting and present them for consideration to the executive board whichestablishes the TAO plans and budget.
TAO A is the one of the TAOs in our survey that uses this administrative model. Forexample, TAO A allows elderly groups established by the community to have access to thebudget allocation decision. TAO A appropriates a portion of its budget to finance theiractivities, such as health prevention programs, annual health care activities, andeducational tours, without interfering in the details of how the funds are spent. The groupsmust report to the TAO, showing that the money was used to pursue certain activities,so the TAO has a record which it can audit or evaluate further. Some line agencies, such asthe Thai Health Promotion Foundation, also provide assistance to promote health careprograms that benefit certain groups within the TAO. The TAO coordinates how the peopleand the government line agencies (or the private sector) organize and distribute resourcesin the community. While the executive board makes decisions according to the communityvoice, the executive board can introduce plans or policies with long-term benefits.
In some TAOs, such as TAO M, public participation starts with a strong civil society. Thiscommunity has a high-degree of social capital that has been well-established for years.Because TAO M is an old community where people live in harmony with one another, Peoplecan manage their own projects and activities very well. A good example of collectivemanagement by the community is the operation of its own rice mills. The need forsocial services, which are not fully covered by the government, will be fulfilled by themanagement of the community. The village heads and the district head take the lead inmanaging several projects initiated under central government policies (such as the SMLprojects, the Village Fund and the SIF). Thus, people in TAO M will create their ownprojects and actively participate in other projects and planning. Since the temple serves as
a community center, monks act as leaders in community development. The communityleaders, including the TAO chief executive and the village heads, cooperate with the monksto manage many of the projects which benefit society. The role of the TAO is to fund theseprojects from its budget. Traditional culture, such as religious ceremonies held in thevillages, builds community bonds which encourages people to help one another.
The development plan of TAO E is also formulated according to the voice of people. At thevillage meeting each month, people raise their needs and concerns, and then their demandsare prioritized. Each village has its own community plan which corresponds to the TAOdevelopment plan6. In the council meeting, the TAO selects which projects to supportaccording to the importance of the problem. The TAO allocates its budget fund to eachvillage by rotating across villages. The TAO also adds more money into some social servicessuch as pensions to the elderly even though it is not yet able to cover all needs. Occupationalgroups also receive a subsidy from the TAO to support their activities in occupationaltraining and the marketing of their products. The TAO monitors their work afterwards toensure that the funds have been used properly. The coordination between the TAO andother agencies which operate in the area, such as government line agencies and non-profitorganizations, is very important to drive the community forward. Although the activities ofgovernment line agencies are documented, there is little information regarding theactivities of NGOs working within the TAO because many of them prefer to workindependently.
2. STRONG/ACTIVE EXECUTIVE MODEL
The main characteristic of this model is that the TAO chief executive has a vision forcommunity development. He cooperates with government line agencies to manage resourcesfor the maximum benefit of the community. This model can be described as a paternalistic.This means the TAO or the chief executive will decide whatever they believe is best forpeople in the community. The advantage of this model is that a chief executive who has agood vision for long-term development and a good understanding of the people’s needswould be able to develop his community well.
The disadvantage is that the chief executive’s plans may not really conform to people’sneeds. Thus, development in that community might not satisfy people in the society verymuch. Another weakness is that a lack of public participation in TAO decision-making mightimpede long-term development since people might not understand the roles and duties ofthe TAO and not cooperate with it in the long-run. Moreover, the chief executive is anelected politician who can remain in his position for a maximum of two terms (8 years). Forlong-term and sustainable development, people need to be involved in planning communitydevelopment.
In TAOs where the group identity of people in the community is not as strong, the chiefexecutive can be a leader who incorporates the public into the decision-making process.For instance, the chief executive of TAO G realizes the importance of public participationin planning. Thus, the TAO cooperates with the leaders of the community (the villagecommittee, the heads of the villages and the head of the district) by meeting regularly.Moreover, the TAO cooperates with the government line agencies (such as the district health
- 6 - 7
6 Each year head of the district, heads of the villages and village committee will have a meeting in order to set up
a community plan.

chapter 7
DECENTRALIZATION AND THE BUDGET FOR SOCIAL SERVICES AT TAMBON ADMINISTRATIVE LEVEL Factors for Successful Administrative and Budgetary System
chapter 7
care department, the district agriculture department and the police). One interesting ideaused in TAO G is the mobile unit which finds out what people need and tries to deliver publicservices directly to the people. When the TAO mobile unit goes to different villages, it setsup a village meeting in order to let people present their problems and their needs directly tothe TAO. The TAO can gather this useful information from people and integrate it into theTAO’s development plan to improve living conditions in the community. TAO G has haddifficulty encouraging participation in its decision-making because of workers who leave toseek work outside the community. People of working age have to seek employment outsidetheir community in order to earn money to support their families. Thus, this group of people(which is actually a potential group) cannot contribute very much to the society.
Another TAO which operates under this model is TAO H. The chief executive’s ideasdominate the development plans for the area7. People do not actively participate in thedecision-making, although they are satisfied with the TAO’s operations because they benefitfrom the TAO’s projects. The advantage of this kind of management is that the chiefexecutive who has a vision for development will be able to make a better long-termdevelopment plan for the community. In the case of TAO H, the chief executive is capableand knowledgeable about local people’s needs. A strong network of TAO representativeslive within the communities and serve as an extended administrative body, learning aboutthe needs of and providing direct assistance to the people. As a result, the local people lookup to the chief executive of the TAO as “father figure.” Also, the chief executive of TAO Hemphasizes public health programs that directly benefit the elderly. He uses specific-purpose grants from the central government and the TAO budget to increase his popularityamong the people.
In some areas, the chief executive creates projects that benefit the community in thelong-run. For instance, the chief executive of TAO L initiated the construction of a roadalong the seashore connecting to an adjacent TAO. Unfortunately, people cannot form theirown mutual interest groups yet because they are very poor and busy with daily living. Mostof their time is spent earning income for basic living expenses. This example shows thatpoor economic conditions are one of the obstacles to group formation and participationin decision-making. In this area, they have many other problems that are beyond thecapacity of the TAO to solve: an insufficient supply of clean drinking and a lack of basicinfrastructure such as fishing piers, roads, etc. Many communities in the TAO havedifficulty making contact with people outside their communities (especially the island partof the TAO). As a result, the TAO serves as the sole representative of a public agency solvinglocal problems. Other government line agencies hardly provide any public services orcooperate with the TAO despite the need for cooperation between the TAO and otheragencies. Yet religious activities, such as “Lamad,” are a means of communication amongpeople in the community8. Religious activities bring people together to discuss theirproblems with one another and look for solutions. Meanwhile, they are able to proposetheir needs to the executives in order to incorporate them into the TAO’s policies.
Another example of administration based on the strong chief executive can be found inTAO K: the community “patronage” scheme. Again, the ideas of the chief executivedominates most of the development plans. However, a community that operates under thismodel has to be careful about who will gain from the designed projects. It is risky to giveparticular benefits to specific groups without a fair distribution among the people. The chiefexecutive of TAO K emphasizes improvements in the quality of life and support foroccupational groups. The executive has also tried to improve social services by adding moremoney to pensions that cover the elderly and the handicapped in the community. However,the scheme has been used as a tool by the executive to gain local political popularity. Thus,these pension programs can be described as “popularity programs.”
TAO B spans both urban and rural areas. In the urban area, people tend to work in thenon-agricultural private sector so they have a higher income and are better-able to helpthemselves. Thus, people in the urban area have shown less interest in participating incommunity meetings and the TAO’s decision-making. In the rural area, people tend to workin the agricultural sector and remain in need of TAO assistance and social services. Thus,they are more likely to participate in the TAO’s decision-making and propose their needs tothe TAO. People in the rural area can form mutual interest groups. Moreover, the chiefexecutive is considered an influential man in the area. The chief executive runs most of theprojects with cooperation from the chief of the TAO council, a former university lecturer,leading the development plans for the community.
TAO I is also managed by the chief executive. Some of its projects are managed withoutcooperation from the local leaders, such as the district head and the heads of the villages.The chief executive of the TAO has to balance the best interests of the majority with theinterests of opposition groups. Thus, people who receive services from the TAO have to beargreater costs than they should. However, the current chief executive of TAO I won themajority of votes from the people. The chief executive needs to make decisions aboutdevelopment which will benefit the community, otherwise it will remain underdevelopedcompared to its potential. Fortunately, the chief executive has the support of the head monkof the village temple, one of the community leaders and a center of spiritual morale, inbringing people in the area together. This is another factor important to the success ofcommunity development.
3. STRONG/ACTIVE GOVERNMENT OFFICER MODEL
In some areas, the chief executive of the TAO is not that effective. Even though the executivehas been elected by the majority, this may be because of his popularity and not because ofhis ability to manage. If so, the permanent secretary of the TAO must step in to the role ofthe TAO chief executive. The permanent secretary can have a significant role in developingcommunity. The advantage of this model is that the permanent secretary would normallyserve in the area for a long time. This means that he will understand people’s needs, andthe social and geographic characteristics of the area better than others. If the permanentsecretary devotes himself to social development and supports the chief executive inperforming the duties, the community would benefit a great deal. Moreover, long-termdevelopment relies on public participation in decision-making: a strong community basecan be a driving factor for social change.
- 8 - 9
7 In some areas, the chief executive needs to dominate the development plan and does not let people participate
in the decision-making process that much, partially because the area has a lot of benefits and a variety of
interest groups would like to gain those benefits for themselves. Thus, the chief executive has to decide what is
best for the community.8 In this specific area, communication is still restricted to men. The women in the area do not have a chance to
participate in the decision-making process. This is due to the culture of the community.

chapter 7
DECENTRALIZATION AND THE BUDGET FOR SOCIAL SERVICES AT TAMBON ADMINISTRATIVE LEVEL Factors for Successful Administrative and Budgetary System
chapter 7
In TAO F, there is a serious problem attaining access to villages under the TAO’ssupervision. The chief executive of the TAO is motivated to support development but lacksthe knowledge and understanding of how to do so. Thus, the permanent secretary emergesas a coordinator between the administrative body and local people because he has thevision and ability to improve the quality of life. The permanent secretary and chiefexecutive can cooperate in planning how to improve the well-being of villages within theTAO. They start the process by developing basic information on people’s needs andproblems within the area. This information is used to help establish clear objectives for thedevelopment plan. The permanent secretary also helps to build good relationships betweenthe government’s regional officers and the chief executive of the TAO. The permanentsecretary can manage and distribute resources to people in the community. During thecommunity meeting, the permanent secretary also educates people concerning their rightsand duties toward the TAO. From this learning process, people begin to help themselvesand put greater effort into the TAO’s activities. Since people in this area are generally poor,living in perhaps one of the poorest villages in the country, they are busy with daily livingand earning income to support their families rather than sacrificing their time to theTAO’s development activities. Nonetheless, the permanent secretary’s efforts to educatepeople concerning their duties toward the TAO helps encourage them to participate in theTAO’s activities.
The coordination between the chief executive and the permanent secretary in conductingthe TAO’s duties was also found in TAO J. Both the chief executive and the permanentsecretary were former government regional officers. Normally when government officialsare the main personnel supervising all activities, they follow rules and regulations strictly.Unfortunately, they may lack initiative and innovation in their management approach. TheTAO may be viewed as another government agency, unresponsive to people’s demands.
4. ROUTINE WORK MODEL
In this model, the chief executive and the permanent secretary are not strong and active.Most of the activities that the TAO conducts are routine duties under the TAO law. Thismodel may be suitable for areas such as TAO C where most of the area is forest set aside forconservation. The weakness of this model is the lack of creative activities to solve problemsin the community. The TAO should try to help people in the community to have a betterquality of life as well as encourage people to participate in TAO activities and the TAOplanning process. As a result, people will be able to help each other solve their ownproblems and reduce the burden on the TAO.
For instance, TAO C and TAO D carried out most of their duties according to the law in aroutine fashion. There are few creative plans to solve problems or improve the quality oflife in the community. Most of the budget is allocated to infrastructure projects. The chiefexecutive does not pay much attention to distributing the budget to provide social services,such as health care, education, and pensions. People are inactive and worry about daily lifeand earning income rather than joining hands in community activities. They have not formedmutual interest groups and do not actively participate in the planning process of the TAO.
In summary, each of the four models of TAO administration and budgeting discussed abovehas advantages and disadvantages. One model may be more suitable for a particular TAOthan the others, depending on the special characteristics of the TAO. The institutionalfactors analysis and the field survey lead us to conclude that there are two conditions for
long-term and sustainable development: a necessary condition and a sufficient condition.The necessary condition is that the chief executive or the permanent secretary must havea vision of development and the ability to guide the TAO in the right direction as anorganization, while understanding people’s needs and problems and incorporating theminto its decision-making. However, this is not a sufficient condition because the chiefexecutive and the permanent secretary may be removed from their positions. The chiefexecutive can stay in his position for the maximum of two terms (8 years), and thepermanent secretary can be transferred to another office. Thus, the policies or thedevelopment plans implemented under the existing administrative team might not becontinued after the team has been changed. The community cannot rely solely on personnelfor long-term sustainable development. The sufficient condition is that people participate inthe TAO’s decision-making and development plan. Only a strong community base can be adriving factor for sustainable development.
7.3 THE RELATIONSHIP BETWEEN THE LEVEL OF PUBLIC SATISFACTIONAND PUBLIC PARTICIPATION
Figure 7.2 shows the relationship between people’s satisfaction with the TAO’s performancein developing the community over the past 3 years9 and their participation in the TAO10.The level of satisfaction with TAO indicates the competency of the chief executive. The TAOsthat have the highest levels of participation, namely, TAO A, TAO E and TAO M, have higherlevels of satisfaction with the performance of the TAO than six of the other TAOs inthe survey. TAO J and TAO F have the second and third highest levels of satisfaction,respectively, because of their special characteristics. For instance, TAO F, located inprovince, which is very far from the city, so the TAO is the only government unit providingsocial services to people in the community. People believe that their TAO tries to providethem with good service and develop their community, so the level of satisfaction in thiscommunity is very high. TAO G also has a high level of satisfaction because the chiefexecutive tries to get information from people in the community about what they need andtries to bring them into the community decision-making process. The chief executive stilltries to encourage participation, despite the fact that TAO G faces the problem of migratingworkers leaving the area. TAO H also has a high-level of satisfaction, because the chiefexecutive of TAO H is able to implement development plans that distribute benefits tomutual interest groups in the community.
The TAOs that operated under routine work model such as TAO C and TAO D had a lowerlevel of satisfaction than most of the other TAOs in the survey. The quality of life of people inthis area may not have improved much over the past 3 years because the TAOs did not haveany innovative ideas for social services provision. TAO K and TAO B also have a low level ofsatisfaction. This indicates that the patronage scheme in TAO K leads to lower levels of
- 10 - 11
9 The level of satisfaction with the performance of the TAO in developing the community over the past 3 years was
calculated from the results of the field survey (questionnaire question no. 3.1). The level of satisfaction is the
total of the scores given expressed as a percentage of the total possible score.10 The level of participation was calculated from the results of the field survey (questionnaire question no. 4.4, 4.9
and 4.12), concerning proposing developments plans or project to the TAO, participation in implementing or
managing TAO projects, and participation in other TAO activities. The level of participation is the total of the
three participation scores given expressed as a percentage of the total possible score.

chapter 7
DECENTRALIZATION AND THE BUDGET FOR SOCIAL SERVICES AT TAMBON ADMINISTRATIVE LEVEL Factors for Successful Administrative and Budgetary System
chapter 7
satisfaction and the chief executive of TAO B may not have developed his community tomeet people’s needs and or eliminate their problems.
In conclusion, the TAOs that spend a large amount of money on social services do notnecessarily meet their people’s needs or solve their problems. As the survey shows, a largeamount of spending per capita does not always lead to a high level of satisfaction. Moreimportantly, the people can have a high level of satisfaction with their social services eventhough the budget is small, if the TAO uses its budget efficiently and effectively.
- 12 - 13
7.4 THE RELATIONSHIP BETWEEN PUBLIC SATISFACTION ANDPER CAPITA EXPENDITURE FOR SOCIAL SERVICE FUNCTIONS
Figure 7.3 shows the relationship between the level of satisfaction with the performance ofthe TAO over the past 3 years11 and the TAO’s expenditures on social services per capita.In our sample, TAO F spent the highest amount per capita on social services, and has a highlevel of satisfaction with its performance over the past 3 years. The population of TAO F(2516 in 2006) is smaller than the other sampled TAOs so the per capita expenditure is thehighest. TAO B spent the second highest amount per capita on social services. TAO B is acommunity with a large population (17,199 in 2006), and it receives a much higher budgetthan the other TAOs in our sample. TAO B spent a total of 38,249,102 baht on socialservices, yet the level of satisfaction is lower in TAO B than it is in most of the other TAOs,even though they spent less on social services.
Surprisingly, TAO E has the highest level of satisfaction despite the fact that the TAO spentthe second least amount per capita on social services. This indicates that TAO E is moreefficient and effective in spending money for social services than the other TAOs. SomeTAOs, such as TAO C and TAO K, spend a large amount on social services yet people are notsatisfied with them12. Another TAO, TAO D, spent less money on social services and peoplealso felt less satisfaction with the TAO’s social services.
Figure 7.2 The relationship between the level of satisfactionand the level of participation
Source: The author.
L
90.0
80.0
70.0
60.0
50.0
40.0
30.0
20.0
10.0
0.0
61.0 62.0 63.0 64.0 65.0 66.0 67.0 68.0 69.0 70.0 71.0 72.0 73.0
Par
ticip
atio
n
Satisfaction
People participation mode Strong executive mode
Strong government officer mode Routine work mode
D
CK
B
I
G
H
M
E
A
J
F
11 The calculation method is the same as the above.12 See the explanation of the characteristics of these TAOs in the topic “TAO’s Administering and Budgeting
Models” above.
Figure 7.3 The relationship between people satisfaction andper capita TAO’s expenditure budget on social services
A
D
CK
B
L
H
G
I
M
E
F
J
2,500
2,300
2,100
1,900
1,700
1,500
1,300
1,100
900
700
500
60.0 62.0 64.0 66.0 68.0 70.0 72.0 74.0
Satisfaction
People participation mode Strong executive mode
Strong government officer mode Routine work mode
Per
Cap
ita E
xpen
ditu
re
Source: The author.
7.5 BEST PRACTICES FOR SUCCESSFUL TAO PERFORMANCE INADMINISTRATION AND BUDGETING
From our finding, we can state some best practices for successful TAO performance andbudgeting as following.
1. Public understanding of the roles and duties of the TAO: this is the first conditionnecessary for encouraging people to cooperate with that TAO and participate in itsdecision-making. TAO A is a good example of this condition, since the people show agood understanding of the roles and duties of the TAO and play a significant role inthe TAO’s development planning.
2. TAO needs to educate people regarding their rights and responsibilities to the TAO.This means that people share equal responsibility with the TAO in providing publicservices. People cannot be responsible for the community unless they are aware of theirresponsibilities. This is the accountability between the TAO and the people in thecommunity. For instance, people in TAO A and TAO M play a significant role in the TAO,solving problems and improving the quality of life in their communities.

chapter 7
DECENTRALIZATION AND THE BUDGET FOR SOCIAL SERVICES AT TAMBON ADMINISTRATIVE LEVEL Factors for Successful Administrative and Budgetary System
chapter 7
3. Public participation in community decision-making. People will participate indecision-making when they understand their rights and responsibilities in the TAO,They realize the importance of participation in TAO development planning because itwill eventually benefit the community, including themselves. TAO A, TAO M, and TAO Eeach operated with public participation in its decision-making (with different degrees ofsuccess).
4. The formation of mutual interest groups, such as occupational groups, senior-citizengroups, etc. The formation of such groups in the community is an important factor forsuccessful community development. When people can successfully organize themselvesinto mutual interest groups, this indicates that they are actively concerned aboutcommunity issues as more than just individuals. If people in the community cooperatewith one another, then it can develop successfully as people help one another solve theirproblems. TAO A and TAO M are the best examples of this condition.
5. The strength of civil society rooted in the community’s traditional culture. Thedevelopment of the community in the long-run also depends on the strength of civilsociety. If the community has a traditional culture or way of life that can support itself,this will drive the community in the future. TAO M is a good example of a communitywhich can sustain itself in the long-run.
6. The chief executive’s understanding of social development, including having a long-termvision. The chief executives of some TAO (such as TAO A, TAO G, TAO M, TAO H, TAO L,TAO B and TAO F) have good understanding of social development. They will be able tomanage their communities in the way that benefits people in both the short-run and thelong-run.
7. The coordination between the chief executive of TAO and the other units. The chiefexecutive of the TAO will not be effective in solving problems or developing thecommunity unless he understands that he cannot work alone. The chief executive mustcooperate with the TAO officials (such as the permanent secretary), the heads of thecommunity (such as the village committee, the village heads, the head of district andvillage nobles) and other entities (such as the central government, government lineagencies, and non-government organizations). Although the TAO is the unit thatperforms all of the administrative duties in the area, it may not necessarily be able tosolve all the problems in the community on its own. Some problems are beyond thecapacity or the budget of the TAO to solve, so the chief executive must cooperate withthe other entities. In addition, the successful operation of the TAO depends on thecooperation between TAO officials and community leaders. The lack of such cooperationin TAO I was an obstacle to community development. This confirms that cooperationamong the various units is important for successful development.
8. The permanent secretary of the TAO plays significant role in delivering public services topeople in the community by working with and supporting the chief executive. Normally,the permanent secretary works for the TAO longer and more continuously than the otherofficials. Supposedly, he will know the activities of TAO better than the others. If thepermanent secretary works with and supports the chief executive, the TAO will delivercontinuity in development and providing social services. A good example is TAO F andTAO L.
9. Common activities that bring people together, strengthening civil society. If thecommunity does not have common activities to bring people together, people will stayseparate and have fewer chances to communicate with one another about communityissues. Areas which have regular common activities, such as religious ceremonies inTAO M or Lamad in TAO L, have a strong civil society because people can meet andcommunicate with one another during the activities.
10. The duty of the TAO to report on its operations. To be transparent, the TAO needs toreport regularly on their activities to the public. Thus, people will know more about theprogress of the TAO’s work and understand more about the roles and duties of TAO.
11. The right of the people to monitor and audit TAO operations. To insure transparency,people must have the right to monitor and audit TAO operations. Transparency caninduce the TAO to improve its operations, as people give feedback to the TAO aboutwhat work has not been completed or what problems have not yet been solved. Thus,the TAO is more likely to complete its operations and be concerned about itsdevelopment plan.
Our findings about the best practices in TAO administration and budgeting follow the TAPEframework described at the beginning of this chapter. Table 7.1 summarizes factorsrequired for successful performance in administration and budgeting.
- 14 - 15
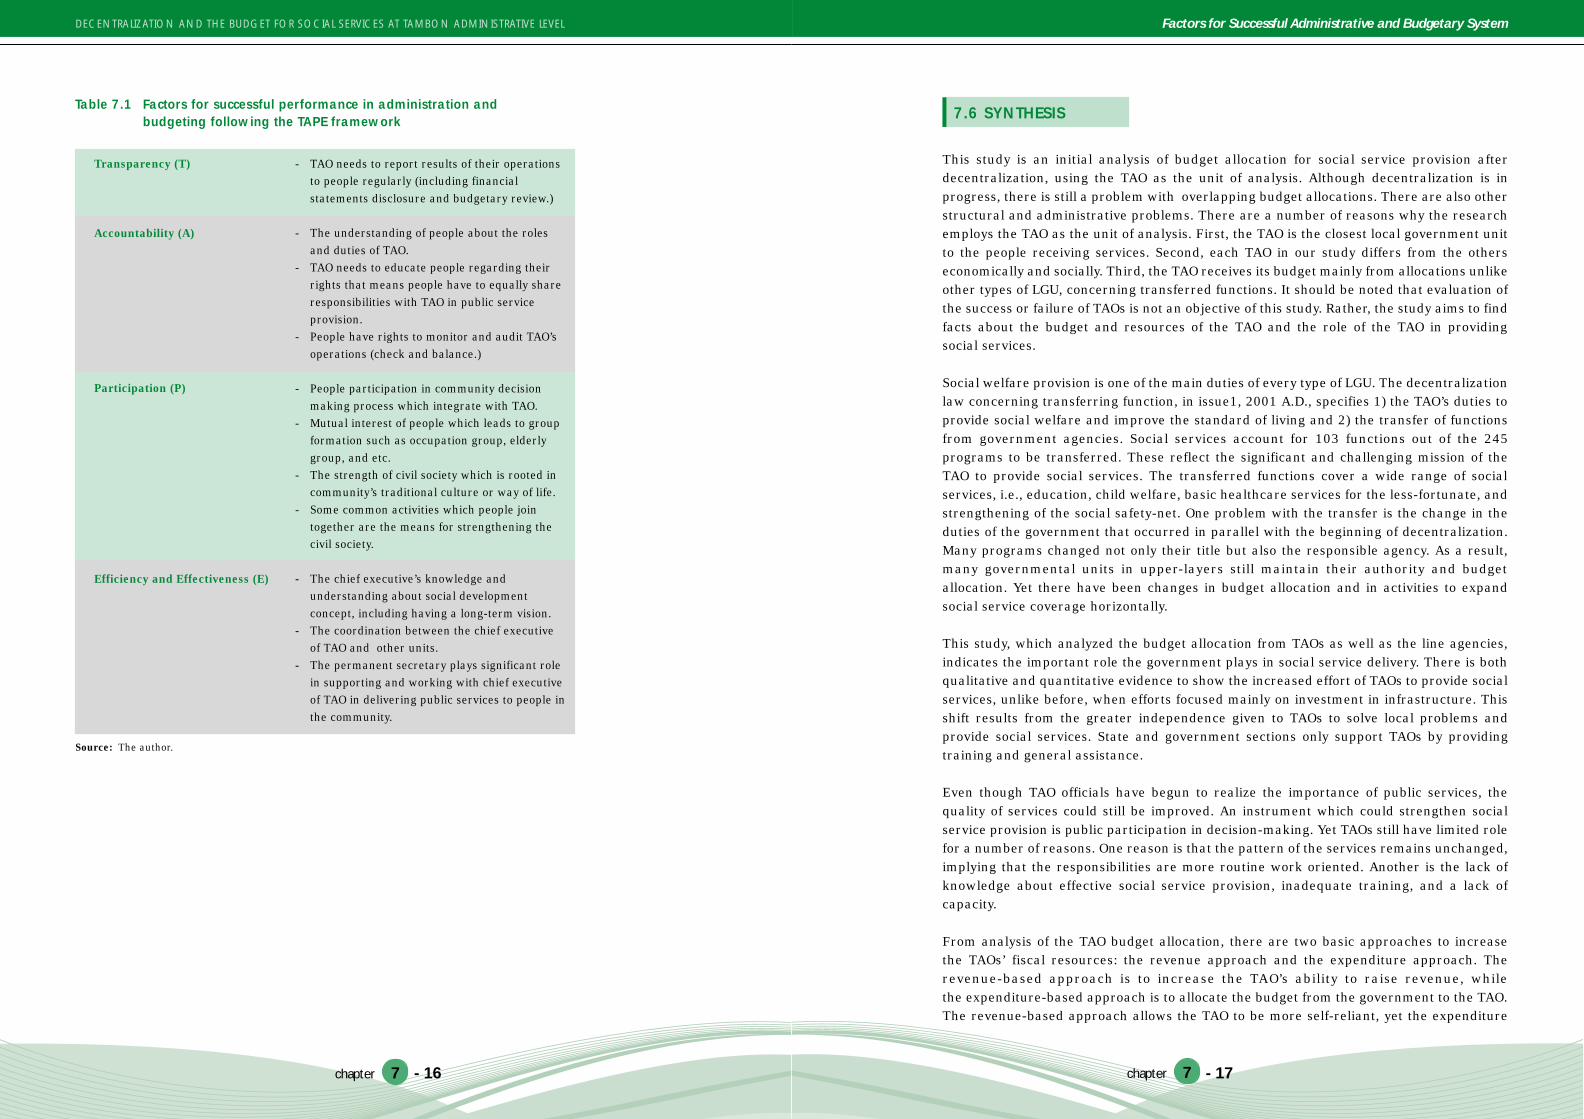
chapter 7
DECENTRALIZATION AND THE BUDGET FOR SOCIAL SERVICES AT TAMBON ADMINISTRATIVE LEVEL Factors for Successful Administrative and Budgetary System
chapter 7- 16 - 17
7.6 SYNTHESIS
This study is an initial analysis of budget allocation for social service provision afterdecentralization, using the TAO as the unit of analysis. Although decentralization is inprogress, there is still a problem with overlapping budget allocations. There are also otherstructural and administrative problems. There are a number of reasons why the researchemploys the TAO as the unit of analysis. First, the TAO is the closest local government unitto the people receiving services. Second, each TAO in our study differs from the otherseconomically and socially. Third, the TAO receives its budget mainly from allocations unlikeother types of LGU, concerning transferred functions. It should be noted that evaluation ofthe success or failure of TAOs is not an objective of this study. Rather, the study aims to findfacts about the budget and resources of the TAO and the role of the TAO in providingsocial services.
Social welfare provision is one of the main duties of every type of LGU. The decentralizationlaw concerning transferring function, in issue1, 2001 A.D., specifies 1) the TAO’s duties toprovide social welfare and improve the standard of living and 2) the transfer of functionsfrom government agencies. Social services account for 103 functions out of the 245programs to be transferred. These reflect the significant and challenging mission of theTAO to provide social services. The transferred functions cover a wide range of socialservices, i.e., education, child welfare, basic healthcare services for the less-fortunate, andstrengthening of the social safety-net. One problem with the transfer is the change in theduties of the government that occurred in parallel with the beginning of decentralization.Many programs changed not only their title but also the responsible agency. As a result,many governmental units in upper-layers still maintain their authority and budgetallocation. Yet there have been changes in budget allocation and in activities to expandsocial service coverage horizontally.
This study, which analyzed the budget allocation from TAOs as well as the line agencies,indicates the important role the government plays in social service delivery. There is bothqualitative and quantitative evidence to show the increased effort of TAOs to provide socialservices, unlike before, when efforts focused mainly on investment in infrastructure. Thisshift results from the greater independence given to TAOs to solve local problems andprovide social services. State and government sections only support TAOs by providingtraining and general assistance.
Even though TAO officials have begun to realize the importance of public services, thequality of services could still be improved. An instrument which could strengthen socialservice provision is public participation in decision-making. Yet TAOs still have limited rolefor a number of reasons. One reason is that the pattern of the services remains unchanged,implying that the responsibilities are more routine work oriented. Another is the lack ofknowledge about effective social service provision, inadequate training, and a lack ofcapacity.
From analysis of the TAO budget allocation, there are two basic approaches to increasethe TAOs’ fiscal resources: the revenue approach and the expenditure approach. Therevenue-based approach is to increase the TAO’s ability to raise revenue, whilethe expenditure-based approach is to allocate the budget from the government to the TAO.The revenue-based approach allows the TAO to be more self-reliant, yet the expenditure
Table 7.1 Factors for successful performance in administration andbudgeting following the TAPE framework
- TAO needs to report results of their operationsto people regularly (including financialstatements disclosure and budgetary review.)
- The understanding of people about the rolesand duties of TAO.
- TAO needs to educate people regarding theirrights that means people have to equally shareresponsibilities with TAO in public serviceprovision.
- People have rights to monitor and audit TAO’soperations (check and balance.)
- People participation in community decisionmaking process which integrate with TAO.
- Mutual interest of people which leads to groupformation such as occupation group, elderlygroup, and etc.
- The strength of civil society which is rooted incommunity’s traditional culture or way of life.
- Some common activities which people jointogether are the means for strengthening thecivil society.
- The chief executive’s knowledge andunderstanding about social developmentconcept, including having a long-term vision.
- The coordination between the chief executiveof TAO and other units.
- The permanent secretary plays significant rolein supporting and working with chief executiveof TAO in delivering public services to people inthe community.
Transparency (T)
Accountability (A)
Participation (P)
Efficiency and Effectiveness (E)
Source: The author.

chapter 7
DECENTRALIZATION AND THE BUDGET FOR SOCIAL SERVICES AT TAMBON ADMINISTRATIVE LEVEL Factors for Successful Administrative and Budgetary System
chapter 7
approach allows the TAO to provide the transferred functions. So, the challenge is how tostrike a balance between budgetary support by the government and the medium-to-long-term goal of enhancing TAO’s fiscal autonomy.
In the next fiscal year (2008), the government intends to relax budgetary constraints,allowing the TAOs to do their duties more independently. Yet the method of budgetallocation needs revision since it creates a potential moral hazard. TAO officials areinclined to employ budget allocations for their own political benefit, since they lack awell-grounded understanding that the purpose of the budget allocation is to provide socialservices. Improving the method of budget allocation and strengthening the government’srole as a trainer is needed immediately to improve the TAOs’ ability to deliver socialservices.
There are still quantitative and qualitative gaps in the TAOs’ delivery of social services,especially in the transfer of education and public health care functions. Judging by the sizesof the budget for upper-layer governmental units, central and regional government unitsplay vital role in providing both educational and health care services. This practice has botha positive and a negative side. The positive side is that it helps complete the imperfect roleof the LGU. For instance, TAOs still have a limited budget and ability to organize andmanage educational services. Practically speaking, it is inevitable that the government playa role in allocating the budget for and supplying certain social services.
The transfer of educational functions to TAOs is still controversial. Unlike PAOs andMunicipalities, TAOs have experienced a slow transfer of educational functions, becausethey still do not meet the standards of education required for transfer. Therefore, the firsttask is to prepare TAOs for the transfer of educational functions and insure that they will beable to properly manage education after the transfer. To accomplish the task, TAOs willneed assistance with budgeting school activities and making improvement in human-capital. At the same time, any misunderstandings about the transfer between thetransferor (school) and receiver (TAOs) should be clearly resolved. In particular, allobjectives, procedures, and anticipated outcomes should be clearly discussed andidentified.
At this stage of development, TAOs are still incapable of taking full responsibility for publichealth service functions, due to a lack of knowledge concerning public health servicemanagement. The transfer of this function will require human-capital improvement in TAOs.TAOs must find their own budgetary support besides budgetary support from thegovernment. Since the capacity of TAOs is still limited, it is unavoidable that thegovernment must at first be a trainer and later a partner in providing health care services.
Since the government might play a role similar to the TAO in some cases, the public mightcompare the efficiency of the TAO with that of other government units. Thus to meetexpectations, the TAO must always be alert and seek opportunities to provide socialservices. Ultimately, the local people benefit regardless of who delivers the services.
However, if social services are provided by both upper-layer government units and the TAO,it needs to be clear who will take the lead role and who will take a supporting role.Otherwise, the services provided may overlap unnecessarily. In a nutshell, efficient socialservice provision requires integration between upper-layer government units and the TAO.
Clearly, the integration of duties at the local TAO level must proceed more quickly. As ourstudy has shown, TAOs receive budget allocations through many avenues, including otherLGUs, such as the allocation from PAOs to TAOs. However, the purpose of integrationmust be clear. It is not to centralize the budget or expenditure decisions necessarily, but toallow “coordination and cooperation” among the relevant service providers throughout theentire process.
In addition, the TAO must make effective use of financial resources. To accomplish this,public participation in decision-making is required. The case studies show that the model ofTAO administration varies widely, and in particular, it varies with regard to the degree ofpublic participation. Although these models have different advantages and disadvantages,the most appropriate model depends on the economic, social, and cultural characteristicsof the area. Yet the case studies vividly show the model of TAO administration thatpromotes public participation leads to higher levels of satisfaction that do models thatgovern mainly by administrative power. Therefore, the key to the effective use of resourcesis public participation, both quantitative and qualitative, in TAO decision-making.
- 18 - 19

CHAPTER8CONCLUSION AND POLICY
RECOMMENDATIONS
© U
NIC
EF
Tha
iland
/200
9/M
Tho
mas

chapter 8
DECENTRALIZATION AND THE BUDGET FOR SOCIAL SERVICES AT TAMBON ADMINISTRATIVE LEVEL Conclusion and Policy Recommendations
chapter 8
Decentralization was conceived as an attempt to improve the delivery of social services. It isone of the major challenges facing the Thai government on both the national and local level.Thailand undertook decentralization as one of several public sector administrative reforms.The aims of decentralization are to improve the efficiency and effectiveness of publicservices and to distribute the benefits of national economic development more equally.Following the model of decentralization in many developing countries, decentralizationin Thailand has proceeded gradually since the promulgation of the Constitution of 1997.Subsequently, implementation began with the Decentralization Plan and Procedure Act of1999. Unlike previous attempts to implement decentralization, the current process beganby devolving budget resources from government agencies to LGUs. The central governmenthas also transferred responsibility for some functions to LGUs according to thedecentralization plan. The principles determining the functions to be transferred were basedon decentralization in other developing countries and on the particular characteristics ofthe domestic bureaucratic system. Since LGUs must control and manage their own resources,it is important to understand the administrative and fiscal structure of decentralization onboth the national and local level.
The decentralization program determined the functions to be transferred from centralgovernment agencies to LGUs, basically those that are the most closely related to the localquality of life. According to the Decentralization Act, the central government has to transfer245 functions in six broad categories: 1) investment in and maintenance of infrastructure;2) maintenance of peace and order of the local community; 3) maintenance of the quality oflife and social welfare; 4) maintenance of natural resources and the environment;5) promotion of local investment and tourism; and 6) promotion of local wisdom, localtradition, and culture.
The actual transfer of functions to LGUs during the last 5 years has shown a certain degreeof success. 177 of the 245 functions have been transferred to LGUs. Among the intendedtransfer functions, social services and welfare-related functions are the most important forLGUs. 103 of the 245 functions are categorized as social services and social welfare. Thedecentralization program was implemented with little understanding of its implications forpublic administrative reform. In earlier stages of the program functions were devolvedwithout much resistance from central government agencies. The transfer of many functionsproceeded without much assistance from government agencies to the recipient LGUs. SomeLGUs did not even realize what functions had been transferred to their responsibility. As aresult, many functions were left idle or under-utilized by the LGUs.
The critical effect of decentralization program, however, has been the redistribution ofbudget allocation from government agencies to LGUs. Such redistribution is a requiredaspect of fiscal decentralization. In theory, the transfer of revenue will improve LGUs’capacity to carry out the assigned functions, reduce central authority, and empower localdecision-making. The effect of the public sector reform process is most obvious in thebudgetary reform. Thailand has put great deal of effort into reforming the budget inconcordance with reforming the bureaucratic structure. The net result of the reform is aflexible system of budget flow from the annual budget appropriation to local areas, servingexpenditure at the local rather than the departmental level.
The Thai budgetary system has recently adopted performance-based budgeting system (PBS).The previous administration introduced a new budget allocation system that uses threedimensions, an agenda basis, a functional basis, and an area basis. Agenda-basedbudgeting focuses on serving government policies, for instance poverty alleviation program,economic development stimulation. Functional-based budgeting focuses on thedepartmental level, which is responsible for providing public services across the country.Finally, area-based budgeting was introduced by the previous government, although underexisting law, the budgeting process may not allocate budget directly on the area basis. Thegovernment found a loophole by using its authority over central funds to distribute moneyfor many special purposes under government policy. Many special programs receivefunding through this window, for example, the provincial governor program, also known asthe “CEO Governor” program, and the “SML program” for village development.
An additional channel of funding to local areas comes from the departmental level.Government agencies can support national programs at the local and community level,such as education and health care. Normally, the annual budget is allocated exclusively toeach department without any integration of planning and spending. Under the existingbudget allocation system each department from the various ministries has the authority todecide where the money would be spent.
Besides structural reform on the policy level, the decentralization program has alsomandated government to distribute a portion of the net annual budget to support theprogram. Implementation of fiscal decentralization in Thailand has progressed over thelast 5 years, focusing on devolving government resources to local government units (LGUs)as required by law. Though the result is satisfactory since the budget for TAOs hasincreased enormously over the last 5 fiscal years. In fiscal year 2000 roughly one billionbaht of revenue was allocated for all LGUs in Thailand. By fiscal year 2007, the amount hadincreased more than three-fold to over 350 billion baht, equivalent to 25.2 percent ofcentral government net revenue.1 Yet, the amount of revenue transferred to LGUs still lagsfar behind the target of 35 percent. Fiscal decentralization is not an end in itself, but ameans to achieve equality in public services across the country. If the program properlydesigned, it would improve quantity and quality of public services.
The basic guideline for the transfer of budget is that it should accompany the devolution offunctions, but the actual transfer of budget has lagged behind the devolution of functions.The failure to reach the intended target for budget allocation has impeded TAOs fromperforming their functions completely. In particular, the TAOs have limited revenue tosupport social service functions such as education and public health. The government lineagencies assume that these functions have already been transferred to the LGUs, includingthe TAOs. But in fact, the transfer process is not yet complete so the LGUs have not receivedthe budget to support these functions. Thus, the local line agencies leave these services tothe TAOs, while the TAOs cannot fully support the functions. This results in low quality andinefficient social service provision.
The present conditions of public administration restructuring and budget reform hascreated more channels, and more flexibility, for funds to flow to TAO level. As a result, TAOshave more alternatives to finance their functional responsibilities. The government hastransferred a number of social welfare functions to TAOs across the country. One of our
- 2 - 3
1 Annual Report of NDC 2006

chapter 8
DECENTRALIZATION AND THE BUDGET FOR SOCIAL SERVICES AT TAMBON ADMINISTRATIVE LEVEL Conclusion and Policy Recommendations
chapter 8
objectives is to characterize the structure of budget allocation for TAOs and their role inproviding social services.
8.1 SUMMARY OF FINDINGS
The scope of this study covers both TAOs’ budget allocation and structural changes in thecentral government’s budget allocation formula, and the actual budget allocation within theTAOs’ boundaries from all public organizations. Our method was a primary field survey ofsampled TAOs, using both qualitative and quantitative methods, and secondarydocumentary research into budget allocation. The findings of the study can be summarizedas follows:
1. The restructuring of public bureaucratic system and budgetary reform at the nationallevel has created as many channels of budget flow into the TAOs’ boundary as everwitnessed before. Meanwhile, the central government has redirected funds from othersources to promote government policies. For instance, central funds under thesupervision of the cabinet have been used to support the “CEO Governor” and the SMLprogram. The study shows that budget allocation for TAOs has increased enormouslyduring the last three fiscal years.
2. Funding for special programs by the central government has increased substantially.For example, the special purpose grants for social services in Suthep TAO increase from1.7 million in fiscal year 2004 to over 3.5 million in fiscal year 2006, an increase ofmore than 100 percent over 3 years. The rapid increase of social service expenditure isrelated to the fact that many TAO executives have distorted the purpose of specialpurpose grants to increase their popularity among local voters.
A clear example is the misuse of pensions for the elderly. The Social WelfareDepartment of the Ministry of the Interior introduced pensions to support only thoseelderly who are too poor to support themselves and have no family member to take careof them. Decentralization transferred the program to the supervision of the LGUs. Sincethen, many TAOs’ executives have revised the database to include the entire elderlypopulation within the TAO area and have requested larger grants from the centralgovernment. Our field survey revealed that this program has been used as a politicaltool by giving pensions to everyone, even if they do not meet the critieria for eligibility.Since pensions are a special purpose grant, they are not required to be registered in theTAOs’ budget. This is to ensure a quick disbursement of the grant. However, local peoplehave misunderstood that the TAO executive is providing the pensions.
Distribution of this pension fund from central grant allocation underminesdecentralization process, in that local administrators do not need to learn about theneeds of the population and provide service accordingly. In theory, decentralization wouldbring the local population and the TAOs’ administrators closer together and encouragepublic participation in TAO decision-making. Yet in practice, the actual distribution ofthe pension fund creates moral hazard.
3. Unregistered children are a group who will not receive an adequate social serviceprovision. Normally, when these children are not registered in any households, they will
not receive any of the social services such as education and health care. This group isa particularly vulnerable group which the government needs to take care of. If no onepays attention to this group, they will become social problems in the future, becauseThailand will have a larger population of them, concentrated especially along theborders. Fortunately, some TAOs (such as Kao Jod), realize that the unregisteredchildren are a social problem, these TAOs try to provide the basic social service to thisgroup the best as they can.
4. The existing revenue transfer formula does not balance fiscal needs both horizontallyand vertically. Because of limited data, the formula for revenue allocation is based ona few socio-economic parameters. The primary factors are population and land area,which are used as proxies to represent the variation in expenditure requirements acrossthe LGUs. The formula is acceptable at certain level because the large LGUs tend torequire more revenue to support their larger expenditures. Yet some TAOs areconsiderably poorer, and need special assistance to improve living conditions. Thecurrent revenue formula does not provide enough funds for such TAOs.
5. A major weakness of TAOs is their inability to raise revenue. As shown by the fiscalreport of sampled TAOs, TAOs’ own revenue sources on average account only 5.6percent of total revenue during 2004-2006 fiscal years. This indicates that the sampledTAOs must rely heavily on central government transferred revenue. However, the flowof intergovernmental funding to TAOs is sometimes delayed due to fiscal stresses on thecentral government level. Such delays result in a lack of liquidity in TAO financialmanagement. When liquidity drops, the only other source of cash is a reserve fund,which is supposed to be the savings or precautionary fund for the TAO.
Recently, TAOs have increasingly relied on withdrawals from the reserve fund tofinance their expenditures. The financial management regulations of DLA do notrequire that withdrawals from the reserve fund be registered in the budget, only in theaccounting records. This practice causes inconsistency between the budgeting andaccounting of the TAOs, which makes it extremely difficult to monitor and evaluatefiscal performance of the TAOs and other types of LGUs.
6. Inadequate data prevent in-depth analysis of the TAOs’ financial conditions. In thesampled TAOs, there are inconsistencies in accounting and discrepancies in the finedetails of the financial reports. Some of the TAOs report details of actual expenditurethat cover both revenue from on-budget and off-budget while some only showexpenditure from budget appropriation items.
7. Even though structural changes in the national budget appropriation process andbureaucratic system were expected to improve coordination and integration ofgovernment budget, actual implementation reveals that there is no well-definedmechanism that can integrate or plan for better coordination of expenditure of allpublic agencies from all levels of public administration in TAOs’ area. In addition, manygovernment social services programs were transfered to the TAOs’ jurisdiction withoutproper consultation or training to insure their capacity to handle the new tasks. Manylocal people have become dissatisfied with the TAOs’ performance in public servicedelivery and there has been confusion about the objectives of decentralization. SomeTAOs have been unable to maintain the quality of service since they do not know how todeliver the services as well as the line agencies did. Child health care service is a vivid
- 4 - 5

chapter 8
DECENTRALIZATION AND THE BUDGET FOR SOCIAL SERVICES AT TAMBON ADMINISTRATIVE LEVEL Conclusion and Policy Recommendations
chapter 8
example of a service has had complaints about lower quality since decentralization.Aou Luk Tai TAO of Krabi province and Laem Son TAO of Satun province experiencedthis fact.
Meanwhile, line agencies must follow the policy programs of the central government,such as land reform, poverty alleviation, anti-narcotics, and household accounting. Theline agencies sometimes push these policy programs onto local people who do notunderstand the real meaning or benefit of the programs. TAOs left out of the programs,such as Kok Petch TAO of Sri Sa Ket, must continue handling the programs on theirown, which becomes a financial burden on them.
8. The Decentralization Act mandates that decentralization be completed within a giventime-frame. During the initial stages of decentralization, the primary concern of the lawwas to determine which functions to transfer and how to transfer funds to LGUs withoutnecessarily giving any guidance or standards to follow. Although the law calls for aperformance-based standard to evaluate TAOs, the benefit of having a standard forpublic services is not understood by all stakeholders. Rather, the focus has been how todevolve resources and functions to LGUs. Thus at present there is no single public agencyor system to monitor and evaluate the quality of public services. As a result, it is difficultto compare the performance of of TAOs.
9. The LGUs lack the human resources to perform their duties. For instance, they needspecialists for education, health care, social welfare provision, etc. Moreover, thecurrent officers are not trained in social services, so the provision is neither efficientnor effective.
10. The field survey data reveals that local people have a better understanding of the TAOs’role in public service provision than previously thought. Everyone in the survey agreedthat the role of the TAO is important for daily living, and over 80 percent were satisfiedwith performance of their TAO in infrastructure investment. However, the level ofparticipation in the TAOs’ development planning is still limited because many peoplebelieve that TAOs are a public entity representing the government. The data indicatesthat the people in Tha Sala TAO in Loei province participate the most actively in localdevelopment planning and proposing projects that they deem necessary into TAOdevelopment plan, while people in Suthep TAO, a more urbanized area, show relativelyless interest in participation.
11. Surprisingly, the level of community development and public satisfaction does notdepend solely on the TAO’s expenditures. Some TAOs which spend less on social serviceper capita have higher levels of public satisfaction with their performance–for instance,Tha Sala TAO in Loei. This result suggests that the satisfaction of local people towardquality of social services depends on other factors besides overall expenditure, such asthe how well the functions have been managed or the level of public participation in thedecision-making. For instance, in Tha Sala TAO and Ban Pra TAO the executive allowsthe people to submit requests for projects and activities that need TAO support. Thepeople from these two TAOs have relatively high levels of satisfaction even though theTAOs have relatively limited investment funds.
12. The field survey also investigated the degree of public participation in providing socialservices, in particular, the volunteer system. The Ministry of Public Health instituted the
public health volunteer system to monitor and support health care at the village level.Interviews with many volunteers showed that many government agencies request themto perform extra tasks without proper training, such as animal monitoring and control,basic needs data collection, etc. Many feel less willing to remain on as a publichealth volunteer. Some complain about hardships from daily living, which can beoverwhelming and takes up most of their time for volunteering. There are no incentives,either in kind or in cash, to persuade them to continue serving as village public healthvolunteer. The ineffectiveness of the health volunteer system can be attributed to thecriteria that determine the number of health volunteers, which is based on the numberof households but not the number of people per household. This is why healthvolunteers in some TAOs face a greater burden than in others.
8.2 POLICY RECOMMENDATIONS
Considering the findings of the study, we make several policy recommendations. Werecommend measures to improve the provision of social services by TAOs and to alleviatesome of the other problems we found. The recommendations involve both fiscaldecentralization and public participation. The details of the recommendation follow.
FISCAL DECENTRALIZATION
1. The existing fiscal decentralization procedure simply shifts the burden of infrastructureinvestment to TAOs. Consider the small budget for social services functions that resultsfrom the limited fiscal resources of the TAOs. There should be scheme to share thecost of investing in infrastructure between central government and TAOs. Most TAOsare too small to cover the cost from their budget resources alone. TAOs will have todivert funds away from social services, unless the central government shares the costof capital investment, or at least gives TAOs access to capital markets to finance theirinfrastructure investments.
2. The revenue allocation formula needs to be revised to provide more balance from TAOto TAO. The current revenue formula is based on a limited set of factors, which do notnecessarily identify inequalities among the TAOs. The two most common factors in therevenue transfer formula are population and population density. These factors are notable to differentiate TAOs on basis of their income levels and living conditions.
3. The TAOs’ accounting and budgeting systems urgently need to be upgraded. Withoutadequate accounting and budgeting data, it is very difficult to assess the real financialconditions of TAOs and evaluate their performance. Rules and regulations for thefinancial management of LGUs have been in place for 30 years, but only in fewer than1300 units. There have been some amendments to them over time; nonetheless, theyare not necessarily suitable to all LGUs because of their diversity in financial and fiscalconditions. A common problem in the budgeting and accounting systems of all LGUs isthe presence of expenditures that are required to appear in the accounting report butnot in the budget report. For instance, the use of reserve funds and general grants withspecific purposes are reported only as spending, and not as part of the budget. Theaccounting system of TAOs and other LGUs should use an accrual accounting system.This system would register all expenditures and cover every revenue source. Reports
- 6 - 7

chapter 8
DECENTRALIZATION AND THE BUDGET FOR SOCIAL SERVICES AT TAMBON ADMINISTRATIVE LEVEL Conclusion and Policy Recommendations
chapter 8
based on the accrual accounting system could show the real fiscal conditions ofthe TAOs.
The budget system of TAOs and other LGUs should use performance-based budgeting.Performance-based budgeting would help LGUs and TAOs plan their development andset targets for their operations. Fundamentally, performance-based budgeting requiresa strategic development plan integrated with the annual expenditure budget.
4. If the financial management of LGUs is not revised, the government must issue newrules and regulations on how TAOs can use their reserve and other off-budget funds.The DLA in the Ministry of the Interior, which regulates LGUs, must revise the rules andregulations on how reserve funds can be used. If the current practice of using reservefunds as regular revenue is allowed to continue, it would undermine the fiscal disciplineof TAOs.
5. The TAOs must reduce their dependence on intergovernmental revenue transfer fromthe central government. As the above analysis showed, the existing revenue structure ofTAOs and LGUs in general is limited. Self-levied revenue in the sampled TAOs was onlyabout 9 percent of their total revenue. There has not been any significant reform ofLGUs’ revenue structure over the last 60 years since the establishment of LGUs inThailand. There have been many fruitless attempts to increase revenue for LGUs duringthe last 20 years. The most crucial revenue source is property tax. The centralgovernment should put greater emphasis on the property tax, issuing new laws ifnecessary, and replace other existing taxes (building and land tax, and landdevelopment tax law). Another important source of tax revenue for the TAOs and therest of LGUs is the environmental tax. This tax would control pollution within the LGUs’boundary and generate revenue for environmental protection and rehabilitation. Inaddition, some people suggest from the international experience with decentralizationthat income tax collected by the central government (either personal or corporate)be shared to reflect cost of living within LGUs’ jurisdiction. The last source of revenuefor LGUs’ that needs to be mentioned is user-charges and fees from the services ofTAOs, revealing the actual cost and benefit of the TAOs’ public services.
LOCAL MANAGEMENT AND PUBLIC PARTICIPATION
1. The database at the TAO level needs to be more reliable and accurate. Without accurateand reliable data, it is difficult to plan development. The database needs to include thesocio-economic and geographic data of the LGUs. The field survey showed that manyTAO staff-members have never had proper training in data collection and that theexecutives of the TAOs do not use even basic social and economic data in planning andbudgeting. The chief executives we interviewed did not know how to use the data. As aresult, they are reluctant to collect the data that could improve administration andservice delivery.
2. Provincial officers, PAO staff, and TAO staff should be equal partners in delivering socialservice within the province. Since there are various sources of funding for socialservices within the TAOs’ boundaries, all agencies should have similar developmentobjectives and co-ordinate their spending with one another. One possibility is toestablish an independent organization, free from the interference of local politics,
chaired by the provincial governor and mainly composed of local representatives. Thisorganization would decide how to coordinate budget management for the area.
In addition, the government should allocate a portion of the annual expenditure budget,based on the area of the province, to the provincial governor, similar to previous CEO’sbudget. This budget allocation would be specifically for provincial development projects,filling any gaps in the regular budget allocation concentrated on the department level.This portion of the budget would provide the provincial governor the opportunity toaddress economic development or social services overlooked by central agencies andLGUs. The governor and the local authorities should coordinate their budget to spendmore efficiently.
3. Many functions of TAOs can be integrated, covering a wider group and becoming moreeffective and efficient. Some functions can be provided by a single center; for instance,elderly care and child care can be integrated to minimize costs and mutually benefitboth groups. This method has been adopted by many sampled TAOs, for example,Ban Pra TAO, and Kokloy TAO.
4. The public health volunteer system needs proper support. Health volunteers needencouragement from government agencies to boost their morale and improveperformance. Volunteers need proper training for the jobs they are given, and theyshould compensated by in-kind benefits. The criteria for the number of healthvolunteers should be revised to reflect the number of people living within the TAO’sboundary, not just the number of households.
5. TAOs’s human resources need to be improved in all aspects. In particular, TAOs lackqualified personnel in health care and education and are not ready to manage thetransferred functions. Unqualified personnel cause poor performance in social serviceprovision, as evidenced by the level of satisfaction in our survey.
6. The government should monitor and evaluate the performance of TAOs’. This wouldprovide a better understanding of how efficiently social services are being delivered.A monitoring and evaluation system could also be used in grant allocation to equalizelevels of development and reduce disparities in social service provision. Obviously, thiscould not be effectively done without well-organized database system.
7. The government should provide the TAOs with sufficient guidelines to perform allfunctions under their responsibility. At present, many TAOs simply concentrate on a fewfunctions, particularly infrastructure investment and pensions (to gain politicalpopularity). Agencies in charge of related functions should serve as partners assistingthe TAOs’ performance.
8. Provincial agencies and TAOs should plan a long-term social safety net in coordinationwith one another. In addition, the budgeting allocation system between the centralbudget and the TAOs’ must be synchronized. In particular, the budget should beallocated based on the area instead of the department. Shifting the budget allocationsystem from department-based to area-based would improve the efficiency andeffectiveness of budget utilization.
- 8 - 9

chapter 8
DECENTRALIZATION AND THE BUDGET FOR SOCIAL SERVICES AT TAMBON ADMINISTRATIVE LEVEL Conclusion and Policy Recommendations
chapter 8
9. One of the key issues in TAOs’ sustainable development is people and communityinvolvement in decision-making and planning. The lessons learned from the field surveyand in-depth interviews suggest that TAOs must follow the TAPE model in theiractivities and decision-making. Transparency has many characteristics. The key aspectis the full disclosure of information about the TAOs’ activities to the public. TAOs needto make regular reports to the public about their operations, (including financialdisclosure statements and budgetary review).
10. To promote accountability, TAOs should foster public understanding of the roles andduties of the TAO. Evidence from the field survey confirms the hypothesis that TAOs canbuild public trust by actively educating people about their rights. People have to equallyshare responsibilities with TAO in public service provision. Additionally, the TAO mustrespect the people’s right to monitor and audit the TAO’s operations. People must beable to exercise these rights without difficulty.
11. Community decision-making must incorporate public participation. Mutual interest canlead to group formation. For instance, occupational group, elderly group, etc., helpstrengthen the community.
12. Finally, to enhance efficiency of TAOs’ performance, the TAO chief executive mustunderstand social development concepts, including a vision of social safety net to servethe long-term needs of the population. In addition, the coordination between the chiefexecutive of TAO and permanent staffs also plays significant role in delivering publicservices to the community.
SELECTED ISSUES FOR FURTHER STUDIES
This study shows how the decentralization of social services has proceeded in Thailand.It emphasizes the influence of many factors on the success of decentralization at the localadministrative level. To fully understand the behavior of local administrative organizations,especially TAOs which have the closest relationship to the local population, requires furtherdetailed studies. Some of the issues that need further study:
1. This study bases its analysis on how central budget allocated to support the TAOs socialservices from an aggregate perspective. The results can provide only an overview of theTAOs’ administrative and budget allocation for social services. To fully understand theimpact of TAO decision-making on local people further study is needed in detail of eachparticular sector of the social service function. For example, a study could ask how tohave a successful program to deliver public health service to the local people apart fromthe given budget that TAOs received. This involves not only availability of the budget butalso how effectively the TAOs manage their resources. The study could give a guidelineand methodology for further transfer of the function to the TAOs.
2. Further decentralization procedure research is necessary to study how localadministrative organization has been implemented. The existing public services at locallevel are complicated and remain fragmented. There is no coordination among involvedagencies including the TAOs. Thus, further study about the hierarchy of functionsassigned to each level of administration must be as clear as possible, so that thefunctions can be assigned to the proper level. While LGUs are the primary social service
providers, the government line agencies should support the LGUs social serviceprovision.
3. The transfer of some social service provisions from the government to LGUs (such aseducational service provision) should be studied in more detail. The research shouldconcentrate on how to standardize the LGUs’ educational service provision.The standards for educational service provision should be classified in detail. Suchstandards might include the key performance indicators, the quality of educationalservice provision, teacher quality, LGU readiness, the demand by local people foreducational development, etc.
4. Study so far has focused only on budget and resource allocation to at the TAO level. Theactual impact on local beneficiaries, such as children, women and the handicapped,should be studied in more detail.
- 10 - 11

CHAPTERLIST OF REFERENCES
© U
NIC
EF
Tha
iland
/200
4/Y
Rat
aras
arn

list of references
DECENTRALIZATION AND THE BUDGET FOR SOCIAL SERVICES AT TAMBON ADMINISTRATIVE LEVEL List of References
list of references
LIST OF REFERENCES
IN ENGLISH
Akira Nakamura, “Local Government and Local Governance Amidst Declining Public Trustin Government: From a Japanese Perspective,” The paper delivered at the 20th
General Assembly, The Eastern Regional Organization for Public Administration,Hanoi, Vietnam, October 9 to 14, 2005, p. 10-11.
Atkinson, A.B. and J.E. Stiglitz (1980). Lectures on Public Economics. Maidenhead:McGraw-Hill.
Bird R M,Vaillancourt F, 1998 Fiscal Decentralization in Developing Countries (CambridgeUniversity Press, Cambridge).
Besley, Timothy (1988). “A Simple Model for Merit Goods Arguments”. Journal of PublicEconomics 35 (3): 371-83.
Colclough, Christopher (1996). “Education and the Market: Which Parts of the NeoliberalSolution are Correct”. World Development 24 (4): 589-610.
Douglas North 2001 “The process of economic change,” in Germano Mwabu, et.al. edsSocial Provisions in Low-Income Countries: New Patterns and Emerging Trends,Oxford University Press.
Lonnolly, Sara and Munro, Alistair (1999). Economics of Public Sector. Prentice Hall.
Mwabu, Germano, et. al. (2005) “Introduction : Context and Scope”. In Social Provision inLow-Income Countries: New Patterns and Emerging Trends, edited by GermanoMwabu et. al. Oxford: Oxford University Press.
Musgrave, Richard A. (1959). The Theory of Public Finance. New York: McGraw-Hill.
Portes, Alejandro (1997). Neoliberalism and the Sociology of Development: Emerging Trendsand Unanticipated Facts. Population and Developement Reveiew 23 (2): 229-59.
Reddy, Sanjay and Jan Vandemoortele (1996). “User Financing of Basic Social Services:A Review of Theoretical Arguments and Empirical Evidence”. EPP Working Paper.New York: UNICEF. Mimeo.
Sheila B. Kamerman and Alfred J. Kahn, Social services in the United States: Policies andPrograms, Philadelphia: Temple University Press, 1976, p. 3-17.
W.E.Baugl, Introduction to Social and Community Services, London:The MacmillanPress LTD, 1994, pp1-2.
IN THAI
Rapeepan Kumhom and the others, The Directions and Social Welfare System in Thailand,Human Resource Security and Development, 2005, p. 11.
Surapol Pathanawanich, Social Policies Towards a Welfare State,Bangkok, ChulalongkornUniversity Publisher, 2004, p. 3.
The national health security office and the local development institute (LDI), The handbookof health security system at the local level or area (the local health security fund),the national health security office, 2006, p.7.
WEBSITES
http://www.dloc.opm.go.th/dlocT/report/report.aspx?type=3 accessed on 27/10/2006
http://www.dsdw.go.th/statistic/t_definition.php accessed on 27 December 2006
http://www.nhso.go.th/NHSOFront/SelectViewFolderAction.do?folder_id=000000000002512accessed on 23 November 20069
http://www.msociety.go.th/home/modules.php?name=Content&pa=showpage&pid=86 ac-cessed on 24 November 2006
http://www.thaiembdc.org/politics/govtment/policy/56thpolicy/pol_56.pdf
- AR - AR

APPENDIX
© U
NIC
EF
Tha
iland
/200
4/Y
Rat
aras
arn

appendix
DECENTRALIZATION AND THE BUDGET FOR SOCIAL SERVICES AT TAMBON ADMINISTRATIVE LEVEL Appendix
appendix
APPENDIX A.
a. Political, Administrative, and Management Reform Policy
In order to resolve the political and administrative crises from the previous government,the recent government intends to undertake eight policies. The policies that relate to theLGUs are as follows.
1. Encourage private and civil sector organizations to play a complementary rolewith regard to the role of governmental organizations, in the development of thepotentials of civil society and the local communities. This will help to foster robustorganizations capable of protecting their own rights and interests, as well as thoseof Thai society as a whole;
2. Support continuous decentralization in line with the democratic process so as toenable the localities to be self-sufficient, and to be able to administer themselvesin accordance with the wishes of the people in the respective local communities.
b. Social Policy
The Government intends to build a strong society on the basis of virtue, where people live inpeace and harmony. In order to pursue that goal, it is adopting the following policies:
1. Promote compassion and understanding, unity and reconciliation among thecountry’s people so that they cooperate in the revitalization and rehabilitation ofthe nation on all fronts. In pursuing this goal, the Government shall draw lessonsfrom past conflicts, and the failures to prevent and resolve such conflicts, to fosterunderstanding among the people. The Government shall also create a process forthe resolution of problems, putting a premium on national harmony, whilepromoting the dissemination of examples of good cooperation that bringshappiness to all segments of the Thai community.
2. Formulate a social reform plan for shared happiness and national harmony on thebasis of virtue. The Government is to draw up this plan together with the people,business, civil society, academia, media and religious institutions so as to builda caring, virtuous and democratic society, one in which the local community and
3. Accelerate educational reform by emphasizing virtue-led learning so as to increaseeducational opportunities for all. The Government will aim to develop the qualityof education as well as educational standards at all levels. This will increaseawareness of the value of the philosophy of a “Sufficiency Economy,” harmony,peace and the democratic lifestyle. It will also develop human resources withvirtue as the basis of the learning process, to bring together the family, thecommunity and the religious and educational institutions. The management ofeducation will emphasize the decentralization of power to the localities and theeducational institutions, with the participation of the people and the privatesector. Thus, education will build quality individuals, disseminates knowledge tosociety and produces virtue, capability and efficiency.
The Interim Government Policies towards Decentralization*
4. Further the well-being of the people, encompassing physical, psychological, socialand intelligence aspects. The Government will, therefore, reform health policyto reduce behavioral risks, create a participatory environment, and develop abalanced health services system for both normal and emergency situations. Thiswill encompass the promotion of good health, disease prevention, hospitalizationservices and physical rehabilitation, while ensuring good quality, comprehensivecoverage and fairness. The Government will also propose a National Health Act.
5. Promote basic and popular sports so that all people have the opportunity toengage in sports and exercise for good health. The Government will cultivatea sporting spirit to foster national harmony. The Government will also encouragesporting excellence and professionalism in accordance with internationalstandards.
6. Strengthen local communities and civil society, enabling them to managethemselves in the areas of economics, society, culture, administration, naturalresources management and community rights. The Government will,therefore,promote the family, community, volunteer organizations, the business sector,religious and educational institutions to play leading roles in this respect. Examplesinclude preventing and resolving social problems, such as those related to narcoticdrugs, the care of children and youth, the disabled, the elderly and thedisadvantaged, supporting women’s rights and providing safety of life andproperty.
7. Encourage all segments of society to take part in developing a sustainablepeaceful society based on Thai culture. All types of media shall be used to createsuch a society, to ensure the continued existence of national arts and culturaldiversity of the local communities – all this so as to highlight the value and spirit ofThai-ness, to build a harmonious and caring society and nation.
8. Reform the judicial system through increased public participation. This willinclude reforming the system of investigation, interrogation, trial, used indetermining guild, and the system of detention and rehabilitation of wrongdoers.Throughout, the system will protect the rights and freedom of the people - all thisso as to create justice in society and enable people to have quick, convenient andefficient access to the judicial system. The Government will also create options inthe judicial system to foster harmony and promote the community’s role in disputemediation, prevention and the monitoring of crime, which will reduce the numberof cases and the losses from criminal and social conflicts.
9. Increase the effectiveness of agencies and personnel in the judicial process byintroducing a forensic science system that meets international standards andmodern technology to enhance the capabilities of agencies and personnel in thejudicial process.
* http://www.thaiembdc.org/politics/govtment/policy/56thpolicy/pol_56.pdf
- AA - AA

appendix
DECENTRALIZATION AND THE BUDGET FOR SOCIAL SERVICES AT TAMBON ADMINISTRATIVE LEVEL Appendix
appendix- BA - CA
The recent update for the government’s attempt to transform CEO Governors’ budget tosupport Live Well and Happily Strategy is described as follows.
In order to reach the effectiveness and efficiency of the government plans, every unit has tocooperate and works together. Each province is the center of the operation to make use ofthe resources in an appropriate way. The operation of each project will let people andcommunities in that area participate in the operation process. Every people in the areashould get the benefit from these government projects fairly and equally.
The committee for enhancing the live well and happily strategy under the sufficient economyideology has duties such as set up policies and monitor the operation of each line agency.This committee also replace the role of the committee for develop the ability of villages andcommunities. The live well and happily strategy receives the budget of 5,000 million bahtfrom the 2006 budget of developing the ability of villages and communities.
Five plans under the Live Well and Happily strategic plan are:• The sufficient economy plan• The development and creating opportunities for communities plan• The recreation of the community prosperity plan• The assistance for the elderly and people who have less opportunities plan• The basic service for people plan
The guideline of budget allocation for each province is as follows.• 60 percent of the budget is allocated equally to each province.• 10 percent of the budget is allocated according to the number of people in each
province.• 15 percent of the budget is allocated according to the number of households which
has income less than the basic needs standard.• 15 percent of the budget is allocated inversely to per capita income of people in
each province.
The guideline of the projects/plans which could receive the supporting budget is as follows.• The projects/plans which have the objectives in the same direction as the live well
and happily strategy in the provincial level according to the government policy.• The projects/plans which come out from local people/communities/organizations
participation process.• The projects/plans which have to be continued from 2006 budget but the
government line agencies did not prepare the budget for these continuing projects/plans. Or the new projects which created by the province under the live well andhappily strategy.
• The projects/plans which do not carry any debts to pay off in the following years.• The projects/plans which are ready to operate immediately.• The immediate projects/plans which can solve the provincial problems.
APPENDIX B.Description on Live Well and Happily Development Strategy
The existing social service budget which is passed through PAOs is shown as follows:
• Grant for provincial supplementary food (milk)• Grant for provincial luncheon• Grant for provincial children centers• Grant for elderly pension• Grant for Aids patient pension• Grant for handicapped pension• Grant for elderly assistance centers• Grant for environment conservation• Grant for provincial health care services• Grant for provincial children development centers (example child centers)• Grant for set up provincial pre-school learning centers, according to basic education• Curriculum in the schools under the LGUs• Grant for provincial student uniforms and clothes• Grant for provincial basic education operation expenditure per head (1)• Grant for provincial basic education operation expenditure per head (2)• Grant for drug addiction prevention campaign project• Grant for provincial school libraries (under Municipality) development project• Grant for provincial children activities support project• Grant for provincial teaching the urban homeless children project• Grant for provincial support for Municipality schools development (example schools)• Grant for provincial enhancing ethics, learning and conservation the local culture
and knowledge• Grant for provincial enhancing local/community children sport competition in the
LGUs• Grant for provincial enhancing the establishment of basic education learning
center in Municipality schoolso Grant for supplementary food (milk) for the schoolsunder Municipality
• Grant for supporting provincial sport field administration• Grant for luncheon project in the schools under Municipality• Grant for provincial promoting the education operation of LGUs project• Grant for provincial student sports and bands competition• The expenditure for transportation (sending students to the health care center at
Mueng district)• Medical material expenses
APPENDIX C.Details of Social Service Budget Passed through PAOs
Source: NDC


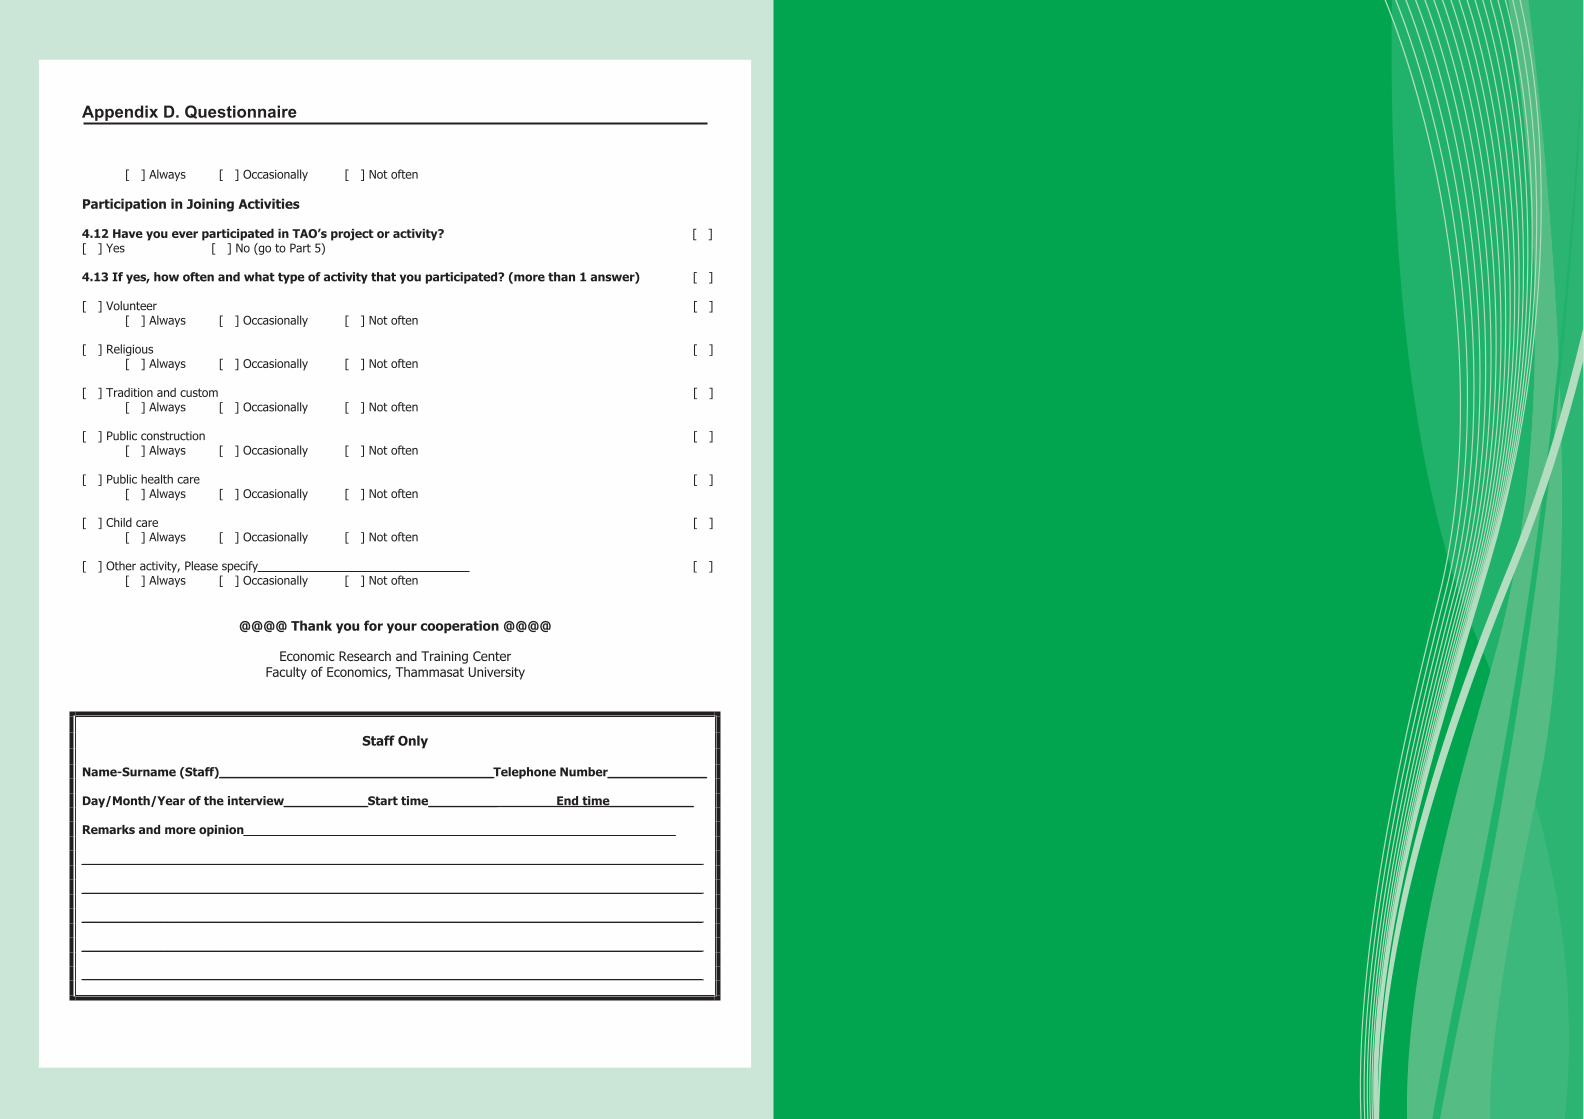

© U
NIC
EF
Tha
iland
/N R
odra
ksa

Principal authorResearch coordinator
Sakon Varanyuwatana, Ph.D
Associate ProfessorFaculty of Economics
Thammasat University

ISBN: 978-974-466-441-9