decentralization in africa - imf basis. as in other continents, the most important determinant of...
TRANSCRIPT
Decentralization in Africa
By Giorgio Brosio
October 2000
TABLE OF CONTENTS
I. Introduction ..................................................................................................................1 II. Current trends in decentralization in Africa: opportunities and risks .......................1 III. Previous centralized systems.......................................................................................2 IV. Decentralization and democracy: potential and risks ................................................3 V. Decentralization and poverty alleviation policies ......................................................4 VI. The risk of political capture at the local government level ......................................5 VII. The relative advantages of very small jurisdictions. .................................................6 VIII. Bureaucratic capture ....................................................................................................8 IX. Changing priorities with decentralization: a review of available evidence.............9 X. Coordination of donors’ activities.............................................................................11 XI. Structures of territorial systems of government and assignment of responsibilities ................................................................................12
A. Federal systems..............................................................................................13 B. Regional systems ...........................................................................................16 C. Two-layered systems .....................................................................................18 D. Number of subnational units and political costs.........................................19
XII. Tax revenues ...................................................................................................................20
A. Finding taxes for subnational governments .................................................20 B. Property taxes.................................................................................................22 C. Too many local tax instruments....................................................................23 D. Natural resources revenue for subnational governments. ...........................24
XIII. Transfers to subnational governments...........................................................................25
A. General/unconditional grants ........................................................................25 B. Specific purpose grants .................................................................................27
Conclusion...............................................................................................................................28 References ...............................................................................................................................30 Appendix tables Table A.1 Decentralization in selected African countries:
institutional and political reform. .............................................................33
Table A.2 Decentralization in selected African countries: fiscal institutions........................................................................................35
1
I. INTRODUCTION*
Is Africa a convenient unit of analysis for decentralization? Possibly not, considering that countries there are extremely diverse. They have, though, a broad common denominator: that is, poverty and fragile democratic institutions. Africa represents a huge challenge to the process of decentralization, which is worth analyzing and following closely. Since the process started recently and evidence is scanty, caution is needed in drawing conclusions. This paper deals with two broad sets of issues. The first discusses the realism of the rather ambitious goals that proponents of decentralization in Africa have assigned to it, in particular the eradication of poverty through specific interventions and growth promoting policies. It argues that in a context where institutional capacity is weak, democratic institutions are fragile and resources are scarce, caution is needed. This is because vested interests and the non-poor may easily capture policies targeted to the poor. The interests of the poor are well cared for, and on a durable basis, when decentralization renders more efficient the provision of basic local services and starts eliminating the huge disparities between the various areas of the same country. To reach these goals, a number of conditions have to be met concerning the working of political institutions and the structure of decentralized government. The second half of the paper focuses on these conditions, particularly on the model of territorial government that has been chosen, the assignment of responsibilities and the financing of the newly created units. Evidence is also presented and shows a number of weaknesses and of critical points, but also improvements, that are still limited to a small number of countries and of issues.
II. CURRENT TRENDS IN DECENTRALIZATION IN AFRICA: OPPORTUNITIES AND RISKS Decentralization is transforming the structure of governance in Africa. Since the middle of the l980s most African countries have started a transfer of power, resources and responsibilities to their subnational governments. The pace of transformation is very uneven across countries. A few countries - namely, Ethiopia, South Africa and Uganda - are proceeding fast. A number of countries have just started the process and are presently creating new units and/or transferring responsibilities and revenues to them. A large group has only adopted legal texts that engage the central government to proceed towards a more decentralized system. Finally, in a few countries decentralization is still at the stage of the announcement of the policy (see tables A1 ad A2 at the end of this paper for a summary of the decentralization processes).
In almost every country, the re-introduction of decentralized government and/or its strengthening is taking place along with popular elections for local councils, mostly on a multiparty basis. As in other continents, the most important determinant of decentralization in Africa is the introduction of, or the return to, democracy.
* This paper is derived from a another paper I prepared for the African Department of the IMF. I have benefited from useful comments on that paper by Ehtisham Ahmad, Anuphan Basu and the desk economists of the African Department. The usual disclaimers apply.
2
Proponents of decentralization – who include most donors - have sought to achieve a number of different aims. At one end of the spectrum, “citizen-regarding” governments (and donor organizations) consider decentralization as a practical way to :a) bring services to hitherto neglected peripheral areas; b) obtain a more equitable distribution of public services; and c) increase popular participation in policy choices. At the other end, “self-regarding” central governments consider decentralization mostly as a way of reducing the burden of unpopular structural adjustment programs on national politicians by offloading service responsibilities to subnational governments. To complete the picture, one also has to add the existence of a bandwagon effect. Decentralization is, nowadays, a popular process worldwide. National politicians may be tempted to experiment with it, hoping that its adoption will increase their popularity at home, although they have to cede some power. Africa shows an impressive institutional creativity. Two countries, Ethiopia and South Africa, have chosen a federal, or quasi-federal system. Nigeria, which used to be the only federal state in Africa, has adopted a new constitution that maintains the federal framework and gives more powers to its subnational governments. A number of countries on the east and the west of the continent have chosen a multi-layered system. More specifically, an intermediate layer has been inserted between the central and the local government. In other countries, decentralization means strengthening existing local government units in the urban areas and the creation of new units in the rural areas. This amounts to the revitalization of the two-tiered system that prevailed in these countries in the immediate aftermath of independence. In general, rural areas are receiving priority over the urban ones in the current decentralizing trends in Africa.
Differences in institutional solutions are a response to different political pressures, both internal and external. In general, where strong ethnic rivalries were felt, as in Ethiopia, a federal system has been considered an effective way of attenuating them and keeping the country together. In a number of countries, such as Mali, Madagascar and Senegal, regional government - that is, the introduction of an intermediate layer between the central and the local government - is a response to the demand for more autonomy from some areas of the country, as well as for a more equitable distribution of national resources.
III. Previous centralized systems
It becomes easier to understand the popularity of decentralization in Africa when we return to the point of departure: that is, the highly centralized model of territorial government prevailing in Africa before the late 80s and early 90s. More precisely, the system was based on several variants of hierarchical deconcentration, associated with an authoritarian/dictatorial political regime. This combination of administrative centralization with a non-democratic political framework brought in most cases an increasingly unaccountable and corrupt system. Maintenance of basic infrastructure and service provision were neglected in the rural areas and the very few resources devolved to local government were concentrated in the urban areas, in particular the capital city.

3
Table 1. Relative weight of local government budget in selected West African cities. 1992
Benin Burkina
Faso Cameroon Cote
d'Ivoire Senegal Share of GDP of central government 13 15 18 23 20 Share of GDP of local government 0.3 0.3 0.8 0.9 0.9 Local Government as a share of Central 2 2 5 4 5 Largest city (metro area)
Share on total local expenditure 73 66 68 65 71 Share on national population 11 8 8 22 22
Second largest city Share on total local expenditure 10 22 17 6 3 Share on national population 4 4 7 4 3
Source: Farvacque-Vitkovi, C, Godin (1997). In the few cases where representative democracy survived, only the big cities maintained some sort of autonomously elected government. On the fiscal side, subnational governments had to rely on their own sources of revenues. Table 1 refers to a select group of West African countries at the beginning of the 90s. It shows both the paucity of subnational resources, amounting to generally less than 5 percent of central government expenditure, and their concentration in the capital city and in other big cities. For example in Senegal, one of the very few countries that maintained democratic traditions, subnational expenditure amounted to no more than 5 percent of central government expenditure. Three quarters of it was spent on the two largest cities of the country – Dakar and Tiès – which accounted for 25 percent of the total population of Senegal. In other words, levels of service provision were, ceteris paribus, nine times higher in these cities than in the rest of the country. It is also worth mentioning that per capita subnational expenditure amounted in Senegal to approximately 10 dollars per year.
IV. DECENTRALIZATION AND DEMOCRACY: POTENTIAL AND RISKS The relationship between democracy and decentralized government is multifaceted and fragile in Africa. The return to democracy and commitment to it on behalf of governments are still partial in a number of countries. Electoral competition and basic political rights are still restricted and effective political change has still to come in many countries to allow their transformation into a workable decentralized system.
Secondly, while there is widespread evidence that decentralization fosters democracy, we also have to take into account the fact that, especially in poor, underdeveloped countries with

4
little or no tradition of democratic practice, decentralization may work against democracy. This happens, for example, when decentralized government is captured by corrupt non-accountable elites. Thirdly, using federalism or decentralization to alleviate ethnic rivalries and to satisfy demands for autonomy from the various areas of a country is not devoid of risk. This is because democratic elections at the regional level may catalyze the expression of divisive demands and exacerbate interregional and interethnic competition for central resources.1 Problems may become more acute in countries with huge but regionally concentrated reserves of natural resources. Decentralized government institutionalizes regional demands and makes them more vocal. At one extreme, it can foster secessionist trends and may, ultimately, tear countries apart. Finally, democracy may be endangered by wrong macroeconomic policies induced by the decentralization process as emphasized by Tanzi (1995) and by the creation of excessive expectations. Even with the most efficient decentralization process, the level of service provision will remain very low for a number of years. Most African countries with ambitious decentralization programs have very low levels of tax collection and large central government deficits.
V. DECENTRALIZATION AND POVERTY ALLEVIATION POLICIES
Most governments in Africa and some proponents of decentralization in developing countries share the view that local government may be a major vehicle for specific poverty alleviation policies, such as the distribution of basic food to the poorest segments of the population or the implementation of growth-inducing policies, through the mobilization of local resources and increased participation.2 Furthermore, the view is becoming increasingly popular, particularly among donors, whereby the responsibility for these policies should be assigned to very small local governments, or to informal communities to avoid the risk, which is substantial where democratic institutions are fragile, of capture by vested interests. The superiority of decentralized government over a centralized system derives, according to the supporters of this view, from superior information and increased participatory decision-making. Local information flows should make the identification of more effective ways of providing services easier and increase government awareness of local needs and better targeting, while higher participation rates in local politics should give more voice to the poor in policy choices. In addition, local monitoring should help to ensure that officials perform diligently.
1 We also have to consider that protection of minorities may be more difficult in a decentralized system, if they are dispersed in many areas. In other words, decentralized/federal systems protect minorities that are geographically concentrated. 2 See World Bank, 2000, particularly Chapter 6, for a presentation of some of those views
5
However, in purely analytical terms the greater effectiveness with regards to poverty alleviation policies of a decentralized and democratic delivery mechanism over a centralized, but equally democratic, government is not granted. This is mostly because the poor are at a disadvantage vis-à-vis the two elements that are crucial in this respect: namely, mobility and access to information and its use for their own purposes. As a consequence, local politics and policies may be captured by the non-poor.
Evidence, which is scanty for Africa, also suggests caution. While there are a number of cases in which we can observe both a decentralization process and more effective poverty alleviation policies, there is not necessarily a causality nexus between these two processes. In other words, the conditions of the poor may have improved simply as a result of the re-introduction of democracy and not as an effect of decentralization.3
VI. THE RISK OF POLITICAL CAPTURE AT THE LOCAL GOVERNMENT LEVEL
This problem should not to be confused with the more traditional one of the assignment among levels of government of the redistribution branch. The assignment theory deals with preferences and mobility. According to mainstream theory (Brown and Oates 1987), redistribution should be a central function because of mobility (rich self-interested people would move out of highly redistributing jurisdictions and poor people would move in). Pauly (1973) objected that it cannot be taken for granted that the rich object to redistribution, particularly in a local context in which they can see and enjoy the benefits of these policies. Political capture does not deal with preferences and mobility. It concerns the possibility of the poor to express their voice, that is, the differential risk of being captured by vested (rich) interests at the national or the local level. It may refer to any policy and not exclusively to redistribution. According to the Madisonian tradition (Federalist Papers n. 10), capture by vested interests ought to be greater at lower levels of government. At these levels, minorities and the poor in general would be less protected than in a centralized system. Moreover, at the central level there is more scope for political exchanges and for the composition of diverging interests (this a common tenet of American history with regard to the abolition of slavery and discriminatory policies). Recent literature (Bardhan 1997 and Bardhan and Mockerjee, 1998 and 2000) addresses the issue in more precise analytical terms, but the results show that the extent of relative capture is context-specific.
3 For example, with the return to democracy, rural areas should receive a greater share of public funds, simply because politicians need farmers’ votes. Bates (1988) shows that this is in fact the case in Africa, where agricultural policies based on subsidies on staple food and taxes on exports used to favor urban settlers to the expense of farmers.
6
Bardhan and Mockerjee analyze the differential impact on capture by extending a typical model of electoral competition. Responsibility for a given policy – such as an irrigation scheme or the distribution of staple food to the needy – may be assigned to the national or the local level. The national government (if it receives the assignment) is constrained to provide the same policy across all districts (this assumption is not granted in general, but it works in non-fully-fledged democratic contexts such as those of most developing countries). The country is divided into several districts. Voters are differentiated by income classes (rich, poor, middle etc.). Income status influences electoral behavior. More precisely, voters may be informed and hence determine their vote according to platforms offered by competing political parties, or else non-informed, in which case they are influenced by campaign spending. Information, or as the authors call it, political awareness, is thus a fundamental factor determining political capture. Awareness and capture are related – obviously in opposite ways – to poverty, illiteracy and inequality. Assuming a majoritarian system of national elections and identical districts in terms of the distribution of socio-economic status among their population, the amount of capture will depend on well-known and also context-specific factors. For example, if voters are better informed at the national level, capture will be lower. This will also be the case if the poor can be more easily organized at the national level. Capture may also depend on the number of competing political parties. For example, if all parties compete at the national level but are specialized at the local level – that is, they do not compete in all districts – then capture may be greater at the local level, because pressure groups may target their political contributions more easily. More interesting and realistic is the case in which districts vary in terms of inequality: that is, the poor are concentrated in some districts. In general, capture will be greater in high inequality districts because there the spending of campaign funds is more effective. The differential of capture between national and local elections remains, however, context-specific. It becomes, for example, crucial whether campaign funds have increasing or decreasing returns. When they have increasing returns, lobbies and parties will concentrate all the funds in high inequality districts and capture at national level will be equal to the highest level of capture across all local governments. Centralization will thus favor capture. If campaign spending has decreasing returns, parties will concentrate less funds in high inequality districts, capture will be lower in these districts with national than with local elections. The contrary holds for low-inequality districts.
VII. THE RELATIVE ADVANTAGES OF VERY SMALL JURISDICTIONS. One of Bardhan and Mockerjee main results of is that capture originates from inequality. Before dismissing the potential merits of a decentralized system, one has to consider how inequality in spatial contexts is related to the size of local jurisdictions. Evidence shows that the smaller the size of local jurisdictions, the more homogenous they tend to be, simply because people with similar backgrounds and interests tend to congregate together. The implication is that capture should be lower in small communities, or better in communities
7
that are tiny enough to become homogenous. There is in fact a large front of researchers and donor institutions who favor outright decentralization of powers to small jurisdictions and to more or less formal communities within them in order to alleviate poverty . There is some evidence (Wade, 1987; Bardhan, 1993; Baland and Platteau, 1995 and l999) of successful co-operation within local communities in the management of common property resources. This is because in small groups with similar needs, shared norms and patterns of reciprocity monitoring is facilitated and sanctions are easier to implement. Thus, conserving and maintaining common resources that are vital for the poor may be better achieved by devolution of power to these communities. There are also a number of cases showing that centralized bureaucracies have failed in important functions. Small autonomous communities show betters results than central bureaucracies in the maintenance of crucial infrastructure, such as irrigation schemes.4 However, the small size-homogeneity argument does not have immediate implications for the design of a decentralized system and we should control that enthusiasm for small communities does not run too fast. Most of the advantages refer to small informal communities and not to local governments: that is, not to formal institutions. Being small and informal, they encourage the participation by the poor (see, for example Biswanger and Deininger, 1997), and at the same time they do not arouse the interest of the non-poor, to whose benefit capture is engineered. Very small size, however, also has disadvantages in terms of lost opportunities. As shown by the theory of collective action of Olson (1971), size and inequality may promote collective efforts, in areas such as the provision of basic local infrastructure or the prevention of over-exploitation of natural resources, which may turn to the advantage of the poor. This is because the rich may be interested in contributing even more than proportionally to a collective effort precisely because they have a larger stake in it. Big cities provide quite an interesting example of the merits of large size. At the turn of the century, cities in industrialized countries witnessed an epoch of hefty investment in basic infrastructure, such as clean water abduction, sanitation and public transport, which clearly improved the lot of the poor (World Bank 1999a, pp. 142-43). Given the unavailability of private solutions, the upper classes had a huge stake in such projects and were eager to contribute to them by forming alliances with the poor. In other words, the urban technology of the time provided an opportunity to form a wide social partnership, because the wealthy could not escape the effects of uncared for urban living conditions. Possibly, the same favorable conditions are working less today,5 but it is still worth trying to form broad social alliances for the provision of local public goods that benefit everyone.
4 In a frequently quoted example, Wade (1997) shows the contrast between the inefficient mode of operation of Indian central bureaucracy in the maintenance of canal systems with the more successful example of Korea, where a maintenance task was delegated to farmland associations. 5 This is because technological progress provides the rich with wide opportunities to produce similar services, such as water filtering systems or transport by helicopter, on a individual basis without having to contribute to

8
Summing up, the advantages in terms of lesser capture of small and homogenous districts may be offset by smaller benefits from collective action..
VIII. BUREAUCRATIC CAPTURE Links between corruption and centralized or decentralized government are becoming a popular issue in the literature about corruption. There are, however, no clear results, partly because authors measure corruption in different ways. Take, for example, the amount of bribes taken on public contracts. Is differential corruption to be measured by the total amount of resources diverted in bribes, or by the number of contracts tainted by corruption, or by the incidence of the bribes on the value of contracts? Clearly the choice of the measure may lead to different conclusions about the different impact of a centralized or a decentralized system. For example, if we measure the extent of corruption by the number of tainted contracts, decentralization will fare worse because there are more persons dealing with money and contracts. Corruption may impact directly on the poor in many ways. It may impact on the sectorial allocation of public resources. For example, it can worsen income distribution by diverting resources from social sectors and infrastructure maintenance to defense/war expenditures. It can also impact geographically: that is, on inter-jurisdictional distribution by diverting resources from the needy to the non-needy areas. On a day to day basis, corruption can also take a heavy toll on the poor by denying or making more expensive access to basic services, such as health or primary education. As we can see, in all these cases we are confronted with exactly the same problems of political capture. Again, the key issue is to ascertain where - nationally or locally - the poor have better prospects to counter corrupt practices (in this case, corrupt bureaucrats). As in the case of political capture, the results are context-specific and difficult to generalize even in what appears to be the simplest of problems. Take the case of a service, such as the delivery of subsidized food by a centrally, or by a locally appointed bureaucracy. According to the standard theory of bureaucracy, a longer span of control in a centralized setting should produce more corruption: that is, higher costs of provision and imperfect targeting at this level, especially in less developed countries, where information is harder to obtain. While there are arguments for supporting the argument that channeling resources through a centralized bureaucracy (instead of a local government) may end up in a higher diversion of resources, because central bureaucrats are more difficult the collective effort. Baland and Platteau (1999, pp. 781-82) provide another example of the uncertainty about the results of collective action. The example is referred to communal control of grazing lands in India. When, before independence, these lands were of common ownership, big landlords took upon themselves the task of deciding and implementing conservation measures to preserve them. After independence, following a land reform that resulted in the privatization of a large part of grazing areas, collective maintenance of the common land was discontinued.
9
to control (Bardhan and Mockerjee 1998 pp. 7-9), we reach less conclusive results in terms of the cost-effectiveness of the two alternatives. More specifically, if targeting of the poor is less accurate at the local level because of political capture, the total cost of the operation compared to its results may turn out to be higher in a decentralized as opposed to a decentralized system.
IX. CHANGING PRIORITIES WITH DECENTRALIZATION: REVIEW OF AVAILABLE EVIDENCE Logically inherent to a decentralization process is a change of regional and sectorial priorities in the allocation of public resources. Evidence for Africa is very scanty and covers a very short period. The first issue is regional priorities. Previous centralized/authoritarian systems were generally characterized by a huge concentration of public resources in the capital city and the surrounding area, which is not usually the poorest one. 6 Decentralization is thus expected to redress this imbalance. Some evidence points out that geographical redistribution of resources is on the way. This happens, for example, in South Africa where educational expenditure (a provincial responsibility) is growing faster in the poorest and less endowed regions since the starting of decentralization (and of democratization) (Department of Finance of South Africa, Intergovernmental Fiscal Review, 1999).
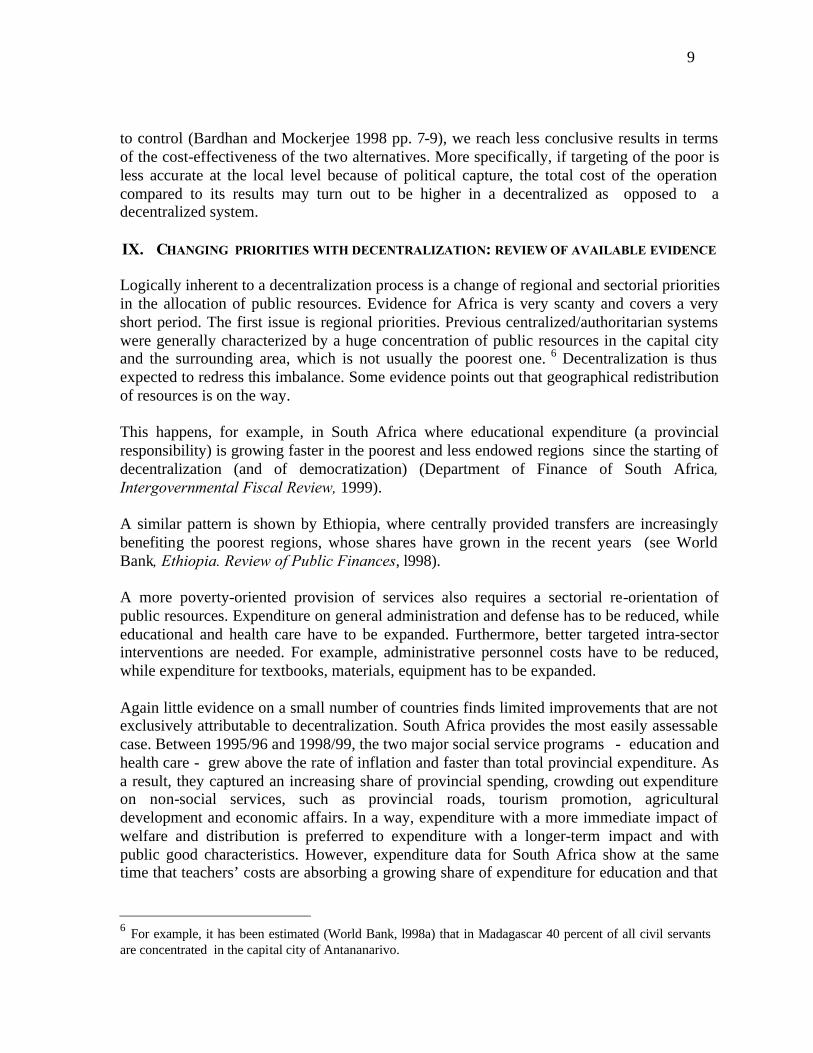
A similar pattern is shown by Ethiopia, where centrally provided transfers are increasingly benefiting the poorest regions, whose shares have grown in the recent years (see World Bank, Ethiopia. Review of Public Finances, l998). A more poverty-oriented provision of services also requires a sectorial re-orientation of public resources. Expenditure on general administration and defense has to be reduced, while educational and health care have to be expanded. Furthermore, better targeted intra-sector interventions are needed. For example, administrative personnel costs have to be reduced, while expenditure for textbooks, materials, equipment has to be expanded. Again little evidence on a small number of countries finds limited improvements that are not exclusively attributable to decentralization. South Africa provides the most easily assessable case. Between 1995/96 and 1998/99, the two major social service programs - education and health care - grew above the rate of inflation and faster than total provincial expenditure. As a result, they captured an increasing share of provincial spending, crowding out expenditure on non-social services, such as provincial roads, tourism promotion, agricultural development and economic affairs. In a way, expenditure with a more immediate impact of welfare and distribution is preferred to expenditure with a longer-term impact and with public good characteristics. However, expenditure data for South Africa show at the same time that teachers’ costs are absorbing a growing share of expenditure for education and that
6 For example, it has been estimated (World Bank, l998a) that in Madagascar 40 percent of all civil servants are concentrated in the capital city of Antananarivo.
10
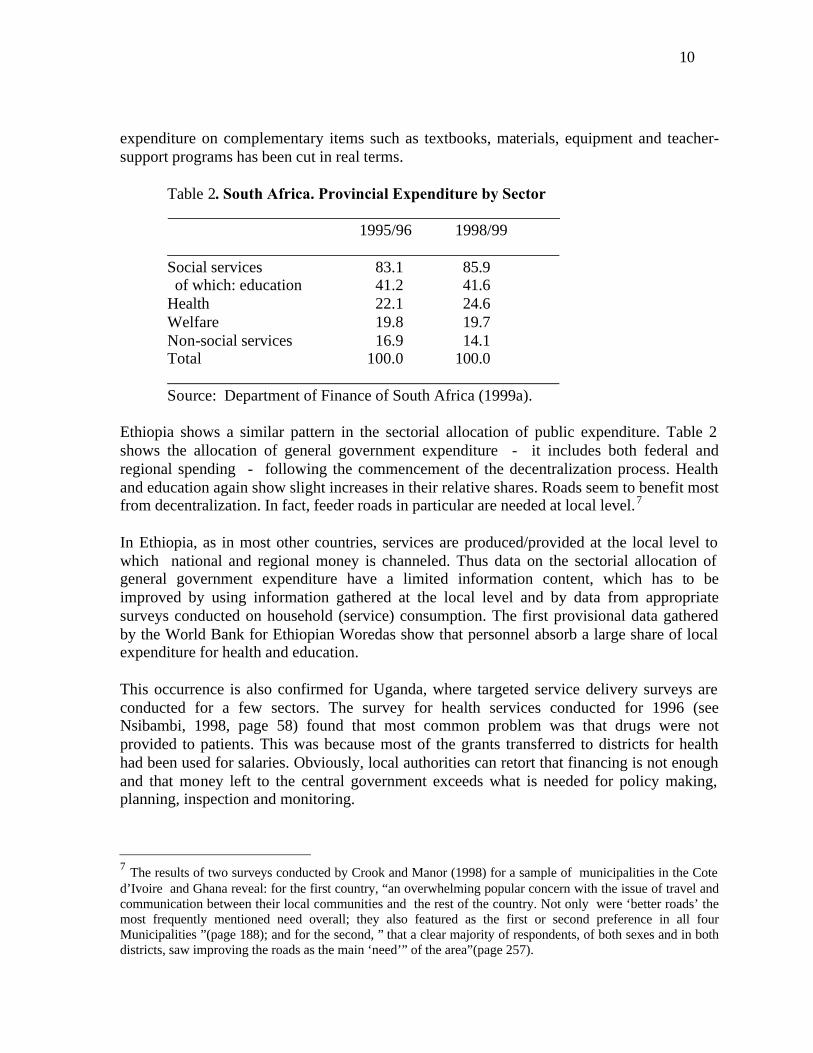
expenditure on complementary items such as textbooks, materials, equipment and teacher-support programs has been cut in real terms.
Table 2. South Africa. Provincial Expenditure by Sector _________________________________________________
1995/96 1998/99 _________________________________________________ Social services 83.1 85.9 of which: education 41.2 41.6 Health 22.1 24.6 Welfare 19.8 19.7 Non-social services 16.9 14.1 Total 100.0 100.0 _________________________________________________ Source: Department of Finance of South Africa (1999a).
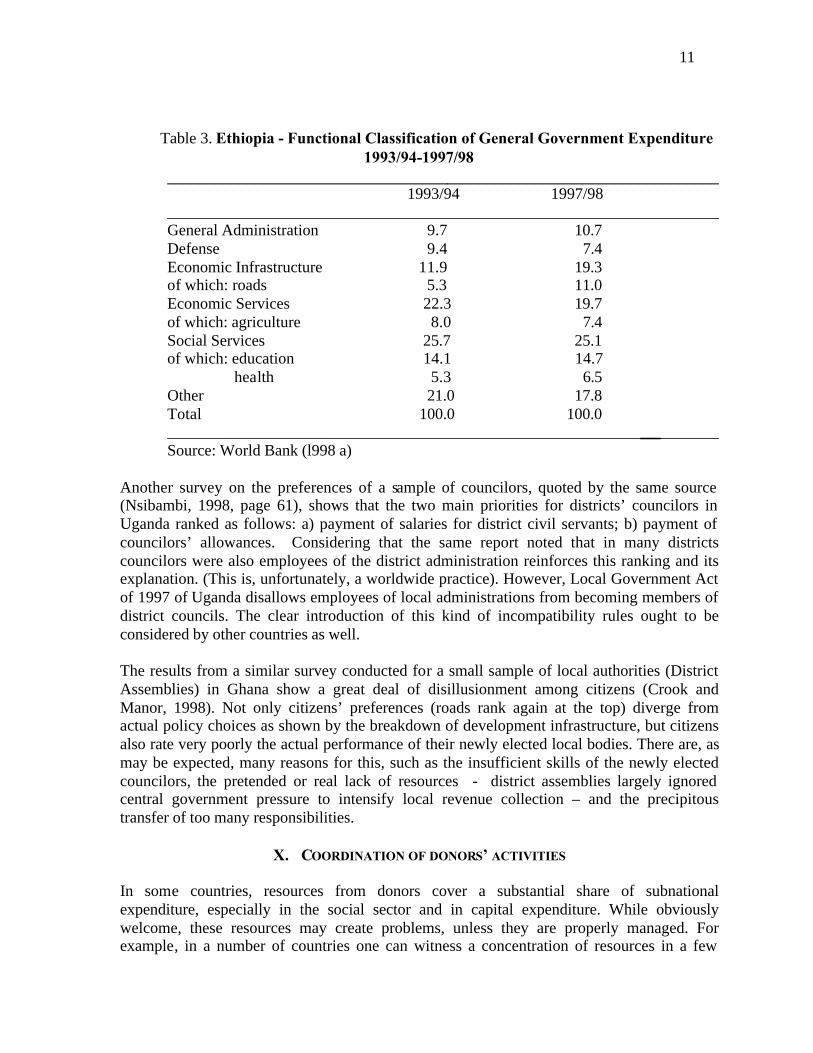
Ethiopia shows a similar pattern in the sectorial allocation of public expenditure. Table 2 shows the allocation of general government expenditure - it includes both federal and regional spending - following the commencement of the decentralization process. Health and education again show slight increases in their relative shares. Roads seem to benefit most from decentralization. In fact, feeder roads in particular are needed at local level.7
In Ethiopia, as in most other countries, services are produced/provided at the local level to which national and regional money is channeled. Thus data on the sectorial allocation of general government expenditure have a limited information content, which has to be improved by using information gathered at the local level and by data from appropriate surveys conducted on household (service) consumption. The first provisional data gathered by the World Bank for Ethiopian Woredas show that personnel absorb a large share of local expenditure for health and education.
This occurrence is also confirmed for Uganda, where targeted service delivery surveys are conducted for a few sectors. The survey for health services conducted for 1996 (see Nsibambi, 1998, page 58) found that most common problem was that drugs were not provided to patients. This was because most of the grants transferred to districts for health had been used for salaries. Obviously, local authorities can retort that financing is not enough and that money left to the central government exceeds what is needed for policy making, planning, inspection and monitoring.
7 The results of two surveys conducted by Crook and Manor (1998) for a sample of municipalities in the Cote d’Ivoire and Ghana reveal: for the first country, “an overwhelming popular concern with the issue of travel and communication between their local communities and the rest of the country. Not only were ‘better roads’ the most frequently mentioned need overall; they also featured as the first or second preference in all four Municipalities ”(page 188); and for the second, ” that a clear majority of respondents, of both sexes and in both districts, saw improving the roads as the main ‘need’” of the area”(page 257).
11
Table 3. Ethiopia - Functional Classification of General Government Expenditure 1993/94-1997/98
_____________________________________________________________________ 1993/94 1997/98 _____________________________________________________________________ General Administration 9.7 10.7 Defense 9.4 7.4 Economic Infrastructure 11.9 19.3 of which: roads 5.3 11.0 Economic Services 22.3 19.7 of which: agriculture 8.0 7.4 Social Services 25.7 25.1 of which: education 14.1 14.7 health 5.3 6.5 Other 21.0 17.8 Total 100.0 100.0 _____________________________________________________________________ Source: World Bank (l998 a)
Another survey on the preferences of a sample of councilors, quoted by the same source (Nsibambi, 1998, page 61), shows that the two main priorities for districts’ councilors in Uganda ranked as follows: a) payment of salaries for district civil servants; b) payment of councilors’ allowances. Considering that the same report noted that in many districts councilors were also employees of the district administration reinforces this ranking and its explanation. (This is, unfortunately, a worldwide practice). However, Local Government Act of 1997 of Uganda disallows employees of local administrations from becoming members of district councils. The clear introduction of this kind of incompatibility rules ought to be considered by other countries as well. The results from a similar survey conducted for a small sample of local authorities (District Assemblies) in Ghana show a great deal of disillusionment among citizens (Crook and Manor, 1998). Not only citizens’ preferences (roads rank again at the top) diverge from actual policy choices as shown by the breakdown of development infrastructure, but citizens also rate very poorly the actual performance of their newly elected local bodies. There are, as may be expected, many reasons for this, such as the insufficient skills of the newly elected councilors, the pretended or real lack of resources - district assemblies largely ignored central government pressure to intensify local revenue collection – and the precipitous transfer of too many responsibilities.
X. COORDINATION OF DONORS’ ACTIVITIES In some countries, resources from donors cover a substantial share of subnational expenditure, especially in the social sector and in capital expenditure. While obviously welcome, these resources may create problems, unless they are properly managed. For example, in a number of countries one can witness a concentration of resources in a few

12
selected areas that are not necessarily the neediest ones, but are more accessible and/or have governments that are easier to deal with. A second problem is the insufficient co-ordination between donors’ initiatives and central and subnational recipient government budgets. More specifically, donor interventions are frequently focused on the building of facilities and do not create mechanisms to manage the structure they build or rehabilitate. At the same time, subnational beneficiary governments do not have the recurrent revenue to run the facilities built with donors’ funds. Thirdly, donors’ priorities may not coincide with those of national and/or subnational governments. The same problems are frequently encountered in dealings with NGOs. Part of those problems derive from insufficient reporting of donors’ initiatives, part from direct links between donors and recipient subnational governments that short-circuit the central one. As decentralization proceeds, local governments start to claim that investment projects for local services should fall within the reach of their responsibility and thus demand the decentralization of the development budget, where donors’ funds are usually included. The easiest, albeit possibly partial, solution to most of these problems is to include donors' contributions, both in capital and recurrent expenditure terms, within the framework of each country’s general-purpose/unconditional transfers system. This could be done, for example, by deducting from the transfer allocated to each subnational government a share - that has to be determined according to appropriate criteria - of donors' contributions and, possibly, of the estimated value of services provided in the same jurisdiction by NGOs. The second option is to start to allocate a small transfer for investment purposes to those subnational governments that do not benefit much from the present distribution of donor funds. Whichever option is chosen, there is a need for subnational jurisdictions to record donors’ expenditure. Once this has been done and inequalities identified, the central government could seek to direct future donor activity into jurisdictions that have not benefited significantly in the past. Ultimately, it may be desirable to conduct a similar process with regard to NGO flows.
XI. STRUCTURES OF TERRITORIAL SYSTEMS OF GOVERNMENT AND ASSIGNMENT OF
RESPONSIBILITIES. Most of the potentialities and of the problems of a decentralized system derive from the specific territorial structure of government. For example, if too many layers of government are created, political and administrative costs will soar. This is a problem many African countries are likely to experience. Space constraints suggest limiting the analysis to only a few cases.
13
A. Federal systems
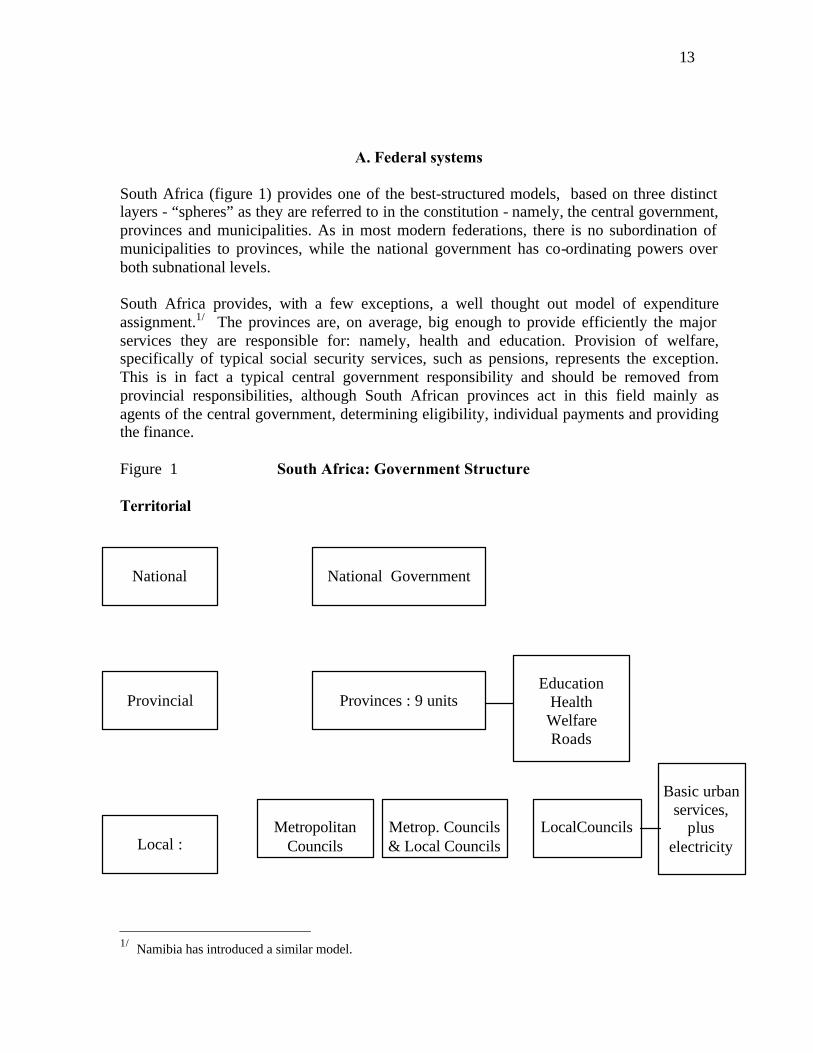
South Africa (figure 1) provides one of the best-structured models, based on three distinct layers - “spheres” as they are referred to in the constitution - namely, the central government, provinces and municipalities. As in most modern federations, there is no subordination of municipalities to provinces, while the national government has co-ordinating powers over both subnational levels. South Africa provides, with a few exceptions, a well thought out model of expenditure assignment.1/ The provinces are, on average, big enough to provide efficiently the major services they are responsible for: namely, health and education. Provision of welfare, specifically of typical social security services, such as pensions, represents the exception. This is in fact a typical central government responsibility and should be removed from provincial responsibilities, although South African provinces act in this field mainly as agents of the central government, determining eligibility, individual payments and providing the finance. Figure 1 South Africa: Government Structure Territorial _
1/ Namibia has introduced a similar model.
LocalCouncils
Metrop. Councils & Local Councils
Metropolitan
Councils
Provinces : 9 units
Local :
National Government
Provincial
National
Basic urban
services, plus
electricity
Education
Health Welfare Roads
14
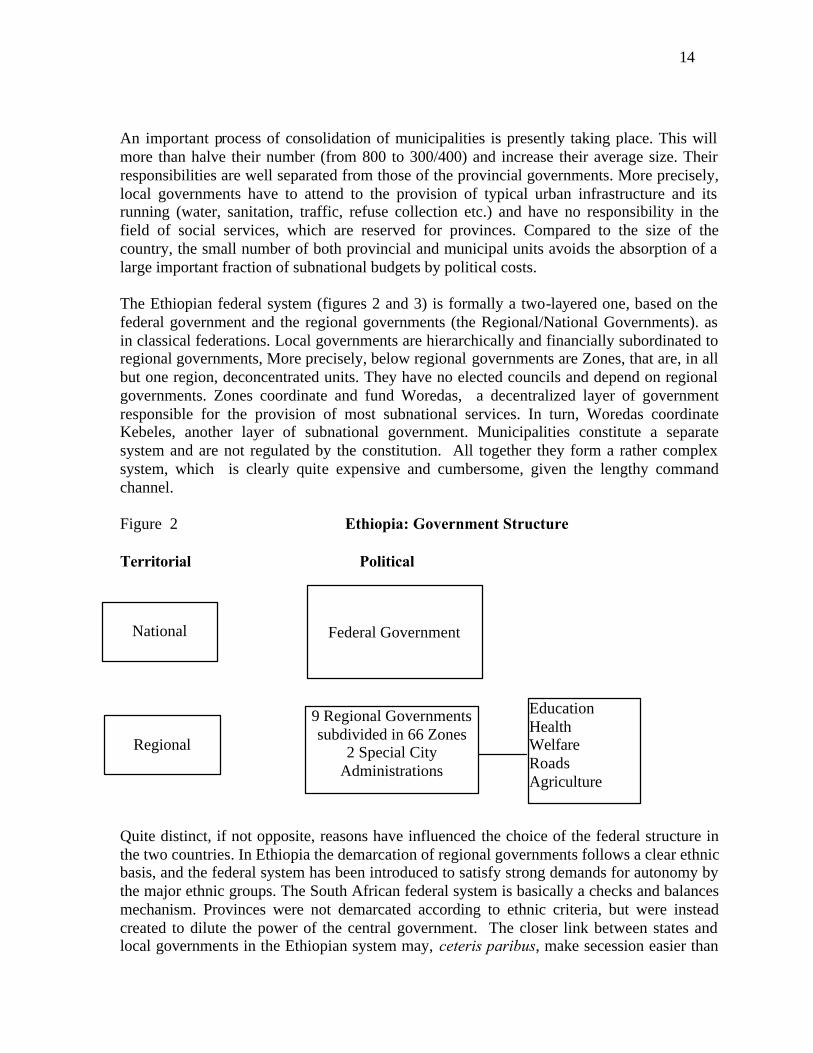
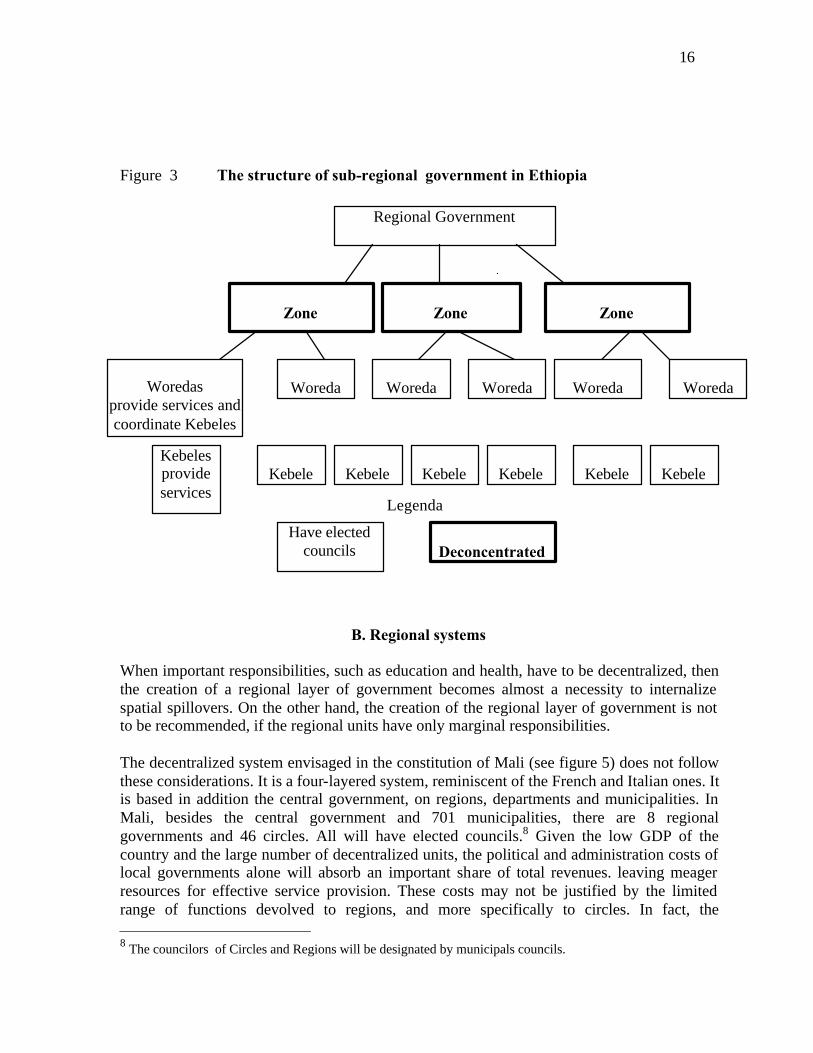
An important process of consolidation of municipalities is presently taking place. This will more than halve their number (from 800 to 300/400) and increase their average size. Their responsibilities are well separated from those of the provincial governments. More precisely, local governments have to attend to the provision of typical urban infrastructure and its running (water, sanitation, traffic, refuse collection etc.) and have no responsibility in the field of social services, which are reserved for provinces. Compared to the size of the country, the small number of both provincial and municipal units avoids the absorption of a large important fraction of subnational budgets by political costs. The Ethiopian federal system (figures 2 and 3) is formally a two-layered one, based on the federal government and the regional governments (the Regional/National Governments). as in classical federations. Local governments are hierarchically and financially subordinated to regional governments, More precisely, below regional governments are Zones, that are, in all but one region, deconcentrated units. They have no elected councils and depend on regional governments. Zones coordinate and fund Woredas, a decentralized layer of government responsible for the provision of most subnational services. In turn, Woredas coordinate Kebeles, another layer of subnational government. Municipalities constitute a separate system and are not regulated by the constitution. All together they form a rather complex system, which is clearly quite expensive and cumbersome, given the lengthy command channel. Figure 2 Ethiopia: Government Structure Territorial Political
Quite distinct, if not opposite, reasons have influenced the choice of the federal structure in the two countries. In Ethiopia the demarcation of regional governments follows a clear ethnic basis, and the federal system has been introduced to satisfy strong demands for autonomy by the major ethnic groups. The South African federal system is basically a checks and balances mechanism. Provinces were not demarcated according to ethnic criteria, but were instead created to dilute the power of the central government. The closer link between states and local governments in the Ethiopian system may, ceteris paribus, make secession easier than
Federal Government
Regional
National
Education Health Welfare Roads Agriculture
9 Regional Governments subdivided in 66 Zones
2 Special City Administrations

15
in the South African system, where separation between provinces and local governments gives less political weight to the former (and to their secessionist tendencies, if any). Local authorities may even oppose secessionist tendencies if preferences regarding this issue diverge.
16
Figure 3 The structure of sub-regional government in Ethiopia
Legenda
B. Regional systems When important responsibilities, such as education and health, have to be decentralized, then the creation of a regional layer of government becomes almost a necessity to internalize spatial spillovers. On the other hand, the creation of the regional layer of government is not to be recommended, if the regional units have only marginal responsibilities. The decentralized system envisaged in the constitution of Mali (see figure 5) does not follow these considerations. It is a four-layered system, reminiscent of the French and Italian ones. It is based in addition the central government, on regions, departments and municipalities. In Mali, besides the central government and 701 municipalities, there are 8 regional governments and 46 circles. All will have elected councils.8 Given the low GDP of the country and the large number of decentralized units, the political and administration costs of local governments alone will absorb an important share of total revenues. leaving meager resources for effective service provision. These costs may not be justified by the limited range of functions devolved to regions, and more specifically to circles. In fact, the 8 The councilors of Circles and Regions will be designated by municipals councils.
Deconcentrated
Have elected councils
Kebeles provide services
Woredas
provide services and coordinate Kebeles
Zone
Kebele
Kebele
Kebele
Kebele
Kebele
Kebele
Woreda
Woreda
Woreda
Woreda
Woreda
Zone
Regional Government
Zone

17
assignment of responsibilities for education and health in Mali follows the traditional continental European pattern, where only building and the maintenance of premises are assigned to subnational governments, while the effective provision of services is left to the central government. 9 Figure 5 Mali: Government Structure Territorial Political
Little devolution of responsibility is partly a compromise between two contrasting pressures. On the one hand, there are the demands for more autonomy from the northern regions of Mali. On the other hand, there is the central government’s fear of losing too much power and/or its worry about the lack of capacity in the newly created government units. The compromise is thus to devolve equal but few responsibilities nationwide. In this respect, one should, however, consider the merits of asymmetric devolution.1/
9 The European model refers specifically to education. Health services are organized in different ways in different European countries. 1/ Burkina Faso has adopted this solution. The number of municipalities has been increased from 10 to 108 after 1982, but 31 of these have “full powers”, the remaining 75 have still “limited powers”, that is less responsibilities.
Regional
National
Central Government
701 Communes
Typical urban services, plus
building & maintenance of primary schools and clinics
Building& maintenance of post-primary schools,provincial
hospitals and roads
Building & maintenance of secondary schools,
regional hospitals and roads, energy, tourism, handicraft, spatial
and economic planning
46 Circles
8 Regional Governments
+ District of Bamako
Local
18
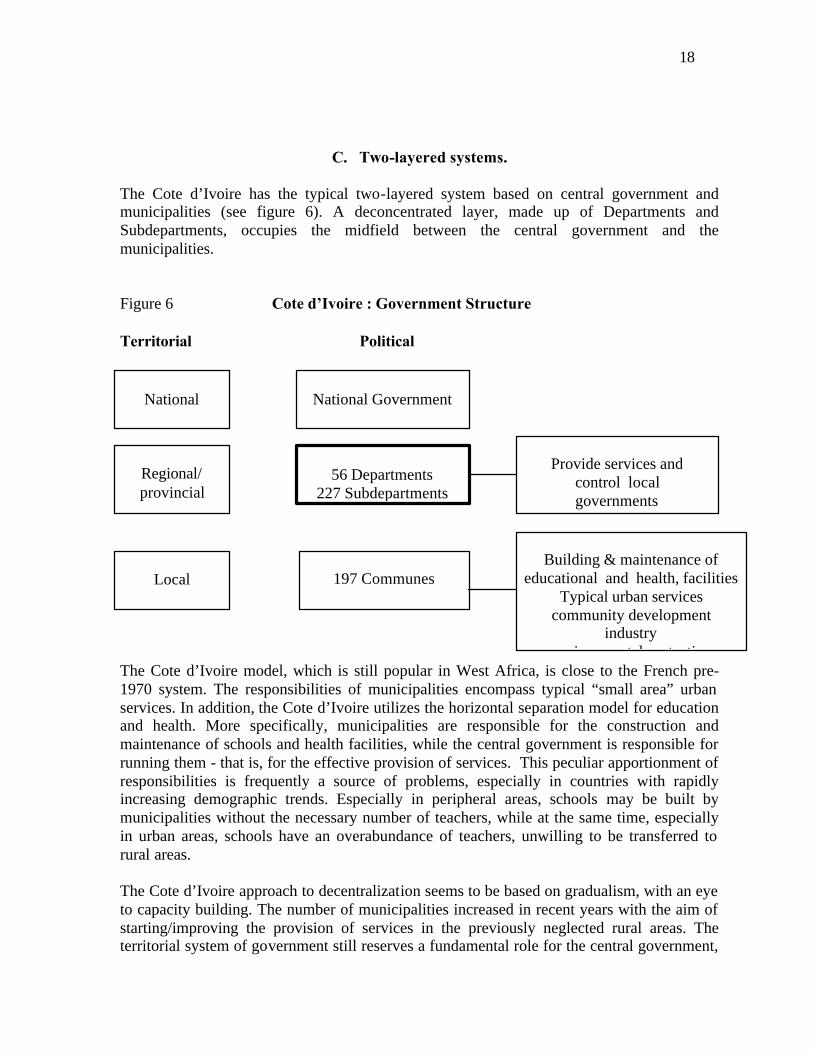
C. Two-layered systems.
The Cote d’Ivoire has the typical two-layered system based on central government and municipalities (see figure 6). A deconcentrated layer, made up of Departments and Subdepartments, occupies the midfield between the central government and the municipalities. Figure 6 Cote d’Ivoire : Government Structure Territorial Political
The Cote d’Ivoire model, which is still popular in West Africa, is close to the French pre-1970 system. The responsibilities of municipalities encompass typical “small area” urban services. In addition, the Cote d’Ivoire utilizes the horizontal separation model for education and health. More specifically, municipalities are responsible for the construction and maintenance of schools and health facilities, while the central government is responsible for running them - that is, for the effective provision of services. This peculiar apportionment of responsibilities is frequently a source of problems, especially in countries with rapidly increasing demographic trends. Especially in peripheral areas, schools may be built by municipalities without the necessary number of teachers, while at the same time, especially in urban areas, schools have an overabundance of teachers, unwilling to be transferred to rural areas. The Cote d’Ivoire approach to decentralization seems to be based on gradualism, with an eye to capacity building. The number of municipalities increased in recent years with the aim of starting/improving the provision of services in the previously neglected rural areas. The territorial system of government still reserves a fundamental role for the central government,
National Government
National
Building & maintenance of
educational and health, facilities Typical urban services
community development industry
environmental protection
197 Communes
Local
Provide services and
control local governments
56 Departments
227 Subdepartments
Regional/ provincial
19
in terms both of responsibilities and of the monitoring and control of local authorities. The number of deconcentrated units still exceeds that of decentralized units (283 against 197): an infrequent peculiarity in a decentralization process.
D. Number of subnational units and political costs
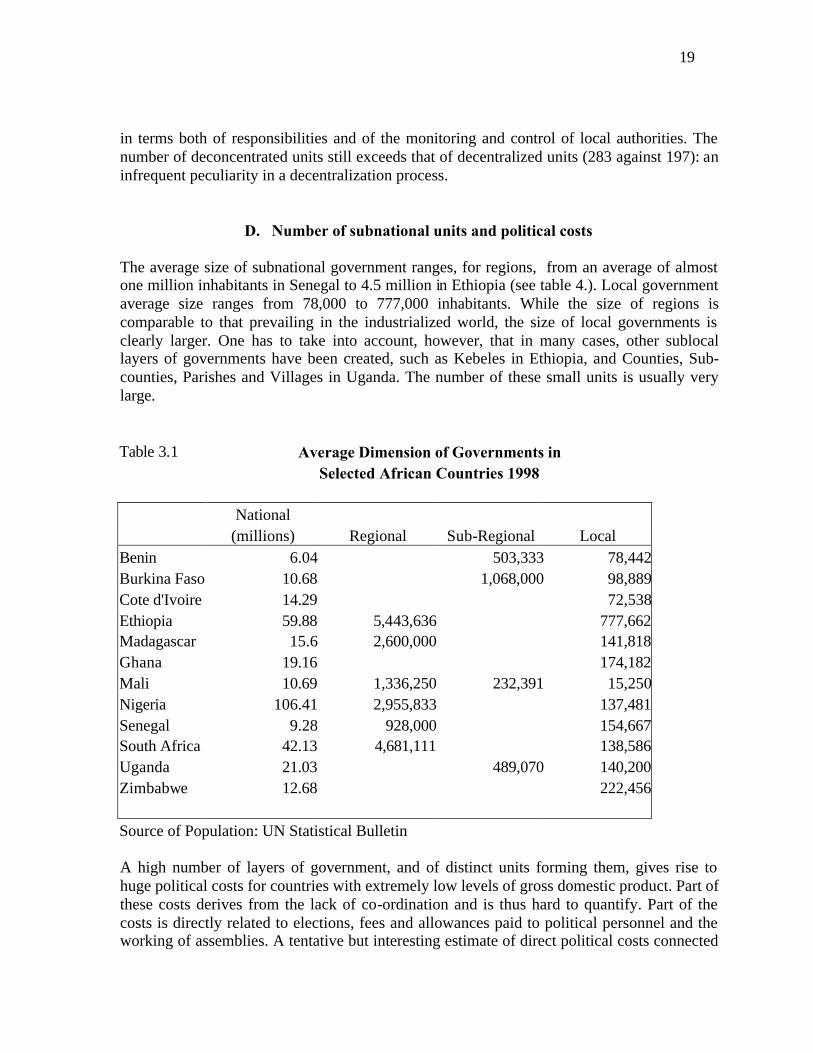
The average size of subnational government ranges, for regions, from an average of almost one million inhabitants in Senegal to 4.5 million in Ethiopia (see table 4.). Local government average size ranges from 78,000 to 777,000 inhabitants. While the size of regions is comparable to that prevailing in the industrialized world, the size of local governments is clearly larger. One has to take into account, however, that in many cases, other sublocal layers of governments have been created, such as Kebeles in Ethiopia, and Counties, Sub-counties, Parishes and Villages in Uganda. The number of these small units is usually very large.
Table 3.1 Average Dimension of Governments in Selected African Countries 1998 National (millions) Regional Sub-Regional Local Benin 6.04 503,333 78,442 Burkina Faso 10.68 1,068,000 98,889 Cote d'Ivoire 14.29 72,538 Ethiopia 59.88 5,443,636 777,662 Madagascar 15.6 2,600,000 141,818 Ghana 19.16 174,182 Mali 10.69 1,336,250 232,391 15,250 Nigeria 106.41 2,955,833 137,481 Senegal 9.28 928,000 154,667 South Africa 42.13 4,681,111 138,586 Uganda 21.03 489,070 140,200 Zimbabwe 12.68 222,456 Source of Population: UN Statistical Bulletin
A high number of layers of government, and of distinct units forming them, gives rise to huge political costs for countries with extremely low levels of gross domestic product. Part of these costs derives from the lack of co-ordination and is thus hard to quantify. Part of the costs is directly related to elections, fees and allowances paid to political personnel and the working of assemblies. A tentative but interesting estimate of direct political costs connected
20
to the intended decentralization process in Madagascar has bee made by the World Bank (1998a). This exercise shows that the creation of 6 regions and 111 local governments - quite a modest number given the size of the country in terms of area and population - would absorb between 9 and 19 percent of central government’s total present transfers to subnational governments. The creation of 28 regions and 111 local governments would increase these shares to 11 and 25 percent, respectively.
XII. TAX REVENUES
A. Finding taxes for subnational governments Most African countries have quite unproductive tax systems that rely heavily on taxes on foreign trade. Tax pressure - i.e. the share of taxes on GDP - is generally low. This is true also for countries that have embarked upon an ambitious decentralization process, such as Ethiopia, Madagascar, Mali and Uganda. Moreover, tax administration is rather weak in most African countries. The only tax sources for subnational governments meeting all the stringent requirements imposed by the theory of fiscal federalism are user charges and the property tax.10 However, property taxes are costly to administer well, especially in a developing country context. Moreover, the tax is widely resisted by taxpayers, given the frequently poor quality and crowded conditions of housing and the frequent lack of basic publicly provided services, such as water, sanitation and electricity. To avoid unpopularity, local governments frequently concentrate taxation on non-residential properties, thus inducing tax exporting. However, international evidence shows that, when well administrated and complemented with the revenue from user charges and fees, the property tax can finance at best - that is, only in the richest areas - the provision of local services; that is, of the services usually provided by municipalities and other “small area” jurisdictions. This is the case, for example, of rich urban areas in South Africa, where local governments are responsible for the provision of typical urban services to the exclusion of social expenditure, that is education, health care and social assistance. When major social expenditure is decentralized - meaning, as we have seen in Africa, the creation of a new, wide area layer of government - property taxes and user charges become totally insufficient. They have to be complemented with other tax revenues. Good candidates indicated by the theory are, with reference to developing countries, vehicle-related taxes, payroll taxes and personal income taxes and, to a lesser extent, retail sales taxes.
10 More specifically, only the component taxing residential properties meets all requirements. This is because the property tax on industrial and commercial activities may be easily exported to other jurisdictions.
21
Present tax assignments are largely unsatisfactory. Ethiopia, South Africa and Uganda provide three distinct but rather unsatisfactory examples of the financing of wide area governments. Ethiopia is characterized by a huge vertical fiscal imbalance. In the 1997/98 fiscal year, the federal government collected 82 percent of aggregate tax revenue and 83 percent of aggregate non-tax revenue (World Bank, 1999b). Regional governments’ own revenues are almost negligible and include fees from usufructuary use of land and for the use of forest resources. They are supplemented by centrally provided transfers and (revenue) shared taxes. Shared revenues, albeit widely used across the world, induce inefficient behavior. This is easy to understand. When shared revenues exceed expenditure needs, subnational beneficiary governments cannot reduce tax rates and have to spend the revenue for low priority sectors, thus possibly indulging in waste (as the experience of the Italian special statute regions clearly shows). When, on the other hand, revenue is lower than needs, governments do not have the power to increase the rates. The constitution of Ethiopia is silent about the assignment of important sources of revenues, such as sales taxes and automobile related taxes. The introduction of VAT is presently under consideration, as is its partial assignment to regions. Huge vertical imbalance also characterizes the South African provinces. In fact, despite the quite generous constitutional provisions in terms of revenue,2/ South African provinces have been denied access to own sources of revenue and have had to rely almost entirely on centrally provided grants. Fees for hospital services, motor vehicle licenses and gambling taxes represent the only own provincial revenues. They account for only 4 percent of total revenue. Own revenues have declined by about 20 percent over the most recent years, partly reflecting a health policy decision to provide free care. In part, this reduction also reflects reluctance by provinces to use their own revenue instruments when massive grants are provided by the center. A proposal to substantially increase the tax autonomy of provinces by allowing them to introduce a flat-rate surcharge on the personal income tax base was forwarded by the Financial and Fiscal Commission (an advisory body responsible for making recommendations to Parliament concerning all financing issues). The surcharge has, however, been rejected by the central government with the argument that the personal income tax base is still too small and very unequally distributed across provinces, and that administrative costs would be quite high despite the small number of taxpayers. More in 2/ The South African constitution stipulates, as a general principle, that: a) nationally raised revenue must be distributed equitably between national, provincial and local government following the recommendations of the Financial and Fiscal Commission, and b) the provincial share must be divided equitably between the nine provinces. Moreover, the constitution [Section 228(1)] allows provinces to impose taxes, levies and duties other than income tax, VAT, sales tax, rates on property and customs duties. Provinces may also levy a flat-rate surcharge on the tax bases of any tax, levy or duty imposed by national legislation, except for corporate income tax, VAT, rates on property and customs duties. Such taxes must be regulated in terms of national legislation.
22
general, the central government (Department of Finance of South Africa, l999b) has argued that this solution is not adequate for a developing country such as South Africa. The central government present orientation is to leave the range of taxes devolved to provincial governments as small as possible, and to make them rely mostly on transfers from the central purse. This reluctance to extend tax provincial powers is partly due to the macroeconomic strategy of South Africa, which includes maintaining tax revenue at 25 percent of GDP so as to promote investments both national and foreign. Uganda provides an interesting case of the difficulty of financing important subnational expenditure responsibilities in a non-federal setting. This country has devolved important expenditure responsibilities in the social sector to its subnational governments. Taxation assigned to them includes typical local taxes such as the property tax, market dues and business license fees, plus a potentially broad-based tax, the graduated tax, which is an unusual mix of poll tax, income tax and wealth tax. However, according to a sample of 29 Districts (out of the 39 existing that year), in FY 1995/96 local taxes and fees represented only 19 percent of total local government revenues, net of foreign donors’ contributions. Local tax rates and fees are determined freely by local governments, with the advice of the Local Government Finance Commission, an advisory body on all matters relating to subnational sources of revenue, including transfers.
B. Property taxes Administration of property taxes is largely deficient (see World Bank, 1996, and Farvacque-Vitkovi, Godin, 1997). The property tax base is inelastic, despite growth in the physical size or value of property, because old valuations are not updated and new properties not identified. The administration is costly and inefficient. In most cases, the system has been inherited from the colonial era and is poorly suited to present conditions. For example, cadastral systems work in areas with regular street patterns, named streets and numbered houses. In the absence of street addresses, tax bills are not deliverable, and penalties are unenforceable. Problems are compounded by the lack of skilled technical staff. Collection is often poor and many bills go unpaid, because taxpayers are not identified, or they resist payment because their housing conditions are too poor or urban basic services are not provided to their areas. Thus administration is the crucial problem of property taxation Expert opinion diverges on how to improve property taxation in developing countries (a good summary of the problems is provided by Dillinger, 1992). Some experts blame the excessive centralization of property tax policy, which disallows setting higher tax rates. Others blame what they consider the total anarchy deriving from local government freedom in this field. There is also dispute over tax administration. West African French-speaking countries rely on the traditional French model, in which the property tax is administered and collected by the central government, whereas East African countries rely on local administration. This is usually recommended in the literature that stresses that taxes should be administered by the government that is entitled to their revenue. Mixed results prevail in both cases in Africa. Local administration may produce acceptable results in large urban areas, but it is unlikely to

23
produce good results in the small, rural places. Here, possibly, central administration could be used and remunerated with a fee to induce adequate effort. It is extremely difficult to make general recommendations valid for a number of countries. Foreign donors have been involved in a number of cases, but with mixed results.11 Clearly, property tax has to be simplified to adapt it to the reality of developing countries. Ambitious cadastral projects were undertaken in the 1980s, but many of them failed or were abandoned halfway (as in Cameroon, Mali and Senegal). Perhaps the use of very simple parametric methods for the evaluation of property values is advisable. Parameters could include number of rooms, quality of the materials and area of the city are transparent and easy to apply. These methods have been used in a number of countries (included industrialized ones) with satisfactory results. Administration could be left local, but the legal framework should be centrally provided.
C. Too many local tax instruments A widely found characteristic of local government revenue systems in Africa is the huge number of revenue instruments that are used. This derives, in some countries, from the large autonomy local governments have in revenue matters. In most cases, the central government has assigned to itself all the broad based and buoyant taxes, leaving - as a way of compensation - local governments total freedom to set up their own taxes. The result has been a multiplication of small unproductive taxes that complicate local tax systems and make them completely non-transparent. Tanzania provides a good case. One Tanzanian local council studied by Fjeldstad and Semboja (1998) has more than 60 taxes and fees. This is due to the large tax autonomy of local authorities that may pass by-laws without prior approval by the ministry concerned. Basic economic criteria are frequently left out, as in the case of the Kibaha district, which has imposed a tax on the production of cashew nuts; that is, on an export crop. The costs of administrating a complicated tax structure are obviously high. In the Kibaha district, the administrative costs of tax collection in some wards are higher than the tax revenues remitted to the council. This is because, among other things, a badly conceived structure lowers voluntary compliance. Local tax fragmentation is only slightly lower in West African French-speaking countries, where tax policy and administration are traditionally much more centralized. For example, a recent law on decentralization in Benin lists 17 different taxes for local governments. Happily for the latter, the list includes all the major traditional local taxes (such as those on property and on business). A common pattern in this part of the African continent is to leave the administration of the more productive local taxes to the central government, while small “nuisance” taxes are left to local administration. An unfortunate result of this policy is that
11 “..donors and central governments are equally active in the field… The detailed evidence suggests that the interventions have had relatively limited impact on revenues” (Dillinger, 1992, p.33).
24
the central government – as in the case of the Cote d’Ivoire – has failed to resist the temptation to appropriate even a share of the property tax, leaving very little resources for local government use.
D. Natural resources revenue for subnational governments . In many developing countries, subnational governments are pressurizing their central governments to receive a greater share of natural resource revenues.12 Nigeria is the most relevant case on the African continent. According to some estimates, 8 per cent of the Federation Account goes to the oil-producing areas. Furthermore, the new constitution mandates “that the principle of derivation shall be constantly reflected in any approved formula, as being not less that 13 per cent of the revenue accruing to the Federation Account directly from any natural resources”. Although there is no common understanding of what the mandate really implies, it appears that the share of natural resource revenues going to subnational governments is destined to increase in the near future. The Nigerian model may possibly have followers in countries that are decentralizing their government structure and/or in those, such as Congo and Angola, that have endowments of natural resources, or favorable prospects of future discoveries. Taxes on natural resources are not an ideal candidate for subnational revenue, even under a tax sharing arrangement.13 However, political economy realities might dictate that some form of regional taxation, or tax sharing, on natural resources is inevitable, if there is distrust that the center will provide sufficient revenues for regional expenditures. If subnational governments provide significant amounts of services and infrastructure for the exploitation of the natural resources, an adequately small share of natural resource revenue could be returned to the regional governments under the benefit-tax principle as a compensation for the associated costs, and for environmental damage.14 Quite often regional demands for additional oil and gas revenue have to be interpreted as a request for greater revenue sources at the subnational level. For efficiency and equity reasons, this demand should be met by a comprehensive tax package and the redesign of the equalization transfer system.
12 A notable present day case is Indonesia. See Ehtisham Ahmad and Russell Krelove (2000). 13 The major problems are: (1) the resource rents are unevenly distributed geographically and impinge on equity; (2) the revenues are subject to the vagaries of the market; and (3) they are not a buoyant long-term source of revenue. The first-best solution would be to tax natural resources centrally, and ensure that the general allocation transfer system provides adequate financing for subnational government expenditure. 14 For example, a charge on oil and gas could be interpreted as a payment for services provided in the production of the resources. In this case, it is likely that the appropriate local share will be limited to a proportion of the rents (royalties) generated by the resource, and a combination of severance taxes and production excises to compensate for environmental damage caused by the oil/gas extraction.
25
XIII. TRANSFERS TO SUBNATIONAL GOVERNMENTS
Transfers are badly needed in Africa. Only a few large urban governments located in rich areas are able to finance a substantial share of their total expenditure with their own revenues. This share is almost insignificant for regional governments and approaches zero values in local governments situated in the rural and peripheral areas. Like most developing countries, African countries are characterized by huge fiscal disparities.
A. General/unconditional grants African countries use a variety of systems to determine the total amount to be distributed Ghana is using a potentially inefficient system, the Common Fund. The constitution of 1992 (article 252) provides for allocation of no less than 5 percent of total central government revenue to the Common Fund. This system is potentially inefficient because there is no necessary connection between this share and the cost of devolved expenditure. Nigeria has a similar, but much less transparent system for determining the total amount of unconditional transfers to states and local governments. Receipts from crude oil exports, domestic petroleum revenue, corporation income tax, custom duties, excises and fees accrue to the Federation Account . After deductions for some important expenditures of national interest, such as external debt servicing, national priority projects and Nigerian National Petroleum Corporation projects (as we can see, apart from debt servicing, the other items are highly discretionary and non-transparent), the proceeds are allocated in different proportions to states, to local government, to federal government and, finally, to Special Funds. In Uganda, general purpose transfers are determined annually with reference to the reassignment of tasks between the national and subnational governments. According to the Constitution (article 193, clause 2), the total amount is calculated according to a formula that includes the unconditional grant of the previous year, corrected by the increase in the general price level, plus the net change in the budgeted costs of running newly devolved or subtracted services. In other words, the formula takes into account the actual devolution of functions and its budgetary implications.
South Africa uses a complex bargaining process between distinct layers of government to determine the total amount of centrally provided unconditional transfers. A fundamental principle of the new constitution is that an equitable share of national resources has to be allocated to each layer of government. Interpretation of the principle has been widely debated, and a broad agreement has been reached recognizing that distribution has to be based on national standards and costing factors.
Ethiopia follows a complex, but not transparent determination system. It starts with estimates of total resources available from tax and nontax revenue and counterpart funds, but excludes direct foreign assistance to regions. After negotiations with the regions, the federal government allocates the total pool between itself and the regional governments.
26
With regard to distribution, African countries are shifting from totally discretionary methods1/ to formula-based systems of allocation. The main problems at present would appear to be: a) frequent changes in the formula for allocation without provisions for compensating those subnational governments whose allocation decreases in absolute terms as a result of the change; b) use of variables reflecting discretionary policy choices made by the recipient governments; c) little attention paid to equalization; d) little incentives to increase own revenue. Ethiopia is a good example of frequent changes in the formula. From the inception of the system in 1992-93 to 1994-95, the transfers were determined by the federal government according to its own discretionary criteria. Since 1995/96, a formula has been introduced, that however has been changed every year. Uganda provides an illustration of the second problem. The main component of the transfer system of Uganda is a grant for payment of salaries of teachers and health personnel. (Until the 1996/97 fiscal year, also administrative staff salaries were paid with this transfer). This salary grant is presently benefiting those local governments which, before decentralization, were privileged in the allocation of facilities and staff, and/or those which have increased most rapidly their payrolls in the initial stage of decentralization, particularly in the field of education. Secondly, a grant based on salaries discourages careful scrutiny of expenditure, as clearly shown by Uganda’s experience. In fact, with the implementation of the Universal Primary Education Program, districts were induced to hire a substantial number of new teachers, seemingly on the basis of a tacit agreement that the central government would cover their cost. No precise guidelines concerning appropriate staffing based on standardized pupils/teachers ratios were given and huge arrears were accumulated for teachers’ salaries. However the Uganda’s transfer system is gradually improving since salary transfers are supplemented by an unconditional transfer are allocated according to a formula that, for districts, includes three elements: (a) a lump sum grant (US$ 70 million per district); (b) population, with a relative weight of 85 percent; and (c) area, with a weight of 15 percent. In very few countries, unconditional transfers are addressing the problem of the reduction of disparities in poverty levels among areas. On the contrary, in some cases as in Uganda, they too perpetuate them, since the transfer for salaries, which is dominant, is distributed to fund existing levels of service provision.15
1/ A typical discretionary system is that used for the allocation of FECAL (Fonds d’Equipement des collectivités locales in Senegal). Its annual amount and allocation per municipality are decided by the ministry in charge of decentralization on the basis of unclear criteria after a multiplicity of procedural steps where a number of bodies make their evaluations of the requests presented by each distinct municipality. The complexity of the mechanism does not avoid political interference and is time consuming. When all steps are completed funds may be no more available. 15 However, the introduction of an explicit equalization grant – prescribed by the Constitution – is presently under consideration. The Local Government Finance Commission has recently proposed the introduction of this
27
The South African system deserves further attention, since it has made an important improvement in terms of transparency and efficiency in the allocation of unconditional transfers to provinces and municipalities. Starting with the former, transfers were provided until 1998 by the central government on an absolutely discretionary way; that is, according to Ministry of Finance estimates of the needs of each distinct province. Each province was thus then at the mercy of the central government.
Since fiscal year 1998/99 a formula-based system of allocation has been introduced.16/ This system, is in fact a collection of seven separate transfers, some of which - like those for education and health - are in fact conditional: the recipient governments have the obligation to spend these grants entirely in the targeted sectors. Most of the transfers are based on very simple indicators of needs, such as population, age structure and population eligible for social security grants. A share of 3 percent of the total is allocated according to backlogs in the provision of infrastructure, while the last component of the system - the so-called economic activity grant, with a share of 8 percent -is allocated on the basis of total wage remuneration paid in the provinces. The introduction of a revenue capacity equalization component is not an urgent task for South African provinces, because - as mentioned before -they have almost no revenue autonomy.
B. Specific purpose grants Specific-purpose, conditional grants are used for correcting interjurisdictional spillovers and/or for funding activities, which have a high priority from the point of view of the national government (but which - in the absence of such transfers - might be given a low priority by local governments), such as the promotion of environmental protection, or the prevention of epidemics (see Ahmad, l996). Specific purpose grants are seldom used in Africa,17 which seems reasonable giving the present availability of finance and administration skills. As to the correction of externalities, one partial exception is South Africa. To correct some of the problems deriving from the current assignment of responsibilities in the health sector, this country started a specific grant program that funds medical research conducted by general hospitals now run by provinces. However, correcting grant externalities requires a lot of sophistication in terms of design and is not an easy process. This also explains, at least partly, why South Africa has postponed the starting of this grant.
grant. The proposed grant, by the prescriptions of the theory, since it is based on revenue capacity and expenditure needs. 16 Department of Finance of South Africa (l999a). 17 This statement assumes that salary grants are not considered as specific/ conditional grants. This seems reasonable, since they are used for funding salaries in all sectors of expenditure and there are no strings attached to them. If beneficiary governments could, by chance, use these grants for non-salary expenditure, the central government would be unlikely to object. It would, however, reduce the grant in the next allocation.
28
Some countries, such as Uganda, use conditional transfers for funding supplies for education and health care. The idea behind these conditional grants is to force the effective production of services by recipient governments, which could otherwise spend general grants for salaries and/or councilors’ fees. The use of these conditional grants may reduce the risk of capture and the possibilities of waste. Concerning the promotion of national priorities, African countries tend to implement it – as we have seen above - by attaching strings to general purpose transfers, rather than using specific transfers. Promotion of national priorities is obviously a valuable goal, but if pushed too far it may be contradictory in the present stage of decentralization in Africa. A sounder policy may be the introduction of ceilings on the use of transfers for purely administrative or political costs, as to avoid waste and mismanagement. Conclusion Decentralization offers many opportunities. However, to work properly a decentralized system needs well defined rules of the game and their enforcement. Otherwise, decentralization becomes a risky venture, particularly in poor developing countries, such as most of the African ones, where democratic institutions are fragile, and capacity is weak. The risk of overburdening the newly created institutions is substantial. This applies also to the implementation of specific poverty alleviating policies, which is considered today as a crucial goal of decentralized government. While both theory and evidence do not show conclusively that political and bureaucratic capture are greater at the local than at the national level - they are rather context specific -proponents of decentralization and governments should not place too many demands on newly created local governments. The interests of the poor are served well and on a durable basis when decentralization renders more efficient the provision of basic local services and starts filling the huge disparities in their provision between the various areas of the same country. To reach this goal decentralization has to satisfy a huge number of quite demanding conditions. It should be gradual and closely monitored. African countries are choosing a wide variety of institutional arrangements. Frequently, too many layers have been created, particularly in view of the huge political and administrative costs of the newly created units. Furthermore, central governments have decentralized to satisfy demands for more autonomy, but are still quite reluctant to cede power. The assignment of limited responsibilities may be a signal of the intention to proceed gradually, but this interpretation is in some cases inconsistent with the excessive number of layers of government that have been created. African governments are also uniformly very reluctant to devolve taxing powers. This reduces accountability at the local level. The property tax is generally used for financing small area governments (i.e. municipalities), but it is very inefficiently collected. Wide area
29
governments, such as regions, have no own revenue sources and are forced to rely on transfers from the central government. Finding appropriate tax sources for regional governments is one of the most urgent and challenging tasks for African decentralization processes. Although the system of grants has been recently improved in a number of countries through the introduction of formula based systems of allocation, fiscal responsibility is still quite weak, because – among other factors, such as too frequent changes of formula and criteria - of the dominant importance of grants in the revenue system of decentralized governments.
30
References Ahmad, Ehtisham, (ed.) Financing Decentralized Expenditure: An International Comparison of Grants, Edward Edgar Cheltenham, U.K, l996. Ahmad, Ehtisham and Krelove, Russell “Tax Assignments: Options for Indonesia”, paper presented at the seminar on “Agenda for Sequencing Decentralization in Indonesia”, March 20–21, 2000, Jakarta, Indonesia. Baland. Jean Marie and Platteau, Jean Philippe, “Halting Degradation of Natural Resources: Is There a Role for Rural Communities ?” Oxford University Press, Oxford, l995. Baland Jean Marie. and Platteau, Jean Philippe “The Ambiguous Impact of Inequality on Local Resource Management”, World Development , Vol. 27, No.5, pp.773-88, l999. Bardhan, Pranab, “Analytics of the Institutions of Informal Co-operation in Rural Development”, World Development, Vol. 21; No 4, 1993. Bardhan, Pranab, “The Role of Governance in Economic Development. A Political Economy Approach”, OECD, Development Centre, 1997. Bardhan, Pranab, Mookherjee Dilip, “Expenditure Decentralization and the Delivery of Public Services in Developing Countries”, Department of Economics, University of California Berkeley, W.P. No. C98-104, December 1998. Bardhan, Pranab, Mookherjee Dilip, Capture and Governance at Local and National Levels, American Economic Review, Vol. 90, n.2, Papers and Proceedings, 2000. Bates, Robert, “Government and Agricultural Markets in Africa”, Toward a Political Economy of Development, Bates Robert (ed.), University of California, 1988. Binswanger, Hans Deininger, Klaus, “Explaining Agricultural and Agrarian Policies in Developing Countries”, Journal of Economic Literature, Vol. XXXV, December, pp. 1958-2005, 1997. .Brown, Charles, Oates Wallace, “Assistance to the Poor in a Federal System”, Journal of Public Economics, Vol. 32, pp. 331-353, 1987. Crook Richard C. Manor, James, Democracy and Decentralization in South Asia and West Africa, Cambridge University Press, 1998. Department of Finance of South Africa, Intergovernmental Fiscal Review 1999a. Department of Finance of South Africa, Provincial Tax Instruments. An Evaluation of Options. August 1999b.
31
Dillinger, W., “Urban Property Tax Reform. Guidelines and Recommendations”, World Bank 1992. Farvacque-Vitkovi, C, Godin, L, “The future of African cities: challenges and priorities for urban development”. World Bank, 1997. Fjeldstad, Odd-Helge and Semboja, Joseph, “Tax evasion and corruption in developing countries. A study of local government in Tanzania”, mimeo, http:www.cmi.no/Public/doctaxev.html (1998). IMF, Uganda achieves impressive results in reforming public service sector. IMF Survey, May 25, 1998. Olson Mancur, The Logic of Collective Action. Public goods and the theory of groups. Cambridge, MA/ Harvard University Press 1971. Nsibambi, Apollo, “Financing Decentralization”, A, Nsibambi, Decentralization and Civil Society in Uganda. The Quest for Good Governance, Fountain Publishers, Kampala, l998. Pauly, M.V. “Income Redistribution as a Local Public Good”, Journal of Public Economics , Vol. 2, February, pp. 35-58.1973. Tanzi Vito, “Fiscal Federalism and Decentralization: A Review of Some Efficiency and Macroeconomic Aspects”, Annual Bank Conference on Development Economics, World Bank, Washington D.C. 1995. Wade Robert, “Village Republics: Economic Conditions for Collective Action in South India”, Cambridge University Press, 1987. Wade Robert, “How Infrastructure Agencies Motivate Staff: Canal Irrigation in India and the Republic of Korea”, in Infrastructure Strategies in East Asia, Ashoda Mody (ed.), World Bank Washington D.C, l997. World Bank, “Decentralization in Madagascar: A Strategy for successful implementation”, Washington D.C 1998a, mimèo. World Bank, World Development Report 1999-2000. Washington D.C 1999a. World Bank, Mayor “Property Tax Issues in Africa” (Proceedings of a seminar held in Harare in l995), l996.

32
World Bank, Ethiopia. Review of Public Finances, Washington D.C l998 a World Bank, Ethiopia. Regionalization Study. Washington D.C 1999b. World Bank, World Development Report 2000/01 Attacking Poverty, Washington D.C 2000

33
Table 1.1 Decentralization in selected African countries:institutional and political reform.
Countries Institutional Reform Political Reform
Ethiopia Introduces federal system Introduces elections of
(Proclamations of 1992/93 and regional councils (last in 1995) Constitution of l994)
Uganda Substitutes (1993) deconcentrated Introduces local elections system with a decentralized one. (last in l996) Districts(43). Counties (150) and Sub-counties.
Cote d’Ivoire Substitutes deconcentrated system Introduces elections with a decentralized (two layers) of councils (last in l996) system. New municipalities are added to the list. New total is 197
Ghana Replaces (1989) deconcentrated system Introduces elections with a decentralized one: Districts (110). of Districts (since 1988) Regions (10) are still deconcentrated
Senegal Introduces (1996) a three-layered system: Introduces elections Regions (10). Municipalities (60). of regional and Creates rural municipalities. municipal councils
Mali Introduces a multi-layered system: Introduces elections Regions (8); District de Bamako; of municipal councils Circles (46); Municipalities (701). These councils appoint Creates 682 new municipalities (1996). councilors of Regions and Circles.
Madagascar Constitution of 1998, introduces Introduces elections a multilayered system: of municipal and Provinces (6); Municipalities (110). provincial councils (late 2000)
South Africa Constitution of 1996 introduces Introduces elections a quasi-federal system: Provinces (9); of municipal and Local governments (800 to 300). provincial councils (1994 and
1999)
Burkina Faso Introduces ( law of 1989) a multi-layered Introduces elections system:Provinces (10); Municipalities (their of councils (last for number has been increased to 108). Municipalities in l995)
Nigeria Has a federal system. States have been Introduces elections of increased to 36. 774 municipalities. state and local councils. Federal capital territory: Abuja
Zimbabwe Has a deconcentrated system with 8 Holds local elections Provinces and a decentralized one regularly
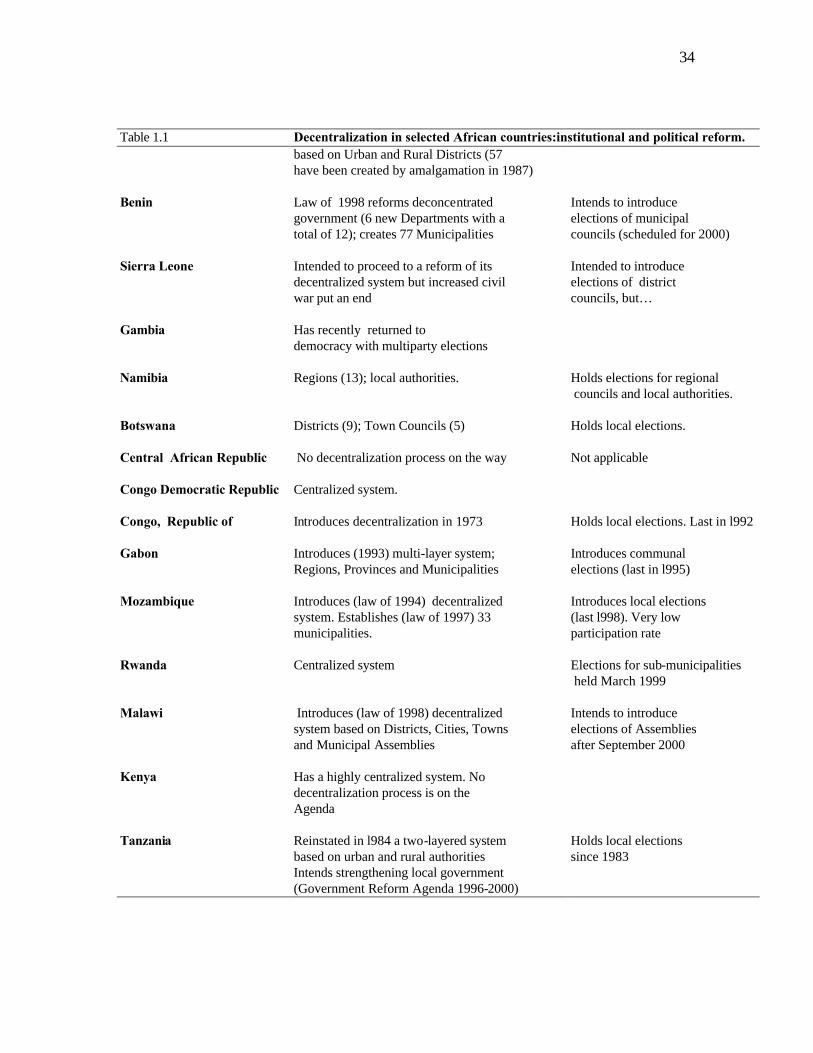
34
Table 1.1 Decentralization in selected African countries:institutional and political reform. based on Urban and Rural Districts (57 have been created by amalgamation in 1987)
Benin Law of 1998 reforms deconcentrated Intends to introduce government (6 new Departments with a elections of municipal total of 12); creates 77 Municipalities councils (scheduled for 2000)
Sierra Leone Intended to proceed to a reform of its Intended to introduce decentralized system but increased civil elections of district war put an end councils, but…
Gambia Has recently returned to democracy with multiparty elections
Namibia Regions (13); local authorities. Holds elections for regional councils and local authorities.
Botswana Districts (9); Town Councils (5) Holds local elections.
Central African Republic No decentralization process on the way Not applicable
Congo Democratic Republic Centralized system.
Congo, Republic of Introduces decentralization in 1973 Holds local elections. Last in l992
Gabon Introduces (1993) multi-layer system; Introduces communal Regions, Provinces and Municipalities elections (last in l995)
Mozambique Introduces (law of 1994) decentralized Introduces local elections system. Establishes (law of 1997) 33 (last l998). Very low municipalities. participation rate
Rwanda Centralized system Elections for sub-municipalities held March 1999
Malawi Introduces (law of 1998) decentralized Intends to introduce system based on Districts, Cities, Towns elections of Assemblies and Municipal Assemblies after September 2000
Kenya Has a highly centralized system. No decentralization process is on the Agenda
Tanzania Reinstated in l984 a two-layered system Holds local elections based on urban and rural authorities since 1983 Intends strengthening local government (Government Reform Agenda 1996-2000)

35
Table A 2 Decentralization in selected African countries: fiscal institutions.
Countries Functional responsibilities Revenue Decentralization Implementation
(% of subnational stage on total public expenditure)
Ethiopia Education, health, roads Introduces 45% (l995/96) Well on the way Transferred to Regions revenue sharing
Uganda Education, health, roads Introduces unconditional substantial (to be Well on the way and basic urban services and equalization grants quantified) to Districts
Cote d’Ivoire Typical urban services, 35% of property tax 5% (1992) Stalling local roads, construction 65% of business (license) and maintenance of schools tax, charges and fees. and primary health care facilities
Ghana Regions coordinate Districts Property tax, minor taxes, fees approximately 10 % On the way Districts have typical Central government transfers urban services,local roads, District Assembly Common primary education and health. Fund (at least 5% of domestic tax revenue)
Senegal Municipalities have typical Municipalities have property, 6 % (1994-95) Stalling urban services business and other minor Regions have health and taxes. Introduces capital education grant to municipalities (FECL)
Mali Municipalities have typical Assigns business tax and 2-3 % Just started urban services. other minor taxes to Circles and regions build municipalities and maintain infrastructure
Madagascar Typical urban services Business tax to provinces 7 % (1998) Just started to municipalities Property and minor taxes No detailed assignments to municipalities for provinces Introduces unconditional grant for municipalities.
South Africa Education, health and No major taxes to provinces 50% (l998/99) Well on the way welfare to provinces Introduces unconditional Typical urban services grant for provinces to municipalities Property and business taxes to municipalities
Burkina Faso No detailed assignments No tax assignments for 5% (early 1990's) Just started and for Provinces. provinces. possibly stalled
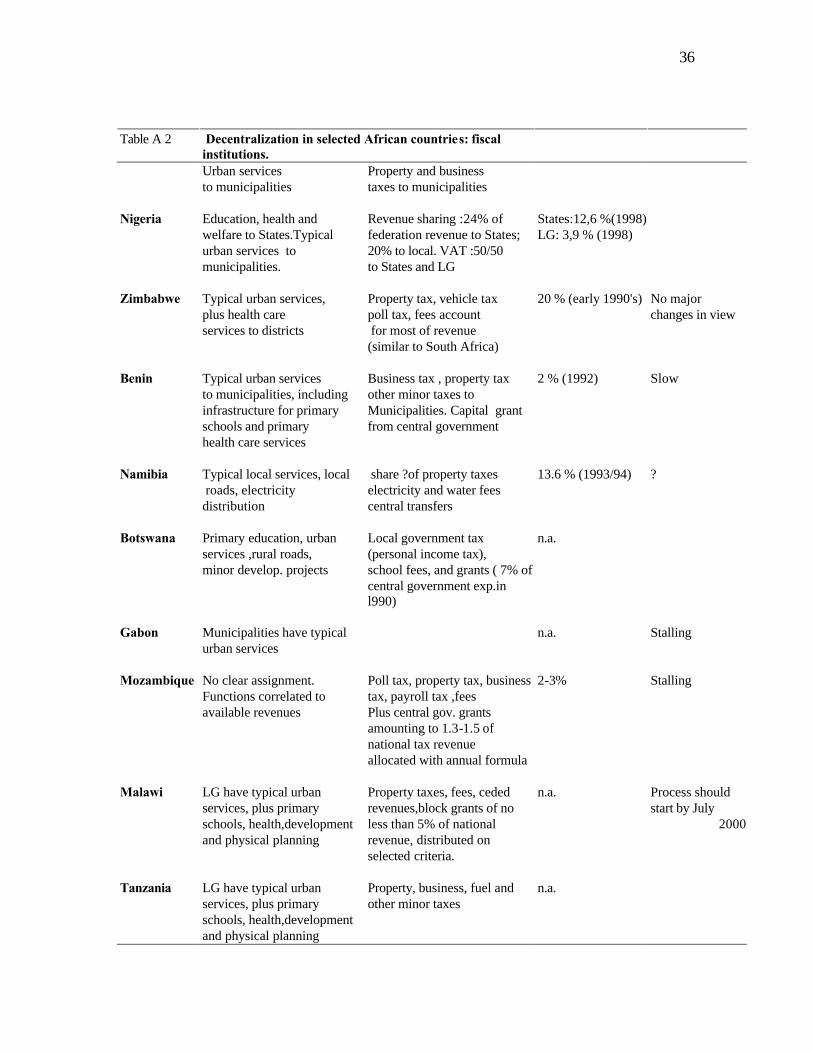
36
Table A 2 Decentralization in selected African countries: fiscal institutions.
Urban services Property and business to municipalities taxes to municipalities
Nigeria Education, health and Revenue sharing :24% of States:12,6 %(1998) welfare to States.Typical federation revenue to States; LG: 3,9 % (1998) urban services to 20% to local. VAT :50/50 municipalities. to States and LG
Zimbabwe Typical urban services, Property tax, vehicle tax 20 % (early 1990's) No major plus health care poll tax, fees account changes in view services to districts for most of revenue (similar to South Africa)
Benin Typical urban services Business tax , property tax 2 % (1992) Slow to municipalities, including other minor taxes to infrastructure for primary Municipalities. Capital grant schools and primary from central government health care services
Namibia Typical local services, local share ?of property taxes 13.6 % (1993/94) ? roads, electricity electricity and water fees distribution central transfers
Botswana Primary education, urban Local government tax n.a. services ,rural roads, (personal income tax), minor develop. projects school fees, and grants ( 7% of central government exp.in
l990)
Gabon Municipalities have typical n.a. Stalling
urban services
Mozambique No clear assignment. Poll tax, property tax, business 2-3% Stalling Functions correlated to tax, payroll tax ,fees available revenues Plus central gov. grants amounting to 1.3-1.5 of national tax revenue allocated with annual formula
Malawi LG have typical urban Property taxes, fees, ceded n.a. Process should services, plus primary revenues,block grants of no start by July schools, health,development less than 5% of national 2000 and physical planning revenue, distributed on selected criteria.
Tanzania LG have typical urban Property, business, fuel and n.a. services, plus primary other minor taxes schools, health,development and physical planning

37