decentralization’s effects on educationalpolicydialogue.org/files/events/faguet_sanchez... ·...
TRANSCRIPT
Working Paper No. 62
ISSN 1740-5815
DECENTRALIZATION’S EFFECTS ON EDUCATIONAL OUTCOMES IN BOLIVIA AND COLOMBIA1
Jean-Paul Faguet2 Fabio Sánchez3
5 February, 2006
Abstract
The effects of decentralization on public sector outputs is much debated but little agreed
upon. This paper compares the remarkable case of Bolivia with the more complex case
of Colombia to explore decentralization’s effects on public education outcomes. In
Colombia, decentralization of education finance improved enrollment rates in public
schools. In Bolivia, decentralization made government more responsive by re-directing
public investment to areas of greatest need. In both countries, investment shifted from
infrastructure to primary social services. In both, the behavior of the smallest, poorest,
most rural municipalities was what drove these changes.
Key words: decentralization, education, public investment, Latin America, Bolivia,
Colombia, local government
1
1. Introduction Over the past few decades decentralization has become one of the most debated
policy issues throughout both developing and developed worlds. It is seen as central to
the development efforts of countries as far afield as Chile, China, Guatemala and Nepal.
And in the multiple guises of subsidiarity, devolution and federalism it is also squarely in
the foreground of policy discourse in the EU, UK and US. But surprisingly, there is little
agreement in the empirical literature on the effects of decentralization on a number of
important policy goals. Advocates (e.g. Olowu and Wunsch 1990, Putnam 1993, World
Bank 1994, UNDP 1993) argue that decentralization can make government more
responsive to the governed by “tailoring levels of consumption to the preferences of
smaller, more homogeneous groups” (Wallis and Oates 1988, 5). Opponents (e.g. Crook
and Sverrisson 1999, Samoff 1990, Smith 1985) dispute this, arguing that local
governments are too susceptible to elite capture, and too lacking in technical, human and
financial resources, to produce a heterogeneous range of public services that are both
reasonably efficient and responsive to local demand. But neither side is able to
substantiate its arguments convincingly with empirical evidence.
Much of the debate has taken place in these pages, similarly without resolution.
Of 24 articles on decentralization, local government and responsiveness published in
World Development since 1997, 11 report broadly positive results, and 13 are negative.
Fiszbein (1997), Shankar and Shah (2003), Oliveira (2002) and Parry (1997) are amongst
the most enthusiastic, finding that decentralization can spur capacity building in local
government (Colombia), decrease levels of regional inequality through political
competition (a sample of 26 countries), boost the creation and administration of protected
areas (Bahia, Brazil), and improve educational outcomes (Chile), respectively. Rowland

2
(2001) and Blair (2000) find that decentralization improved the quality of democratic
governance achieved in both large cities and small towns. And Petro (2001) finds that
local government played a pivotal role in raising levels of social capital in Novgorod,
Russia by establishing common social values and priorities for the community. Other
authors, such as Andersson (2004), Larson (2002), McCarthy (2004) and Nygren (2005),
are more cautious, arguing broadly that decentralization is a complex, problematic
phenomenon, but may ultimately have positive effects on local welfare.
Amongst skeptics, some of the most striking are Ellis and Kutengule (2003), Ellis
and Mdoe (2003) and Ellis and Bahiigwa (2003), who find that decentralization will
likely depress growth and rural livelihoods by facilitating the creation of new business
licenses and taxes that stifle private enterprise (Malawi), and propagate rent-seeking
behavior down to the district and lower levels, so becoming “part of the problem of rural
poverty, not part of the solution”4 (Tanzania and Uganda), respectively. Similarly,
Bahiigwa, Rigby and Woodhouse (2005) and Francis and James (2003) show that
decentralization in Uganda has not led to independent, accountable local governments,
but rather to their capture by local elites, and hence to the failure of decentralization as a
tool for poverty reduction. Porter (2002) agrees for Sub-Saharan Africa more generally.
Regarding the environment, Woodhouse (2003) predicts that decentralization will fail to
improve access of the poor to natural resources, or reduce ecological damage. Casson
and Obidzinski (2002) go further, reporting that decentralization in Indonesia has spurred
depredatory logging by creating bureaucratic actors with a stake in its proliferation. The
cross-country evidence of Martinez-Vazquez and McNab (2003) is similarly unhopeful,
showing that we don’t know empirically whether decentralization affects growth directly
3
or indirectly, and have no clear theoretical grounds for predicting a relationship either
way. Worse, de Mello’s (2000) study of 30 countries predicts that failures of
intergovernmental fiscal coordination will lead to chronic deficits and, eventually,
macroeconomic instability. The papers of Sundar (2001), Thun (2004) and Wiggins,
Marfo and Anchirinah (2004) offer more cautious, nuanced arguments, that are on the
whole skeptical about the possibility of beneficial change through decentralization.
The larger literature is similarly inconclusive. Consider the broadest surveys:
Rondinelli, Cheema and Nellis (1983) note that decentralization has seldom, if ever, lived
up to expectations. Most developing countries implementing decentralization
experienced serious administrative problems. Although few comprehensive evaluations
of the benefits and costs of decentralization efforts have been conducted, those that were
attempted indicate limited success in some countries but not others. A decade and a half
later, surveys by Piriou-Sall (1998), Manor (1999) and Smoke (2001) are slightly more
positive, but with caveats about the strength of the evidence in decentralization’s favor.
Manor ends his study with the judgment that “while decentralization …is no panacea, it
has many virtues and is worth pursuing”, after noting that the evidence, though extensive,
is still incomplete. Smoke finds the evidence mixed and anecdotal, and asks whether
there is empirical justification for pursuing decentralization at all. The lack of progress is
striking.
This paper examines decentralization’s effects on educational outcomes in Bolivia
and Colombia. We first examine how decentralization changed investment flows across
sectors, and across space, in both countries. We then focus much more closely on
education outputs, which a remarkable range of analysts agree is a top priority for

4
developing countries. Our quantitative analysis is unusual in that the bulk of the
empirical literature can be grouped into two broad categories: (1) small-N studies that
link decentralization with real outcomes of interest (e.g. Parry 1997), and (2) large-N
studies that link decentralization to input or process-type variables, as opposed to real
outcomes (e.g. Faguet 2004). Systematic evidence for a link between decentralization
and real outcome variables (i.e. those that affect people’s lives) are remarkably few and
far between. This paper examines just such a link for Colombia, and gets as close as the
data allow for Bolivia.
Why focus on these two countries in particular? There are four reasons: (i) in
both cases, decentralization was advocated as a remedy for a state whose
unresponsiveness to citizens’ needs fed serious internal tensions, including armed
insurgency in Colombia; (ii) in both cases, decentralizing reforms were pursued in a
vigorous and sustained manner; (iii) the broad geographic, institutional and historical
similarities these countries share limit problems of data comparability and interpretation;
and (iv) although their internal ructions have attracted much international attention
recently, both are relatively underrepresented in the literature. Bolivia is particularly
deserving of study because reform there consisted of a large change in policy at a discrete
point in time, thus rendering it a sort of natural experiment. Colombia is more relevant
for many middle-income countries because of its greater wealth, level of development,
and relatively high state capacity. And its more complex, multifaceted reform process is
more typical of decentralizations around the world. To our knowledge, this is the first
comparative study of decentralization in Bolivia and Colombia.

5
Decentralization is henceforth defined as the devolution by central (i.e. national)
government of specific functions, with all of the administrative, political and economic
attributes that these entail, to democratic local (i.e. municipal) governments which are
independent of the center within a legally delimited geographic and functional domain.
The rest of the paper is organized as follows. Section 2 reviews the Bolivian and
Colombian decentralization programs, focusing on their legal and budgetary aspects.
Section 3 examines decentralization’s effects on public investment flows in both
countries. Section 4 presents our quantitative methodology. Section 5 examines whether
decentralization made education investment more responsive to local needs in Bolivia,
and whether it increased school enrollment in Colombia, with detailed econometric
evidence. And section 6 concludes.
2. The Bolivian and Colombian Decentralization Programs
2.1 Popular Participation in Bolivia
On the eve of revolution, Bolivia was a poor, backward country with extreme
levels of inequality, presided over by a “typical racist state in which the non-Spanish
speaking indigenous peasantry was controlled by a small, Spanish speaking white elite,
[their power] based ultimately on violence more than consensus or any social pact”
(Klein 1993, 237; our translation). The nationalist revolution of 1952, which
expropriated the “commanding heights” of the economy, land and mines, launched
Bolivia on the road to one of the most centralized state structures in the region. The
government embarked upon a state-led modernization strategy in which public
corporations and regional governments initiated a concerted drive to break down
provincial fiefdoms, transform existing social relations, and create a modern, industrial,
6
egalitarian society (Dunkerley 1984). To this end the President directly appointed
Prefects, who in turn designated entire regional governments and associated
dependencies, forming a national chain of cascading authority emanating from the
Palacio Quemado in La Paz.
The intellectual trends of the 1950s-1970s – Dependencia theory, Import
Substitution Industrialization, and Developmentalism – contributed to the centralizing
tendency, as did the military governments which overthrew elected administrations with
increasing frequency from the 1960s on (Klein 1993). With political power so little
dispersed, there was little point in establishing the legal and political instruments of local
governance. As a result, beyond the nine regional capitals (including La Paz) and an
additional 25-30 cities, local government existed in Bolivia at best in name, as an
honorary and ceremonial institution devoid of administrative capability and starved for
funds. And in most of the country it did not exist at all.
Although the 1994 reform was sprung on an unsuspecting nation, the concept of
decentralization was by no means new. For more than 30 years a decentralization debate
focused on Bolivia’s nine departments ebbed and flowed politically – at times taking on
burning importance, other times all but forgotten. The issue became caught up in the
country’s centrifugal tensions, as regional elites in Santa Cruz and Tarija consciously
manipulated the threat of secession to Brazil and Argentina respectively – with which
each is economically more integrated than La Paz – to extract resources from the center.
The Bolivian paradox of a highly centralized but weak state, and a socially diverse
population with weak national identity, meant that such threats were taken seriously by

7
the political class, which blocked all moves to devolve more power and authority to
Bolivia’s regions.
So what spurred the change of tack? and why then? Two factors stand out. The
less important one arises from Bolivia’s failure to achieve sustained, healthy growth
despite wrenching economic reform overseen by the IMF and World Bank. Fifteen years
of near-zero per capita economic growth sapped the credibility of the state and fomented
social unrest. The new Movimiento Nacionalista Revolucionario (MNR) administration
of Pres. Sánchez de Lozada saw the structure of government itself as an impediment to
growth. Decentralization was an attempt to deepen structural reform in order to make the
state more efficient and responsive to the population, and so regain its legitimacy in the
voters’ eyes.
The more important factor arises from the rise of ethnically-based, populist
politics in the 1980s, which undercut the MNR’s traditional dominance of the rural vote,
and posed a serious challenge to its (self-declared) role as the “natural party of
government”. This rural dominance was itself born out of the MNR’s agrarian reforms of
the 1952-3 revolution. Hence a party with a tradition of radical reform, which found
itself in secular decline, sought a second, re-defining moment. In a typically bold move,
it sought to reorganize government, re-cast the relationship between citizens and the state,
and so win back the loyalty of Bolivians living outside major cities. To a very important
extent, decentralization was a gambit to capture rural voters for at least another
generation.5
Against this background, the Bolivian decentralization reform was announced in
1994. The Law of Popular Participation, developed almost in secret by a small number
8
of technocrats (Tuchschneider 1997), was announced to the nation to general surprise,
followed by ridicule, followed by determined opposition of large parts of society.6 It is
notable that opposition to the law, which was fierce for a few months, came principally
from the teachers’ union, NGOs and other social actors, and not from political parties.
Judged by their public declarations, this opposition was an incoherent mix of accusations
and fears that denoted a deep suspicion of the government’s motives, and not a careful
reading of the law. The lack of opposition from parties can largely be attributed to the
sweeping reforms that were being enacted by the MNR government at the same time as
decentralization. With privatization of the main state enterprises, education reform, and a
comprehensive restructuring of the executive branch all being pushed at once,
decentralization was relegated to the second tier of political parties’ concerns. The
opposition focused its attention elsewhere, and it never became a fighting point.
First made public in January of that year, the law was promulgated by Congress in
April and implemented from July. The scale of the change in resource flows and political
power that it brought about were enormous. The core of the law consists of four points
(Secretaría Nacional de Participación Popular, 1994):
1. Resource Allocation. Funds devolved to municipalities doubled to 20 percent of all
national tax revenue. More importantly, allocation amongst municipalities switched
from unsystematic, highly political criteria to a strict per capita basis.
2. Responsibility for Public Services. Ownership of local infrastructure in education,
health, irrigation, roads, sports and culture was given to municipalities, with the
concomitant responsibility to maintain, equip and administer these facilities, and
invest in new ones.

9
3. Oversight Committees (Comités de Vigilancia) were established to provide an
alternative channel for representing popular demand in the policy-making process.
Composed of representatives from local, grass-roots groups, these bodies propose
projects and oversee municipal expenditure. Their ability to have disbursements of
Popular Participation funds suspended if they find funds are being misused or stolen
can paralyze local government, and gives them real power.
4. Municipalization. Existing municipalities were expanded to include suburbs and
surrounding rural areas, and 198 new municipalities (out of some 315 in all) were
created.
This was followed by the Law of Decentralized Administration (1995) and the Law of
Municipalities (1999), which further defined the municipal mandate and located it in a
broader governmental architecture.
The change in local affairs that these measures catalyzed is immense. Before
reform local government was absent throughout the vast majority of Bolivian territory,
and the broader state present at most in the form of a military garrison, schoolhouse or
health post, each reporting to its respective ministry. After reform, elected local
governments sprouted throughout the land. This is reflected in resources flows between
center and periphery. Before decentralization Bolivia’s three main cities took 86% of all
devolved funds, while the remaining 308 municipalities divided amongst them a mere
14%. After decentralization the shares reversed to 27% and 73% respectively. The per
capita criterion resulted in a massive shift of resources in favor of previously neglected,
mostly rural districts.

10
2.2 The Decentralization Process in Colombia
Like Bolivia, Colombia was traditionally a highly centralized country, with
mayors and governors directly named by central government. Governors, in particular,
were the President’s hombres de confianza, and carried out his will in the regions. But
unlike Bolivia’s “big bang” reform, decentralization in Colombia developed over years as
a much more gradual, incremental process. Ceballos and Hoyos (2004) identify three
broad phases:
Phase 1 began in the late 1970s and early 1980s, and included a number of fiscal
measures aimed at strengthening municipal finances. Most important of these were Law
14 of 1983 and Law 12 of 1986, which assigned to municipalities increased powers of tax
collection, including especially sales tax, and established parameters for the investment
of these funds.
Phase 2, which began in the mid-1980s, was more concerned with political and
administrative matters. Amongst the most important of these measures was Law 11 of
1986, which regulated the popular election of mayors and sought to promote popular
participation in local public decision-making via Juntas Administradoras Locales,
amongst others. Reforms enshrined in the 1991 constitution, such as citizens’ initiatives,
municipal planning councils, open cabildos, the ability to revoke mayoral mandates,
referenda, and popular consultations, further deepened political decentralization. The
1991 constitution also established the popular election of governors.
Phase 3 consisted of a number of laws that regulated the new constitution, and
other fiscal and administrative reforms of the period These laws assigned greater
responsibility to municipalities for the provision of public services and social investment,

11
and provided additional resources for the same by increasing central government
transfers to local governments significantly. The laws mandate that the bulk of
transferred funds should be spent on education and health, with little discretion left to
local governments. Automatic transfers to regional governments rose from about 20% to
over 40% of total government spending, placing Colombia first in the region amongst
countries with a unitary state, and third overall behind the two big federal countries,
Brazil and Argentina (Alesina et al., 2000).
The aggregate effect of two decades of political and fiscal reforms was a large
increase in the authority and operational independence of Colombia’s municipal
governments, accompanied by a huge rise in the resources they controlled.
Municipalities were allowed to raise and spend significant sums of taxes, central-to-local
government transfers increase more than three fold,7 and municipal governments were
permitted to issue public debt. Overall municipal expenditures and investments rose
from 2.8% to 8.3% of GDP, as detailed in figure 1. This rise was due entirely to
increased investment, while running costs remained stable over the period.
Figure 1
0.00%
1.00%
2.00%
3.00%
4.00%
5.00%
6.00%
7.00%
1993 1994 1995 1996 1997 1998 1999 2000 2001 2002
Municipal Expenditures & Investment (%GDP)
Investment Running Costs
Source: Original calculations; database compiled from official Colombian sources.

12
What drove decentralization in Colombia? As befits a much longer and more
elaborate process, we cannot limit the motivating factors of reform to a few discrete
goals. Ceballos and Hoyos group the many reasons into two categories. The first of
these is the challenge of political instability. Colombia is a violent country – much more
so than Bolivia – with a long history of civil conflict, armed rebellion, persistently high
levels of “common” crime, and the use of violence as an explicit tool of political
mobilization. The late 1970s saw levels of violence rise again as the internal conflict
intensified. At the same time, social protests and pressures from regional groups
multiplied, linked to the central state’s inability to meet demands for social services and
public investment. Secondly, the political hegemony over the instruments of the state of
the traditional Liberal and Conservative parties began to be seen more and more as a
liability – less the solution to a previous round of civil violence (La Violencia) and more
a cause of the next one. Colombians from across the political spectrum became
convinced that the inability of the state to respond to society’s demands – and its outright
absence in many areas (the “internal frontier”), combined with the waning legitimacy of
an arbitrarily restricted democracy,8 were leading to public sector inefficiencies, civic
discontent, and ultimately armed violence.
Thus from the start decentralization in Colombia was a multi-faceted tool
designed to serve a combination of purposes particular to Colombia’s troubled
democracy. Through it, policy elites sought to increase the levels of electoral and citizen
participation within the existing institutional framework. They sought to open the
political system via popular elections at the regional and local levels, where they hoped

13
new political movements would emerge and eventually assume power, so breaking the
liberal-conservative hegemony over the resources of the state.
3. Decentralization and Public Investment – An Overview
3.1 Bolivia
The extent of the change decentralization brought about in Bolivia is perhaps best
appreciated by examining how it changed the composition of municipal public
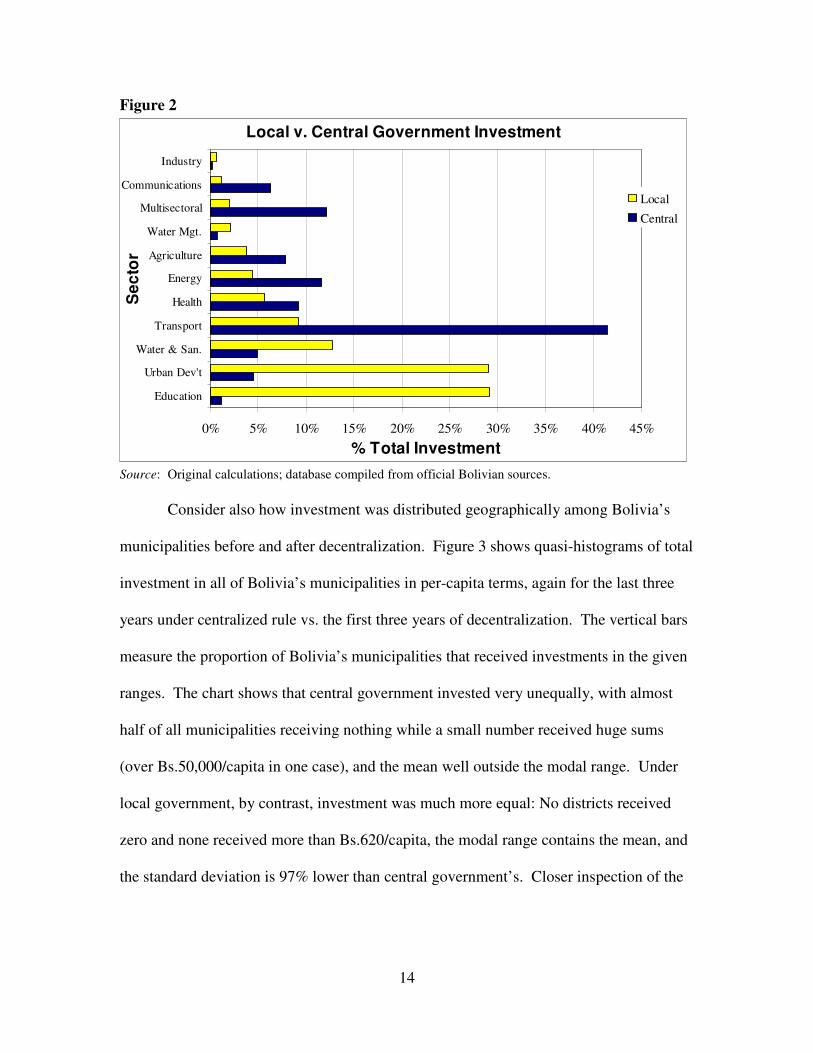
investment. Figure 2 compares investment by sector during the final three years under
centralized rule (1991-3) with decentralized investment during the first three years after
(1994-6). To better compare like with like, we omit sectors such as hydrocarbons,
mining and national defence, which are not well suited to local government action (and
remained the responsibility of central government in Bolivia).9 The differences are
nonetheless large. In the years leading up to reform, central government invested most in
transport, energy and multisectoral,10 which together accounted for 65% of public
investment during 1991-3. After decentralization, local governments invest most heavily
in education, urban development, and water & sanitation, together accounting for 79% of
municipal investment. Of the top three sectors in both cases, accounting for the great
majority of total investment, central and local government have not one in common. The
evidence implies that local and central government have very different investment
priorities. Decentralizing power and resources to municipal governments shifted public
investment away from economic production and infrastructure, and into social services
and human capital formation.
14
Figure 2
Local v. Central Government Investment
0% 5% 10% 15% 20% 25% 30% 35% 40% 45%
Education
Urban Dev't
Water & San.
Transport
Health
Energy
Agriculture
Water Mgt.
Multisectoral
Communications
Industry
Sec
tor
% Total Investment
Local
Central
Source: Original calculations; database compiled from official Bolivian sources. Consider also how investment was distributed geographically among Bolivia’s
municipalities before and after decentralization. Figure 3 shows quasi-histograms of total
investment in all of Bolivia’s municipalities in per-capita terms, again for the last three
years under centralized rule vs. the first three years of decentralization. The vertical bars
measure the proportion of Bolivia’s municipalities that received investments in the given
ranges. The chart shows that central government invested very unequally, with almost
half of all municipalities receiving nothing while a small number received huge sums
(over Bs.50,000/capita in one case), and the mean well outside the modal range. Under
local government, by contrast, investment was much more equal: No districts received
zero and none received more than Bs.620/capita, the modal range contains the mean, and
the standard deviation is 97% lower than central government’s. Closer inspection of the

15
municipalities in the leftmost (zero) column below reveals that it was overwhelmingly
smaller, poorer, more rural districts that benefitted most from decentralization.
Figure 3: Distribution of Central and Local Government Investent by Amount Local Government Investment (s.d. = Bs.90/capita)
0%
5%
10%
15%
20%
25%
30%
35%
40%
45%
50%
=0
0-50
50-1
00
100-
150
150-
200
200-
250
250-
300
300-
350
350-
400
400-
450
450-
500
500-
750
750-
1k
1k-1
0k
>10k
Range (Bs/cap)
Sh
are
of
Mu
nic
ipal
itie
s
Mean = 165 Bs/capita
Central Government Investment (s.d. = Bs.3387/capita)
0%
5%
10%
15%
20%
25%
30%
35%
40%
45%
50%
=0
0-50
50-1
00
100-
150
150-
200
200-
250
250-
300
300-
350
350-
400
400-
450
450-
500
500-
750
750-
1k
1k-1
0k
>10k
Range (Bs/cap)
Sh
are
of
Mu
nic
ipal
itie
s
Mean = 581 Bs/capita
Source: Author's calculations. Note irregular outer intervals.
So decentralization seems to have changed the sectoral uses of investment and its
distribution across space. Did its effects run any deeper? Figure 4 plots education
investment under central and local government (three-year totals again) vs. local illiteracy
rates for all of Bolivia’s municipalities. We use the illiteracy rate as a proxy for a
district’s need for more education investment.11 The most striking thing about the left-
hand plot is how few nonzero observations there are before decentralization – only 15%
of districts recorded any investment at all under central government. The regression line
is negative with a modest slope, and significant at the 11% level. Contrast that with
decentralized government, where 97% of districts invested in the sector, amounts are
larger across the board, and the regresion line on illiteracy is positively sloped and
significant at the 0.1% level. Decentralization appears to have transformed education
policy from one that ignored most municipalities in order to focus resources in those best-

16
provided, to one that invested essentially everywhere, focusing resources where existing
levels of education were worst. Section 5 looks at this question much more rigorously.
Figure 4: Education Investment vs. Illiteracy
Central Government, 1991-93
0
50
100
150
200
250
300
0 10 20 30 40 50 60 70Illiteracy Rate (%)
Edu
catio
n In
vest
men
t
Local Government, 1994-97
0
50
100
150
200
250
300
0 10 20 30 40 50 60 70Illiteracy Rate (%)
Edu
catio
n In
vest
men
t (B
s/ca
p)
Source: Original calculations; database compiled from official Bolivian sources
3.2 Colombia
Detailed muncipal-level expenditure and investment data are available for Colombia
only from 1994. Hence we cannot examine investment priorities under a relatively “pure”
centralized regime (i.e. which ended in the mid-1970s), as we did for Bolivia. But the
characteristics of Colombia’s reform process, marked by gradualism and long-term change,
make this less of a problem. As discussed above, a number of key decentralizing
mechanisms, such as citizens’ initiatives, referenda, mayoral recall, and increased resource
transfers, were only put in place with the 1991 constitutional reform and accompanying
regulations. These transferred resources and authority to municipalities gradually over time.
Hence we may consider that the outlines of Colombia’s decentralization “package” became
fully clear only in 1992-93, setting off a process that deepened thereafter. Indeed, the
empirical measures of decentralization that we use below all show monotonically increasing
levels of decentralization throughout the period 1994-2004. Hence hereafter we treat 1993-

17
94 as years with relatively high centralization, and 2003-04 as years with relatively high
decentralization.
How did decentralization affect public investment patterns? Figure 5 shows how
the sectoral composition of public investment changed between a relatively centralized
regime (1994), and a relatively decentralized one (2003)12. Unlike Bolivia, local
administrations did exist throughout Colombia before decentralization, albeit with low
levels of autonomy. Hence we show how both central and local investment changed over
the period. Deepening decentralization is associated with significant shifts of central
resources from infrastructure and health to education. Local government resources saw a
similar change, away from health and infrastructure, towards education, water &
sanitation, and culture. Although both pots grew over the period, local resources –
already the majority of resources invested in municipalities – grew more than twice as
fast as central resources. Hence the latter shift is much the more important one.
Figure 5: Public Investment Before and After Decentralization Central Government
0% 10% 20% 30% 40% 50%
Education
Health
Water & Sanitation
Infrastructure
Industry & Commerce
Culture
Sec
tor
Percent of Total
2003 1994
Local Government
0% 10% 20% 30% 40% 50%
Education
Health
Water & Sanitation
Infrastructure
Industry & Commerce
Culture
Sec
tor
Percent of Total
2003 1994
Source: Original calculations; database compiled from official Colombian sources
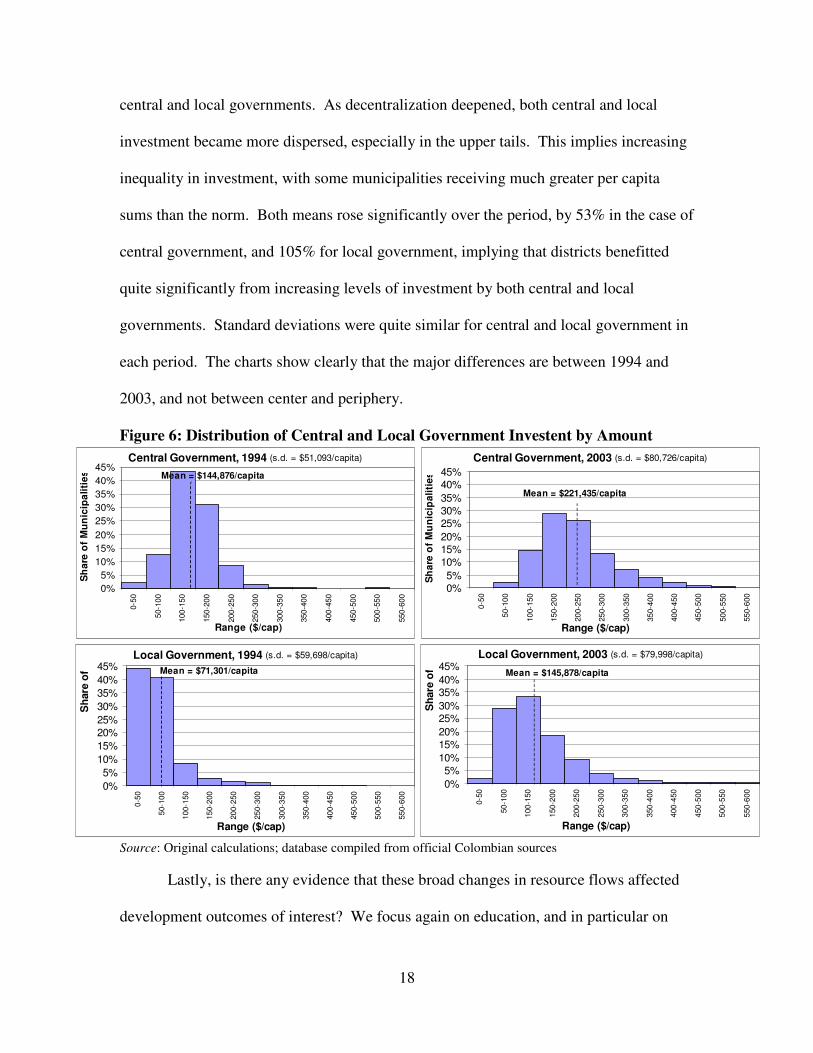
With respect to the geographic distribution of investment, figure 6 provides
histograms of the public investment in Colombia’s municipalities in 1994 vs. 2003.
Amounts are given in constant 2002 pesos per capita, again divided by source between
18
central and local governments. As decentralization deepened, both central and local
investment became more dispersed, especially in the upper tails. This implies increasing
inequality in investment, with some municipalities receiving much greater per capita
sums than the norm. Both means rose significantly over the period, by 53% in the case of
central government, and 105% for local government, implying that districts benefitted
quite significantly from increasing levels of investment by both central and local
governments. Standard deviations were quite similar for central and local government in
each period. The charts show clearly that the major differences are between 1994 and
2003, and not between center and periphery.
Figure 6: Distribution of Central and Local Government Investent by Amount Central Government, 2003 (s.d. = $80,726/capita)
0%5%
10%15%20%25%30%35%40%45%0-
50
50-1
00
100-
150
150-
200
200-
250
250-
300
300-
350
350-
400
400-
450
450-
500
500-
550
550-
600
Range ($/cap)
Sh
are
of
Mu
nic
ipal
itie
s
Mean = $221,435/capita
Local Government, 2003 (s.d. = $79,998/capita)
0%5%
10%15%20%25%30%35%40%45%
0-50
50-1
00
100-
150
150-
200
200-
250
250-
300
300-
350
350-
400
400-
450
450-
500
500-
550
550-
600
Range ($/cap)
Sha
re o
f Mean = $145,878/capita
Central Government, 1994 (s.d. = $51,093/capita)
0%5%
10%15%20%25%30%35%40%45%
0-50
50-1
00
100-
150
150-
200
200-
250
250-
300
300-
350
350-
400
400-
450
450-
500
500-
550
550-
600
Range ($/cap)
Sh
are
of
Mu
nic
ipal
itie
s Mean = $144,876/capita
Local Government, 1994 (s.d. = $59,698/capita)
0%5%
10%15%20%25%30%35%40%45%
0-50
50-1
00
100-
150
150-
200
200-
250
250-
300
300-
350
350-
400
400-
450
450-
500
500-
550
550-
600
Range ($/cap)
Sha
re o
f Mean = $71,301/capita
Source: Original calculations; database compiled from official Colombian sources
Lastly, is there any evidence that these broad changes in resource flows affected
development outcomes of interest? We focus again on education, and in particular on

19
school attendance figures. Figure 7 shows enrollment data for the period in question, for
both public and private schools, with enrollment in 1994 indexed to 1. At the outset,
public and private enrollment trends are quite similar. After 1996 an increasing gap
opens up between them, although they continue to trend up and down in parallel. After
1999, however, the slopes diverge, leading to a large gap between the two educational
systems. Decentralization seems to have been good for Colombian education, raising
school enrollment by twenty percent. The concentration of improvement in public
schools, where enrollment increased 30 percent while the private system’s fell seven
percent, suggests that local governments were able to run schools and promote attendance
better than central government had before. But such descriptive evidence is far from
conclusive. We return to this question with much more rigor in section 5. But before we
can do so, we must lay out our methodology.
Figure 7: Decentralization and School Enrollment Index of Public and Private School Enrollment
0.8
0.9
1
1.1
1.2
1.3
1.4
1.5
1994 1995 1996 1997 1998 1999 2000 2001 2002 2003 2004Year
En
rollm
ent
Ind
ex
Public Private Total
Source: Original calculations; database compiled from official Colombian sources
20
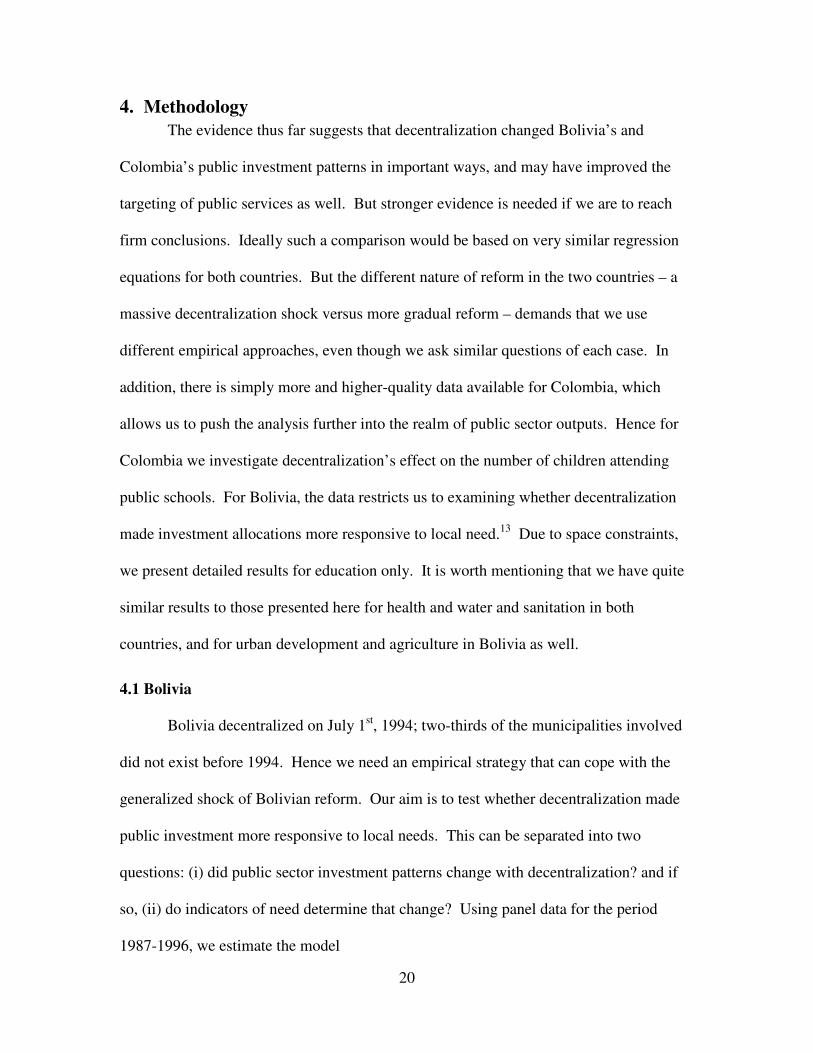
4. Methodology The evidence thus far suggests that decentralization changed Bolivia’s and
Colombia’s public investment patterns in important ways, and may have improved the
targeting of public services as well. But stronger evidence is needed if we are to reach
firm conclusions. Ideally such a comparison would be based on very similar regression
equations for both countries. But the different nature of reform in the two countries – a
massive decentralization shock versus more gradual reform – demands that we use
different empirical approaches, even though we ask similar questions of each case. In
addition, there is simply more and higher-quality data available for Colombia, which
allows us to push the analysis further into the realm of public sector outputs. Hence for
Colombia we investigate decentralization’s effect on the number of children attending
public schools. For Bolivia, the data restricts us to examining whether decentralization
made investment allocations more responsive to local need.13 Due to space constraints,
we present detailed results for education only. It is worth mentioning that we have quite
similar results to those presented here for health and water and sanitation in both
countries, and for urban development and agriculture in Bolivia as well.
4.1 Bolivia
Bolivia decentralized on July 1st, 1994; two-thirds of the municipalities involved
did not exist before 1994. Hence we need an empirical strategy that can cope with the
generalized shock of Bolivian reform. Our aim is to test whether decentralization made
public investment more responsive to local needs. This can be separated into two
questions: (i) did public sector investment patterns change with decentralization? and if
so, (ii) do indicators of need determine that change? Using panel data for the period
1987-1996, we estimate the model

21
Gmt = β1ααααm + β2αααα*m + β3δδδδt + εmt (1)
where αm and δt are vectors of state and year dummy variables, and α*m is the product of
αm and a decentralization dummy variable which takes the values 0 before 1994 and 1
after.14 Investment patterns are thus decomposed into three terms: a year effect, δt, which
captures year shocks and time-specific characteristics; a state effect, αm, which captures
all of the characteristics of a state fixed in time; and a decentralization-interacted state
effect, α*m, which captures state-specific characteristics that begin in 1994. By
construction, this last term captures the effects of local government, local civic
associations and other local institutions that emerged after reform, and locally-specific
social and political factors more generally. Any systemic changes in Bolivia’s politics or
economy that affect all municipalities similarly, such as a national policy initiative or an
external shock, will be captured by the year term, δt.
We then perform three tests:
1. β1 = β2 This simple t-test determines whether αm and α*m (national means) are
significantly different for each sector. Significance implies that decentralization
changed national investment patterns through the actions of local governments.
2. β1m = β2m This F-test determines whether αm and α*m are different municipality by
municipality. A significant F-test implies that decentralization changed local
investment patterns in a particular municipality. Significance in many municipalities
constitutes stronger evidence that decentralization changed national investment
patterns in that sector.
3. Lastly, we place the differences in state dummy coefficients on the LHS and estimate
the model

22
β2–β1 = ζSm + ηZm + �Pm + εm (2)
where S is a vector of the existing stock of public services at an initial period; Z is a
vector of measures of civil institutions, private sector dynamism, and municipal
project planning procedures, all local and only relevant after decentralization; and P
is a vector of political participation and the prevalence of left-wing ideology. All are
indexed by municipality m. This approach isolates the changes in investment patterns
resulting from decentralization, and then examines its determinants.
By construction β2 – β1 should be unrelated to all factors which remain constant between
the two periods, and thus we omit socio-economic, regional and other variables that do
not change with decentralization. We assume that the variables in Z and S are constant
over the period in question.15 We report results for tests 1 and 2 for ten sectors (as
defined by Bolivia’s finance ministry). We report results from test 3 only for education.
There are literally dozens of variables that might be included in the Z vector,
covering such specific items as municipal employee characteristics and decision-making
processes, and how investment projects are planned and written into the local budget.16
We use principal component analysis to reduce very specific Z-type variables into more
useful indicators that are conceptually coherent and manageable. We construct three
principal component variables characterized as follows:
PCV Variable No. Interpretation: Variable increases in… Private sector 1 Dynamism of the local private sector Project planning 1 Informed project planning that follows open and consensual procedures Civil institutions 1 Strength of local civil institutions and organizations

23
This empirical strategy follows Faguet’s (2004) treatment of decentralization in Bolivia.
Annex 1 provides further methodological details.
The main variable of interest in test 3 is S, which we interpret as a district’s need
for additional public investment. We use three measures of illiteracy and literacy rates,
plus the existence of a functioning local education authority, as rough indicators of the
level of education provision in each municipality. Assuming that the marginal utility of a
public service falls as the level of that service rises, we interpret high illiteracy (low
literacy) rates as indicative of a greater need for additional education investment. The
existence of a properly constituted local education authority similarly indicates higher
provision, and hence lower need. We thus expect coefficient ζ to be positive when
illiteracy rates are used, and negative when the literacy rate is used. This would imply
that decentralization led government to invest more heavily in places where existing
levels of education were low. A positive coefficient, by contrast, would imply that
decentralization accentuated educational disparities, as better provided municipalities
received higher levels of additional investment.
The variables in Z are not only controls. Their coefficients, η, are of interest
insofar as they help explain the mechanisms by which local government is more (or less)
responsive than central government to real local need. The case put forward by political
scientists17 for local government’s superior assessment of local preferences includes
greater sensitivity to grass-roots demand, greater accessibility of local lobby groups to
local government, and greater political accountability to the local populace. Some of the
ways in which this can happen include the use of open, informed planning techniques,
and the existence of private sector and civic organizations that are strong and dynamic.
24
Remember that such local factors were not relevant to central decision-making, which
occurred at the center. Variables P capture another local feature that changed
significantly with decentralization: the power of relatively small groups of voters to
influence policy makers’ decisions via local elections. We expect districts where
electoral participation increased with decentralization to be less subject to the sort of
capture that Bardhan and Mookherjee (1999) analyze. And left-wing parties’ share of the
vote captures an underlying local ideological characteristic that should increase education
investment independently of need.
4.2 Colombia
Reform in Colombia was more gradual, phased in over a number of years. We
can take advantage of this fact to construct for Colombia continuous variables that
captures advancing reform, and use panel estimations that incorporate much more
information than is possible for Bolivia. And as noted above, the availability of higher-
quality data further allow us to investigate decentralization’s effect on real policy outputs,
and not just changes in resource inputs. Section 3 showed that decentralization in
Colombia was associated with a marked increase in the number of state-school students.
In order to investigate this relationship more rigorously, we estimate the model
∆Smt = α + ζDmt + βRmt + γPmt + δCmt + εmt (3)
where ∆S is the year-on-year increase in student enrollment in state schools, D is a vector
of measures of where municipalities lie on the decentralization-centralization continuum,
R is a vector of measures of resource availability (i.e. supply factors) that might
independently increase student enrollment, P is a vector of variables measuring political
25
participation and engagement, and C is a vector of socio-economic and geographic
controls, all indexed by municipality m and year t.
Our measures of decentralization, D, are based on municipal expenditures in
education broken down by source of revenue. They measure different levels of autonomy
in municipal decision-making and resource commitment. The first is own resources –
revenue raised from local taxes and charges – as a share of total expenditure. Such funds
have no strings attached, and are at the free disposal of local governments to spend as
they like. The second variable, Municipal Independence, is a dummy that records which
municipalities are “certified”, and so receive transfers directly from central government,
and not via the departmental (i.e. regional) level. Departments have discretion in how
they pass on funds destined for municipal uses, and so certified municipalities are more
independent of departmental influence and meddling. Local governments that score
higher in these two variables are substantively more decentralized than the rest.
The third variable records the share of total educational expenditure accounted for
by central transfers allocated according to poverty indices.18 In 2001, Law 715 changed
this allocation mechanism to one based on the number of state school students. Hence
the last D variable, which records central transfers based on student numbers as a share of
total expenditure (for the period 2002-04). Municipalities with higher values in these
indicators face stronger incentives set by the center, and are thus much more
“centralized”. The coefficients of these four D variables, ζ1... ζ4 are our main interest in
this regression. If decentralization drives increases in enrollment, then we would expect
ζ1 and ζ2 to be positive, and ζ3 and ζ4 to be negative or insignificant.

26
Other factors which might affect student enrollment independently of
decentralization include how richly a municipality funds its schools, and the general
bouyancy of municipal revenues. We control for such effects with R, which includes two
terms for municipalities’ general expenditure growth (separated into the periods before
and after Law 715), a term for per capita expenditure on education, and one for the
student-teacher ratio.
Political controls P include overall turnout and the mayor’s electoral support,
again separated into two periods before and after the 2001 law; dummy variables for
mayors from the Liberal or Conservative parties; and the share of total municipal
personnel who are university graduates, as a measure of local government’s institutional
capacity. Lastly, the variables in C control for municipal size, wealth, inequality,
unemployment, and what region it is in, as well as the 1999 recession. We also include
measures of a municipality’s displaced population, separated between those that receive
migratory flows and those that expel them, as rough proxies for how much a locality has
been impacted by Colombia’s armed conflict. Two final terms, the gross enrollment rate
and the proportion of the school-age population attending private education, capture level
effects and complementarities between public and private enrollment.
5. Decentralization’s Effects – More Rigorous Evidence
This section lays out rigorous econometric evidence that decentralization made
public investment flows more responsive to real local needs in Bolivia, and led to
substantive improvements in service delivery in Colombia. We present econometric
models of decentralization’s effects on education investment that cover the universe of
Bolivian municipalities and over 85% of Colombian municipalities.

27
5.1 Bolivia
Figure 8 shows the results for tests 1 and 2. Using national mean values, the null
hypothesis, β1 = β2, can be rejected for eight of the ten sectors tested. Only in health and
energy did decentralization appear to make no difference to public investment patterns.
Test 2 shows the number of municipalities where we can reject the hypothesis β1m = β2m.
Five sectors pass this more demanding test: education, water & sanitation, agriculture,
urban development and water management. In three sectors, β1 � β2 with high levels of
confidence when national means are used, whereas using local values, β1m = β2m almost
everywhere. This combination of results implies that reform led to very large shifts in
investment flows in a small number of municipalities, and insignificant changes
everywhere else.
Individual MunicipalityTest Test Tests Significant, by
Sector β2−β1 t-statistic P Value Number Percent
Education 0.01558 22.798 0.0000 209 71%
Water & Sanitation -0.01548 -17.343 0.0000 224 76%
Agriculture -0.01402 -8.667 0.0000 65 22%
Urban Development 0.00484 5.324 0.0000 107 36%
Water Management 0.00107 2.932 0.0034 105 36%
Transport -0.10616 -5.967 0.0000 29 10%
Communication -0.00246 -4.011 0.0001 7 2%
Industry & Tourism -0.00171 -3.768 0.0002 7 2%
Health -0.00117 -1.540 0.1238 49 17%
Energy -0.00475 -1.281 0.2004 7 2%
Test 1 Test 2National Means
Figure 8: Did decentralization change Bolivian investment patterns?
So decentralization did change national investment patterns, and this change was
strongest in education, water, urban development and agriculture. Section 3 showed that

28
education’s share of local investment rose impressively after decentralization, and test 1
concurs. Was this rise a function of local educational need? Test 3 explores this question
by investigating the determinants of the difference in state dummy variables, β2 – β1,
equivalent to the investment increase attributable to decentralization (see figure 9).
Test 3: β: β: β: β2– ββββ1 = ζζζζSm + ηηηηZm + γγγγPm + εεεεm
Independent Variable 1 2 3 4Illiteracy Rate (Adult) 0.00017 *** 0.0001637 **
(2.910) (2.020)Illiteracy Rate (Over-6) 0.0001838 **
(2.500)Literacy Rate -0.000106 *
-1.84Local Education Authority 0.0056 0.0054333 0.005337 0.0060453
(1.420) (1.380) (1.360) (1.350)Civil Institutions PCV1 0.00097 * 0.0010271 * 0.0010123 * 0.0009862
(1.750) (1.840) (1.770) (1.540)Private Sector PCV1 -0.00098 ** -0.00106 *** -0.001211 *** -0.000851 **
(-2.470) (-2.690) (-3.000) (-2.100)Project Planning PCV1 -0.00054 -0.000548 -0.000488 -0.000537
(-0.920) (-0.930) (-0.830) (-0.910)Change in Electoral -2.55E-05 (*) Absenteeism (1993-95) (-1.620)
Left-Wing Parties Share -0.000128of the Vote, 1995 (-0.860)
constant 0.00758 * 0.0080641 * 0.0203711 *** 0.0101111 ***(1.810) (1.820) (3.730) (3.650)
R-squared 0.0176 0.0162 0.0136 0.021Prob > F 0.001 0.002 0.003 0.001OLS regressions reported with robust standard errors; t-statistics in parenthesesPCV1 = 1st pricipal component variable*, **, *** = coefficients significant at the 10%, 5% and 1% levels
Model
Figure 9: Decentralization's Effect on Education Investment in Bolivia
Under decentralization, investment rises as illiteracy rises and as literacy falls.
This implies that local governments invested more than central government in education
services in places where the stock of education was lower. The existence of a functioning
29
local education authority appears to have no effect. These results are insensitive to
different measures of illiteracy, and to different specifications, as figure 9 shows. Hence
in a context of rising education investment nationwide, municipalities where education
indicators were disproportionately poor made disproportionately large investments in
new or improved schooling. Conversely, those where education indicators were
unusually good saw increases below the mean, choosing instead to prioritize other
sectors.19 We interpret this as evidence that decentralization made education investment
more responsive to real local need than it had been under central government.
Education investment rises where civil institutions are more vigorous, but falls
where the private sector is stronger. Both institutional features are examples of local
actors that would have had almost no voice under centralized policy making, but whose
influence was was greatly increased by decentralization. We interpret these results as a
sign of local political competition between opposing forces: on one hand grass roots civic
support for better education services – i.e. parents worried about their children; and on
the other, private firms lobbying for resources to flow to other sectors where they stand to
profit more.20 Informed, participative project planning methodologies appear to have no
effect. Left-wing parties’ share of the vote is also insignificant. The change in electoral
absenteeism has the expected sign, and is thus consistent with the civil institutions
variable, but is only significant at the 11% level. These results confirm those of Faguet
(2004) and extend them with the inclusion of political variables.
5.2 Colombia
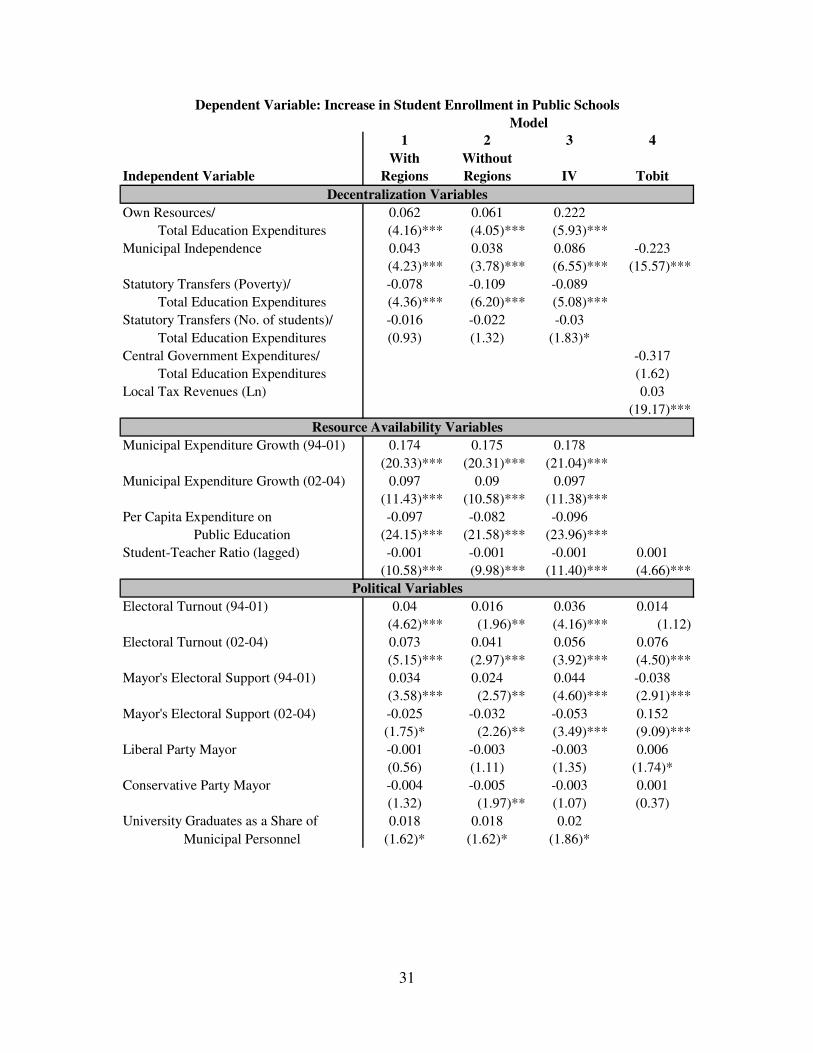
Our results from estimating equation (3) appear in figure 10. Models 1 and 2 are
panel estimations with and without regional dummies. Because there is a possibility of

30
endogeneity between one of our main variables of interest, own resources as a share of
total expenditure, and enrollment growth, model 3 instruments for the former with the log
of local tax revenues. Model 4 provides the Tobit estimation of the instrument. A
separate test for endogeneity gave a negative result, but we provide the results in 3 and 4
anyway for the sake of completeness.
31
1 2 3 4
Independent VariableWith
RegionsWithout Regions IV Tobit
Own Resources/ 0.062 0.061 0.222Total Education Expenditures (4.16)*** (4.05)*** (5.93)***
Municipal Independence 0.043 0.038 0.086 -0.223(4.23)*** (3.78)*** (6.55)*** (15.57)***
Statutory Transfers (Poverty)/ -0.078 -0.109 -0.089Total Education Expenditures (4.36)*** (6.20)*** (5.08)***
Statutory Transfers (No. of students)/ -0.016 -0.022 -0.03Total Education Expenditures (0.93) (1.32) (1.83)*
Central Government Expenditures/ -0.317Total Education Expenditures (1.62)
Local Tax Revenues (Ln) 0.03(19.17)***
Municipal Expenditure Growth (94-01) 0.174 0.175 0.178(20.33)*** (20.31)*** (21.04)***
Municipal Expenditure Growth (02-04) 0.097 0.09 0.097(11.43)*** (10.58)*** (11.38)***
Per Capita Expenditure on -0.097 -0.082 -0.096Public Education (24.15)*** (21.58)*** (23.96)***
Student-Teacher Ratio (lagged) -0.001 -0.001 -0.001 0.001(10.58)*** (9.98)*** (11.40)*** (4.66)***
Electoral Turnout (94-01) 0.04 0.016 0.036 0.014(4.62)*** (1.96)** (4.16)*** (1.12)
Electoral Turnout (02-04) 0.073 0.041 0.056 0.076(5.15)*** (2.97)*** (3.92)*** (4.50)***
Mayor's Electoral Support (94-01) 0.034 0.024 0.044 -0.038(3.58)*** (2.57)** (4.60)*** (2.91)***
Mayor's Electoral Support (02-04) -0.025 -0.032 -0.053 0.152(1.75)* (2.26)** (3.49)*** (9.09)***
Liberal Party Mayor -0.001 -0.003 -0.003 0.006(0.56) (1.11) (1.35) (1.74)*
Conservative Party Mayor -0.004 -0.005 -0.003 0.001(1.32) (1.97)** (1.07) (0.37)
University Graduates as a Share of 0.018 0.018 0.02Municipal Personnel (1.62)* (1.62)* (1.86)*
Dependent Variable: Increase in Student Enrollment in Public SchoolsModel
Decentralization Variables
Resource Availability Variables
Political Variables
32
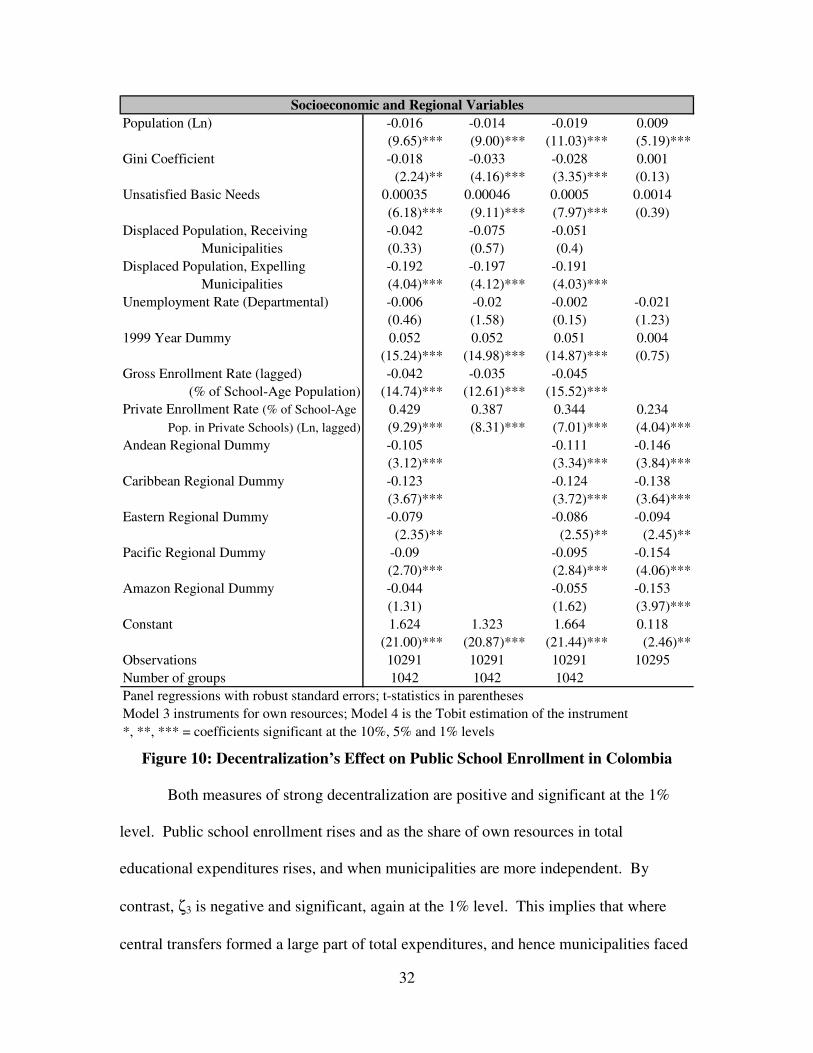
Population (Ln) -0.016 -0.014 -0.019 0.009(9.65)*** (9.00)*** (11.03)*** (5.19)***
Gini Coefficient -0.018 -0.033 -0.028 0.001(2.24)** (4.16)*** (3.35)*** (0.13)
Unsatisfied Basic Needs 0.00035 0.00046 0.0005 0.0014(6.18)*** (9.11)*** (7.97)*** (0.39)
Displaced Population, Receiving -0.042 -0.075 -0.051Municipalities (0.33) (0.57) (0.4)
Displaced Population, Expelling -0.192 -0.197 -0.191Municipalities (4.04)*** (4.12)*** (4.03)***
Unemployment Rate (Departmental) -0.006 -0.02 -0.002 -0.021(0.46) (1.58) (0.15) (1.23)
1999 Year Dummy 0.052 0.052 0.051 0.004(15.24)*** (14.98)*** (14.87)*** (0.75)
Gross Enrollment Rate (lagged) -0.042 -0.035 -0.045(% of School-Age Population) (14.74)*** (12.61)*** (15.52)***
Private Enrollment Rate (% of School-Age 0.429 0.387 0.344 0.234Pop. in Private Schools) (Ln, lagged) (9.29)*** (8.31)*** (7.01)*** (4.04)***
Andean Regional Dummy -0.105 -0.111 -0.146(3.12)*** (3.34)*** (3.84)***
Caribbean Regional Dummy -0.123 -0.124 -0.138(3.67)*** (3.72)*** (3.64)***
Eastern Regional Dummy -0.079 -0.086 -0.094(2.35)** (2.55)** (2.45)**
Pacific Regional Dummy -0.09 -0.095 -0.154(2.70)*** (2.84)*** (4.06)***
Amazon Regional Dummy -0.044 -0.055 -0.153(1.31) (1.62) (3.97)***
Constant 1.624 1.323 1.664 0.118(21.00)*** (20.87)*** (21.44)*** (2.46)**
Observations 10291 10291 10291 10295Number of groups 1042 1042 1042Panel regressions with robust standard errors; t-statistics in parenthesesModel 3 instruments for own resources; Model 4 is the Tobit estimation of the instrument*, **, *** = coefficients significant at the 10%, 5% and 1% levels
Socioeconomic and Regional Variables
Figure 10: Decentralization’s Effect on Public School Enrollment in Colombia
Both measures of strong decentralization are positive and significant at the 1%
level. Public school enrollment rises and as the share of own resources in total
educational expenditures rises, and when municipalities are more independent. By
contrast, ζ3 is negative and significant, again at the 1% level. This implies that where
central transfers formed a large part of total expenditures, and hence municipalities faced

33
strong incentives set by the center, public enrollment fell. The fourth D variable, again of
relative centralization, is negative but insignificant.21 These results are not sensitive to
the specifications used, and persist when the own resources variable is instrumented. We
interpret this as evidence that decentralization of education has led to improved
educational outcomes in Colombia, in the sense of more students attending school. By
contrast, in those places where central control persists outcomes have worsened.
Supply-side measures of resources availability are all strongly significant. They
show that enrollment increases as expenditure grows, and falls with the student-teacher
ratio, as one would expect. Curiously, the per capita expenditure term is also negative.
This implies that raising student numbers is not a simple question of increasing the
education budget, but rather based on other factors, such as how and where funds are
invested.
Amongst our political controls, voter turnout is positive and strongly significant,
implying a stronger effect on enrollment in places where voters are engaged and
participate in politics. Strong electoral support for the mayor also increases enrollment
before 2002, although curiously the sign turns negative thereafter. The ideology/party
affiliation of the mayor does not seem to matter, nor does the quality of local
government’s human resources. Of our socioeconomic and geographic controls, results
of interest include the first three coefficients, implying that smaller, poorer, relatively
more equal districts saw greater increases in enrollment. Public enrollment also rises
with the share of students attending private schools, indicating complementarity between
the public and private education systems. This contradicts the impression of substitution
between public and private enrollment implied in figure 7. Decentralization appears not
34
to improve public schooling at the expense of private schools, but rather to promote the
idea of education more generally. Other control variables capturing the impact of
Colombia’s armed violence, the 1999 recession, level effects, and a district’s region are
also significant.
6. Conclusions The experiences of Bolivia and Colombia vindicate some of the central claims in
favor of decentralization. In both countries decentralization shifted public investment
patterns in important ways, switching resources out of infrastructure and into primary
social services such as education and water & sanitation. Bolivian education investment
became more responsive to real local needs as a result, rising disproportionately in areas
with the worst education indicators. As an implicit targeting strategy this is efficient, and
probably served to improve educational outcomes, especially in rural areas.
Unfortunately, data constraints to not allow us to test this theory.
But we can for the case of Colombia, and the results are positive: decentralization
improved enrollment rates in public schools. In districts where educational finance and
policy making were most free of central influence, enrollment increased. In districts
where educational finance was still based on centrally-controlled criteria, enrollment fell.
Further evidence suggests that this was not the simple result of increasing financing
levels, but due instead to the quality of investment that municipalities achieved – to how
and where funds were spent. Of course, enrollment is only a proximate educational
outcome; deeper outcomes of interest include literacy, numeracy and standardized test
results. Data limitations prevent us from using such variables here. Based on the results
35
above, however, we would expect to see improving literacy rates as a result of
decentralizing education in the medium to long term.
It is striking that in both countries, the major policy changes identified were
driven by the behavior of the smallest, poorest, most rural municipalities. In Bolivia, this
is largely due to the fact that central government traditionally ignored such places, and
their inhabitants, who benefitted from the equalization shock that decentralization
wreaked on Bolivia’s public finances. The latter is not true for Colombia, where central
government invested much more equitably prior to reform. In both countries,
decentralization empowered the smallest, poorest districts disproportionately, and their
collective response altered patterns of national investment, and – in the case of Colombia
– substantive policy outcomes as well.
In both countries, reform changed not only the form of government but also its
substance. Before decentralization, central officials stationed beyond national and
regional capitals had little incentive to concern themselves with local demands. Career
success was determined by ministerial fiat unrelated to local outcomes in distant districts.
Throughout most of each country, ordinary citizens’ ordinary concerns were given little
attention. Decentralization changed this by creating local authorities beholden to local
voters. Nationwide, it put real power over public resources in the hands of ordinary
citizens. And it changed the way both countries are run.
36
Bibliography Alesina, A., A. Carrasquilla and J.J. Echavarría. 2000. “Decentralization in Colombia.” Fedesarrollo
Working Paper No. 15. Bogotá: Fedesarrollo.
Andersson, K. “Who Talks with Whom? The Role of Repeated Interactions in Decentralized Forest Governance.” World Development, 32: 233-249.
Bahiigwa, G., D. Rigby and P. Woodhouse. 2005. “Right Target, Wrong Mechanism? Agricultural Modernization and Poverty Reduction in Uganda.” World Development, 33: 481-496.
Bardhan, P. and D. Mookherjee. 1998. “Expenditure Decentralization and the Delivery of Public Services in Developing Countries.” Working Paper No. C98-104. Berkeley: Center for International and Development Economics Research.
1999. “Relative Capture of Local and Central Governments: An Essay in the Political Economy of Decentralization.” Berkeley: Manuscript.
Besley, T. and S. Coate. 1999. “Centralized versus Decentralized Provision of Local Public Goods: A Political Economy Analysis.” NBER Working Paper 7084. Cambridge, MA: National Bureau of Economic Research.
Bewley, T. 1981. “A Critique of Tiebout’s Theory of Local Public Expenditure.” Econometrica, 49:713-39.
Bird, R. 1994. “Decentralizing Infrastructure: For Good or Ill?” Policy Research Working Paper 1258. Washington DC: World Bank.
Blair, H. 2000. “Participation and Accountability at the Periphery: Democratic Local Governance in Six Countries.” World Development, 28: 21-39.
Campbell, T. 2001. The Quiet Revolution: The Rise of Political Participation and Leading Cities with Decentralization in Latin America and the Caribbean. Pittsburgh: University of Pittsburgh Press.
Casson, A. and K. Obidzinski. 2002. “From New Order to Regional Autonomy: Shifting Dynamics of “Illegal” Logging in Kalimantan, Indonesia.” World Development, 30: 2133-2151.
Ceballos, M. and D. Hoyos. 2004. “Tendencias del Comportamiento Electoral y Descentralización en los Municipios de Colombia, 1988-2000.” Crisis States Programme Working Paper No. 57, London School of Economics.
Conyers, D. 1984. “Decentralization and Development: A Review of the Literature.” Public Administration and Development, 4: 197-97.
Crook, R. C. and A. S. Sverrisson. 1999. “To What Extent Can Decentralized Forms of Government Enhance the Development of Pro-Poor Policies and Improve Poverty-Alleviation Outcomes?” Manuscript.
Dillinger, W. and S. B. Webb. 1999. “Decentralization and Fiscal Management in Colombia.” Policy Research Working Paper 2122. Washington, DC: World Bank.
Dunkerley, J. 1984. Rebellion in the Veins: Political Struggle in Bolivia 1952-82. London: Verso.
Ellis, F. and G. Bahiigwa. 2003. “Livelihoods and Rural Poverty Reduction in Uganda.” World Development, 31: 997-1013.
Ellis, F., M. Kutengule and A. Nyasulu. 2003. “Livelihoods and Rural Poverty Reduction in Malawi.” World Development, 31: 1495-1510.

37
Ellis, F. and N. Mdoe. 2003. “Livelihoods and Rural Poverty Reduction in Tanzania.” World Development, 31: 1367-1384.
Faguet, J. P. 2004. “Does Decentralization Increase Responsiveness to Local Needs? Evidence from Bolivia.” Journal of Public Economics, 88: 867-894.
Fisman, R. and R. Gatti. 2000 . “Decentralization and Corruption: Evidence across Countries.” Working Paper No. 2290. Washington, DC: World Bank.
Fiszbein, A. 1997. “The Emergence of Local Capacity: Lessons from Colombia.” World Development, 25: 1029-1043.
Francis, P. and R. James. 2003. “Balancing Rural Poverty Reduction and Citizen Participation: The Contradictions of Uganda’s Decentralization Program.” World Development, 31: 325-337.
Gonzales-Arana, G. 1992. El Proceso de Descentralisación Administrativa en Bolivia. La Paz: Los Amigos del Libro.
Gray, G. and C. H. Molina. 1997. “Popular Participation and Decentralization in Bolivia: Building Accountability From the Grass Roots.” La Paz: Manuscript.
Grupo DRU, Unidad de Investigación y Analisis, Secretaría Nacional de Participación Popular. 1996. Participación Popular: Avances y Obstáculos. G. Rojas. (ed.). La Paz: CID.
Huther, J. and A. Shah. 1998. “Applying a Simple Measure of Good Governance to the Debate on Fiscal Decentralization.” Policy Research Working Paper 1894. Washington, DC: World Bank.
Klein, H. 1993. Historia de Bolivia. La Paz: Libreria-Editorial Juventud.
Larson, A. M. 2002. “Natural Resources and Decentralization in Nicaragua: Are Local Governments Up to the Job?” World Development, 30: 17-31.
Manor, J. 1999. The Political Economy of Democratic Decentralization. Washington, DC: The World Bank.
Maro, P. S. 1990. “The Impact of Decentralization on Spatial Equity and Rural Development in Tanzania.” World Development, 18: 673-693.
Martinez-Vazquez, J. and R. McNab. 2003. “Fiscal Decentralization and Economic Growth.” World Development, 31: 1597-1616.
McCarthy, J. 2004. “Changing to Gray: Decentralization and the Emergence of Volatile Socio-Legal Configurations in Central Kalimantan, Indonesia.” World Development, 32: 1199-1223.
de Mello, Jr, L. R. 2000. “Fiscal Decentralization and Intergovernmental Fiscal Relations: A Cross-Country Analysis.” World Development, 28: 365-380.
Musgrave, R. A. 1959. The Theory of Public Finance. New York: McGraw-Hill.
Nickson, R. A. 1995. Local government in Latin America. Boulder: L. Rienner.
Nygren, A. 2005. “Community-Based Forest Management Within the Context of Institutional Decentralization in Honduras.” World Development, 33: 639-655.
Oates, W. 1972. Fiscal Federalism. New York: Harcourt Brace.
de Oliveira, J. A. P. 2002. “Implementing Environmental Policies in Developing Countries Through Decentralization: The Case of Protected Areas in Bahia Brazil.” World Development, 30: 1713-1736.
D. Olowu and J. S. Wunsch. 1990. The Failure of the Centralized State: Institutions and Self-Governance in Africa. Boulder, CO: Westview Press.
38
Ostrom, E., L. Schroeder and S. Wynne. 1993. Institutional Incentives and Sustainable Development: Infrastructure Policies in Perspective. Boulder: Westview Press.
Parker, A. 1995. “Decentralization: The Way Forward for Rural Development?” Policy Research Working Paper 1475. Washington, DC: World Bank.
Parry, T. R.. 1997. “Achieving Balance in Decentralization: A Case Study of Education Decentralization in Chile.” World Development, 25: 211-225.
Petro, N. N. 2001. “Creating Social Capital in Russia: The Novgorod Model.” World Development, 29: 229-244.
Piriou-Sall, S. 1998. “Decentralization and Rural Development: A Review of Evidence.” Washington, DC: Manuscript.
Porter, G. 2002. “Living in a Walking World: Rural Mobility and Social Equity Issues in Sub-Saharan Africa.” World Development, 30: 285-300.
Prud’homme, R. 1995. “On the Dangers of Decentralization.” World Bank Research Observer, 10:210-26
Putnam, R. D. 1993. Making Democracy Work: Civic Traditions in Modern Italy. Princeton: Princeton University Press.
Rojas, G. And L. Verdesoto. 1997. La Participación Popular como Reforma de la Política: Evidencia de una Cultura Democrática Boliviana. La Paz: Muela de Diablo.
Rondinelli, D. A., G. S. Cheema and J. Nellis. 1983. “Decentralization in Developing Countries: A Review of Recent Experience.” World Bank Staff Working Paper No.581. Washington, DC: World Bank.
Rowland, A. M. 2001. “Population as a Determinant of Local Outcomes under Decentralization: Illustrations from Small Municipalities in Bolivia and Mexico.” World Development, 29: 1373-1389.
Samoff, J. 1990. “Decentralization: The Politics of Interventionism.” Development and Change, 21:513-30.
Secretaría Nacional de Participación Popular, Ministerio de Desarrollo Sostenible y Medio Ambiente, 1994. Ley de Participación Popular, Reglamento de las Organizaciones Territoriales de Base. La Paz.
Semboja, J. and O. Therkildsen. 1994. “Decentralization, Participation and Spatial Equity in Rural Tanzania: A Comment.” World Development, 22: 807-810.
Shah, A. 1994. “The Reform of Inter-Governmental Fiscal Relations in Developing and Emerging Market Economies.” Policy and Research Series Paper 23. Washington DC: World Bank.
Shankar, R. and A. Shah. 2003. “Bridging the Economic Divide Within Countries: A Scorecard on the Performance of Regional Policies in Reducing Regional Income Disparities.” World Development, 31: 1421-1441.
Slater, D. 1989. “Territorial Power and the Peripheral State: The Issue of Decentralization.” Development and Change, 20:501-31.
Smith, B.C. 1985. Decentralization: The Territorial Dimension of the State. London: George Allen & Unwin.

39
Smoke, P. 2001. “Fiscal Decentralization in Developing Countries: A Review of Current Concepts and Practice.” Democracy, Governance and Human Rights Programme Paper No. 2. Geneva: UNRISD.
Sundar, N. 2001. “Is Devolution Democratization.” World Development, 29: 2007-2023.
Tiebout, C. M. 1956. “A Pure Theory of Local Expenditures.” Journal of Political Economy, 64:416-24.
Thun, E. 2004. “Keeping Up with the Jones’: Decentralization, Policy Imitation, and Industrial Development in China.” World Development, 32: 1289-1308.
Tuchschneider, D. 1996. “Una Visión desde la Planificación Participativa Municipal.” In Grupo DRU, UIA-SNPP. Participación Popular: Avances y Obstáculos. G. Rojas. (ed.). La Paz: CID.
Unidad de Comunicación, Secretaría Nacional de Participación Popular. 1995. Debate Nacional sobre la Ley de Participación Popular. La Paz: Secretaría Nacional de Participación Popular
United Nations Development Program (UNDP). 1993. Informe Sobre Desarrollo Humano 1993. Madrid: CIDEAL.
Wallis, J. J. and W. E. Oates. 1988. “Decentralization in the Public Sector: An Empirical Study of State and Local Government.” In H.S. Rosen (ed.). Fiscal Federalism: Quantitative Studies. Chicago: University of Chicago Press.
Weingast, B. R. 1995. “The Economic Role of Political Institutions: Market-Preserving Federalism and Economic Development.” Journal of Law, Economics, & Organization, 11:1-31.
Wiggins, S., K. Marfo and V. Anchirinah. 2004. “Protecting the Forest or the People? Environmental Policies and Livelihoods in the Forest Margins of Southern Ghana.” World Development, 32: 1939-1955.
Woodhouse, P. 2003. “African Enclosures: A Default Mode of Development.” World Development, 1705-1720.
World Bank. 1994. World Development Report: Infrastructure for Development. New York: Oxford University Press.
1This research was financed by the World Bank Research Committee and the DFID-LSE Crisis States
Programme. We are very grateful to Carolina Mejía o quien ??? for expert research assistance, and to
Pranab Bardhan, Tim Besley, Teddy Brett, Shanta Devarajan, James Dunkerley, John Harriss, Luis Felipe
López, Mauricio Merino, three anonymous referees and seminar participants at the CSP-Delhi and UNDP-
Mexico meetings for their thoughtful suggestions. All remaining errors are ours.
2 Lecturer in the Political Economy of Development, Development Studies Institute and STICERD, London
School of Economics, Houghton Street, London WC2A 2AE

40
3 Professor of Economics and Director of CEDE, Universidad de los Andes, Carrera 1 Nº 18A-70, Bloque
C, Bogotá, Colombia
4 Ellis and Bahiigwa (2003), p.1010.
5 At the time MNR strategists gleefully predicted such a result. They proved wrong.
6 “Injertos Tramposos en ‘Participación Popular’”, Hoy, 19 January 1994; “La Declaratoria de Guerra del
Primer Mandatario”, La Razon, 27 January 1994; and “Arrogancia Insultante”, Presencia, 27 February
1994 are only three of the many articles which appeared in the Bolivian press documenting popular
reaction to the “Damned Law”. These are documented in Unidad de Comunicación (1995).
7 Sánchez et al., 2000, show that central transfers grew from 2% of GDP in 1990 to almost 7% in 1997.
8 The Frente Nacional (1957-74) quelled La Violencia by sharing out the fruits of power equally between
Liberals and Conservatives, and restricting electoral competition to those two parties.
9 There is no obvious way to go beyond this simple exclusion in distinguishing appropriate from
inapropriate local investments, especially when categorized sectorally per above. Most local energy
investments by number were rural electricity schemes, for example, while a number of education projects
involved attempts to establish tertiary educational institutions.
10 A hodgepodge, including feasibility studies, technical assistance and emergency relief, that is difficult to
categorize.
11 This point is developed further below.
12 The last year for which comprehensive data are available.
13 We believe it is preferable to push the analysis as far as each country’s data will allow, as opposed to
limiting the Colombian analysis for the sake of symmetry.
14 Thus α*m takes the value 0 for all municipalities and all years before 1994, and is identical to αm for all
years from 1994 onwards.
15 This is reasonable for most of the Z variables, which tend to change slowly over longer periods of time.
It is less reasonable for S. Unfortunately the data leave no choice.
16 There are, for example, eighteen variables concerning the types of capacity-building programs that
municipalities received after 1994, and eleven more on programs they may have requested.

41
17 See for example Wolman in Bennet (1990).
18 The proportion of the local population above a predetermined level of unsatisfied basic needs.
19 The small number of municipalities with significant unspent sums implies that the money was spent
elsewhere, not left in the bank.
20 Our results for urban development – typically big, expensive construction projects – where private sector
lobbying is strongly positive, support this interpretation.
21 Possibly because there is too little data from the short time span in question (2002-04).