decision analysis dr m g dawes centre for evidence based medicine
TRANSCRIPT

Decision Analysis
Dr M G DawesCentre for Evidence Based
Medicine

Contents What is Decision Analysis? Decision Trees How they work Critical Appraisal of Decision
Analysis A bit on economics An example of some software

What is Decision Analysis? Urinary Tract Infection Patient presents with symptoms What would happen if you opted
for one path in preference to another
On what basis would you assess outcome

How does one start? List all the options and display: Commonly accepted format is a
tree diagram.UTI
Decision Node
Treat
Don’t Treat
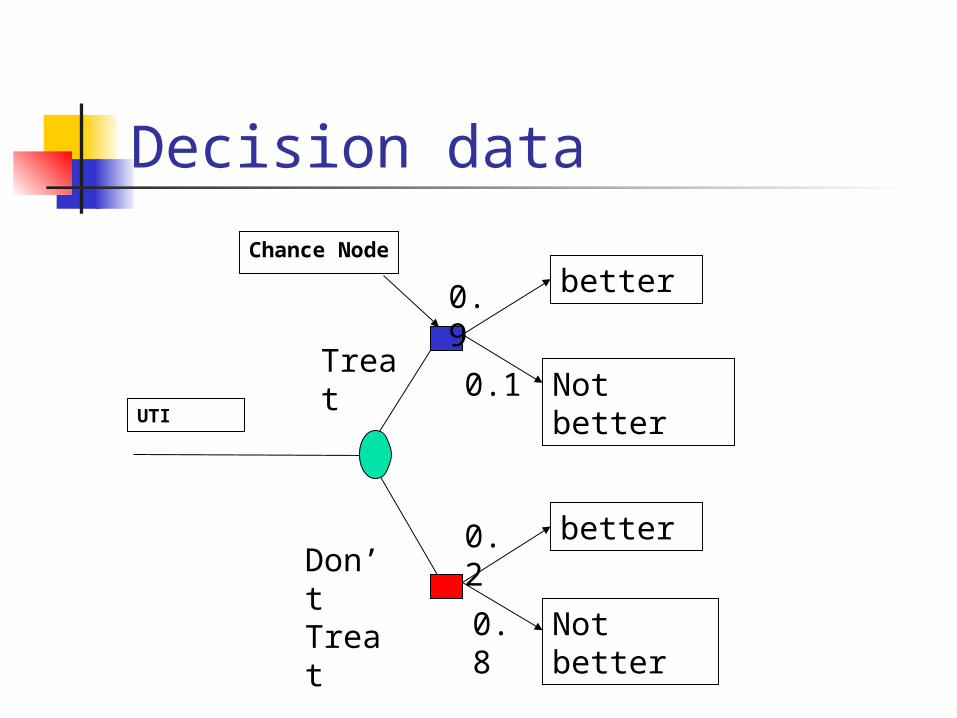
Decision data
UTI
Chance Node
Treat
Don’t Treat
better
Not better
better
Not better
0.9
0.1
0.2
0.8

Result 0.9 is better than 0.2
UTI
Chance Node
Treat
Don’t Treat
better
Not better
better
Not better
0.9
0.1
0.2
0.8

Add reality to probability scores Cost of tests Cost of treatment Days lost from work Cost of re attending clinician
Multiply the probabilities by the costs

Cost Data
UTI
Treat
Don’t Treat
better
Not better
better
Not better
0.9
0.1
0.2
0.8
2
9
2
9
Costs

Rollback Costs
UTI
Treat
Don’t Treat
better
Not better
better
Not better
0.9
0.1
0.2
0.8
2
9
2
9
(2*0.9) + (9*0.1)=2.7
(0.2*2)+(0.8*9)=7.6
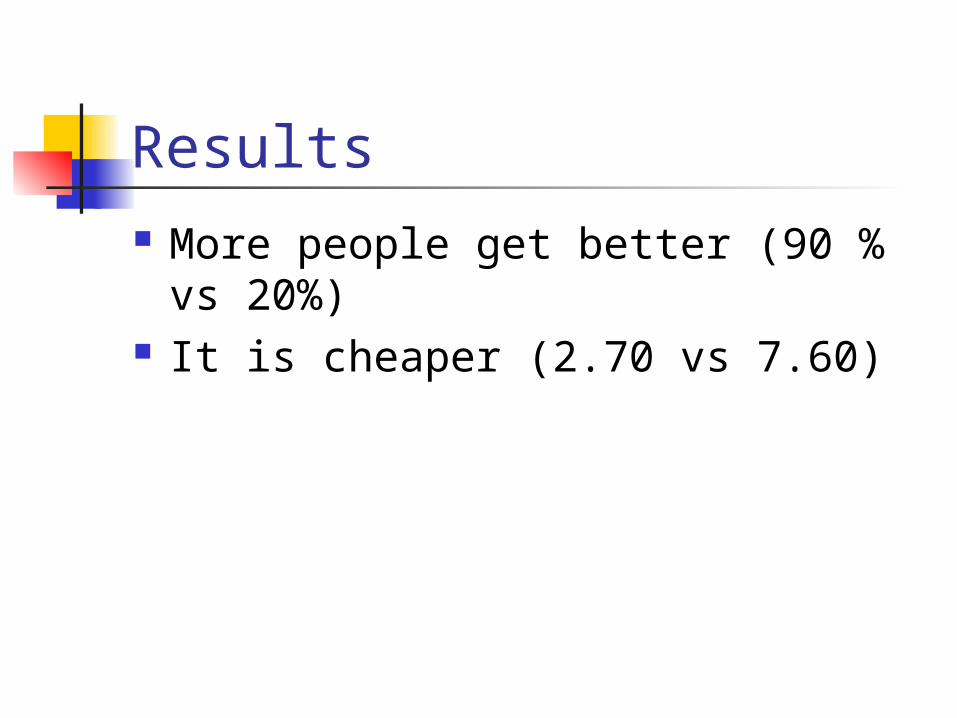
Results More people get better (90 % vs
20%) It is cheaper (2.70 vs 7.60)

What does the patient think? Utilities How would you feel? QALYs Quality adjusted life year

QALY’s
Survival in years
01 2 3 4 5 6
1.0
Qualityof life
valuation
Health profile with intervention
Health profilewithout intervention
Quality adjusted life years gained
From Alastair Gray

Time Trade Off Method (to assess utility of a health state) You have arthritis (severe - unable to
walk to shops – need a buggy – in pain most of the time) and are aged 48
Choose between living with arthritis until 80 or living in perfect health for a shorter length of time
eg 50 60 70 If 70 – 65 67 69 71 73 75 Etc until chosen a year

Time Trade Off Utility is 1- (number of years
willing to give up/(80-current age) If age selected was 75 Utility = 1-(80-75)/(80-48) = 0.84 The better your health the less the
years you give up

Trade Off vs AgeTrade off calculation of utility
00.10.20.30.40.50.60.70.80.9
1
40 42 44 46 48 50 52 54 56 58 60 62 64 66 68 70 72
Age (years)
Uti
lity
Trade off 2 Trade off 4 Trade Off 6

Utilities
UTI
Treat
Don’t Treat
better
Not better
better
Not better
0.9
0.1
0.2
0.8
9
2
9
2
Utilities

Rollback
UTI
Treat
Don’t Treat
better
Not better
better
Not better
0.9
0.1
0.2
0.8
9
2
9
2
(9*0.9) + (2*0.1)=8.3
(0.2*9)+(0.8*2)=3.4
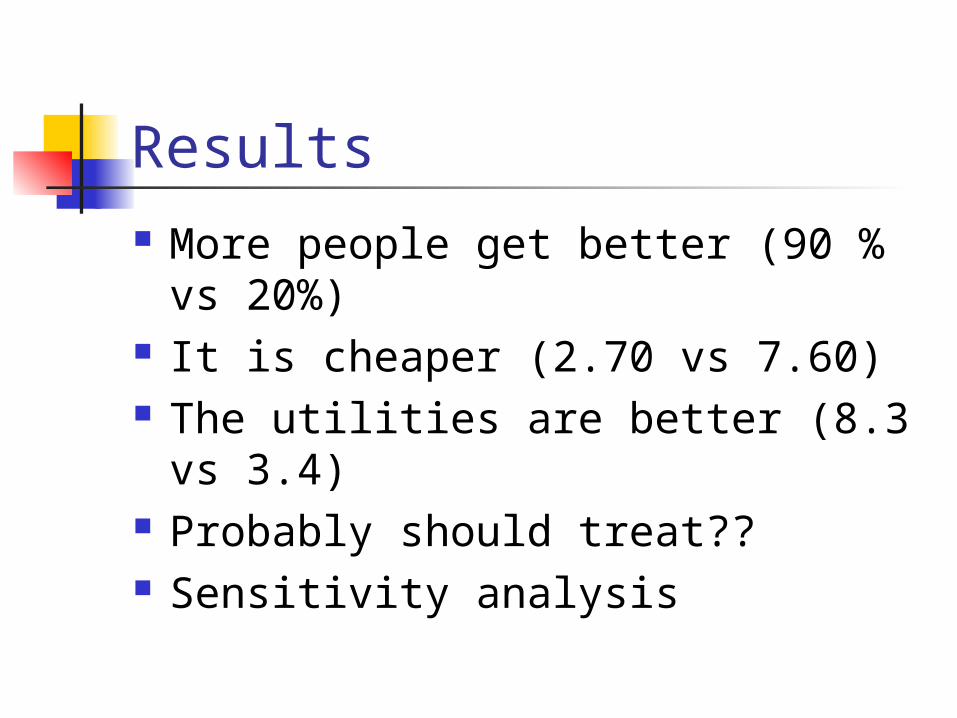
Results More people get better (90 % vs
20%) It is cheaper (2.70 vs 7.60) The utilities are better (8.3 vs 3.4) Probably should treat?? Sensitivity analysis
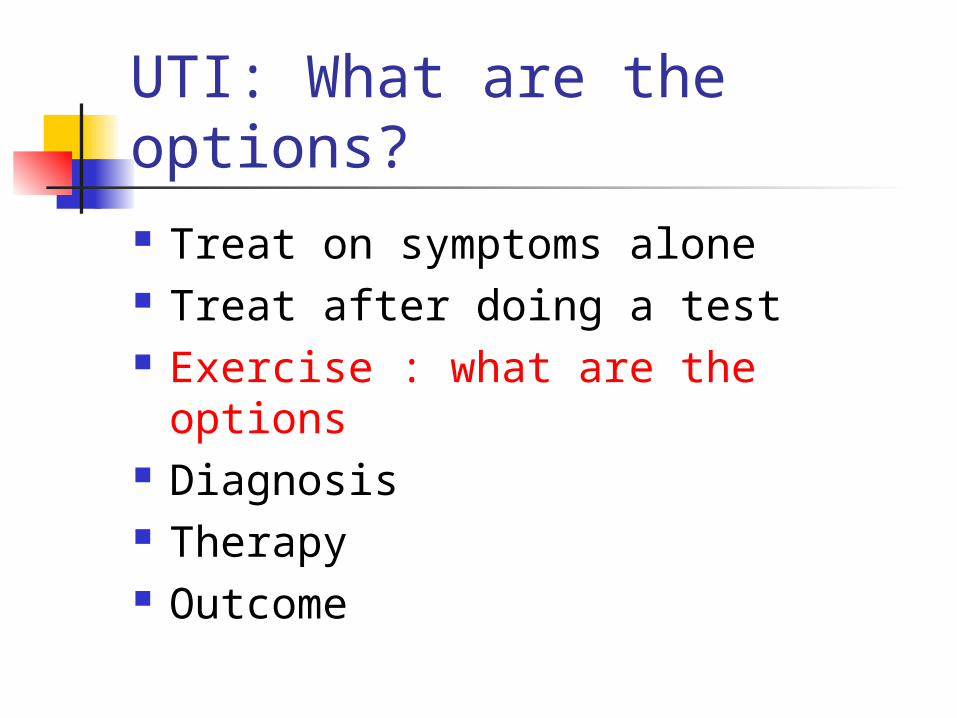
UTI: What are the options? Treat on symptoms alone Treat after doing a test Exercise : what are the options Diagnosis Therapy Outcome

How does one develop this? Need to know all the baseline data. For UTI What proportion of patients with
typical symptoms have UTI What is the sensitivity and
specificity of a dipstix. What is the success rate of
antibiotic treatment?

On what basis would you assess outcome? Bacterial eradication Symptoms
Diary Questionnaire Interview
Time off work What do patients think?


How are these studies appraised Are the results valid What are the results Can these be applied to my
patients

Are the results valid? Were all important strategies and
outcomes included? Were all of the realistic clinical strategies
compared? Were all clinically relevant outcomes
considered? Was an explicit and sensible process
used to identify, select and combine the evidence into probabilities?

Validity Check (2) Were the utilities obtained in an
explicit and sensible way from credible sources?
Was the potential impact of any uncertainty in the evidence determined?

What are the Results?
In the baseline analysis, does one strategy result in a clinically important gain for patients? If not, is the result a toss-up?
How strong is the evidence used in the analysis?
Could the uncertainty in the evidence change the result?

Can I apply the results to my patient? Do the probability estimates fit my
patients' clinical features? Do the utilities reflect how my
patients would value the outcomes of the decision?

Bottom Line The power of decision analysis is not in
the numbers at the decision node It is the ability to change the utilities and
probabilities Watching how this affects the decision
node Thus it should be seen as a dynamic tool Software for this is available

EXCEL or WWW.TREEAGE.COM
‘Nice’ system ‘Quite’ friendly Free download to try US$ 295 academic price