decision making jan fidrmuc brunel university. introduction which decisions-making powers should be...
TRANSCRIPT

Decision Making
Jan Fidrmuc
Brunel University
Introduction
Which decisions-making powers should be transferred to the EU and which should remain in the hands of national governments?
How much influence do national governments have in the EU?
Can the EU make decisions effectively?
Outline
1. Distribution of Power and Subsidiarity
2. Theory of Fiscal Federalism
3. Qualified Majority Voting
4. Efficiency of Decision Making
5. Power Indices

Distribution of Power and Subsidiarity
Key question: “Which level of government should be responsible for each task or policy decisions?” Setting foreign policy Speed limits School curricula Trade policy
Different levels of policy making: Local, regional, national, EU
Task allocation = ‘competencies’ in EU jargon
Subsidiarity and Proportionality Principles Subsidiarity:
Decisions should be made as close to the people as possible
EU should not take action unless doing so is more effective than action taken at national, regional or local level.
Proportionality: EU should undertake only minimum action
necessary Motivation: to limit “creeping competencies”, i.e.
growing role of EU in policy making
3 Pillars and task allocation 3 Pillar structure delimits the allocation of
power. 1st pillar: Community (EU) jurisdiction.
Single market issues, competition, trade policies, monetary integration.
EU has final say, member states cannot opt out. 2nd and 3rd pillar: national jurisdiction.
Foreign/security policy, justice/home affairs. Members may pursue cooperation but are not
bound by EU decisions they disagree with. Example: Schengen Accord.

Theory of Fiscal federalism
Theoretical analysis can help determine whether centralization or decentralization is optimal
Origins of the theory: Power to tax Which taxes should be set at the national vs sub-
national level?

Theory of Fiscal federalism
Basic trade-offs:1. Diversity and local informational advantage2. Scale economies3. Spillovers (externalities)4. Jurisdictional competition5. Democracy

Diversity and Local Information
Consider provision of a public good when regions have different preferences (demand functions): Region 1 values the public good less than Region 2.
Optimal quantity equates marginal cost and marginal value of the public good
Under decentralization, local governments have an information advantage and can implement optimal allocations: Qd1 and Qd2.
Qd2Qd1 Qc,1&2
D1
D2
Davg
MC per person
MVc,2
MVc,2
A
B
Quantity
euros
MC=marginal cost; MV=marginal value
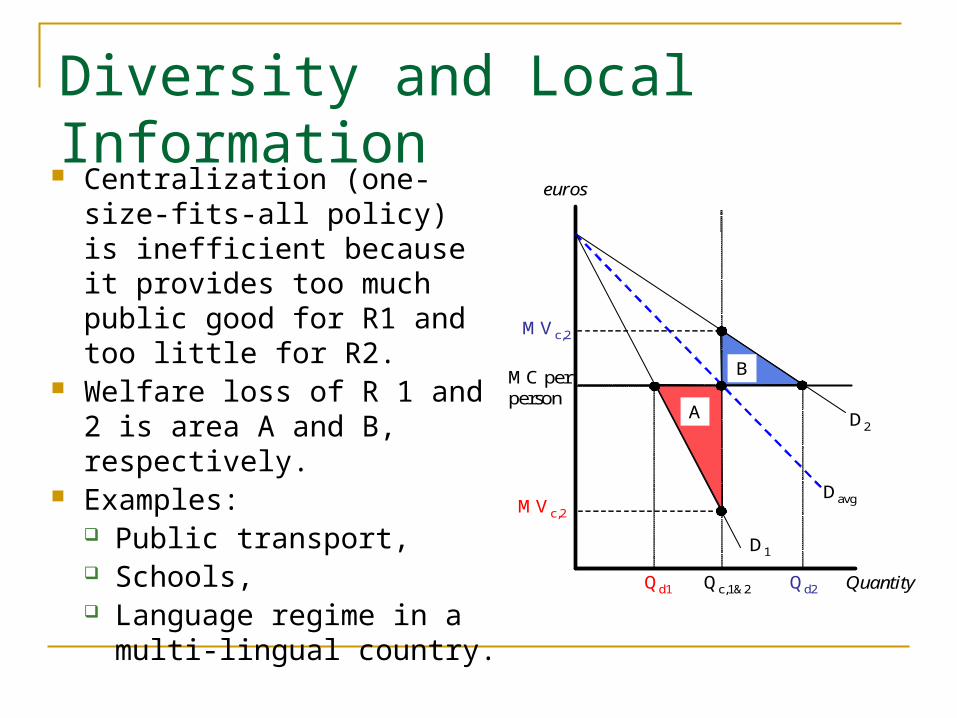
Diversity and Local Information Centralization (one-size-fits-
all policy) is inefficient because it provides too much public good for R1 and too little for R2.
Welfare loss of R 1 and 2 is area A and B, respectively.
Examples: Public transport, Schools, Language regime in a
multi-lingual country.
Qd2Qd1 Qc,1&2
D1
D2
Davg
MC per person
MVc,2
MVc,2
A
B
Quantity
euros

Economies of Scale Costs of providing public good
may fall with scale E.g. single national rail or bus
network may be more efficient than many regional ones.
Different marginal costs apply in centralized and decentralized case.
Region 1: welfare gain C vs loss D centralization may be preferred. National defense and foreign
policyQd1 Qc,1&2
D1
Davg
MC p.p. (decentralised)
C
D
MC p.p. (centralised)
Quantity
euros

Spillovers Prisoners’ dilemma situations. Examples:
Environmental policies. Tax/VAT competition.
If decentralised, each region chooses a level of public good that is too low. e.g. Qd2 for Region 2.
Two-region gain from centralisation is area A.
Similar conclusion with negative spillovers: Q too high under decentralization.
Qd2 Qc,1&2
Combined region 1 & 2 Marginal Benefit Curve
MCd
Quantity
euros
Private and Social Marginal Cost
Region 2’s Marginal Benefit Curve (demand curve)
MCc A

Jurisdictional Competition Voters influence policies through:
Voice: voting, party activism, protest, etc. Exit: by moving to another region/country (voting
with your feet, Tiebout, JPE 1956) Voting with one’s feet common, especially at
sub-national level Firms are particularly mobile and responsive
to local/national policies Decentralization: governments must deliver
good policies or risk losing tax payers Centralization: little possibility for exit

Democracy as a Control Mechanism Politicians offer voters a ‘package’ of policies Local government can offer package that better
reflects local needs Decentralization gives voters better control over
policies The same voter can support different parties in
national and local elections

Summary Decentralization: advantages
Policies reflect local conditions and needs Voters have better democratic control over policies
Centralization optimal when economies of scale and/or spillovers are important.
1st pillar (economy): large spillovers 2nd pillar (foreign/security policies): important
economies of scale but also large differences in preferences across countries
3rd pillar (justice/home affairs) – intermediate case: moderate economies of scale and moderate diversity in preferences
Efficiency of decision making
Fiscal federalism theory: which decisions should be made at the EU level
Focus now: How does the EU make its decisions? How likely is a decision-making gridlock? What was the impact of enlargement? e.g., Institutional changes in Constitutional/Lisbon
Treaty, Nice Treaty Qualified majority voting (QMV) Enlargement-related institutional reform.

Qualified Majority Voting
Most EU decisions made by co-decision procedure Proposal adopted in the Council of Ministers by
QMV and in the EP by majority voting Voting in the Council reflects States’ national
interests QMV requires more than a simple majority to
approve a decision This makes it easier for small Member States
to block decisions

QMV History Before November 2004: Basic form
unchanged since the 1958 Treaty of Rome. Post-2004: Nice Treaty QMV rules, unless
replaced by Lisbon Treaty rules. Constitutional Treaty rules supposed to be
effective from 2009 but rejected in referenda in France and the Netherlands.
Lisbon Treaty rules effective from 2014, or 2017 if delay requested by member states; rejected in referendum in Ireland
Pre-2004 QMV Number of votes not perfectly proportional to
population: Total number of votes in the EU15: 87 Threshold for winning majority: 62 votes
‘qualified majority’: about 71% of votes required to adopt proposal.
Relatively large coalition required to win a vote.
Relatively small coalition of countries can block a vote.

Nice Treaty Reforms Two main changes:
1. QMV rules more complex: two new criteria in addition to votes votes: 255 votes out of 345 Council votes in EU27
(74%) number of members: half of the member states,
i.e. 14 out of 27 population: 62% of EU population.
2. Votes reallocated in favour of big nations
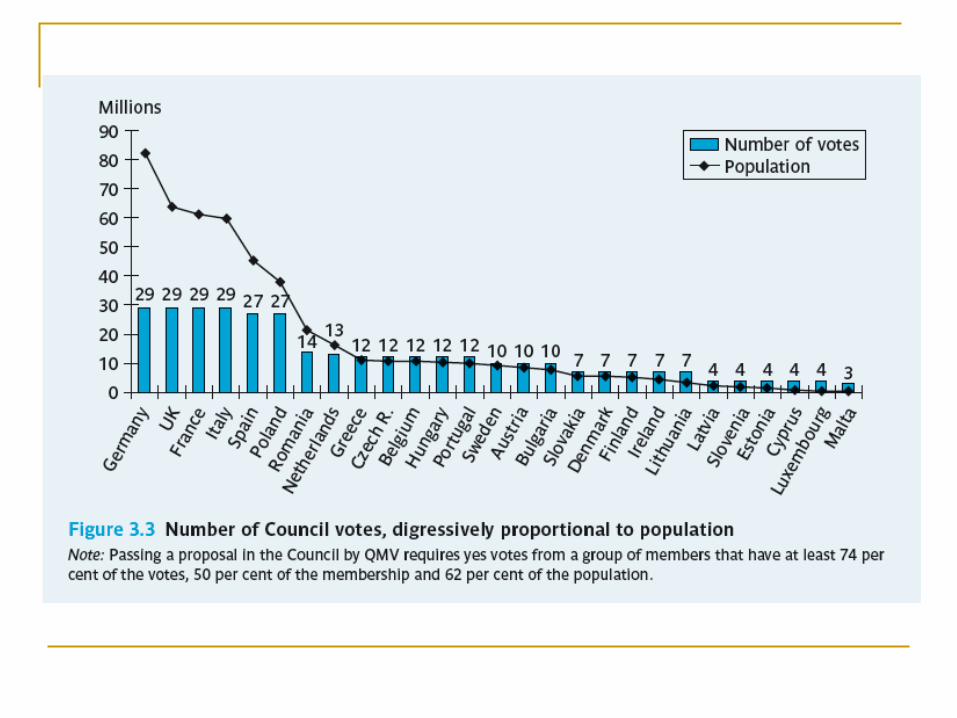

Nice-Treaty QMV VotesCountry Votes Population Country Votes Population
Austria 10 8.1 Latvia 4 2.4
Belgium 12 10.2 Lithuania 7 3.7
Bulgaria 10 8.2 Luxembourg 4 0.4
Cyprus 4 0.8 Malta 3 0.4
Czech Rep. 12 10.3 Netherlands 13 15.8
Denmark 7 5.3 Poland 27 38.7
Estonia 4 1.4 Portugal 12 10
Finland 7 5.2 Romania 14 22.5
France 29 59 Slovakia 7 5.4
Germany 29 82 Slovenia 4 2
Greece 12 10.5 Spain 27 39.4
Hungary 12 10.1 Sweden 10 8.9
Ireland 7 3.7 UK 29 59.2
Italy 29 57.6

Constitutional Treaty Nice Treaty QMV rules: relatively small
coalition can block important decisions. Risk that Council’s becomes deadlocked
CT QMV rules: proposal wins if backed by member states with At least 65% of EU population At least 55% of member states. At least 15 member states (irrelevant if the EU
has 27 or more members: 15/27=56%) Reallocation of vote shares: large nations
gain (except Spain and Poland)
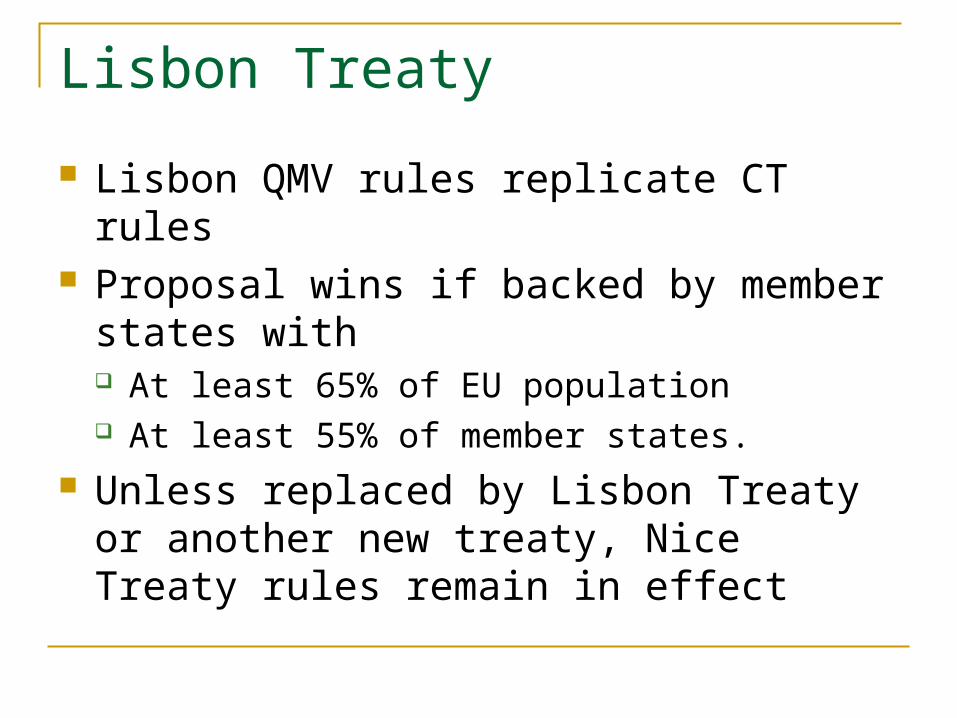
Lisbon Treaty
Lisbon QMV rules replicate CT rules Proposal wins if backed by member states
with At least 65% of EU population At least 55% of member states.
Unless replaced by Lisbon Treaty or another new treaty, Nice Treaty rules remain in effect
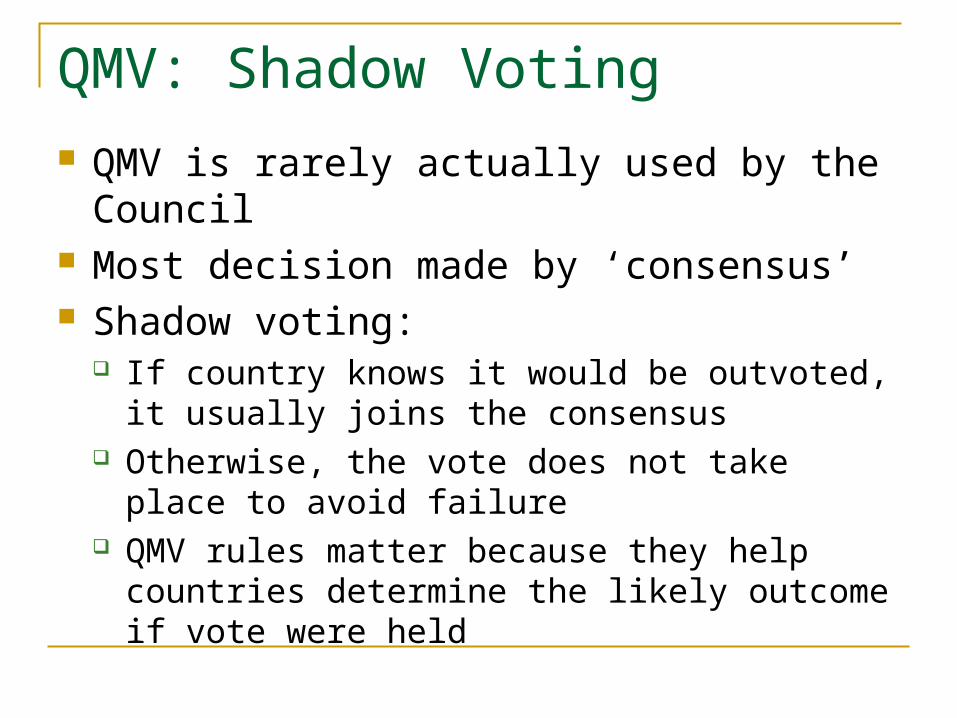
QMV: Shadow Voting QMV is rarely actually used by the Council Most decision made by ‘consensus’ Shadow voting:
If country knows it would be outvoted, it usually joins the consensus
Otherwise, the vote does not take place to avoid failure
QMV rules matter because they help countries determine the likely outcome if vote were held
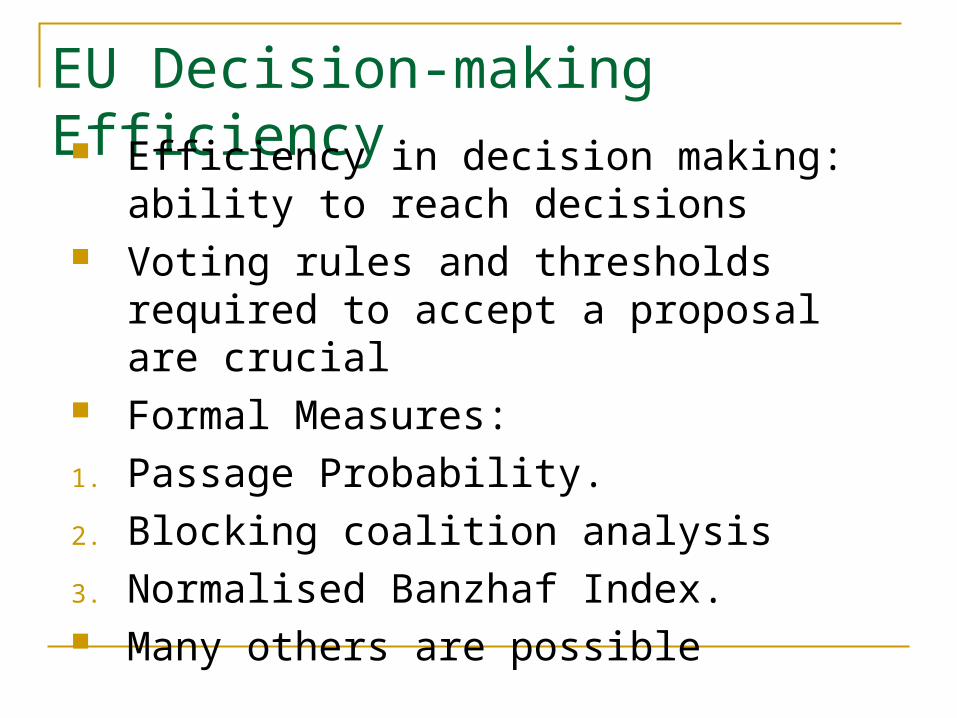
EU Decision-making Efficiency Efficiency in decision making: ability to
reach decisions Voting rules and thresholds required to
accept a proposal are crucial Formal Measures:
1. Passage Probability.
2. Blocking coalition analysis
3. Normalised Banzhaf Index. Many others are possible

Passage Probability
The number of all possible winning coalitions divided by the number of all possible coalitions. E.g.: almost 33 ths possible coalitions in EU15; Over 33 million possible coalitions in EU25.
Passage probability equals probability of winning if all coalitions are equally likely. i.e. if countries’ voting behavior is random
Caveat: very imperfect measure. Proposals and countries’ positions not random
But useful to measure decision-making efficiency.

Historical Passage Probabilities
0
5
10
15
20
25
Pass
age
prob
abil
ity
Historical 21.9 14.7 13.7 9.8 7.8
Status quo: May 04 to Nov 04 2.8
Nice rules: Nov 04 to Nov 09 3.6 2.8 2.3
CT rules: Nov 09 onwards 10.1 12.9 12.2
EU6 EU9 EU10 EU12 EU15 EU25 EU27 EU29
•Source: Baldwin & Widgren (2005)
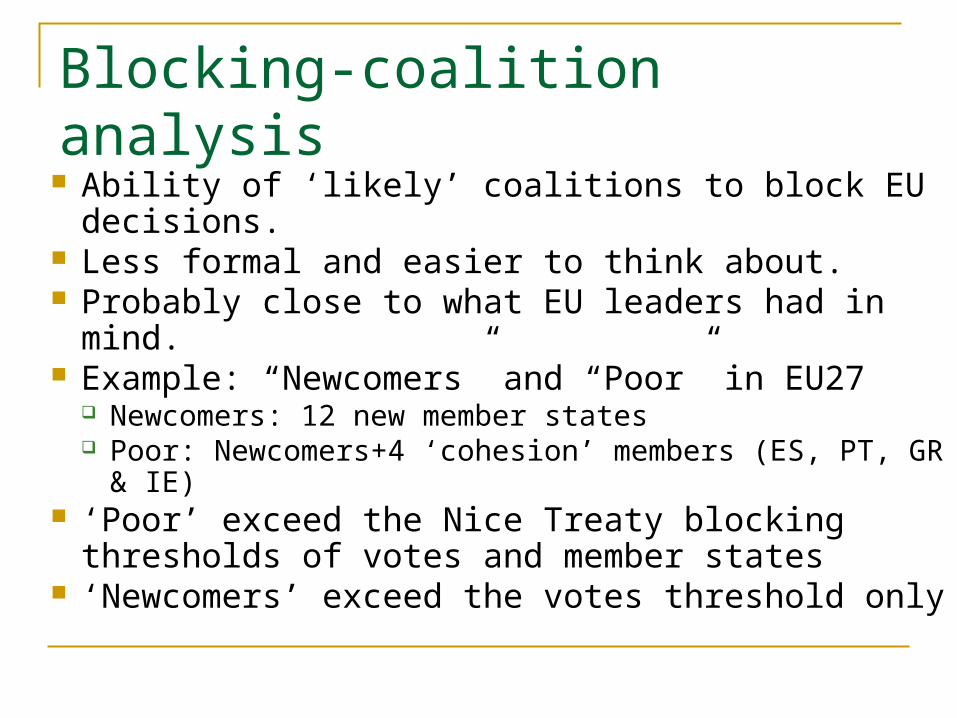
Blocking-coalition analysis
Ability of ‘likely’ coalitions to block EU decisions. Less formal and easier to think about. Probably close to what EU leaders had in mind. Example: “Newcomers” and “Poor” in EU27
Newcomers: 12 new member states Poor: Newcomers+4 ‘cohesion’ members (ES, PT,
GR & IE) ‘Poor’ exceed the Nice Treaty blocking
thresholds of votes and member states ‘Newcomers’ exceed the votes threshold only

Example: 2 blocking coalitions, Nice rules
14
91
183
16
166 170
12
108 106
0
200
Members Votes Population
Poor coalition votesNewcomers coalition votes
Number-of-Membersthreshold
Council-votesthreshold
EU27-population threshold(millions of citizens)
Normalized Banzhaf Index (NBI) Power to break a winning coalition NBI is Member’s share of swing votes Caveat: NBI disregards issues such as
agenda-setting power, and again assumes voting behavior is ‘random’
Normalized Banzhaf Index Consider all possible ‘random’ coalitions n voters: number of possible coalitions is 2n.
Example with 3 voters: ABC Possible coalitions: ABC, AB, AC, BC, A, B, C, [none]
Compute the number of winning coalition in which the voter/nation is pivotal, i.e. the coalition would fail if the voter defects
BNI is the ratio of the number of coalitions in which the voter/nation is pivotal over all possible coalitions BNI measures the probability that the voter is a ‘deal breaker’

Power measures: Example Why use complicated formal power measures
instead of vote shares? Simple example: 3 voters, A, B & C A = 40 votes, B=40 votes, C=20 votes Need 50% of votes to win. All equally powerful! Suppose now the threshold rises to 80 votes. C loses all power.
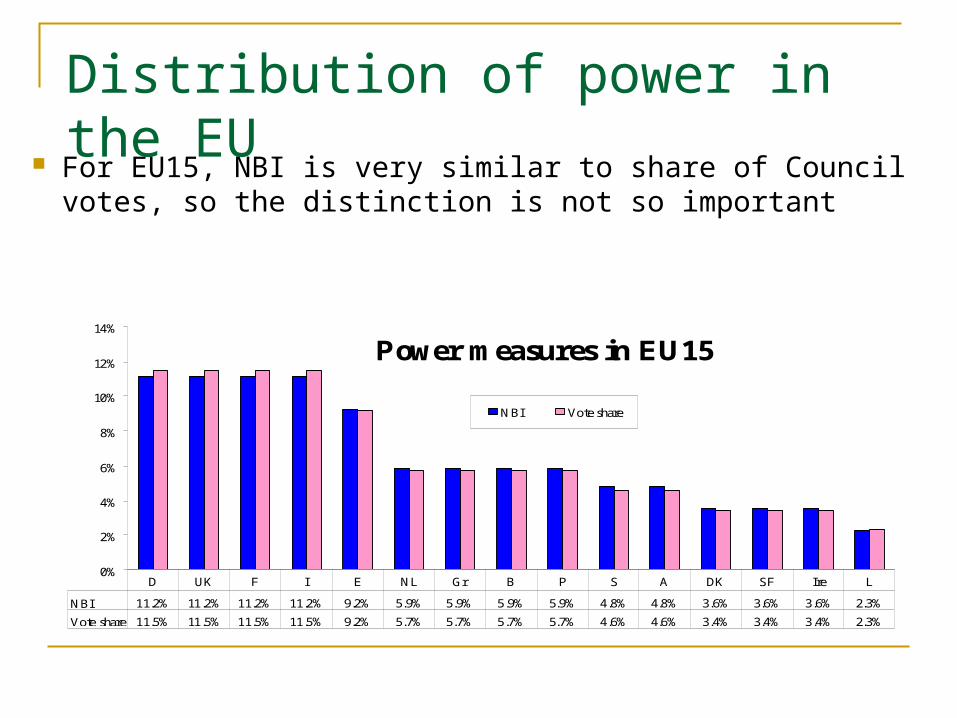
Distribution of power in the EU
For EU15, NBI is very similar to share of Council votes, so the distinction is not so important
Power measures in EU15
0%
2%
4%
6%
8%
10%
12%
14%
NBI Vote share
NBI 11.2% 11.2% 11.2% 11.2% 9.2% 5.9% 5.9% 5.9% 5.9% 4.8% 4.8% 3.6% 3.6% 3.6% 2.3%
Vote share 11.5% 11.5% 11.5% 11.5% 9.2% 5.7% 5.7% 5.7% 5.7% 4.6% 4.6% 3.4% 3.4% 3.4% 2.3%
D UK F I E NL Gr B P S A DK SF Ire L
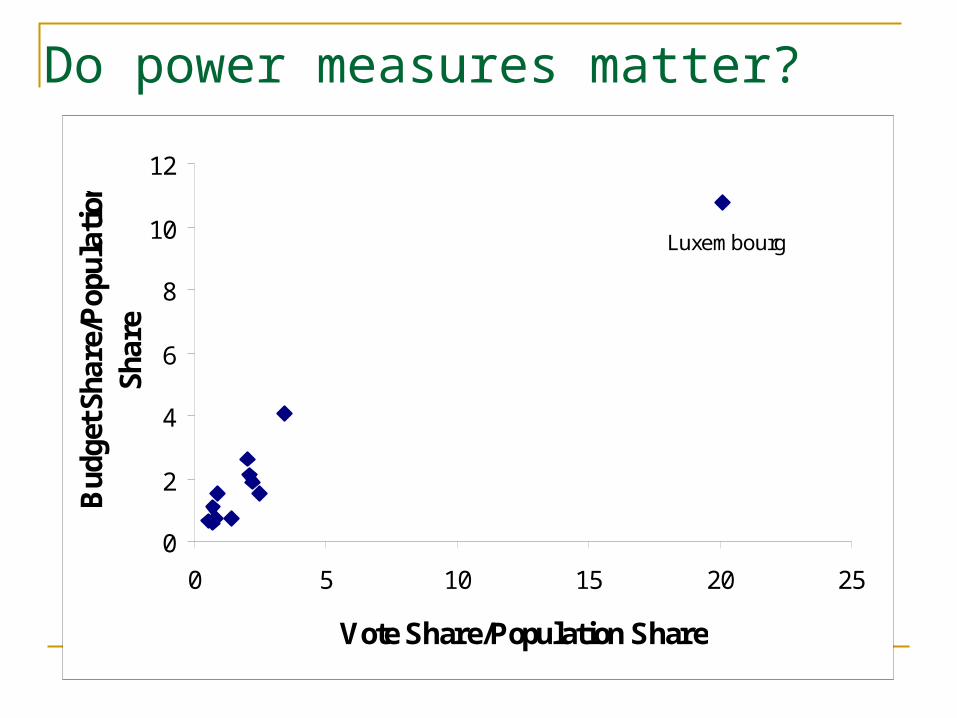
Do power measures matter?
0
2
4
6
8
10
12
0 5 10 15 20 25
Vote Share/Population Share
Bud
get S
hare
/Pop
ulat
ion
Shar
e
Luxembourg
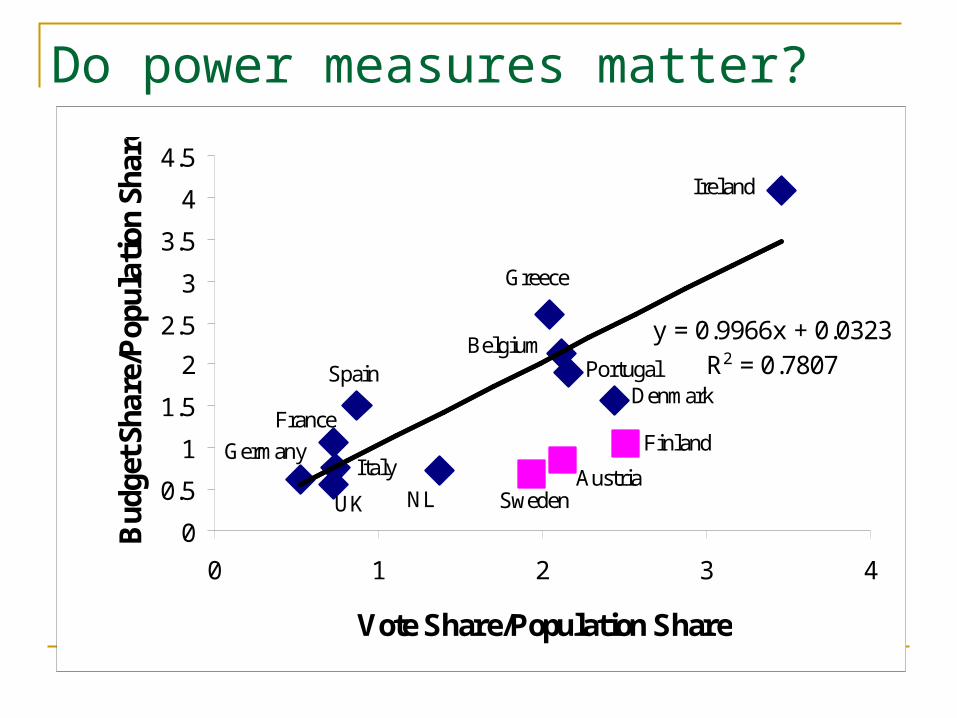
Do power measures matter?
y = 0.9966x + 0.0323R2 = 0.7807
0
0.5
1
1.5
2
2.5
3
3.5
4
4.5
0 1 2 3 4
Vote Share/Population Share
Bud
get S
hare
/Pop
ulat
ion
Shar
e
Ireland
Greece
BelgiumPortugal
DenmarkSpain
Finland
AustriaSwedenNL
France
Italy
UK
Germany