decision support system to improve railway track
TRANSCRIPT

วารสารวิจัย
Decision Support System to Improve Railway Track Maintenance Using Track-Quality Index (TQI)
Thawatchai Phanyakit1*, Thaned Satiaenam1 1Department of Civil Engineering, Faculty of Engineering, Khon Kaen University,
Thailand. *Corresponding author. E-mail: [email protected]
ABSTRACT In recent years, studies on track degradation in railways have attracted a great deal of
attention. Intensive research activities have been carried out by many organizations with the aim of securing a high level of safety and reliability of the infrastructure system. New technologies and stringent safety standards are constantly being introduced for several reasons, not only to prevent the assets from failure or damage but also to minimize the main sources of problems associated with the performance degradation in terms of quality, comfort and safety of each journey. Following these shortcomings, this research aims to develop a logical model for the deterioration of track geometry and to incorporate the proposed model as basis for optimizing maintenance in practice. For the purpose of analysis, a segment of Northeastern line from Thanon Chira junction to Nong Khai station comprising 320.900 km. and 35 stations, in length will be considered and multivariate statistical analyzes will be employed in some geometric parameters. The results will be used to derive the optimization model for scheduling track maintenance by means of tamping in a given period of time. Keywords: Track quality index (TQI), Ballasted track, Track irregularity
1. INTRODUCTIONRailway network in Thailand with a
total distance of 4,033 kilometers covering 47 provinces. Most of the railway tracks are single tracks, totaling a length of 3,569 kilometers or 88.5% of Thailand’s railway network, while the rest of the network is either double tracks or three-way tracks, totaling a length of 464 kilometers or 11.5% of Thailand’s railway network. Overall, 62% of the tracks have been used for more than 30 years and 1,509 kilometers, or 35% of the tracks still have wooden rail sleepers, making them incapable of efficiently supporting increased train speed and weight [1].
According to the International Institution for management (IMD), World
competitiveness yearbook 2014, rail transportation development in Thailand ranked 43rd among 60 countries in Asia and had a track network density of 0.009 km/sq.km. Service quality and safety were also reported as unsatisfactory, with train operation lacking punctuality and with a low train speed of only 54 km/h. Moreover, information quality of tracks in Thailand (72nd among 148 countries) as per the World economic forum report 2013-2014 ranked much worse than Singapore (10th) and Malaysia (18th) [1].
Typically, the track structure can be grouped in two main categories: superstructure and substructure. The superstructure consists of rails, fastening system, rail-pads and sleepers, while the
Received 25-02-2019Revised 14-05-2019Accepted 16-05-2019

60 ปีที่ 13 ฉบับที่ 1 มกราคม - มิถุนายน 2562
วารสารวิจัย
substructure consists of ballast, sub-ballast and sub- grade that the components as shown in Figure1.
Figure 1. Design of a ballasted track [2]
Some important parameters that describe the layout and path of the track are defined as “track geometry”. By design, track geometry should contain the specific criteria to ensure the optimal comfort and safety for train operation. For this reason, the European standards [prEN 13848-5] have specified the requirements for the homologation of track geometry including longitudinal profile, alignment, gauge, cross level (or super-elevation irregularity) and twist that schematic description regarding these geometry variables. Figure 2 illustrates a schematic description regarding these geometry variables.
Figure 2. Track geometry parameters [3]
Longitudinal profile and alignment are delineated with the track geometry of each rail projected longitudinally against the vertical and horizontal plane, respectively. Any change in the elevation of the two rails relative to a designated level is called longitudinal profile deviation. For
an upward vertical deviation, the sign is denoted as positive while a downward deviation is expressed by a negative value. The alignment irregularity is caused by the lateral variation of the rails from a given centerline of the track. If the lateral deviation bends to the left, the sign is symbolized as positive while a negative value is given when the track deviates to the opposite direction. Gauge specifies the inner distance between two rails measured at 14 mm below the top surface of the railhead. In Thailand, the gauge for railway lines is 1.00 m., although a wide variety of gauges are used around the world. The term of gauge irregularity, therefore, refers to the deviation of the track from its specified value. Figure 3 illustrates a schematic description regarding Measurement of the inner distance between two rails.
Figure 3. Measurement of the inner distance between two rails measured at 14 mm (requires Zp = 14 mm) [4]
The other parameter, cross level or cant irregularity, measures the amount of vertical deviation between two flat rails from the design value. This design value, commonly called super-elevation, helps to compensate the centrifugal force of the vehicle on a given curve. Consequently, cross level is not considered a defect unless it deviates from the predefined super-elevation. The last geometry variable, twist, is also associated with super-elevation. It measures the difference in the super-elevation between two points taken at a separate fixed distance along the track [2]
1.1 Assessment of track conditionThe track geometry is subjected to
atmospheric influences and dynamic stresses due to the operational loads. Theseprocesses lead to the modification of the track geometry, which, if not controlled to a certain degree, may result in safety risk and derailment. In order to prevent the trackfrom these issues, the railway networkshould be inspected as well as regularlymaintained in accordance with the railwayengineering standards.
1.2 Track inspection Car (TIC)Prior to the maintenance works, the
measurement of the track geometryparameters is normally carried out within a specific time interval. The results are recorded as numerical values, which can be used to indicate the level of track quality. Inthe first method, the measurement is conducted manually, by workers who walkalong the track to detect the existence of anygeometry problems [Lichtberger, 2005].However, this technique is considered inefficient, particularly in terms of time and labor cost, due to the extent and large scale of the railway network. The accuracy of this method is questionable as well, since not allrail defects can be directly detected by the human eye. With the advancement oftechnology, the application of sophisticated cars has been incorporated as supplement to the previous technique. The use of the trackinspection car has proven to be efficient, yielding more outputs in the trackinformation data.
In Thailand, track condition monitoring for railway track is performed by the Track inspection car (TIC) EM 120N(Figure 4&5). This machine can acquire traditional geometry parameters, such as gauge, cross level or superelevationirregularity, twist, alignment and longitudinal profiles with a sampling rate of0.25 m.
In order to perform those functions, the machine is embedded with two main modules: a car with real time measurementmodule and a stationary data storage module [5]. The first module is designed to read any gap in the geometry parameters from the predefined design and then sends the results to the second module for storage purposes. The computer program, which links to the Global positioning system(GPS) receiver, will analyze the data and give the information according to customerspecifications.
Figure 4. Track inspection Car EM120N[SRT]
Figure 5. Monitoring track quality byEM120N [SRT]
The irregularity data provided by EM 120N is based on the measurement of a 10 m chord-versine, this technique is to assess the gap corresponding to the observed

Vol.13 No.1 January - June 2019 61
วารสารวิจัย
substructure consists of ballast, sub-ballast and sub- grade that the components as shown in Figure1.
Figure 1. Design of a ballasted track [2]
Some important parameters that describe the layout and path of the track are defined as “track geometry”. By design, track geometry should contain the specific criteria to ensure the optimal comfort and safety for train operation. For this reason, the European standards [prEN 13848-5] have specified the requirements for the homologation of track geometry including longitudinal profile, alignment, gauge, cross level (or super-elevation irregularity) and twist that schematic description regarding these geometry variables. Figure 2 illustrates a schematic description regarding these geometry variables.
Figure 2. Track geometry parameters [3]
Longitudinal profile and alignment are delineated with the track geometry of each rail projected longitudinally against the vertical and horizontal plane, respectively. Any change in the elevation of the two rails relative to a designated level is called longitudinal profile deviation. For
an upward vertical deviation, the sign is denoted as positive while a downward deviation is expressed by a negative value. The alignment irregularity is caused by the lateral variation of the rails from a given centerline of the track. If the lateral deviation bends to the left, the sign is symbolized as positive while a negative value is given when the track deviates to the opposite direction. Gauge specifies the inner distance between two rails measured at 14 mm below the top surface of the railhead. In Thailand, the gauge for railway lines is 1.00 m., although a wide variety of gauges are used around the world. The term of gauge irregularity, therefore, refers to the deviation of the track from its specified value. Figure 3 illustrates a schematic description regarding Measurement of the inner distance between two rails. Figure 3. Measurement of the inner distance between two rails measured at 14 mm (requires Zp = 14 mm) [4] The other parameter, cross level or cant irregularity, measures the amount of vertical deviation between two flat rails from the design value. This design value, commonly called super-elevation, helps to compensate the centrifugal force of the vehicle on a given curve. Consequently, cross level is not considered a defect unless it deviates from the predefined super-elevation. The last geometry variable, twist, is also associated with super-elevation. It measures the difference in the super-elevation between two points taken at a separate fixed distance along the track [2]
1.1 Assessment of track condition The track geometry is subjected to atmospheric influences and dynamic stresses due to the operational loads. These processes lead to the modification of the track geometry, which, if not controlled to a certain degree, may result in safety risk and derailment. In order to prevent the track from these issues, the railway network should be inspected as well as regularly maintained in accordance with the railway engineering standards. 1.2 Track inspection Car (TIC) Prior to the maintenance works, the measurement of the track geometry parameters is normally carried out within a specific time interval. The results are recorded as numerical values, which can be used to indicate the level of track quality. In the first method, the measurement is conducted manually, by workers who walk along the track to detect the existence of any geometry problems [Lichtberger, 2005]. However, this technique is considered inefficient, particularly in terms of time and labor cost, due to the extent and large scale of the railway network. The accuracy of this method is questionable as well, since not all rail defects can be directly detected by the human eye. With the advancement of technology, the application of sophisticated cars has been incorporated as supplement to the previous technique. The use of the track inspection car has proven to be efficient, yielding more outputs in the track information data. In Thailand, track condition monitoring for railway track is performed by the Track inspection car (TIC) EM 120N (Figure 4&5). This machine can acquire traditional geometry parameters, such as gauge, cross level or superelevation irregularity, twist, alignment and longitudinal profiles with a sampling rate of 0.25 m.
In order to perform those functions, the machine is embedded with two main modules: a car with real time measurement module and a stationary data storage module [5]. The first module is designed to read any gap in the geometry parameters from the predefined design and then sends the results to the second module for storage purposes. The computer program, which links to the Global positioning system (GPS) receiver, will analyze the data and give the information according to customer specifications. Figure 4. Track inspection Car EM120N [SRT] Figure 5. Monitoring track quality by EM120N [SRT] The irregularity data provided by EM 120N is based on the measurement of a 10 m chord-versine, this technique is to assess the gap corresponding to the observed

62 ปีที่ 13 ฉบับที่ 1 มกราคม - มิถุนายน 2562
วารสารวิจัย
roughness of a straight- line in the center point of the track in the 10 m distance measurement. This gap is then defined as track geometry irregularity. The following Figure6 illustrates how the track geometry parameters are measured by EM 120N.
Figure 6. Track surface irregularity [6] 1.3 Track quality index tolerance The track quality Index tolerance SRT was defined divided into 5 types, and each consists of index in each deviation list as follows: Table 1. Standard for track quality index tolerance [7]
1.3 Track Degradation Mechanism Having the knowledge of the degradation process will aid in the estimate of the future state of a track condition and in the mitigation of the problems associated with operational safety. The following section presents the theoretical framework and the current practices related with railway track degradation. Track degradation is a complex process. The mechanism involves many influencing parameters such as axle load, traffic speed, climate, track characteristics and topography (Figure 7). Today, research efforts have been carried out not only to address the degradation problems, but also to determine the contribution of each parameter to the entire process. Ferreira & Murray [1997] have investigated the physical factors that may have impact on track deterioration. According to the results, the authors argue that the declination in the track quality is mainly driven by three parameters, i. e. dynamic forces, axle load and train speed. Speed contributes to the deterioration process by increasing the dynamic forces at high speeds and decreasing those at low speeds. Load contributes to increased rail wear and fatigue, wheel wear, and strains in rails and sleepers. Consequently, cracks in the rail and sleepers will occur, the railhead will be worn out, the rail fastening will be loosening, and the ballast load will thus be redistributed. These situations will lead to reduce travel safety and comfort and increase track components deterioration and delays. [8]
Track Quality Condition
P Value or TQI value each
Item (%)
Acc
umul
ate
P or
TQ
I va
lue
(%)
Gra
de
Prof
ile
Cro
ss L
evel
Alig
nmen
t
Twis
t
Very Good
A 0-13
0- 5
0-9 0-14
0-10
Good B 14-20
6-13
10-20
15-27
11-20
Fair C 21-30
14-22
21-31
28-36
21-30
Not Fair D 31-40
23-31
32-41
37-46
31-40
Not Acceptance
E >41
>32
>42
>47
>41
Maintenance
- Lubrication- Ballast cleaning- Tamping- Grinding- Inspection interval
Rail
- Type/Quality - Wear - Age - Rail welding
Ballast
- Type/Quality
- Thickness
- Age
- Dust
Sleeper
- Type Quality - Thickness
- Age
Condition
SuperstructureTrack Geometry
-Curvature
-Elevation
Train
- Type of Train- Traffic density- Axle load /tonnage- Speed
Static Load
Dynamic Load
TrackDegradation
Substructure
- Type /quality - Thickness
Environment
- Temperature- Humidity- Corrosive Environment
Figure 7. Parameters of Track degradation [8] 2. MATERIALS AND METHODS 2.1 Phase I This section discusses the activities of the research methodology. Such activities include literature review, data collection, research approaches and procedures used to develop the optimization model. The literature survey the concept of track degradation and the application of existing methodologies for assessing track quality, including track quality index. The aims are to develop a comprehensive understanding of the track degradation mechanism, to systemize the normative aspects that should be considered in the framework modelling, and to identify the feasibility of current approaches in adapting the changes in track performance behavior. In order to obtain
this information, different databases from many sources were explored. These data can be classified as primary and secondary data. The data collected by the researcher for the purpose of study through various experiments or from the on-site data recording are called primary data. The data taken by the researcher from secondary sources, internal and external, are called secondary data, this study, the primary data were collected from refer databases. consisted of measurement reports conducted by Track inspection car (TIC) EM 120N, which comprised all information about the geometrical quality of the track, such as longitudinal profile, horizontal alignment, gauge, super-elevation, network topography, etc. Over 10 years of

Vol.13 No.1 January - June 2019 63
วารสารวิจัย
roughness of a straight- line in the center point of the track in the 10 m distance measurement. This gap is then defined as track geometry irregularity. The following Figure6 illustrates how the track geometry parameters are measured by EM 120N.
Figure 6. Track surface irregularity [6] 1.3 Track quality index tolerance The track quality Index tolerance SRT was defined divided into 5 types, and each consists of index in each deviation list as follows: Table 1. Standard for track quality index tolerance [7]
1.3 Track Degradation Mechanism Having the knowledge of the degradation process will aid in the estimate of the future state of a track condition and in the mitigation of the problems associated with operational safety. The following section presents the theoretical framework and the current practices related with railway track degradation. Track degradation is a complex process. The mechanism involves many influencing parameters such as axle load, traffic speed, climate, track characteristics and topography (Figure 7). Today, research efforts have been carried out not only to address the degradation problems, but also to determine the contribution of each parameter to the entire process. Ferreira & Murray [1997] have investigated the physical factors that may have impact on track deterioration. According to the results, the authors argue that the declination in the track quality is mainly driven by three parameters, i. e. dynamic forces, axle load and train speed. Speed contributes to the deterioration process by increasing the dynamic forces at high speeds and decreasing those at low speeds. Load contributes to increased rail wear and fatigue, wheel wear, and strains in rails and sleepers. Consequently, cracks in the rail and sleepers will occur, the railhead will be worn out, the rail fastening will be loosening, and the ballast load will thus be redistributed. These situations will lead to reduce travel safety and comfort and increase track components deterioration and delays. [8]
Track Quality Condition
P Value or TQI value each
Item (%)
Acc
umul
ate
P or
TQ
I va
lue
(%)
Gra
de
Prof
ile
Cro
ss L
evel
Alig
nmen
t
Twis
t
Very Good
A 0-13
0- 5
0-9 0-14
0-10
Good B 14-20
6-13
10-20
15-27
11-20
Fair C 21-30
14-22
21-31
28-36
21-30
Not Fair D 31-40
23-31
32-41
37-46
31-40
Not Acceptance
E >41
>32
>42
>47
>41
Maintenance
- Lubrication- Ballast cleaning- Tamping- Grinding- Inspection interval
Rail
- Type/Quality - Wear - Age - Rail welding
Ballast
- Type/Quality
- Thickness
- Age
- Dust
Sleeper
- Type Quality - Thickness
- Age
Condition
SuperstructureTrack Geometry
-Curvature
-Elevation
Train
- Type of Train- Traffic density- Axle load /tonnage- Speed
Static Load
Dynamic Load
TrackDegradation
Substructure
- Type /quality - Thickness
Environment
- Temperature- Humidity- Corrosive Environment
Figure 7. Parameters of Track degradation [8] 2. MATERIALS AND METHODS 2.1 Phase I This section discusses the activities of the research methodology. Such activities include literature review, data collection, research approaches and procedures used to develop the optimization model. The literature survey the concept of track degradation and the application of existing methodologies for assessing track quality, including track quality index. The aims are to develop a comprehensive understanding of the track degradation mechanism, to systemize the normative aspects that should be considered in the framework modelling, and to identify the feasibility of current approaches in adapting the changes in track performance behavior. In order to obtain
this information, different databases from many sources were explored. These data can be classified as primary and secondary data. The data collected by the researcher for the purpose of study through various experiments or from the on-site data recording are called primary data. The data taken by the researcher from secondary sources, internal and external, are called secondary data, this study, the primary data were collected from refer databases. consisted of measurement reports conducted by Track inspection car (TIC) EM 120N, which comprised all information about the geometrical quality of the track, such as longitudinal profile, horizontal alignment, gauge, super-elevation, network topography, etc. Over 10 years of

64 ปีที่ 13 ฉบับที่ 1 มกราคม - มิถุนายน 2562
วารสารวิจัย
inspection records were acquired from March 2007 to March 2016. The area of line chosen for this study was Thailand’s Northeastern line from Thanon Chira
junction to Nong Khai station comprising 320.900 km. and 35 stations, as shown in Figure 8.
Figure 8. Proposed study area location, NE Line
Figure 9. Weight through the track of NE Line [9]
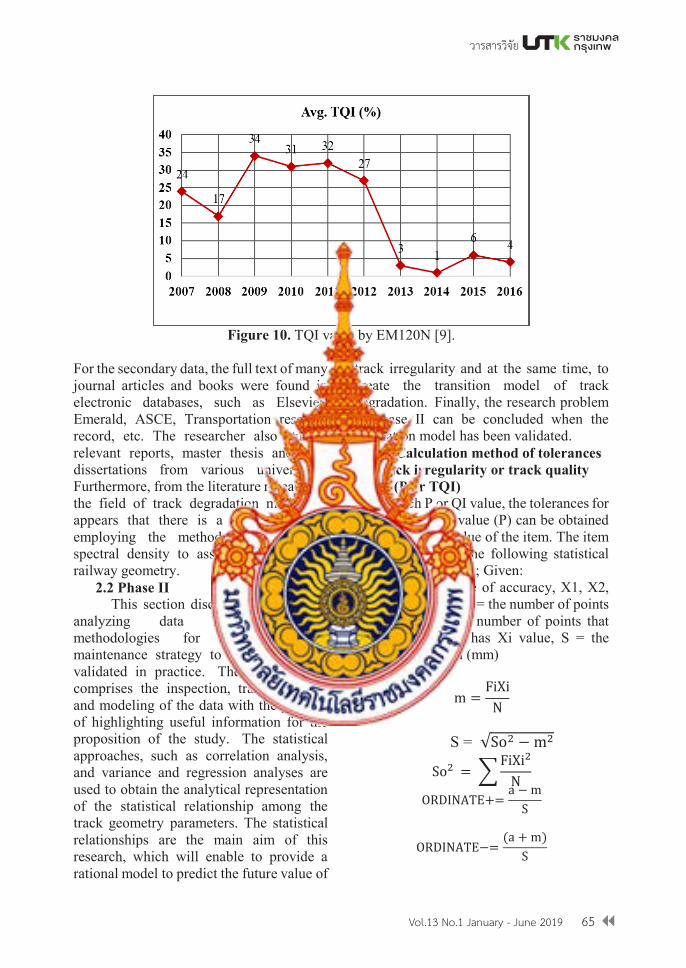
Figure 10. TQI value by EM120N [9].
For the secondary data, the full text of many journal articles and books were found in electronic databases, such as Elsevier, Emerald, ASCE, Transportation research record, etc. The researcher also studied relevant reports, master thesis and PhD dissertations from various universities. Furthermore, from the literature research in the field of track degradation models, it appears that there is a lack of studies employing the methodology of power spectral density to assess the quality of railway geometry. 2.2 Phase II This section discusses the activities analyzing data and developing methodologies for optimizing the maintenance strategy to be subsequently validated in practice. The data analysis comprises the inspection, transformation, and modeling of the data with the purpose of highlighting useful information for the proposition of the study. The statistical approaches, such as correlation analysis, and variance and regression analyses are used to obtain the analytical representation of the statistical relationship among the track geometry parameters. The statistical relationships are the main aim of this research, which will enable to provide a rational model to predict the future value of
track irregularity and at the same time, to create the transition model of track degradation. Finally, the research problem in phase II can be concluded when the estimation model has been validated. 2.3 Calculation method of tolerances for track irregularity or track quality Index (P or TQI) Each P or QI value, the tolerances for track irregularity value (P) can be obtained by applying the value of the item. The item is analyzed using the following statistical process as following; Given: m = the mean value of accuracy, X1, X2, X3, ...., Xn (mm), N = the number of points measured, Fi = the number of points that value of accuracy has Xi value, S = the standard deviation (mm)
m = FiXiN
S = √So2 − m2
So2 = ∑ FiXi2
N
ORDINATE+= a − mS
ORDINATE−= (a + m)S
Vol.13 No.1 January - June 2019 65
วารสารวิจัย
inspection records were acquired from March 2007 to March 2016. The area of line chosen for this study was Thailand’s Northeastern line from Thanon Chira
junction to Nong Khai station comprising 320.900 km. and 35 stations, as shown in Figure 8.
Figure 8. Proposed study area location, NE Line
Figure 9. Weight through the track of NE Line [9]
Figure 10. TQI value by EM120N [9].
For the secondary data, the full text of many journal articles and books were found in electronic databases, such as Elsevier, Emerald, ASCE, Transportation research record, etc. The researcher also studied relevant reports, master thesis and PhD dissertations from various universities. Furthermore, from the literature research in the field of track degradation models, it appears that there is a lack of studies employing the methodology of power spectral density to assess the quality of railway geometry. 2.2 Phase II This section discusses the activities analyzing data and developing methodologies for optimizing the maintenance strategy to be subsequently validated in practice. The data analysis comprises the inspection, transformation, and modeling of the data with the purpose of highlighting useful information for the proposition of the study. The statistical approaches, such as correlation analysis, and variance and regression analyses are used to obtain the analytical representation of the statistical relationship among the track geometry parameters. The statistical relationships are the main aim of this research, which will enable to provide a rational model to predict the future value of
track irregularity and at the same time, to create the transition model of track degradation. Finally, the research problem in phase II can be concluded when the estimation model has been validated. 2.3 Calculation method of tolerances for track irregularity or track quality Index (P or TQI) Each P or QI value, the tolerances for track irregularity value (P) can be obtained by applying the value of the item. The item is analyzed using the following statistical process as following; Given: m = the mean value of accuracy, X1, X2, X3, ...., Xn (mm), N = the number of points measured, Fi = the number of points that value of accuracy has Xi value, S = the standard deviation (mm)
m = FiXiN
S = √So2 − m2
So2 = ∑ FiXi2
N
ORDINATE+= a − mS
ORDINATE−= (a + m)S

66 ปีที่ 13 ฉบับที่ 1 มกราคม - มิถุนายน 2562
วารสารวิจัย
Theoretically, P or TQI is the sum of the tolerance for track irregularity value, which has limit +a and -a, which defined in a statistically that the P or TQI value is the area under the normal distribution curve, the segment is between ± a and ±α when compared to the area under all normal distribution curves, if giving P1 is the condition index calculated from the error value that is positive (+),% and P2 is the value of the condition index calculated from the tolerance for track irregularity value that is negative (-),% So, P or TQI value = P1+P2 % Figure 11. Normal distribution curve of the tolerance for track irregularity value [3] The maintenance division of SRT is assigned a value equal to 3 mm, which is an optimize value, which makes the MEAN value between 0-1 and standard deviation (S.D) there is value between 1-3 with values between 1-3 for general conditions when P or TQI each item is profile level of left-right rail, cross level of left &right rail, alignment of left&right rail and twisted, then calculate Psum or TQIsum by weighting each index. Therefore, Psum = [Pprofile + Ptwist + Pcross level + 2Palignment]/5 TQIsum = [TQIprofile + TQItwist + TQIcross level
+ 2TQIalignment]/5
3. RESULTS AND DISCUSSION The investigation was then further continued by evaluating the existing relationship between various types of track geometry parameters. The value of TQI that classified TQI into 4 section consisting not fair, fair, good and very good which the results as shown in Table2. Table 2. P or TQI (%) of NE line
4. CONCLUSIONS In order to keep the railway infrastructure in the satisfactory condition, the way this condition of every single railway Infrastructure element changes, should be understood. Understanding this change in condition in fact means understanding the behavior of railway infrastructure objects, which paves the way towards predicting it. In order to relate the observed (captured) behavior in the past with the predicted behavior in the future, so called “degradation models” are needed.The research presented in this paper describes a generic/ universal degradation model that was developed specifically so that it would be flexible enough to be applicable to any parameter’s deterioration,
Year
Avg. P or TQI. Value (%)
TQI Compared with SRT Standards
Remark
2007 24 Fair 2008 17 Good 2009 34 Not Fair 2010 31 Not Fair 2011 32 Not Fair 2012 27 Fair
2013 3 Very Good
Track Rehabilitation
2014 1 Very Good
Track Rehabilitation
2015 6 Very Good
Track Rehabilitation
2016 4 Very Good
Track Rehabilitation

Vol.13 No.1 January - June 2019 67
วารสารวิจัย
Theoretically, P or TQI is the sum of the tolerance for track irregularity value, which has limit +a and -a, which defined in a statistically that the P or TQI value is the area under the normal distribution curve, the segment is between ± a and ±α when compared to the area under all normal distribution curves, if giving P1 is the condition index calculated from the error value that is positive (+),% and P2 is the value of the condition index calculated from the tolerance for track irregularity value that is negative (-),% So, P or TQI value = P1+P2 % Figure 11. Normal distribution curve of the tolerance for track irregularity value [3] The maintenance division of SRT is assigned a value equal to 3 mm, which is an optimize value, which makes the MEAN value between 0-1 and standard deviation (S.D) there is value between 1-3 with values between 1-3 for general conditions when P or TQI each item is profile level of left-right rail, cross level of left &right rail, alignment of left&right rail and twisted, then calculate Psum or TQIsum by weighting each index. Therefore, Psum = [Pprofile + Ptwist + Pcross level + 2Palignment]/5 TQIsum = [TQIprofile + TQItwist + TQIcross level
+ 2TQIalignment]/5
3. RESULTS AND DISCUSSION The investigation was then further continued by evaluating the existing relationship between various types of track geometry parameters. The value of TQI that classified TQI into 4 section consisting not fair, fair, good and very good which the results as shown in Table2. Table 2. P or TQI (%) of NE line
4. CONCLUSIONS In order to keep the railway infrastructure in the satisfactory condition, the way this condition of every single railway Infrastructure element changes, should be understood. Understanding this change in condition in fact means understanding the behavior of railway infrastructure objects, which paves the way towards predicting it. In order to relate the observed (captured) behavior in the past with the predicted behavior in the future, so called “degradation models” are needed.The research presented in this paper describes a generic/ universal degradation model that was developed specifically so that it would be flexible enough to be applicable to any parameter’s deterioration,
Year
Avg. P or TQI. Value (%)
TQI Compared with SRT Standards
Remark
2007 24 Fair 2008 17 Good 2009 34 Not Fair 2010 31 Not Fair 2011 32 Not Fair 2012 27 Fair
2013 3 Very Good
Track Rehabilitation
2014 1 Very Good
Track Rehabilitation
2015 6 Very Good
Track Rehabilitation
2016 4 Very Good
Track Rehabilitation
yet powerful and flexible enough to accurately represent/ fit various condition behaviors. Developing such a generic degradation model and empowering it with LCC and numerical optimization techniques, and incorporating them all in a suitable, powerful yet flexible, track maintenance management system, allows railways to perform true long-term simulations of the track behavior, balancing effectively achieved quality with the costs of maintenance works, inspections and other consequences like traffic disruptions, availability, etc. , enabling significant cost-savings. 5. ACKNOWLEDGMENTS This study would not have been successful without the support of the department of civil engineering, faculty of engineering, Khon Kaen university, Thailand. In addition, sincere gratitude goes to maintenance division chief Khon Kaen permanent way inspector of the state railway of Thailand (SRT), who is one part of this accomplishment supporting valuable data for the study. 6. REFERENCES [1] Office of the National Economics and
Social Development Board. Report on infrastructure status in Thailand B.E. 2554. Bangkok; 2011.
[2] Dahlberg T. Railway track settlements – a literature review. Report for the EU project super-track, Division of Solid Mechanics, Linköping: Linköping University; 2003.
[3] Bing AJ, Gross A. Development of railway track degradation models. Transport Res Rec.1983; 939:27-31.
[4] Office of Transport and Traffic Policy and Planning, Thailand. Maintenance manual Railway structure. Bangkok; 2018.
[5] Cacho M. Manutencao e conservacao em fias–ferreas:o caso da via alfarelos–figuera da foz. Licienciatura thesis. Civil Engineering Department, University of Coimbra; 2009.
[6] Oyama T, Miwa M. Mathematical modeling analysis for obtaining an optimal railway track maintenance. Jpn J Ind Appl Math. 2006; 23(2):207-224.
[7] The State Railway of Thailand (SRT). Track maintenance manual. Bangkok: 1964.
[8] Ferreira L, Murray M. Modelling rail track deterioration and maintenance current practices and future needs. Transport Rev. 1997; 17:207-221.
[9] Freight Service Department, State Railway of Thailand, Report on Weight and Train through the Railway 2007-2016.Bangkok; 2017.