deckblatt passauer diskussionspapiere beitrag v-64-12 fileon the costs of kindness – an...
TRANSCRIPT
On the Costs of Kindness – An Experimental Investigation of Guilty Minds
and Negative Reciprocity
Manuel Schubert Johann Graf Lambsdorff
Diskussionsbeitrag Nr. V-64-12
Volkswirtschaftliche Reihe ISSN 1435-3520
PASSAUERPASSAUERPASSAUERPASSAUER
DISKUSSIONSPAPIEREDISKUSSIONSPAPIEREDISKUSSIONSPAPIEREDISKUSSIONSPAPIERE

Herausgeber: Die Gruppe der volkswirtschaftlichen Professoren der Wirtschaftswissenschaftlichen Fakultät der Universität Passau 94030 Passau
On the Costs of Kindness - An Experimental Investigation of Guilty Minds
and Negative Reciprocity
Manuel Schubert Johann Graf Lambsdorff
Diskussionsbeitrag Nr. V-64-12
Volkswirtschaftliche Reihe ISSN 1435-3520
Adresse des Autors/der Autoren: Dipl.-Kfm. Manuel Schubert B.A. Professor Dr. Johann Graf Lambsdorff Lehrstuhl für Volkswirtschaftstheorie Wirtschaftswissenschaftliche Fakultät Universität Passau 94030 Passau
Telefon: (0851) 509-2553 (-2550) Telefax: (0851) 509-2552 E-Mail: [email protected] E-Mail: [email protected] Für den Inhalt der Passauer Diskussionspapiere ist der jeweilige Autor verantwortlich. Es wird gebeten, sich mit Anregungen und Kritik direkt an den Autor zu wenden.

On the Costs of Kindness – An Experimental Investigation of Guilty Minds and Negative Reciprocity*
Manuel Schubert Johann Graf Lambsdorff�
January 5, 2012
Abstract
Psychology has inspired economics to recognize intentions in addition to out-comes as being relevant for utility and behavior. Reciprocal behavior, in particu-lar, has been related to the kindness of chosen actions and how kindness can be derived from the benefits obtained in unchosen alternatives. This study shows that a richer understanding of kindness is required. We carry out ultimatum games with a reduced space of strategies and observe that subjects refrain from negative reciprocity (rejecting proposals) if an unchosen alternative was costly to the pro-poser. Second, we find proposers to anticipate this behavior. Not only the benefits are relevant for assessments of kindness, the costs of kindness matter as well.
Keywords: Intentions; reciprocity; fairness JEL-classification: C70, C91, D63 PsycINFO classification: 2360
* We thank seminar participants at Passau University, Germany, February 2011.
� Johann Graf Lambsdorff holds a chair position in economic theory at the University of Passau, Innstrasse 27, D-94030 Passau, Germany ([email protected]). Manuel Schubert is research assistant at the University of Passau, Germany ([email protected]).

1
1. Introduction
Imagine yourself swimming in a lake and accidently entangling your foot in loose rope. You
are close to drowning as a car drives by. You wave with your arms, yell loud to attract the
driver’s attention. But while he seems to take notice he continues driving, disregarding your
peril. You are lucky to disentangle your foot and survive the hazard. Driving to the next town
with your car, the only thing that continues to trouble you is how unkind the driver of this car
was. As you stop to refuel you are stunned to see this car parking in front of you. You run up
to the driver and feel your blood pressure climb as you prepare to tell him a lesson.
This is a story of negative reciprocity. And it may provide us with some clues of how we
judge other’s unkind actions. One key component that affects our judgment relates to the ma-
terial consequences of an action. As noted by Falk et al. (2008), economic theory tends to
apply a consequentialist practice where the utility of an action is judged solely in terms of the
material consequences. Having survived the danger, there are no material consequences and
thus standard economic theory provides us with little guidance for our willingness to start a
dispute with the car driver. As can easily be imagined, this is a failure of theory rather than of
our sentiments.
Criminal judges are not only concerned with the actus reus, the objective evidence, but also
the mens rea, the mental part of a crime. It makes a difference whether a perpetrator acted
purposefully and knowingly. We are no different to a criminal judge in evaluating others. We
also explore the mens rea that has led the car driver to act the way he did. We want to under-
stand the cognitive process that accompanied his behavior. We attach strong sentiments to the
process of how an outcome came about, beyond the fact that we finally survived.
To understand our concern, imagine a variation to the above story. The car driver’s kid was
lying in the back of his car, urgently in need of medical treatment. When he passed the lake he
had to decide whose support was more important to him. Judging the situation now, we would
be willing to forgive him. We observe that stopping and helping us had been highly disadvan-
tageous to the car driver and understand his behavior. His failure to be kind was not driven by
reckless self-regard. His “costs” of acting kindly would have been high. We would not regard
the car driver’s action as being driven by bad intentions and abstain from blaming him. This
study brings the relevance of these costs of kindness to the laboratory.
Section 2 of this paper reviews the current evidence on kindness as a driver of reciprocal
behavior. In section 3 we present our experimental design and derive our hypotheses. In sec-
tion 4 we describe the experimental procedures. The results are illustrated and discussed in
sections 5 and 6. The study ends with concluding remarks in section 7.
2
2. Previous evidence on kindness evaluations
Economists have taken inspiration from psychology. A first approach was to recognize that
we do not care only about ourselves. Not only own payoffs are relevant to utility and behav-
ior. We may be averse to inequality, envy others or feel guilty when taking too much for our-
selves (Fehr and Schmidt 1999). Some subjects may even be altruists while others are misan-
thropists (Levine 1998). We may view behavior as resulting from individual characteristics, to
vices and virtues. We may recognize the concern for others in an individual’s utility function.
At the downside, such an approach does not explain why we may behave altruistically in
some circumstances and take revenge in others.
In this spirit Rabin (1993) argues that neither is altruism only the result of virtue, nor is mis-
anthropism a behavior that can reliably be related to a bad character. Rather, people who are
altruistic to other altruistic people are also motivated to hurt those who hurt them. The behav-
ior chosen depends on the kindness or unkindness perceived among others. We adjust our
behavior in response to how we are treated by others and reciprocate accordingly. This has led
to various attempts at measuring kindness and unkindness. What would these terms mean
with respect to the above example? Why precisely do we sense the car driver to have acted
unkindly and deserves to be yelled at?
The literature addressing the judgment of kindness linked the perception of actual behavior
to the consequences that would have resulted from unchosen alternatives (e.g. Brandts and
Solà 2001, Falk et al. 2003, Bolton and Ockenfels 2005, Sutter 2007).1 Assume, for example,
a mini ultimatum game in which two players bargain about a given stake size of 100 Taler.
One player, the proposer, either offers an 80:20 split or proposes an alternative offer which
differs across treatments. The second player, the responder, accepts or rejects the proposed
offer. If she accepts, payoffs are disbursed according to the proposed split. If she rejects, both
players receive zero payoffs. Brandts and Solà (2001) and Falk et al. (2003) hypothesize that
the unchosen alternative may serve as a reference to assess how unkind the actual offer is
meant to be. Following folk interpretations of kindness, offering 80:20 is unkind if the alter-
native proposal is the equal split (50:50). However, if the unchosen alternative allocates the
full stake to the proposer (100:0), offering 80:20 is the best the proposer could do. Shall he be
punished for behaving kindly? The answer seems to be a resounding no. Brandts and Solà
(2001) find about 13 percent of the responders to reject the 80:20 offer when the alternative
proposal yields a 50:50 split. On the other hand, only 3 percent reject the kind 80:20 offer
given an alternative proposal of 85:15. Later studies provide further evidence. Falk et al.
1 Another line of research investigates how the expected consequences of an action affect our judgment of kind-ness (see e.g. Schubert 2011 for a recent overview).
3
(2003) observe that 44 percent reject the 80:20 offer when the alternative offer is the 50:50
split, but less than 10 percent reject the kind 80:20 offer given an unchosen alternative of
100:0.
These findings suggest that unchosen alternatives may strongly influence our judgment of
kindness. They have thus found their way into formal models that add our concern for recip-
rocity into an individual’s utility function. Such models require a reference, a benchmark that
depicts a neutral type of behavior that is neither kind nor unkind. Most of these models em-
ploy the unchosen alternatives to determine an intrapersonal reference for neutral behavior
(e.g. Rabin 1993, Dufwenberg and Kirchsteiger 2004, Cox et al. 2007, Seebald 2010).2 A
proposer could be judged as unkind by a responder, for example, if his unchosen alternative
would have provided the responder with a higher payoff. On the other hand, the proposer is
seen to be kind if he offers more than in the unchosen alternative. Thus, the better the uncho-
sen alternative to the responder, the less kind is the actual 80:20 offer. Falk and Fischbacher
(2006)’s notion of kindness differs from these approaches in two ways. First, they argue that
kindness includes an interpersonal, not only an intrapersonal comparison. For instance, a pro-
poser offering an 80:20 split is unkind because he wants to get 60 currency units more than
the responder. This unkindness does not result from unchosen alternatives but from an inter-
personal comparison of payoffs. Second, they assume a responder to infer from the proposer’s
unchosen alternative how much he favors the actual proposal. If the proposer could have opt-
ed for an equitable alternative he is intentionally unkind and for this reason particularly
blameworthy. But if there was no such alternative available, the proposer is less to blame for
his unkind proposal. Falk et al. (2003), Bolton and Ockenfels (2005) and Sutter (2007) pro-
vide some experimental support for this idea. The former authors observe that rejection rates
to 80:20 offers decrease from the mentioned 44 percent to 27 percent when the unchosen offer
yields a 20:80 payoff rather than the 50:50 split. The 20:80 split would be harmful to the pro-
poser so that he can little be blamed for having disregarded it. In contrast, Rabin’s kindness
predicts rejection rates to be higher when the alternative proposal yields a 20:80 split.
Our approach adds to the literature on this front. We acknowledge that the benefits of kind-
ness, the extent to which other’s behavior increases one’s own payoff and serves to support
equality, are important for understanding reciprocity. But we claim that also the costs of kind-
ness are relevant. Brandts and Solà (2001: 152 FN 16) already conjectured that the costs of
kindness may influence responder behavior. However, their experimental design employs
regular mini ultimatum games that vary costs and benefits simultaneously. Thus, they are not
2 We included the model of Cox et al. (2007) because it formally refers to an intrapersonal reference. However, these references are estimated from experimental data so they could reflect other than intrapersonal factors.

4
able to distinguish the impact of costs from those of benefits. We believe that Falk and Fis-
chbacher (2006) have come closer to isolating the costs of kindness. Yet, their model is less
intuitive and does not explicitly claim to be linked to the costs of kindness.
In the standard ultimatum game subjects are confronted with costs and benefits identical in
absolute size. One’s gains (the respondent’s benefits of kindness) are the other’s losses (the
proposer’s costs of kindness) and vice versa. But how would we assess kindness if only costs
or benefits change? Gut instincts provide us with little guidance for these situations. Would
costs be considered? And if so, do proposers and responders coordinate on a mutual language
of kindness or do they stick to a rather self-serving interpretation? Do proposers value their
costs higher than the other’s benefits and would respondents value foregone benefits higher
than the proposer’s costs?
In this study, we strive for an empirical answer to these questions. We report results from
three treatments of a mini ultimatum game with flexible costs but constant benefits of kind-
ness. In order to quantitatively asses the impact of costs versus benefits of kindness we run a
fourth ultimatum game where also the benefits of kindness vary. We run logit regressions
with this broader sample and the costs and benefits of kindness being valued largely equal
among responders. We also observe that costs are about as important as benefits to proposers.
Thus, despite the fact that proposers are materially affected by the costs of kindness, they
seem to coordinate on a mutual language for the judgment on kindness.
3. Experimental Design
Our experimental design builds on three treatments of the mini ultimatum game plus one
control game (see figure 1). In each treatment, the first mover, denoted as P(roposer), can
decide between offering an 80:20 split (x) or an alternative split (y). The alternative proposal
(y) varies across treatments and depends on the costs, c, related to kind behavior. The costs, c,
are either 50 (treatment 1), 30 (treatment 2), or 10 (treatment 3). In contrast, the benefits of
kindness, b, remain constant across all treatments. In treatment 1, proposing (y) implies offer-
ing a 30:50 split. In treatment 2, (y) is the 50:50 equal split, while in the third treatment, (y)
yields a 70:50 split. The values on costs and benefits are reported here to ease comparisons,
but they were not reported to participants who observed only payoffs. As is known for ultima-
tum games, once P has selected a proposal, R can a(ccept) or r(eject) the proposal. If she ac-
cepts, payoffs are disbursed according to P’s split. If R rejects, each player receives a zero
payoff.

5
Figure 1: Experimental treatments and control
.
x
πP
ra
n1
n2 n3R . R
n5n4 n7n6
P
πR
80
20
0
0
0
0
80-c
20+b
y
ra
treatment costs c
1
2
50
30
3 10
benefits b
30
30
30
control 10 10 πP: P’s payoff, πR: R’s payoff
Imagine P proposes the 80:20 split to R. Being at node n2, R has then to make up her mind
about whether to accept or reject P’s proposal. She can either agree on the asymmetric split
favoring P or pay 20 currency units to destroy P’s endowment of 80. If we assume R to have a
preference for reciprocity, she must now start assessing the kindness of P’s proposal. If the
actual proposal is only slightly unkind, she may abstain from retaliation and accept the pro-
posed split. On the other hand, if unkindness exceeds a certain threshold value, R will gain
higher utility from retaliation than from cooperation. Starting to judge P’s kindness R may
now ask “could the proposer have done better”? This shifts her focus to the proposal P has not
chosen. She may notice that the unchosen proposal differs from the actual 80:20 offer in two
ways.
In the first treatment, for example, R may perceive P’s proposal as intrapersonally unkind.
She could have got 50 instead of 20 currency units. The difference of 30 units are the benefits
of kindness, b. These are R’s unrealized gains associated with (unchosen) kind behavior. At
the same time, she may notice on the interpersonal level that P’s costs of kindness amount to
50 currency units thus exceeding the potential benefits of kindness. In the next treatment, the
costs of kindness drop to 30. This would allow P to equalize payoffs and pay a price identical
to R’s gain. The alternative becomes more reasonable and abstaining from it provides more of
an impression that P selected the asymmetric 80:20 split on purpose and with a disregard to-
wards equality. The highest level of unkindness may be assigned in the third treatment. Like
in our introductory story, kindness is now cheaply available to P. If he refuses to be kind, he
signals that he values 10 units more for himself as more important than 30 extra units for R.
The mens rea of his action appear particularly malevolent.
6
Therefore, the relevance of the costs of kindness can be obtained by comparing results
across treatments. We should find that
H1: REJECTION RATES DECREASE IN THE COSTS OF KINDNESS
If proposers believe responders to base their behavior on this hypothesis and value their kind-
ness against material losses, we should analogously find that the
H2: FREQUENCY OF 80:20 OFFERS INCREASE IN THE COSTS OF KINDNESS
We address the benefits of kindness by including data from another mini ultimatum game in
our analysis. This control game is played with a constant stake size in proposals and also al-
lows for an 80:20 offer in (x). The control game is similar to our third treatment. The alterna-
tive move (y) proposes a 70:30 split to R. The costs of choosing the kind alternative (y) thus
equal 10 currency units in both treatment 3 and the control game (see figure 1). However, the
games differ with respect to R’s payoffs at end node n6. While R’s benefits of kindness
amount to 30 units in treatment 3, they equal the costs of kindness of 10 in the control game.
We add this control treatment for two reasons. First, we want to obtain a richer set of data,
allowing us to run multivariate analysis where both, costs and benefits of kindness, enter the
calculus simultaneously. Second, we are interested in determining the magnitude of costs and
benefits relative to each other. Are benefits more relevant than costs and do our results vary
for proposers and for responders?
4. Experimental procedures
In order to test our hypotheses the games were embedded in a series of laboratory experi-
ments at the University of Passau in December 2010.3 Each subject played only one treatment
(between subject design). The control game was played subsequently by a random selection
of 40 subjects (within subject design). In addition, we did not provide feedback until the very
end of the experiment.
Subjects were recruited by standard methods such as email invitations, advertising in bulle-
tins, blogs, lectures and so forth. Upon arrival participants were instructed on dos and donts,
the expected duration of the experiment, payment and blindness procedures. Participants then
were randomly split into two groups and guided to separated laboratories. The sessions were
organized computer-based and with neutral framing. Treatments were programmed and con-
ducted with the software z-Tree (Fischbacher 2007). Responders were always asked to state
3 Our treatments were preceded by a random-role dictator game.

7
complete strategies compassing responses for each decision node (strategy method). In order
to ensure full single-blindness, players only interacted with counterparts from the other com-
puter lab.
Each subject received a show-up fee of 2 Euros. During the experiment all payoffs were
specified in an experimental currency unit, Talers. The exchange rate was 1 Taler = 2 Euro-
cent. At the very end of a session, payoffs were summed up across all games and displayed as
a whole in order to ensure that experimenters could not infer actual play.
5. Descriptive analysis
In total, we collected data from ten sessions with 264 subjects. The average student was 22
years old with a minimum (maximum) age of 19 (35). The mean semester was 4.2. 35 percent
(91 subjects) were male. This proportion is broadly in line with current gender representation
at advanced undergraduate levels at the University of Passau. Each session lasted around 23
minutes. Net lab time amounted to 13 minutes. Average payoffs were 5.13 Euros for that
time. The minimum payoff was 2 Euros, the maximum 8.40 Euros. For comparison, a student
assistant at the University of Passau earns 7 Euros per hour.
Table 1 provides summary statistics for responder and proposer behavior across all treat-
ments and the control game. For each game it reports the costs and the benefits associated
with kind behavior, the number of observations for each role, and descriptive statistics on
responder and proposer behavior. We also include the odds which allows are more intuitive
interpretation of behavior in subsequent logit regressions. The odds is the probability of rejec-
tion, p, divided by the probability of accepting, (1-p). For example, in the third treatment 19
percent of the responders reject the 80:20 offer. This means that rejection is approximately a
quarter (0.19/0.81=0.23) as likely as acceptance in this treatment.
Table 1: summary statistics
responder behavior proposer behavior
game costs
of kindness benefits
of kindness
number of observations
(for each role) rejection of
80: 20 (in percent)
odds [p/(1-p)]
offer of 80:20
(in percent)
odds [p/(1-p)]
treatment 1 50 30 48 .19 .23 .50 1.00
treatment 2 30 30 44 .46 .85 .27 .37
treatment 3 10 30 40 .53 1.13 .13 .15
control 10 10 40 .40 .67 .28 .39
Figures 2a and 2b illustrate responder and proposer behavior across our three treatments and
the control game graphically. Overall behavior seems to be broadly in line with our hypothe-
ses. In figure 2a, rejection rates steadily increase across the three treatments. The higher the

8
costs associated with the kind alternative the lower the probability to reject the actual 80:20
offer.
Figures 2a-b: (a) responder and (b) proposer behavior by game and gender
0
0.1
0.2
0.3
0.4
0.5
0.6
0.7
0.8
50 (t. 1, 30:50) 30 (t. 2, 50:50) 10 (t. 3, 70:50) 10 (c., 70:30)
costs of kindness
reje
ctio
n fr
equ
enci
es
to 8
0:2
0 o
ffer
s(i
n pe
rcen
t)
overallmale female
0
0.1
0.2
0.3
0.4
0.5
0.6
0.7
50 (t. 1, 30:50) 30 (t. 2, 50:50) 10 (t. 3, 70:50) 10 (c., 70:30)
costs of kindness
freq
uen
cy o
f 80:
20 o
ffer
s(i
n pe
rcen
t)
overallmale female
The nonparametric Kruskal-Wallis-test determines the probability for the treatments to re-
sult from a joint distribution and indicates significant differences in mean rejection rates
across treatments (see table 2). Results from pairwise comparisons show that responder be-
havior in treatment 1 is significantly different from the other two treatments, whereas rejec-
tion rates in treatments 2 and 3 are not significantly different from each other (see table 2).
Table 2: test statistics for responder and proposer behavior
responder behavior proposer behavior
Kruskal-Wallis
equality of populations rank test
p-values for Mann-Whitney pairwise comparisons
Kruskal-Wallis equality of
populations rank test
p-values for Mann-Whitney pairwise comparisons
costs
of kindness
rank sum treatment
1 treatment
2 treatment
3
costs of
kindness rank sum
treatment 1
treatment 2
treatment 3
treatment 1 50 2586 - 50 3792 -
treatment 2 30 3146 .006 - 30 2816 .027 -
treatment 3 10 3046 .001 .521 - 10 2170 .000 .094 -
chi² 8.527 chi² 9.417
p .014 p .009
chi²
with ties 12.079
chi² with ties
14.659
p .002 p .001
Some studies find support that responder behavior interacts with a subject’s gender (e.g.
Cox 2002, Lambsdorff and Frank 2011, Schubert 2011). Women may have a greater sense for
equality, whereas men may be motivated by reciprocity. Our responder data may corroborate
these earlier results. Rejection rates of female responders increase across treatments, but less
than those of men (see figure 2a). Women might be less concerned about the costs of kind-
9
ness, which may be in line with their overall less pronounced concern for reciprocity. We will
address this issue more specifically in our logit regressions.
Proposers seem to anticipate the cost-sensitivity among responders (see figure 2b). They
appear to play unkindly toward the responder the higher the price for kindness. The Kruskal-
Wallis-test confirms this conjecture. Offer frequencies significantly differ across treatments
(see table 2). Again, pairwise comparisons indicate that proposer behavior in treatment 1 is
significantly different from the other two treatments. We also find weakly significant differ-
ences in offer frequencies in treatments 2 and 3.
Across all treatments we observe male proposers to offer the unequal 80:20 split more often
than female proposers. In line with the above-mentioned findings on gender differences in
reciprocal preferences, it seems plausible that female proposers abstain from proposing 80:20
because they may have a stronger preference for equality than for reciprocity. We will shed
more light on this aspect in the logit regressions.
Overall, we find evidence in favor of the hypotheses H1 and H2. Let us now discuss behav-
ior in the control game. Given an alternative offer of 70:30, 48 percent of all female and 23
percent of all male responders reject the 80:20 offer resulting in an overall rejection frequency
of 40 percent (see figure 2a). Female proposers offer the 80:20 split in about 23 percent of all
observations in the control game. Male proposers are observed to offer the 80:20 split in 36
percent of all cases. The aggregate frequency amounts to 28 percent (see figure 2b). Figures
3a and 3b reorganize overall rejection rates to 80:20 offers and frequencies of 80:20 offers in
our games sorted by costs and benefits. What can be learnt about the costs and the benefits of
kindness?
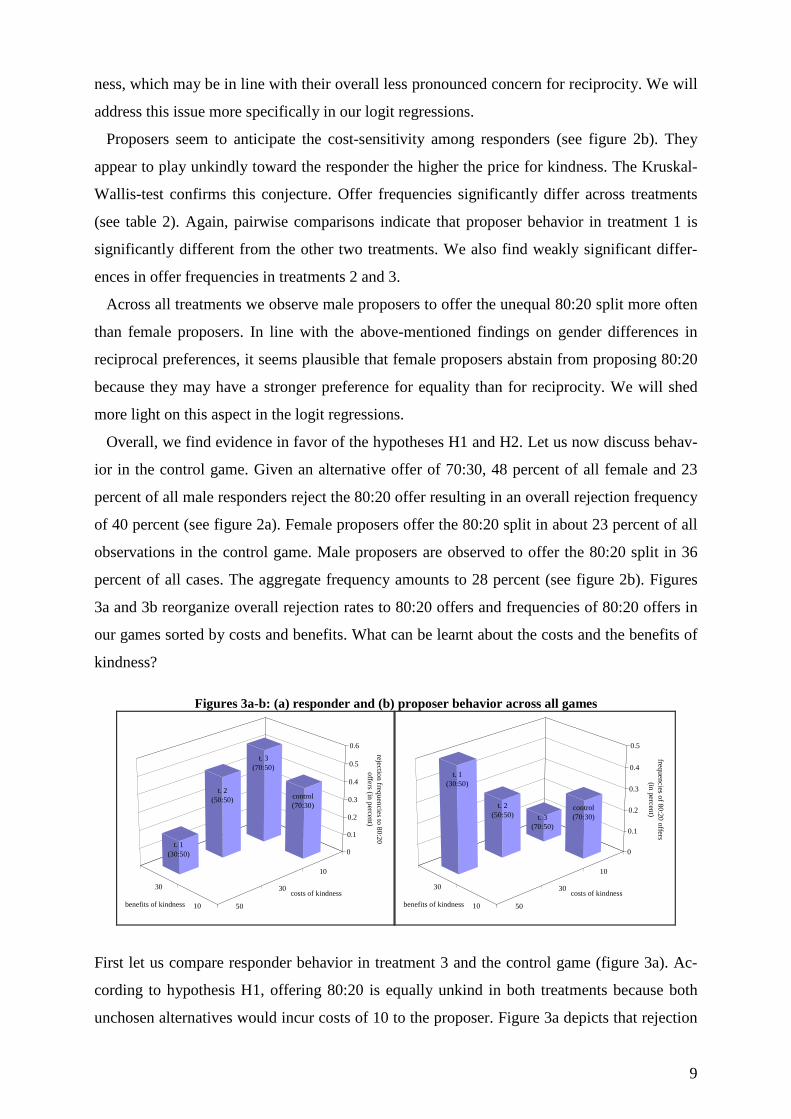
Figures 3a-b: (a) responder and (b) proposer behavior across all games
50
30
10
30
10
0
0.1
0.2
0.3
0.4
0.5
0.6
rejectio
n fre
que
ncie
s to 80:2
0
offe
rs (in pe
rcent)
costs of kindness
benefits of kindness
t. 1 (30:50)
t. 2 (50:50)
t. 3 (70:50)
control (70:30)
50
30
10
30
10
0
0.1
0.2
0.3
0.4
0.5
freq
uen
cies of 8
0:20
offers
(in pe
rcent)
costs of kindness
benefits of kindness
t. 1 (30:50)
t. 2 (50:50) t. 3
(70:50)
control (70:30)
First let us compare responder behavior in treatment 3 and the control game (figure 3a). Ac-
cording to hypothesis H1, offering 80:20 is equally unkind in both treatments because both
unchosen alternatives would incur costs of 10 to the proposer. Figure 3a depicts that rejection

10
rates decrease from 53 percent in treatment 3 to 40 percent in the control game. The drop in
rejection rates comes along with a decrease of 20 in the benefits of kindness. Although this
effect is not significant at conventional levels (z=-1.114, p=.2652, Mann-Whitney), it points
out that benefits of kindness do play a role. It is not the costs of kindness that can alone be
held responsible for observed variations.
Moreover, we observe that offer frequencies also vary with the benefits of kindness (figure
3b). The average proposer offers the 80:20 split in only 13 percent of all observations in
treatment 3. In contrast, almost one third of all proposers in the control game choose the 80:20
offer. This difference is slightly significant (z=1.667, p=.0956, Mann-Whitney) and indicates
that proposers assume their counterparts to respond differently when the foregone benefits
change across games. In line with Rabin-like reciprocal preferences, subjects may actually
consider the foregone benefits associated with an unchosen alternative.
But what is more important to subjects, the costs or the benefits of kindness? To answer this
question let us compare rejection rates and offer frequencies in treatment 2 with those in the
control game. Taking the third treatment as a reference, these games capture the effects of a
reduction in the costs of kindness by 10 units (treatment 2) and a reduction in the benefits of
kindness by 10 units (control game). If costs are more important than benefits we should find
that rejection rates in treatment 2 are lower than in the control game and, analogously, that
offer frequencies in the control game are lower than in treatment 2. However, as can be seen
in figures 3a and 3b, we find only very minor differences between behaviors in these games.
Rejection rates in treatment 2 are slightly higher than in the control game (z=-.502, p=.6160,
Mann-Whitney). This implies that, if at all, responders care less about their own benefits as
compared to the proposers’ costs of kindness. Offer frequencies are almost equally high in
both games. We observe a difference of less than 1 percentage point between frequencies in
treatment 2 and the control game (z=.023, p=.9815, Mann-Whitney). Overall, these findings
suggest that the costs and benefits of kindness being valued largely equal among responders
and proposers.
6. Logit Analyses
The following multivariate estimations allow us to more robustly quantify the effects of
costs and benefits of kindness on responder and proposer behavior. Tables 3 and 4 report the
results of logit estimations on the likelihood to reject the 80:20 offer at node n2 (table 3) and
on the probability to offer the 80:20 split at node n1 (table 4). The leftmost column in each
table lists the explanatory variables: the costs of kindness (ranging from 10-50), the benefits
of kindness (either 10 or 30), a dummy for male subjects, and cross-terms for male subjects

11
and the costs and benefits of kindness. The columns to the right provide coefficients, z-
statistics, and p-values for a given set of variables. Model statistics are reported at the very
bottom of each table.
Table 3: logit analysis of responder behavior
dependent variable: probability to reject 80:20 at node n2
model 1 model 2 model 3 model 4
independent variable(s)
Coef. z P>|z| Coef. z P>|z| Coef. z P>|z| Coef. z P>|z|
costs of kindness -.0380 -3.23 .001 -.0380 -3.23 .001 -.0384 -2.78 .005 -.0297 -2.09 .037
benefits of kindness .0337 1.55 .122 .0337 1.55 .121 .0337 1.55 .121 .0028 .11 .915
male .0407 -.12 .907 .0164 .03 .979 -1.897 -1.63 .103
male x costs of kindness
.0010 .05 .963 -.0271 -1.04 .298
male x benefits of kindness
.1037 2.06 .040
constant -.3616 -.73 .463 -.3752 -.74 .459 -.3673 -.69 .492 .1949 .33 .741
N 172 172 172 172
Pseudo R² .0491 .0491 .0491 .0690
Model 1, table 3, estimates the impact of costs and benefits of kindness on rejection rates.
Model 2 extends the list of explanatory variables as to include the dummy for male respond-
ers. Models 3 and 4 also include cross-terms for male subjects and the costs and benefits of
kindness.
Across all models, we find that the costs of kindness have a negative impact on the rejection
probability, confirming hypothesis H1. Each Taler the proposer would forfeit in the unchosen
alternative significantly lowers the rejection probability. This result confirms our previous
observation. The value of -0.0380, for example, is the effect of the costs of kindness on the
ratio between two odds. Respondents who are confronted with an increase in the costs of
kindness by 20 obtain an odds ratio that amounts to exp(-0.0380*20)=0.47. Thus, they are
about half as likely to reject the unkind proposal if the costs increase by 20.
The benefits of kindness exert a positive influence on rejection behavior. For each Taler of
benefits the responder would earn in the unchosen alternative, the probability to reject the
actual 80:20 offer increases with a coefficient of 0.0337 in model 1. An increase of the bene-
fits of kindness by 20 thus increases the odds ratio by exp(0.0337*20)=1.96. They are thus
about double as likely to reject. However, this effect seems to be of weak nature (p<.13),
which may result from the fact that only few observations were available for this comparison.
As indicated by the positive sign of the male dummy in model 2, men are generally predicted
to reject insignificantly more often (p=.907). The models 3 and 4 offer a more detailed analy-
sis of gender effects. As suggested by the three treatments in figure 2a, male responders may
12
respond more strongly to changes in the costs of kindness. We test for this interaction by
model 3. However, we do not find evidence that a subject’s gender negatively interacts with
the costs. To the contrary, the model coefficient indicates that rejection rates of male respond-
ers rather increase in the costs of kindness. This can be related to gender differences in the
control game. In this game, we observe 48 percent of the female subjects to reject the 80:20
offer compared to 23 percent of the male responders. Thus, we observe in the control treat-
ment many rejections by women when costs of kindness are low. In order to isolate the im-
pact of costs on male responders we must hence also control for the interaction between a
subject’s gender and the benefits of kindness. In the fourth model we include two cross-terms
regarding gender-specific responder behavior. Confirming our previous results, we find the
costs of kindness to significantly decrease the probability to reject for both gender (p=.037).
We now observe weak evidence that male responders are less likely to reject (p=.103) and, as
indicated by figure 2a, that male subjects react more strongly to changes in the costs of kind-
ness (p=.298). However, the most severe difference in gender behavior can be observed with
respect to the benefits of kindness. We find only male subjects to significantly respond to
their foregone gains (p=.040). Female responders do not seem to alter their behavior with
respect to the benefits of kindness (the error probability for benefits to matter once controlling
for male participants amounts to p=.915). This finding gives strong support to previous evi-
dence on gender-specific preferences for reciprocity (e.g. Cox 2002, Lambsdorff and Frank
2011, Schubert 2011). The overall impact of the benefits of kindness seems to be mainly driv-
en by male responders in our subject pool. While male subjects seem to strongly care about
foregone costs and benefits, women are found to be less responsive to changes in the benefits
but only to the costs of kindness.
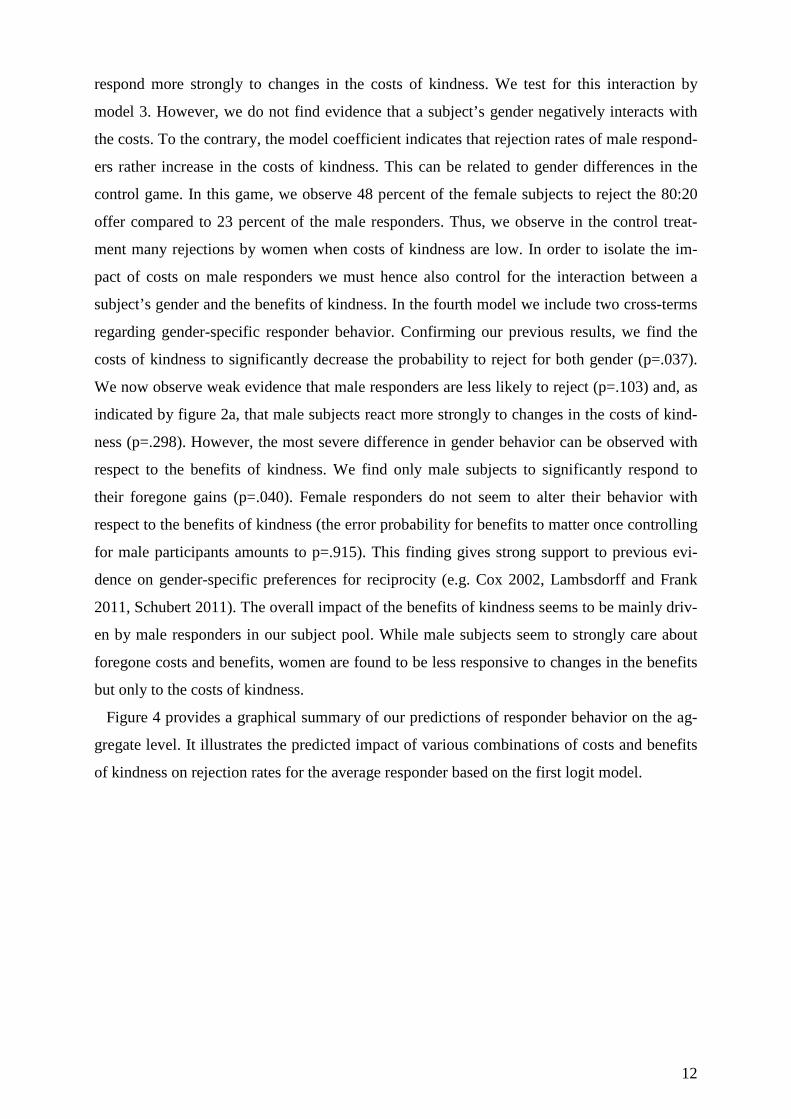
Figure 4 provides a graphical summary of our predictions of responder behavior on the ag-
gregate level. It illustrates the predicted impact of various combinations of costs and benefits
of kindness on rejection rates for the average responder based on the first logit model.

13
Figure 4: predicted rejection frequencies to 80:20 offers
0
0.1
0.2
0.3
0.4
0.5
0.6
100 90 80 70 60 50 40 30 20 10
costs of kindness
probability of rejecting 80:20 offers
benefits=55 benefits=30
benefits=10
benefits=60
bs
fff1c
t3predictedobserved
t2
t1
fff2
More specifically, figure 4 presents estimated rejection frequencies for a broad range of
costs (5-100) and four values of benefits (10, 30, 55 and 60). The estimates fit our data quite
well. First, figure 4 highlights the predicted rejection rates for our treatments (t1, t2, t3) and
for the control game (c). The estimates fit our data quite well. Besides the positive impact of
costs on the probability to reject, we would also expect a cost reduction of 20 units to have a
slightly higher impact than a reduction in the benefits of 20 units (comparing t2 with t3 and c
with t3). Second, our regressions also provide reasonable estimates for experiments carried
out by Brandts and Solà (2001), denoted as bs, and Falk et. al (2003), denoted as fff1 and fff2.
Brandts and Solà (2001: 147), for example, find responders to reject 80:20 offers with uncho-
sen alternatives of 25:75 (costs=benefits=55) 35 percent of the time, our prediction, bs, being
35.4 percent.4 When the alternative offer is the 50:50 split (costs=benefits=30), Falk et al.
(2003: 23) observe that 44 percent reject the 80:20 offer. The corresponding estimates of our
model, fff1, are 37.9 percent. Less than 27 percent reject the 80:20 offer given an unchosen
alternative of 20:80 (costs=benefits=60), our prediction, fff2, being 34.9 percent.
Altogether, the results of the logit regressions on responder behavior broadly confirm the
conjecture that we consider more than just our foregone benefits when evaluating the kindness
of an action. Subjects take into account the situational constraints the actor was facing –
whether he had to pay a high price for being kind to us or whether kindness was cheaply
available to him.
Let us finally discuss the results of four logit regressions on proposer behavior (table 4). In
model 1 we estimate the impact of costs and benefits of kindness on the probability to select
the offer 80:20. Model 2 expands model 1 by the gender dummy, while models 3 and 4 also
4 Brandts and Solà also observe that rejection rates decrease to 20 percent when the alternative is a 12.5:87.5 (costs=benefits=67.5). Our prediction amounts to 34.1 percent. This suggests that with benefits and costs of kindness being large our forecasts are less reliable.

14
include cross-terms for interaction between male responders and costs and benefits of kind-
ness.
Table 4: logit analysis of proposer behavior
dependent variable: probability to offer 80:20 at node n1
model 1 model 2 model 3 model 4
independent variable(s)
Coef. z P>|z| Coef. z P>|z| Coef. z P>|z| Coef. z P>|z|
costs of kindness .0487 3.65 .000 .0501 3.70 .000 .0522 3.14 .002 .0584 2.94 .003
benefits of kindness -.0491 -1.83 .067 -.0514 -1.89 .058 -.0517 -1.90 .058 -.0692 -1.77 .076
male .8393 -2.34 .020 .9748 1.37 .171 .4225 .38 .704
male x costs of kindness
-.0046 -.22 .825 -.0160 -.58 .561
male x benefits of kindness
.0353 .64 .520
constant -.9660 -1.78 .075 -1.285 -2.25 .025 -1.342 -2.13 .033 -1.096 -1.53 .126
N 172 172 172 172
Pseudo R² .0736 .0997 .0999 .1019
Overall results suggest that proposer behavior is also influenced by the costs and benefits
associated with the unchosen alternative. In all four models the costs of kindness significantly
increase the likelihood to propose an 80:20 split (p<.01). As expected, the benefits of kind-
ness decrease the probability to offer the 80:20 split in all models. This effect is generally
significant at the 10 percent error level. Model 2 shows that the proposer’s gender signifi-
cantly impacts his decision to offer the 80:20 split. Male proposers appear to be more likely to
propose the asymmetric 80:20 split. If behavior is less motivated by strategic concerns (see
e.g. Eckel and Grossman 2008), this provides further evidence to the conjecture that female
responders abstain from proposing 80:20 because they are more averse to inequality. The
models 3 and 4 do not provide additional insights on proposer behavior. As a consequence,
we find that male and female proposers seem to care equally about the costs and the benefits
of kindness. Thus, females do also worry about the foregone benefits of their counterparts.
However, the impact of benefits seems to be role-specific. If female subjects act as responders
they seem to care less about their own foregone gains.
Overall, the results reported in table 4 nicely match our previous findings on responder be-
havior. We find significant support for our hypothesis H2. Offer rates increase in the costs of
kindness. We also find some evidence that offer rates decrease in the benefits of kindness.
Consideration of the costs of kindness among proposers would have been expected already
by Rabin (1993). In his view, proposers value the material loss from acting kindly against the
preference for reciprocity with the latter being driven only by the benefits awarded to the re-
sponder. This argument appears compelling and should have motivated costs to exert a
15
stronger influence than benefits on the proposer’s behavior. We were surprised that both in-
fluences were largely identical in magnitude. Our model on the costs and benefits of kindness
thus seem to capture responder’s and proposer’s equally well.
7. Conclusion
Reciprocity theory argues that the perception of kindness determines our behavioral re-
sponse to an action. However, we still know little about how to evaluate the kindness in the
laboratory. While Rabin (1993) puts emphasis on intrapersonal comparisons, more recent
models like Falk and Fischbacher (2006) stress that interpersonal comparisons are also impor-
tant determinants of kindness. Our study sheds more light on how we evaluate unchosen al-
ternatives. We propose a parsimonious approach to judging another person’s behavior based
on costs and benefits of kindness. We ran a series of mini ultimatum games to test our hy-
potheses. Our results indicate that both costs and benefits associated with unchosen alterna-
tives determine our perception of kindness. We confirm previous findings that the benefits of
(forgone) kindness significantly increase the willingness to exert negative reciprocity. But we
show that also the costs of kindness are relevant for subjects’ calculus, the magnitude of this
effect being similar to the one of benefits.
This way of judging provides us with a series of clear-cut predictions for a large variety of
bargaining situations. We may now also offer a likely explanation for our angriness toward
the car driver in our introductory example. When he passed by the lake we assumed that his
alternative option, to help us, was cheaply available and his kindness would have been ex-
tremely helpful. In such scenarios, we expect car drivers to recognize that our benefits out-
weigh their costs. What really adds to our anger is that the car driver’s disutility from stop-
ping the car appeared negligible compared to our benefits from surviving the hazard.
On the other hand, our data also suggest that the vast majority of subjects would immedi-
ately turn over, extricating us from our peril. Proposers disengage in unkind offers the higher
the benefits of kindness. Not surprisingly, proposers take the costs of their kindness also into
consideration, abstaining from costly kindness either because they dislike the material loss or
because they believe that the responder should not expect such costly kindness. We observed
that responders respect this decision, abstaining from negative reciprocity when kindness
would have been too costly to the proposer. This suggests that proposers and responders co-
ordinate on a mutual perception of kindness in ultimatum bargaining.

16
References
Bolton, G. E., and A. Ockenfels (2005). A stress test of fairness measures in models of social
utility. Economic Theory 25(4): 957-982.
Brandts, J. and C. Solà (2001). Reference points and negative reciprocity in simple sequential
games. Games and Economic Behavior 36: 138-157.
Cox, J. C. (2002). Trust, reciprocity, and other-regarding preferences: groups vs. individuals
and males vs. females. In R. Zwick and A. Rapoport (ed.). Experimental Business Research
(pp. 331-349), Boston: Kluwer Academic Publishers.
Cox, J. C., Friedman, D., and S. Gjerstad (2007). A tractable model of reciprocity and fair-
ness. Games and Economic Behavior 59: 17-45.
Dufwenberg, M., and G. Kirchsteiger (2004). A theory of sequential reciprocity. Games and
Economic Behavior 47: 268–298.
Eckel, C. C., and P. J. Grossman (2008). Men, women and risk aversion: experimental evi-
dence. In: Handbook on the Economics of Experimental Economics Results. Vol. 1. C. R.
Plott and V. L. Smith (ed.). Amsterdam: Elsevier: 1061-1073.
Falk, A., Fehr, E., and U. Fischbacher (2003). On the nature of fair behavior. Economic In-
quiry 41(1): 0–26.
Falk, A., and U. Fischbacher (2006). A theory of reciprocity. Games and Economic Behavior
54(2): 293–315.
Falk, A., Fehr, E., and U. Fischbacher (2008). Testing theories of fairness – Intentions matter.
Games and Economic Behavior 62: 287-303.
Fehr, E., and K. M. Schmidt. 1999. A theory of fairness, competition, and cooperation. The
Quarterly Journal of Economics 114, no. 3:817–68.
Fischbacher, U. (2007). z-Tree: Zurich toolbox for ready-made economic experiments. Ex-
perimental Economics 10(2): 171-178.
Lambsdorff, J. Graf, and B. Frank (2011). Corrupt reciprocity - experimental evidence on a
men’s game. International Review of Law and Economics: in press.
Levine, D. K. (1998). Modeling altruism and spitefulness in experiments. Review of Eco-
nomic Dynamics 1(3): 593-622.
Rabin, M., 1993. Incorporating fairness into game theory and economics. American Economic
Review 83: 1281–1302.

17
Schubert, M (2011), Deeds rather than omissions. How unkind intentions provoke negative
reciprocity. Mimeo. University of Passau.
Seebald, A. (2010). Attribution and reciprocity. Games and Economic Behavior, 68, 339-352.
Sutter, M. (2007). Outcomes versus intentions: On the nature of fair behavior and its devel-
opment with age. Journal of Economic Psychology 28: 69-78.

Volkswirtschaftliche Reihe der Passauer Diskussionspapiere Bisher sind erschienen: V-1-98 Gerhard Rübel, Can adjustments to working hours help reduce unemployment? V-2-98 Martin Werding, Pay-as-you-go Public Pension Schemes and Endogenous
Fertility: The Reconstruction of Intergenerational Exchange V-3-98 Carsten Eckel, International Trade, Direct Investment, and the Skill Differential in
General Equilibrium V-4-98 Reinar Lüdeke, Das Staatsbudget und intergenerationelle Umverteilung, Das
Staatsvermögen als Instrument intergenerativer Verteilungspolitik und der ”generational accounting”-Ansatz: Alter Wein in neuen (höherwertigen) Schläuchen?
V-5-98 Anja Klüver und Gerhard Rübel, Räumliche Industriekonzentration und die kom-
parativen Vorteile von Ländern - eine empirische Studie der Europäischen Union V-6-98 Klaus Beckmann und Elisabeth Lackner, Vom Leviathan und von optimalen
Steuern V-7-98 Martin Werding, The Pay-as-you-go Mechanism as Human Capital Funding: The
”Mackenroth hypothesis” Revisited V-8-98 Reinar Lüdeke und Klaus Beckmann, Social Costs of Higher Education:
Production and Financing. The Case of Germany (1994) V-9-98 Gerhard Rübel, ”Faire” Löhne und die Flexibilität von Arbeitsmärkten in einem
Zwei-Sektoren-Modell V-10-98 Klaus Beckmann, Notizen zum Steueranteil von Rentenversicherungsbeiträgen im
Umlageverfahren V-11-98 Christian Jasperneite und Hans Joachim Allinger, Trendwende am westdeutschen
Arbeitsmarkt? - Eine ökonometrische Analyse V-12-98 Christian Jasperneite und Hans Joachim Allinger, Langfristige Perspektiven für
den westdeutschen Arbeitsmarkt: Was sagen die Gesetze von Okun und Verdoorn?
V-13-98 Hans Joachim Allinger und Christian Jasperneite, Saisonbereinigung von
Arbeitsmarktdaten bei aktiver Arbeitsmarktpolitik V-14-99 Reinar Lüdeke und Klaus Beckmann, Hochschulbildung, Humankapital und
Beruf: Auswertung einer Längsschnittsbefragung Passauer Absolventen 1988 -1998

V-15-99 Gerhard Rübel, Volkseinkommenssteigerung durch ausgabenfinanzierte Steuersenkung - Eine Umkehrung des Haavelmo-Theorems für offene Volkswirt-schaften
V-16-99 Silke Klüver, Konzentrationsursachen in der europäichen Versicherungsbranche -
eine empirische Untersuchung V-17-99 Reinar Lüdeke, Familienlastenausgleich, Elternleistungsausgleich und die Neu-
fundierung der umlagefinanzierten Altersversorgung V-18-99 Anja Klüver und Gerhard Rübel, Industrielle Konzentration als Kriterium für die
Geeignetheit eines einheitlichen Währungsraums – Eine empirische Untersuchung der Europäischen Union von 1972 bis 1996
V-19-00 Carsten, Eckel, Fragmentation, Efficiency-seeking FDI, and Employment V-20-00 Christian Jasperneite, Understanding Hysteresis in Unemployment: The German
Case V-21-00 Jörg Althammer, Reforming Family Taxation V-22-00 Carsten Eckel, Labor Market Adjustments to Globalization: Unemployment
versus Relative Wages V-23-00 Klaus Beckmann, Tax Competition through Tax Evasion V-24-01 Klaus Beckmann, Steuerhinterziehung, begrenzte Rationalität und Referenzab-
hängigkeit: Theorie und experimentelle Evidenz V-25-01 Klaus Beckmann, Solidarity, Democracy, and Tax Evasion: an Experimental
Study V-26-04 Michael Fritsch, Udo Brixy und Oliver Falck, The Effect of Industry, Region and
Time on New Business Survival - A Multi-Dimensional Analysis V-27-04 Gerhard D. Kleinhenz, Bevölkerung und Wachstum - Die Bevölkerungs-
entwicklung in Deutschland als Herausforderung für Wirtschafts- und Sozialpolitik
V-28-04 Johann Graf Lambsdorf, The Puzzle with Increasing Money Demand - Evidence
from a Cross-Section of Countries V-29-04 Frauke David, Oliver Falck, Stephan Heblich und Christoph Kneiding,
Generationsgerechtigkeit und Unternehmen V-30-04 Roland Engels†, Zur mikroökonomischen Fundierung der Geldnachfrage in
allgemeinen Gleichgewichtsmodellen
V-31-05 Johann Graf Lambsdorff, Between Two Evils – Investors Prefer Grand
Corruption! V-32-05 Oliver Falck, Das Scheitern junger Betriebe – Ein Überlebensdauermodell auf
Basis des IAB-Betriebspanels V-33-05 Raphaela Seubert - On the Nature of the Corrupt Firm: Where to Situate Liability? V-34-05 Johann Graf Lambsdorff – Consequences and Causes of Corruption – What do
We Know from a Cross-Section of Countries? V-35-05 Stephan Heblich - Arbeitszeitflexibilisierung Revisited V-36-05 Oliver Falck und Stephan Heblich - Das Konzept der eigenverantwortlichen
Generation zur Bewältigung des demographischen Wandels V-37-05 Florian Birkenfeld, Daniel Gastl, Stephan Heblich, Ferry Lienert, Mascha
Maergoyz, Oksana Mont und Andrius Plepys - Product ban versus risk management by setting emission and technology requirements – the effect of different regulatory schemes taking the use of trichloroethylene in Sweden and Germany as an example
V-38-05 Johann Graf Lambsdorff - Determining Trends for Perceived Levels of Corruption V-39-05 Oliver Falck - Mayflies and Long-Distance Runners: The Effects of New Business
Formation on Industry Growth V-40-05 Johann Graf Lambsdorff und Christian Engelen - Hares and Stags in Argentinean
Debt Restructuring V-41-05 Johann Graf Lambsdorff und Mathias Nell – Let Them Take Gifts, and Cheat
Those Who Seek Influence V-42-06 Hans Joachim Allinger – Bürgerversicherung und Kopfpauschale haben vieles
gemeinsam – Anmerkungen zur Diskussion einer Reform der gesetzlichen Krankenversicherung
V-43-06 Michael Schinke und Johann Graf Lambsdorff - Insider Trading among Central
Bankers – a Treatise on Temptation and Policy Choice V-44-06 Johann Graf Lambsdorff und Hady Fink - Combating Corruption in Colombia:
Perceptions and Achievements V-45-06 Oliver Falck und Stephan Heblich - Corporate Social Responsibility: Einbettung
des Unternehmens in das Wirtschaftssystem V-46-06 Johann Graf Lambsdorff und Luka Bajec - There Is No Bank Lending Channel! V-47-06 Christian Engelen und Johann Graf Lambsdorff - Das Keynesianische
Konsensmodell

V-48-07 Stephan Heblich - Eigenverantwortliche Individuen und Pro-Aktive Unternehmen V-49-07 Christian Engelen und Johann Graf Lambsdorff - Das Keynesianische
Konsensmodell einer offenen Volkswirtschaft V-50-07 Christian Engelen und Johann Graf Lambsdorff - Fairness in Sovereign Debt
Restructuring V-51-07 Johann Graf Lambsdorff und Björn Frank - Corrupt Reciprocity - an Experiment V-52-07 Mathias Nell - Strategic Aspects of Voluntary Disclosure Programs for Corruption
Offences - Towards a Design of Good Practice - V-53-07 Mathias Nell - Contracts Induced by Means of Bribery - Should they be Void or
Valid? V-54-08 Michael Pflüger – Die Neue Ökonomische Geographie: Ein Überblick V-55-08 Florian Birkenfeld und Shima'a Hanafy - Wie zentral sind die Abschlussprüfungen
an deutschen Schulen wirklich?" V-56-08 Florian Birkenfeld - Kleine Klassen und gute Luft - Warum sind die Grundschulen
auf dem Land besser? V-57-08 Johann Graf Lambsdorff – The Organization of Anticorruption – Getting
Incentives Right! V-58-09 Oliver Farhauer und Alexandra Kröll - Verfahren zur Messung räumlicher
Konzentration und regionaler Spezialisierung in der Regionalökonomik V-59-09 Oliver Farhauer und Alexandra Kröll - Die Shift-Share-Analyse als Instrument der
Regional- und Clusterforschung V-60-10 Johann Graf Lambsdorff – Deterrence and Constrained Enforcement – Alternative
Regimes to Deal with Bribery V-61-10 Johann Graf Lambsdorff – Who Accepts Bribery? Evidence from a Global
Household Survey V-62-10 Oliver Farhauer und Alexandra Kröll – What We Can and What We Can’t Say
About Employment Growth in Specialised Cities V-63-11 Johann Graf Lambsdorff, Manuel Schubert und Marcus Giamattei – On the Role
of Heuristics - Experimental Evidence on Inflation Dynamics