decline of the common murre in central california, 1980 … · studies in avian biology no....
TRANSCRIPT

Studies in Avian Biology No. 14:149-163, 1990.
Auks in Peril
DECLINE OF THE COMMON MURRE IN CENTRAL CALIFORNIA, 1980-1986
JEAN E. TAKEKAWA, HARRY R. CARTER, AND THOMAS E. HARVEY
Abstract. Aerial surveys of 13 Common Murre (Uris aalge) colonies were conducted in California in 1985 and 1986. Breeding population estimates for eight colonies in central California and five colonies in northern California were compared with estimates determined in 1980-1982. The central California population declined 52.6% within 4-6 years, from 229,080 in 1980-1982 to 108,530 in 1986. The northern California population remained relatively unchanged during the same period; combined totals at four colonies declined 5.4% from 118,080 in 1979-1982 to 111,730 in 1986. Population decline in central California was caused by high mortality from an intensive nearshore gill-net fishery, compounded by that from oil spills and a severe El Niiio-Southern Oscillation event in 1982-1983. Individual colonies declined 45.8-100% and the most severe declines occurred at colonies located nearest to areas of highest gill-net fishing mortality.
Key Words: Aerial surveys; Alcidae; Common Murre; El Nifio; oil spill; gill-net fishery; uric aaige.
In 1979 and 1980, over 360,000 Common Murres (Uris aalge) nested in colonies distrib- uted between Castle Rock, Del Norte County, in northern California and Hurricane Point Rocks, Monterey County, in central California @owls et al. 1980). Eight colonies in central California (about 30% of the state population) occurred south of Point Reyes (37”59’N, 123”59’W), whereas 12 northern California colonies (about 70% of the state population) occurred north of Cape Vizcaino (39”43’N, 123’49’W) (Fig. 1). We think there is little immigration or emigration between populations in central and northern Cal- ifornia because they are separated by a distance of about 200-250 km, and in both areas birds remain near breeding colonies throughout the year (Storer 1952; DeGange and Sowls 198 1; Ainley and Boekelheide 1990).
While murre numbers have increased at some colonies throughout this century (Osborne and Reynolds 197 1, Osborne 1972, Sowls et al. 1980) increases in Farallon Island colonies in central California followed a severe historical popula- tion decline due to human occupation, egging, and chronic oil pollution in the Gulf of the Far- allones. An estimated population of 400,000 birds in the mid- 1800s fell to a few thousand birds in the mid-1900s (reviewed in Ainley and Lewis 1974). Partial protection was afforded colonies in 1909 when North Farallon (Fig. 1) and West End islands (Fig. 2) were established as the Far- allon National Wildlife Refuge (NWR), under the jurisdiction of the U.S. Fish and Wildlife Service (USFWS). Egging stopped around the turn of the century and Dawson (1923) reported as many as 20,000 murres in 19 11. However, mor-
talities caused by oil pollution from ship bilge discharges and oil spills continued to occur in the area (Palmer 1921, Moffitt and Orr 1938, Houldson 1952) and only a few hundreds to thousands of murres were reported from the 1920s to 1950s (e.g., Chaney 1924).
Additional protection was established in 1969 when Southeast Farallon Island (SEFI) and neighboring islets (Fig. 2) were included within the Farallon NWR. Since 1967 Point Reyes Bird Observatory (PRBO) has conducted research on the Farallon Islands, and since 197 1 PRBO per- sonnel have resided on the refuge through a co- operative agreement with USFWS, providing wardens for the first time on the islands and mon- itoring marine bird populations. Between 1959 and 1972 the murre population grew from about 6000 to 22,000 birds, despite the major 1971 San Francisco oil spill when thousands were killed (Smail et al. 1972, Ainley and Lewis 1974). In 1974 North Farallon and West End islands were designated as Wilderness Areas. This protection and lessened oil pollution allowed the breeding population to increase through the 1970s and early 1980s (DeSante and Ainley 1980; Ainley and Boekelheide 1990). By 1980, the South Far- allon Islands (including West End Island, SEFI, and neighboring islets) supported the second largest murre colony in California (about 17% of the state population). The largest was at Castle Rock in northern California (Sowls et al. 1980), which was designated a NWR in 1980. There is little historical information on murre colonies in northern California, but numbers also increased there through the 1970s (Osborne 1972, Sowls et al. 1980). In southern California, murres for-
149

150 STUDIES IN AVIAN BIOLOGY NO. 14
,‘-
Y
FIGURE 1. Locations of 2 1 Common Murre colonies in California (from Sowls et al. 1980). Central California colonies (inset): 1, South Farallon Islands; 2, North Farallon Islands; 3, Point Reyes; 4, Point Resistance; 5, Double Point Rocks; 6, Devil’s Slide Rock; 7, Castle Rocks; 8, Hurricane Point Rocks. Northern California colonies (left): 9, Castle Rock, 10, Sister Rocks; 11, False Klamath Rock, 12, Redding Rock, 13, White Rock, 14, Green Rock; 15, Flatiron Rock; 16, Blank Rock; 17, Pilot Rock, 18, False Cape Rocks; 19, Steamboat Rock; 20, Cape Vizcaino. Southern California colonies (left): 2 1, Prince Island. The 40 and 15 fathom contours (inset) are indicated by the dashed line north and south of Waddell Creek, respectively.
SOUTH FARALLON ISLANDS
Sh”brlck , Pmlt
FIGURE 2. Map of the South Farallon Islands, San Francisco County. Common Murre nesting areas in 1986 are darkened. Numbered plots were used to mon- itor murres and to provide correction factors: 1, Upper Shubrick Point; 2, Lower Shubrick Point; 3, Cove Point; 4, Tower Point; 5, North Landing; 6, Chocolate Chip Islet; 7, Finger Rock; 8, Saddle Rock.
merly bred at Prince Island, but have been absent since the early 1900s (Hunt et al. 1979, Sowls et al. 1980).
After 1979 a decline in the numbers of murres breeding at the Farallon Islands occurred follow- ing heavy mortality of murres from gill-net fish- ing, two major oil spills, and the effects of the intense 1982-l 983 El Nifio-Southern Oscillation event (ENSO) (Carter 1986; Atkins and Hene- man 1987; Ford et al. 1987; Page et al. 1990; Ainley and Boekelheide 1990). ENS0 causes re- duced ocean productivity, thereby affecting sea- bird reproduction. However, gill-net mortality was of special concern, because it was restricted to the smaller central California population and thousands of murres were being killed (Califor- nia Department of Fish and Game [CDFG] 198 1, 1987; Atkins and Heneman 1987; Stenzel et al. 1988; CDFG, unpubl. data).
Declines were first detected at the Farallon Is- lands in 1984. Other colonies had not been cen- sused since 1982 and their status was unknown. In 1985 and 1986, USFWS and PRBO con- ducted aerial surveys to refine breeding popu-
MURRE DECLINE IN CALIFORNIA- Tukekuwu et al. 151
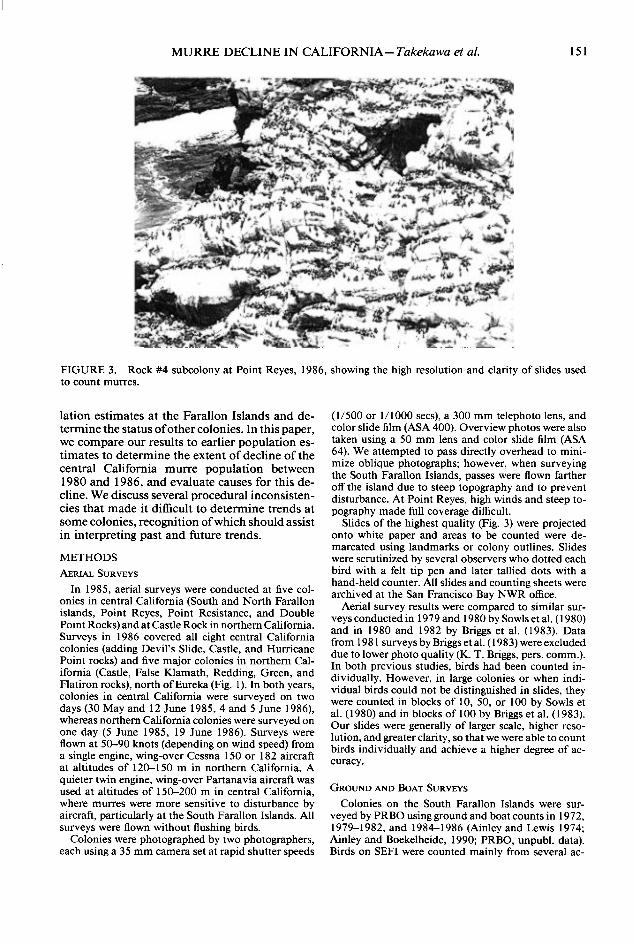
FIGURE 3. Rock #4 subcolony at Point Reyes, 1986, showing the high resolution and clarity of slides used to count murres.
lation estimates at the Farallon Islands and de- termine the status of other colonies. In this paper, we compare our results to earlier population es- timates to determine the extent of decline of the central California murre population between 1980 and 1986, and evaluate causes for this de- cline. We discuss several procedural inconsisten- cies that made it difficult to determine trends at some colonies, recognition ofwhich should assist in interpreting past and future trends.
METHODS
AEIUAL SURVEYS In 1985, aerial surveys were conducted at five col-
onies in central California (South and North Farallon islands, Point Reyes, Point Resistance, and Double Point Rocks) and at Castle Rock in northern California. Surveys in 1986 covered all eight central California colonies (adding Devil’s Slide, Castle, and Hurricane Point rocks) and five major colonies in northern Cal- ifornia (Castle, False Klamath, Redding, Green, and Flatiron rocks), north of Eureka (Fig. 1). In both years, colonies in central California were surveyed on two days (30 May and 12 June 19854 and 5 June 1986). whereas northern California colonies were surveyed on one day (5 June 1985, 19 June 1986). Surveys were flown at 50-90 knots (depending on wind speed) from a single engine, wing-over Cessna 150 or 182 aircraft at altitudes of 120-150 m in northern California. A quieter twin engine, wing-over Partanavia aircraft was used at altitudes of 150-200 m in central California, where murres were more sensitive to disturbance by aircraft, particularly at the South Farallon Islands. All surveys were flown without flushing birds.
Colonies were photographed by two photographers, each using a 35 mm camera set at rapid shutter speeds
(l/500 or l/1000 sets), a 300 mm telephoto lens, and color slide film (ASA 400). Overview photos were also taken using a 50 mm lens and color slide film (ASA 64). We attempted to pass directly overhead to mini- mize oblique photographs; however, when surveying the South Farallon Islands, passes were flown farther off the island due to steep topography and to prevent disturbance. At Point Reyes, high winds and steep to- pography made full coverage difficult.
Slides of the highest quality (Fig. 3) were projected onto white paper and areas to be counted were de- marcated using landmarks or colony outlines. Slides were scrutinized by several observers who dotted each bird with a felt tip pen and later tallied dots with a hand-held counter. All slides and counting sheets were archived at the San Francisco Bay NWR office.
Aerial survey results were compared to similar sur- veys conducted in 1979 and 1980 by Sowls et al. (1980) and in 1980 and 1982 by Briggs et al. (1983). Data from 198 1 surveys by Briggs et al. (1983) were excluded due to lower photo quality (K. T. Brings, pers. comm.). In both previous studies, birds had been counted in- dividually. However, in large colonies or when indi- vidual birds could not be distinguished in slides, they were counted in blocks of 10, 50, or 100 by Sowls et al. (1980) and in blocks of 100 by Briggs et al. (1983). Our slides were generally of larger scale, higher reso- lution, and greater clarity, so that we were able to count birds individually and achieve a higher degree of ac- curacy.
GROUND AND BOAT SURVEYS
Colonies on the South Farallon Islands were sur- veyed by PRBO using ground and boat counts in 1972, 1979-1982, and 1984-1986 (Ainley and Lewis 1974; Ainley and Boekelheide, 1990; PRBO, unpubl. data). Birds on SEFI were counted mainly from several ac-

152 STUDIES IN AVIAN BIOLOGY NO. 14
EGG LAYING FLEDGING IS -
- n B---G-
--+--- A B----c
- A B--t-
- A B-t
- A B-
- A B-
- A B-
- A Bt
- AB ----c
- A B-
-A & 84
I ,
21 1 11 21 31 10 20 30 10 20 30 9 19
MAY JUNE JULY AUGUST
FIGURE 4. Annual variation in mean (&SD) egg- laying and fledging dates of Common Murres in the Upper Shubrick Point plot, SEFI. Symbols A and B refer to last egg laid and first chick fledged, respectively. Data are from Ainley and Boekelheide (1990) and PRBO (unpubl. data).
cessible vantage points on the island, whereas those on neighboring islets and West End Island were counted mainly from a small boat. Murres were counted in- dividually in small colonies and in blocks of 10, 50, or 100 in larger or very dense colonies.
PRBO recognized several potential sources of count- ing error (primarily for boat surveys) including envi- ronmental conditions, visibility, and observer experi- ence. Hence, we initiated aerial surveys in 1985 to estimate populations more accurately on West End Is- land and elsewhere. Murres on SEFI continued to be surveyed mainly by ground counts due to their acces- sibility and the greater accuracy of these counts.
CENSUS PERIOD Aerial surveys were conducted between the end of
egg laying and the start of fledging as determined at the South Farallon Islands. Murre numbers are high and least variable during this period (Birkhead 1978, Slater 1980, Gaston and Nettleship 1981), although Hatch and Hatch (1989) found a wider window. We based census dates on information from South Farallon Islands, where timing and success of breeding have been monitored in the Upper Shubrick Point plot (Fig. 2) since 1972 (data from Ainley and Boekelheide, 1990; PRBO, unpubl. data). Breeding phenology in northern California appears to be similar to that in central California (Sowls et al. 1980).
There is much annual variation in breeding phe- nology on South Farallon Islands (Fig. 4). Egg laying was protracted; on average, only 16.2 ? 10.4 days (N = 15 years, R = e4 1 days) occurred between dates when the last egg was laid (excluding replacement eggs) and the first chick fledged. We attempted to conduct aerial surveys of the Farallon Islands near the date when the last egg was expected to be laid. Other col- onies were surveyed as soon as possible thereafter. Boat and ground surveys at South Farallon Islands were conducted slightly later, usually in early to mid-June
., o&w cam loo0 12w 1403 16W 18W mm
TIME OF DAY (PDT)
FIGURE 5. Mean (*SD) numbers of Common Murres in the Upper Shubrick Point plot at hourly intervals throughout the day during the census period in 1982, 1983, and 1984. Data are from L. B. Spear (unpubl. data) and PRBO (unpubl. data).
when egg laying was completed, except in 1984 when rough weather and prolonged egg laying (Fig. 4) delayed the census until 1 July.
TIME OF CENSUS Surveys were conducted during mid-day when num-
bers of murres attending colonies are usually high and least variable (Birkhead 1978, Birkhead and Nettleship 1980). Although diurnal patterns of attendance have been found to vary between colonies (Gaston and Net- tleship 198 1, Piatt and McLagan 1987) it generally has been assumed that year-to-year patterns are similar at specific colonies (see Birkhead and Nettleship 1980).
To determine the time of day when murre numbers were most constant at SEFI, we examined counts made in the Upper Shubrick Point plot from 1982 to 1984 (Fig. 5) between when the last egg was laid (excluding replacements) and the first chick fledged (6-29 June 1982, N = 10 days; 24 June-22 July 1983, N = 25 days). In 1984 we widened this window of time (27 May-10 July, N = 10 days) when the first chick fledged before the last egg was laid. Diurnal attendance patterns varied widely between years (Fig. 5). In 1983 and 1984, greater coefficients of variation (CV) occurred around hourly means, averaging 0.19 + 0.0 1 (SD; R = 0.16- 0.21; N = 14 means from 06:00-19:OO [PDT]) and

MURRE DECLINE IN CALIFORNIA- Tukekuwu et al. 153
TABLE 1. NUMBERS OF COMMON Muaans IN THE UPPER SHUBR~CK POINT PLOT ON SEFl USED TO C-m THE K CORRECTION FACTOR AM) BREEDER : NON-BREEDER RATIO (BNR), 1980-l 986
Date
No. birds per site in plot’
TB TNB K BNR
1986 3 Jun 1.03 (119)2 1.71 (7) 4 Jun 1.02 (117) 1.50 (6) 5 Jun 1.03(118) 1.83 (6) mean 1.03 1.68
1985 19 Jun 1.08 (121) 2.50 (8) 21 Jun 1.07 (121) 2.63 (8)
mean 1.08 2.57
1984 1 Jul 1.17 (86) 1.52 (33) 1981 8-9 Jun 1.14 (155) - 1980 7Jun 1.17 (150) -
’ Total breeders ITB) includes failed breeders: total non-breeden uer non-breeding site (TNB). 2 The number of’sites are indicated within parentheses.
1.76 19.83 1.83 26.00 1.77 21.45 1.79 22.43
1.60 12.10 1.61 11.52 1.61 11.81
1.14 3.44 1.66 31.00 1.64 42.86
0.10 +- 0.03 (R = 0.06-O. 16), respectively. The CV was lower in 1982, averaging 0.05 + 0.01 (R = 0.04-0.06). These values were within the range of those found by Lloyd ( 1975) and Gaston and Nettleship (198 1). Only in 1984 did CV vary slightly with time of day.
Diurnal attendance patterns in 1982 and 1983 may have been influenced by the intense 1982-1983 ENS0 (Ainley and Boekelheide 1990). We conducted hourly counts of murres in the Upper Shubrick Point plot on 13 and 29 June 1985 and 1 and 17 June 1986. Murre numbers most closely approximated the diurnal pat- tern of attendance exhibited in 1984 (Fig. 5) and we suspect that in most years, murre numbers are consis- tent throughout mid-day. Therefore, we conducted ae- rial surveys of the South Farallon Islands between lO:OO-12:00 when murre numbers there should be high and least variable. Other colonies were surveyed between lO:OO-14:00 to provide sufficient time to survey several colonies in a day and to minimize effects of any diurnal variation. Previous surveys were also conducted in mid-day (Sowls et al. 1980), although Briags et al. (1983) used a wider window of time (09:00- 17:OO).
K CORRECTION FACXOR
Birkhead and Nettleship (1980) and Gaston and Net- tleship (198 1) used the K correction factor to convert total counts of birds into estimates of breeding pairs as follows:
K(t,) = nJn,(t,) (1)
where: n, = number of first eggs laid in a plot and n,(t,) = total number of birds present in a plot at time t,. We used a slight variation of K to convert total counts of birds into estimates of total numbers of breeding birds as follows:
K(t)) = n&2)/n&,) (2)
where: n, = number of egg-laying sites for first eggs in the Upper Shubrick Point plot on the census day (mul- tiplied by two breeding birds per site). Since some sites were partially obscured in some years (R. J. Boekel- heide, pers. comm.), only those sites fully visible on the census day were used. In 1981 and 1986, the last egg (excluding replacements) was laid a few days after
the census date (see Fig. 4). Although these factors slightly biased our calculation of K, overall error prob- ably remained within about 5% (see Gaston et al. 1983).
K varied between 1.14-1.79 during the 5 years ex- amined (Table 1). In 1984, K was very low (1.14) due to larger-than-normal numbers of non-breeding birds and sites and a sharp decrease in the number of breed- ing sites in the plot. In the remaining years ( 1980,198 1, 1985, and 1986), K varied little between days and years (R = 1.60-l .83). We averaged these annual K values to derive a mean (*SD) K-value of 1.68 & 0.08 (N = 4 years) and applied it to all aerial counts by Sowls et al. (1980) Briggs et al. (1983), and this study, except for Farallon Islands counts. Thus, atypical breeding years such as 1983 and 1984 were not used to develop the mean K value and, coincidentally, aerial surveys were not conducted in those years. This mean K value was very close to the value of 1.67 that Sowls et al. (1980) and Briggs et al. (1983) used to adjust their counts (Ainley and Boekelheide 1990). K values specific to each year were used to adjust counts at the South and North Farallon islands, except for 1982 when K was not determined, here the 1981 K value was substituted because these years seemed similar. All breeding population estimates were then rounded to the nearest 10.
South and North Farallon islands aerial survey counts were further refined with a ground truthing correction factor determined each year on SEFl. Breeder : non- breeder ratios and minimal non-breeding population estimates were also determined at the South Farallon Islands (see Appendix).
RESULTS
CENTRAL CALIFORNIA POPULATION TRENDS
The total breeding population in central Cal- ifornia declined 52.6%, from 229,080 in 1980- 1982 to 108,530 in 1986 (Table 2). Progressive declines were striking when colonies were com- pared in slides taken from 1979-1980 through 1986 (Figs. 6 and 7). Individual colonies de- creased 4.5.8-1009/o.

154 STUDIES IN AVIAN BIOLOGY NO. 14
FIGURE 6. Common Murres on the south island at the North Farallon Islands in 1982 (top) and following a 55.4% decline in 1986 (bottom).
Farallon Islands
The breeding population peaked at 102,110 birds in 1982 on the South Farallon Islands (Briggs et al. 1983), followed by a 46.8% decline with only 54,370 birds remaining in 1985 (Table 2). Numbers were similar in 1986, with a decline of 45.6% since 1982.
Boat and ground survey results also peaked in 1982 (Fig. 8) and declines of similar magnitudes occurred between 1982 and 1985 (55.4%) and 1982 and 1986 (53.6Oh) (see Ainley and Boekel- heide 1990). However, when results were com- pared to 1980-1982 aerial survey results for the South Farallon Islands (Briggs et al. 1983), it became clear that combined ground and boat surveys greatly underestimated murre numbers; even so, trends from both methods were similar, indicating that they provided an effective pop- ulation index.
Plots can sometimes reflect direction ofchange in colony numbers (e.g., Harris et al. 1983, Mudge 1988). The Upper Shubrick Point plot confirmed trends for the whole colony, but the degree of change may not have been representative be-
FIGURE 7. Common Murres on Devil’s Slide Rock in 1982 (left) and after the colony disappeared in 1986 (right). Fewer than 100 murres were present on 5 June 1986, and none on 4 June.
cause the plot was one of the few areas on the South Farallon Islands where murres bred in 1983 (H. R. Carter, pers. obs.). In 1980 and 1981, similar numbers ofegg-laying sites (145 and 146) were recorded, but by 1983 eggs were laid at only about 52% of 84 known-individual sites that had been monitored the previous year (Kaza and Boekelheide 1984; PRBO, unpubl. data). By 1984, there was only 52.7% of the 198 1 total. While changes in numbers of egg-laying sites in 1983 reflected depressed breeding activity, many breeding birds were still present. For example, about 90% of known-individuals that bred in the plot in 1982 were observed sometime in 1983 (PRBO, unpubl. data). Thus, population decline began in 1983 but major mortality may not have occurred until after the breeding season.
Numbers at the North Farallon Islands peaked at 5 1,540 in 1980 but declined 55.6% to 22,900 by 1986 (Fig. 6, Table 2). The total Farallon Island murre population declined 48.9%, from 153,560 in 1980-1982 to 78,470 in 1986.
Nearshore central California
Both Sowls et al. (1980) and Briggs et al. (1983) surveyed colonies at Point Resistance, Double Point, Castle, and Hurricane Point rocks in 1980. We used the higher totals, mainly of Sowls et al. (1980) as the more accurate representation of peak breeding populations because their 12 June survey occurred within the optimum survey pe- riod at South Farallon Islands in 1980, whereas Briggs et al. (1983) surveyed later on l-2 July. In 1986, slides of Castle and Hurricane Point rocks could not be easily separated, so these col- ony totals were combined. At Double Point Rocks, a small natural arch fell into the ocean sometime between 1982 and 1985 and breeding habitat for less than 5% of the population was lost.

MURRE DECLINE IN CALIFORNIA- Tukekawu et al. 155
Populations at nearshore colonies in central California declined more severely, and in most cases, began to decline earlier than populations at the South and North Farallon islands. All col- onies peaked in 1980 and declined through 1986, except for Point Reyes, which peaked in 1982 (Table 2). Sharpest declines occurred at colonies located between Point Reyes and Devil’s Slide Rock. In fact, the Devil’s Slide Rock colony had disappeared by 1986, after peaking at almost 3000 birds in 1980 (Fig. 7). Small subcolonies of murres breeding on the mainland at Point Reyes and Castle Rocks also declined and even disappeared at Castle Rocks. The total for all six colonies decreased by 60.1%, from a peak of 75,430 in 1980-1982 to 30,060 in 1986.
NORTHERN CALIFORNIA POPULATION TRENDS
Populations in northern California remained relatively unchanged between 1979 and 1986 (Fig. 9, Table 3). Large colonies at False Klamath and Flatiron rocks decreased 9.7% between 1982 to 1986 but increased 13.0% between 1979 and 1986, respectively. We discount trends at large colonies that changed 5 10% because of counting error, single censuses, and differences in survey methods. Thus, these colonies were considered relatively unchanged from 1979 to 1986 and ap- peared similar in slides (Fig. 9; Sowls et al. 1980). Declines of 40% or more were obvious when we compared slides for different periods (see Figs. 6 and 7).
At Castle Rock, Briggs et al. (1983) estimated 143,220 birds in 1982, compared to our estimate of 100,570 birds in 1986 (Table 3). However, a change was not discernible in slides and may be
FIGURE 8. Estimates of the total numbers of Com- mon Murres on the South Farallon Islands from 1980- 1986 using various methods. Minimal estimates of the numbers of non-breeding birds (NB) are indicated by the darkened portion of each bar.
at least partly due to inaccurate block counting by Briggs et al. (1983). The estimate of 126,750 by Sowls et al. (1980) could not be used for com- parison due to their late survey date (mid-July).
Both Sowls et al. (1980) and Briggs et al. (1983) surveyed Green and Redding rocks in 1980, on 9 July and 2 July, respectively, producing widely disparate estimates (Table 3). Sowls et al. (1980) surveyed at the time of peak fledging in 1980 at the South Farallon Islands (Fig. 4) and after the highest ground counts were obtained during pe- riodic counts at Green Rock (DeGange and Sowls 1980). By this late date, large chicks may have
TABLE 2. ESTIMATES OF COMMON MURRE BREEDING POPULATIONS DETERMINED FROM AERLU SURVEYS AT ALL COLONIES IN CENTRAL CALIFORNIA, 1979-1986
% change: Colony peak (1980 or
1982) to 1986 NO. Naltte 1979 1980 1982 1985 1986 (see text)
S. Farallon Is. N. Farallon Is. Pt. Reyes Pt. Resistance
Double Pt. Rks.
Devil’s Slide Rk. Castle Rks.
Hurricane Pt. Rks.
- 86,140b - 5 1,540b
16,600s 22,550” - 7360b
754@ - 14,870b
13,08@ 2310= 2940b - 1340b
3520’ - 1920b
2310’
102,l lob 54,370 55,570 -45.6 5 1,320” 29,940 22,900 -55.6 44,250b 15,38@ 20,590 -53.5
6890b 3790 3030 -59.8
11,930b 5680 3280 -77.9
2570” - 0 - 100.0 1860b -
1710b - 3160d -45.8
a Source: Sowls et al. (1980). b Source: Brigs et al. (1983). E Minimal number due to incomplete coverage. d Castle Rocks and Hurricane Point Rocks combined (see text).

156 STUDIES IN AVIAN BIOLOGY NO. 14
FIGURE 9. Subcolony of Common Murres on Castle Rock in northern California in 1982 (top) and in 1986 (bottom). This colony appeared similar in extent and density, indicating little change.
been indistinguishable from adults in slides, partly accounting for the higher estimate. Differences between 1980 survey results at Redding Rock were not as great, but Sowls et al. (1980) again produced a higher population estimate (19%). For these reasons, we compared our results to 1980 or 1982 data from Briggs et al. (1983) (Ta- ble 3).
The combined population for False Klamath, Redding, Flatiron, and Green rocks decreased 5.4% from 118,080 in 1979-1982 to 111,730 in 1986, a difference that could not be assessed by our methods.
DISCUSSION
IMPLICATIONS FOR FARALL~N ISLANDS POPULATIONS
As reflected for the whole colony (Table 2) in aerial surveys, breeding populations were similar in the Shubrick Point plot in 1985 and 1986. Numbers of egg-laying sites equaled 78.1% and 77.7% of the 1981 total, respectively. This in- crease over 1984 reflected a change in population structure, which can be best understood by com- bining non-breeding and breeding sites. Non- breeding sites were not observed in 1980-1982, but in 1984 33 non-breeding sites made up 30% of the total. In 1985 and 1986 non-breeding sites comprised 9.5% (12 sites) and 5.1% (6 sites) of the totals, respectively. Thus, when all sites in 1984,1985, and 1986 were compared to the 1981 total, proportions were similar (75.3%, 86.3%, and 80.8%, respectively). Thus, the increase in the breeding population from 1984 through 1986 in the plot reflected a decrease in an inflated non- breeding population. However, in 1986 the min- imal non-breeding population size (NB) was 2480 birds, or 4.3% of the total breeding and non- breeding population of 58,050 birds (see Appen- dix). This proportion was still slightly higher than in 1982 (3.1%; N = 3290 birds) suggesting that by 1986 population structure may not have re- turned to pre- 1983 conditions.
Declines probably were buffered by recruit- ment in 1983-l 986 of strong year classes of young birds produced during 1979-198 1 (Ainley and Boekelheide 1990). Common Murres in the North Atlantic Ocean breed for the first time when 4 to 6 years old (reviewed by Hudson 1985). How- ever, the stormy fall and winter of 1982-1983 may have led to higher mortality of hatching year
TABLE 3. ESTIMATES OF COMMON MURRE BREEDING POPULATIONS Dm FROM z’hRlAL %JRVEYS AT
FIVECOLONIESIN NORTHERN CALIFORNIA, 1979-1986
COl0Ily %chan8e:palr (19794982)
NO. N.WX 1979 1980 1982 1986 to 1986 (see text)
9 Castle Rk. 126,750’ 132,590b 143,220b 100,570 see text 11 False Klamath Rk. 26,660’ 37,820b 53,430b 48,320 -9.6 12 Redding Rk. - 1730b l180b 1310 -24.3
2110’ 14 Green Rk. - 28,490b 38,780b 34,820 - 10.2
53,330” 15 Flatiron Rk. 24.148 17.810b 1 8.070b 27,280 +13.0
’ Symbols as in Table 4.

MURRE DECLINE IN CALIFORNIA- Tukekuwu et al. 157
(HY) birds from 1982, almost no chicks were raised to nest leaving in 1983, and lowered pop- ulation size and poor breeding success led to a weak 1984 year class (Ainley and Boekelheide 1990; PRBO, unpubl. data). Thus, recovery will be further delayed due to much lower recruit- ment.
mated 1500-2000 murres (Dobbin et al. 1986; R. G. Ford and G. W. Page, unpubl. data). In February 1986, the Apex Houston oil spill oc- curred between San Francisco and the Monterey Peninsula, killing 7500 murres or more (Page et al. 1990). Despite significant chronic oiling prob- lems during the 1979-1986 period (see Stenzel et al. 1988) we have no estimate of numbers affected.
CAUSES FOR DECLINE OF THE CENTRAL CALIFORNIA MURRE POPULATION
Between 1979 and 1986, three sources of mor- tality (excluding usual levels of natural mortality) affected Common Murres in central California: ENS0 in 1982-1983, oil spills, and gill-net fish- ing (Carter 1986). Comparing patterns of colony decline with other studies of these specific mor- talities provided a rare opportunity to assess how, when, and why the murre population in central California declined so rapidly and drastically; to what degree different sources of mortality were responsible for the decline; and why decline is expected to continue for at least several years.
El Nirio-Southern Oscillation 1982-l 983
ENS0 first began to affect seabirds at the South Farallon Islands prior to the murre fledging pe- riod in June 1982, but did not affect fledging success that year (Ainley and Boekelheide 1990). During the fall and winter of 1982-l 983 murres exhibited much lower winter attendance of this colony than usual (Kaza and Boekelheide 1984) and egg laying in 1983 was delayed (Fig. 4) and reduced. It appeared that many birds moved into inshore waters to feed and the few birds that bred in 1983 foraged at great distances from the col- ony (Kaza and Boekelheide 1984).
The Puerto Rican spill occurred before the main arrival of migrant murres that winter in central California but breed farther north; thus, mortal- ity was focused on the resident central California population. Although the Apex Houston spill and chronic oiling (Stenzel et al. 1988) affected both central California and other breeding popula- tions, effects on northern California colonies may be limited because murres appear to be year- round residents there (DeGange and Sowls 198 1). Little information is available on the age and sex classes of murres affected by these oil spills. In the Apex Houston spill, both first-year (FY) and after-first-year (AFY) murres were killed and no evidence of sex-biased mortality was found. Of 164 birds examined, 54.9% were male (H. R. Carter, unpubl. data).
By assuming that 50% of 7500 murres killed by the Apex Houston spill and a projected min- imum of 500 birds from chronic oiling were from the central California population, and that 50% of these and of murres killed by the Puerto Rican spill were breeding adults, we estimate that 3000 breeding adults were killed by oil spills in central California from 1979-1986. This corresponded to 2.5% of the 120,550 murres lost from the cen- tral California breeding population from 1980- 1982 to 1986.
Although ENS0 occurred in the period when the major population decline occurred at the South Farallon Islands, additional evidence sug- gests that ENS0 mortality was not focused on breeding adults. While the 1982-1983 ENS0 event affected seabird reproduction in central and northern California, and Oregon (Hodder and Graybill 1985), large declines were not found at northern California colonies surveyed between 1982 and 1986 (Table 3). However, ENS0 may have affected future recovery of the central Cal- ifornia population by causing minimal repro- duction in 1983 and lower survival to breeding of pre-breeders.
Gill-net fishing
Oil pollution
Gill-net fishing for California halibut (Purul- ichthys calzfirnicus) and starry flounder (Platich- thys stellatus) has occurred in central California since at least the 1930s. In the late 1970s the number of gill-net fishermen increased by as much as 400-500% in some areas (Atkins and Hene- man 1987) and a new white croaker (Genyone- mous lineatus) fishery began in Monterey Bay, using long monofilament nets. Fishing effort in- tensified and the halibut fishery gradually shifted from using twine to monofilament nets, all of which resulted in a much higher catch of non- target species, especially seabirds (CDFG 198 1, 1987; Atkins and Heneman 1987).
Two major and several smaller oil spills caused From 1979 to 1982 fishing effort was concen- mortality of Common Murres in central Cali- trated in Monterey Bay. By 1980 it was evident fornia between 1979 and 1986. In November that large numbers of murres and other seabirds 1984, the Puerto Rican oil spill spread across the were being killed in gill nets (CDFG 198 1, Sten- outer shelf of the Gulf of the Farallones (Herz zel et al. 1988). In late 1982, CDFG established and Kopec 1985, PRBO 1985) killing an esti- the Central California Gill and Trammel Net


MURRE DECLINE IN CALIFORNIA- Tukekuwa et al. 159
numbers of dead HY murres on Monterey Bay beaches in 1980-1982 (see Stenzel et al. 1988).
By assuming that 75% of the 70,000 murres netted in the 1980-1986 survey period (exclud- ing 5000 murres killed in 1979 and 1986 before and after surveys) either were or soon would have been breeding adults, we accounted roughly for 40-45% of the 120,550 murres lost from the cen- tral California population from 1980-1982 to 1986 (Table 2). We attribute gill-net mortality to most of this decline.
COLONY DECLINES
There was a strong connection between areas and periods of gill-net fishing mortality and in- dividual colony declines in central California. Colonies at the South and North Farallon islands and Point Reyes were unchanged or continued to increase from 1980 to 1982 (Table 2). How- ever, colonies at Castle and Hurricane Point rocks declined by 47.2% and 26.0%, respectively. De- gree of decline was related to proximity to Mon- terey Bay, where heavy mortality occurred in 1980 and 198 1 (Fig. 1, Table 4). Mortality was greatly reduced in Monterey Bay after 1982-l 983, and overall decline from 1980 to 1986 for these two colonies was not as severe (45.8%) as at most other colonies in central California.
From 1982 to 1985, declines occurred at Dou- ble Point Rocks, Point Resistance, and South and North Farallon islands, of 52.4%, 49.7%, 46.8%, and 4 1.7%, respectively (Table 2). These declines reflected high gill-net fishing mortality in the Gulf of the Farallones in 1982 through 1984 (CDFG 1987). The largest decline occurred at Double Point Rocks, which was closest to fish- ing areas off the Golden Gate and southern Marin County. Declines continued from 1985 to 1986 at Double Point Rocks (42.3%), North Farallon Islands (23.5%), and Point Resistance (20.10/o), all near San Francisco and Bodega Bay, where fishing mortality persisted. In this period the Devil’s Slide Rock colony disappeared. We as- sociate this with high fishing effort within l-2 km of the colony. Between 6 and 10 August 1983, 9 18 murres washed ashore a few kilometers north of Devil’s Slide Rock (Stenzel et al. 1988). If all were local breeders, 35% or more of this colony could have been killed in a single event.
Less severe overall declines (50-60%) at Point Resistance, Point Reyes, and North Farallon Is- lands corresponded with intermediate-sized col- onies located farther from gill-net fishing areas. A smaller relative decline at South Farallon Is- lands may reflect wide dispersal of murres into nearshore waters, but the 46,540 birds lost from this colony almost equaled the total lost from all other central California colonies combined.
SOLUTIONS FOR GILL-NET FISHING MORTALITY
Species of seabirds killed in gill nets from 1980- 1987 included: Common, Pacific, and Red- throated loons (Gavia immer, G. arctica, G. stel- l&a), Western and Clark’s grebes (Aechmophorus occidentalis, A. clarkii), Sooty Shearwater (Puf- firms griseus), Brandt’s and Pelagic cormorants (Phalacrocorax penicillatus, P. pelagicus), White- winged and Surf Scoters (Melanitta fusca, M. perspicillata), Common Murre, Pigeon Guille- mot (Cepphus columba), and Marbled Murrelet (Brachyramphus marmoratus) (CDFG 198 1, 1987; Carter and Erickson 1988). Common Murres accounted for about 50-97% of the mor- tality during 1980-1986.
In 1982, State Senate Bill (SB) 1475 imposed a permanent ban on gill-net fishing in waters 10 fathoms (18.3 m) or shallower in most of Mon- terey Bay; the ban was extended to 15 fathoms (27.5 m) in 1984 (Fig. 1). Temporary seasonal closures (May-October) were imposed by CDFG during 1982-1984 in a patchwork pattern to ex- clude areas of highest seabird and marine mam- mal mortality. Even so, murre bycatch remained relatively high through 1986 (Table 4). In 1986 and 1987, CDFG, with a cooperative group of gill-net and other fishermen, state and federal agencies (including USFWS) and lawmakers, and private research and environmental groups (in- cluding PRBO), attempted to develop a long- term solution to the seabird and marine mammal mortality caused by gill-net fishing. Survey data presented in this report showed that the central California murre population could not sustain continued mortality and that continued exis- tence of individual colonies was threatened.
In September 1987, SB 40 was passed, con- taining much stronger regulations. Gill-net fish- ing was prohibited year-round in waters north of Point Reyes, in waters 40 fathoms (73 m) or shallower between Point Reyes and Waddell Creek, and within 3 miles of the Farallon Islands and Noonday Rock (just northwest of the Far- allon Islands). Area closures were selected to eliminate murre mortality; over 99% of murre mortality observed in nets by CDFG had oc- curred in waters less than 40 fathoms (73 m) in depth (P. W. Wild, pers. comm.).
These regulations resulted in virtual elimina- tion of the nearshore halibut, shark, and white croaker fisheries north of Monterey Bay, but al- lowed the offshore rockfish fishery (which caused very low levels of seabird mortality) to continue. In Monterey Bay some gill-net fishing has con- tinued outside 15 fathoms with virtually no sea- bird mortality (P. W. Wild, pers. comm.). A re- search advisory committee was formed to investigate and monitor the use of alternative fishing gear.

160 STUDIES IN AVIAN BIOLOGY NO. 14
ACKNOWLEDGMENTS
This was a cooperative project that encompassed many years and we are extremely grateful to the many biologists and volunteers of the Point Reyes Bird Ob- servatory and U.S. Fish and Wildlife Service for their contributions to this study. Both organizations pro- vided support and funding for this effort. We thank R. J. Boekelheide and R. W. Lowe for their role in ini- tiating these aerial surveys; L. Accurso for assistance with counting birds from slides; K. T. Briggs, D. B. Lewis, and A. L. Sowls for slide loans or interpretation; R. J. Boekelheide, D. Jaques, S. Johnston, T. and J. Penniman, and W. J. Sydeman for data collection and interpretation on the Farallon Islands; R. J. Boekel- heide, R. W. Lowe, E. Nelson, and T. Penniman for assistance with aerial surveys; L. B. Spear for providing unpublished data on murre attendance patterns; H. R. Huber, D. Jaques, G. W. Page, L. B. Spear, and N. Wamock for carcass collection and examination; L. E. Stenzel for PRBO Beached Bird Project data interpre- tation; C. W. Haugen and P. W. Wild (California De- partment of Fish and Game; Monterey) and R. J. Boe- kelheide and D. A. Croll for providing data on gill-net fishing mortality; D. G. Ainley, R. Bauer, R. A. Cole- man, B. Heneman, R. Johnson, D. A. McCrimmon, and L. Waybum for assistance with funding and other support; D. G. Ainley, R. J. Boekelheide, C. S. Lloyd, A. L. Sowls, and P. W. Wild for reviewing the manu- script; and M. Simonds for typing assistance. This is Contribution No. 395 of the Point Reyes Bird Obser- vatory.
LITERATURE CITED
AINLEY, D. G., AND R. J. BOEKELHEIDE [EDS.]. 1990. Seabirds of the Farallon Islands; Ecology and dy- namics ofan upwelling-system community. Stanford Univ. Press, Stanford, California.
AINLEY, D. G:, AND T. J. LEWIS. 1974. The history of Farallon Island marine bird populations, 1854- 1972. Condor 76432-446.
ATKINS, N., AND B. HENEMAN. 1987. The dangers of gill netting to seabirds. Amer. Birds 41:1395-1403.
BIRKHEAD, T. R. 1978. Attendance patterns of Guil- lemots Uria aalge at breeding colonies on Skomer. Ibis 120:219-229.
BIRKHEAD, T. R., AND D. N. NETTLESHIP. 1980. Cen- sus methods for murres, Uris species: a unified ap- proach. Canad. Wildl. Serv. Oct. Pap. 43: l-25.
BRIGGS. K. T.. W. B. TYLER. D. B. LEWIS. AND K. F. DE&AN. 1983. Seabirds of central and northern California, 1980-1983: status, abundance, and dis- tribution. Unpubl. report, Center for Marine Studies, Univ. of California, Santa Cruz, California.
BRIGGS, K. T., W. B. TYLER, D. B. LEWIS, AND D. R. CARLSON. 1987. Bird communities at sea off Cal- ifomia: 1975 to 1983. Studies in Avian Biology No. 11.
BRIGGS, K. T., D. G. AINLEY, L. B. SPEAR, P. B. ADAMS, AND S. E. Smrn. 1988. Distribution and diet of Cassin’s Auklet and Common Murre in relation to central California upwellings. Proc. XIX Int. Omi- thol. Congr., pp. 982-990.
CALIFORNIA DEPARTMENT OF FISH AND GAME. 19 8 1. The number and origin of dead marine seabirds found
on Monterey Bay beaches in 1980 and 198 1. Un- publ. report, Calif. Dept. of Fish and Game, Mon- terey, California.
CALIFORNIA DEPARTMENT OF FISH AND GAME. 1987. Impacts of gill and trammel net fisheries in Califor- nia. Unpubl. report, Calif. Dept. of Fish and Game, Monterey, California.
CARTER, H. R. 1986. Rise and fall of the Farallon Common Murre. Point Reyes Bird Observatory Newsletter 72: l-3, 11.
CARTER, H. R., AND R. A. ERICKSON. 1988. Popu- lation status and conservation problems of the Mar- bled Murrelet in California, 1892-1987. Unpubl. re- port, Calif. Dept. of Fish and Game, Sacramento, California.
CARTER, H. R., AND S. G. SEALY. 1984. Marbled Murrelet mortality due to gill-net fishing in Barkley Sound. British Columbia. PD. 2 12-220 in D. N. Net- tleship; G. A. Sanger, and P. F. Springer (eds.), Ma- rine birds: their feeding ecology and commercial fish- eries relationships. Canad. Wildl. Serv. Spec. Publ.
CHANEY, R. W. 1924. Breeding conditions of the murres on the Farallones in June, 1923. Condor 26: 30.
DAWSON, W. L. 1923. The birds of California. Vol. 3. South Moulton Co., San Diego.
DEGANGE, A. R., AND A. L. Sowrs. 198 1. Observa- tions on the seasonal use of coastal California by seabirds. Unpubl. report, Office of Biological Serv:, U.S. Fish and Wildl. Serv.. Washinaton. D.C.
I
DESANTE, D., AND D. G. AINLEY. 1980. The avifauna of the South Farallon Islands, California. Studies in Avian Biology. No. 4.
DOBBIN, J. A., H. E. ROBERTSON, G. FORD, K. BRIGGS, AND E. H. CLARK, II. 1986. Resource damage as- sessment of the T/V Puerto Rican oil spill incident. Unpubl. report, James Dobbin Assoc. Inc., Alex- andria, Virginia (for U.S. Dept. Comm., NOAA, Contract 50-DGNC-6-00 102).
FORD, R. G., G. W. PAGE, AND’H. R. CARTER. 1987. Estimating mortality of seabirds from oil spills. Pp. 747-75 1 in Proc. 1987 Oil Spill Conference, Amer- ican Petroleum Institute, Washington, D.C.
GASTON, A. J., AND D. N. NETTLESHIP. 198 1. The Thick-billed Murres of Prince Leopold Island. Ca- nad. Wildl. Serv. Monogr. Ser. No. 6.
GASTON, A. J., D. G. NOBLE, AND M. A. PURDY. 1983. Monitoring breeding biology parameters for murres Uria spp.: levels of accuracy and sources of bias. J. Field Omith. 54:275-282.
HARRIS, M. P., S. WANLESS, AND P. ROTHERY. 1983. Assessing changes in the numbers of Guillemots Uria aalge at breeding colonies. Bird Study 30:57-66.
HATCH, S. A., AND M. A. HATCH. 1989. Attendance patterns of murres at breeding sites: implications for monitoring. J. Wildl. Manage. 53(2):486-493.
HEIU, M. J., AND D. KOPEC. 1985. Analysis of the Puerto Rican tanker incident, recommendations for future oil spill response capability. Unpubl. report, Tiburon Center for Env. Studies, Tiburon, Califor- nia.
HODDER, J., AND M. R. GRAYBILL. 1985. Reproduc- tion and survival of seabirds in Oregon during the 1982/83 El Nino. Condor 87:535-541.

MURRE DECLINE IN CALIFORNIA- Tukekuwa et al. 161
HOULDSON, F. 1952. Oil and the California Murre. Audubon Magazine 54: 118-2 1.
HUDSON, P. J. -1985. Population parameters for the Atlantic Alcidae. PD. 233-261 in D. N. Nettleshin and T. R. Birkheadieds.), The Atlantic Alcidae. Ac- ademic Press, Orlando.
HUNT, G. L., JR., R. L. PITMAN, M. NAUGHTON, K. WINNETT, A. NEWMAN, P. R. KELLY, AND K. T. BIUGGS. 1979. Distribution, status, reproductive ecology, and foraging habits of breeding seabirds. In Summary of marine mammal and seabird surveys of the Southern California Bight area, 1975-1978. U.S. Dept. of Interior, Bur. of Land Manage., Los Angeles, California.
KAZA, S., AND R. BOEKELHEIDE. 1984. Measuring the pulse of life. Pacific Discovery 37:6-13.
LLOYD, C. S. 1975. Timing and frequency of census counts of cliff-nesting auks. Brit. Birds 68505-5 13.
MOFFITT, J., AND R. T. Oaa. 1938. Recent disastrous effects of oil pollution on birds in the San Francisco Bay region. Calif. Fish and Game 24~239-244.
MUDGE, G. P. 1988. An evaluation of current meth- odology for monitoring changes in the breeding pop- ulations of Guillemots Uria aalge. Bird Study 35: 1-9.
OSBORNE, T. 0. 1972. Ecology and avian use of the coastal rocks of Northern California. Unpubl. M.A. thesis, Humboldt State Univ., Arcata, California.
OSBORNE, T. O., AND J. G. REYNOLDS. 197 1. Cali- fornia bird breeding ground survey. Calif. Dept. of Fish and Game. Admin. Rep. 71-73.
PAGE, G. W., H. R. CARTER, AND R. G. FORD. 1990. Numbers of seabirds killed or debilitated in the 1986 Apex Houston oil spill in central California. Studies Avian Biology 14: 164-l 74.
PALMER, R. H. 1921. A murre tragedy. Condor 23: 135.
Parr, J. F., AND R. L. MCLAGAN. 1987. Common Murre (Uris aalge) attendance patterns at Cape St. Mary’s, Newfoundland. Canad. J. Zool. 65: 1530- 1534.
PIATT, J. F., D. N. NETTLESHIP, AND W. THRELFALL. 1984. Net-mortality of Common Murres and At- lantic Puffins in Newfoundland, 195 l-8 1. Pp. 196- 206 in D. N. Nettleship, G. A. Sanger, and P. F. Springer (eds.), Marine birds: their feeding ecology and commercial fisheries relationships. Canad. Wildl. Serv. Spec. Publ.
POINT REYES BIRD OBSERVATORY. 1985. The impacts of the Tl V Puerto Rican oil spill on marine bird and mammal populations in the Gulf of the Farallones, 6-19 November 1984. Unpubl. report, Point Reyes Bird Observatory, Stinson Beach, California.
SLATER, P. J. B. 1980. Factors affecting the numbers of Guillemots Uria aalge present on cliffs. Omis Stand. 11:155-163.
S~~AIL, J., D. G. FINLEY, AND H. STRONG. 1972. Notes on birds killed in the 197 1 San Francisco oil spill. Calif. Birds 3:25-32.
SOWLS, A. L., A. R. DEGANGE, J. W. NELSON, AND G. S. LESTER. 1980. Catalog of California seabird col- onies. U.S. Department of Interior, Fish and Wildl. Serv., Biol. Serv. Prog. FWS/OBS 37/80.
STENZEL, L. E., G. W. PAGE, H. R. CARTER, AND D. G. AINLEY. 1988. Seabird mortality in California as
witnessed through 14 years of beached bird censuses. Unpubl. report, Point Reyes Bird Observatory, Stin- son Beach, California.
STORER, R. W. 1952. A comparison of variation, be- havior, and evolution in the seabird genera Uris and Cepphus. Univ. of Calif. Publ. Zool. 52:121-222.
APPENDIX
GROUND TRUTHING CORRECTION FACTOR
Aerial counts of murres have been criticized for un- derestimating actual numbers present, depending on the nature of background habitat, bird activity, and observation distance (but see Gaston and Nettleship 198 1). Birkhead and Nettleship (1980) suggested that murres can be counted readily from aerial photographs if the colony is neither indented greatly nor varies great- ly in height such that all areas can be seen in photo- graphs.
At all colonies surveyed in California (except parts of SEFl) the vast majority of murres nested in large colonies on gentle slopes and flat areas at the base of slopes or on rounded hilltops. In these habitats, murres were easily photographed and counted. However, to account for birds obscured in tightly-packed groups and those hidden by small rocks and ledges, we deter- mined a ground truthing correction factor(G) on South Farallon Islands, which we applied to aerial survey data from West End and North Farallon islands.
In 1985, we established seven additional plots on SEFl, including one at Tower Point (Fig. 2). Ground counts were conducted at all plots between 11:00-l 3:00 on 1 O-l 5 days between 30 May and 23 June, including the 12 June census day (Table A-l). We compared numbers from the Tower Point and Upper Shubrick Point plots with the mean of 10 counts of the best aerial photographs of these plots. Two versions of G were derived as follows:
and
G,=a/g, (3)
G,=a/g, (4)
where: a = mean count of birds from aerial photo; g, = mean count from ground censuses on the census day; and g, = mean count from ground censuses over the census period. We used G, values of 0.764 and 0.917 to adjust numbers of birds counted in aerial photo- graphs, because G, minimized possible bias due to daily variation in numbers. G, could be used as an alternative when g, cannot be determined.
The same method was used in 1986 with four plots, but since the aerial survey required two days to com- plete due to fog, we used either (or both) 4 and 5 June ground counts to derive G, values (Table A-l). The Tower Point plot (which was photographed on both days) yielded similar ground counts but quite different means of photo counts, probably a result of differing aerial viewing conditions. Also, in all four plots, mean G, values exceeded 1.0 (R = 0.775-l .278) which should have been impossible (disregarding counting error), since all birds were visible from the ground in plots.

162 STUDIES IN AVIAN BIOLOGY NO. 14
TABLE A-l. NUMBERS OF COMMON MURRES COUNTED IN PLOTS ON SEFI, USED TO CALLVLA TE GROUND TRLJTHING CORRECTION FACTORS (G) IN 1985 AND 1986
Plot Date
Aerial photo COUII~ Mean + SD fJ-4) G
1985 Tower Point
Upper Shubrick Point
1986 Tower Point
Cove Point
Upper Shubrick Point
Lower Shubrick Point
30 May-23 Jun 12 Jun 30 May-21Jun 12 Jun
28 May-24 Jun 4 Jun 5 Jun
28 May-24Jun 5 Jun
28 May-17 Jun 5 Jun 4 Jun-5 Jun 4 Jun
502.1 + 79.5 (10) 491.0 (1) 154.7 + 9.7 (15) 151.0 (2)
214.6 f 11.3 (10) 190 244 225.8 + 8.7 (5) 218 240 224.7 + 6.3 (6) 215 232 159.2 + 9.7 (10) 141 176 154.8 + 3.1 (6) 152 160 136.1 f 5.0(12) 128 143 131.9 + 1.6 (7) 129 134 23.7 (2) 21 27 25.3 + 1.3 (4) 24 27
390 635 - -
134 163 149 153
375.2 (1) 0.747 375.2 + 35.4 (10) 0.764 138.4 (1) 0.895 138.4 + 11.8 (10) 0.917
206.7 (2) 0.963 175.1 f 7.7 (10) 0.775 238.2 + 9.1 (10) 1.060 176.5 (1) 1.109 176.5 f 18.5 (10) 1.140 135.9 (1) 0.999 135.9 f 5.0 (10) 1.030 30.3 (1) 1.278 30.3 f 3.4 (10) 1.198
However, it was not possible to synchronize individual ground counts with individual aerial photographs, be- cause the plane made several passes over a period of about 0.5-2.0 h. G, values also exceeded 1.0 (R = 0.963-1.109) in 1986.
To get an overall G, value for each year, we cate- gorized plots based on numbers of birds, and calculated mean G, valuesof0.841 and 1.067 for 1985 and 1986, respectively (Table A-2). The large difference presum- ably resulted mainly from the lower altitude aerial pho- tographs in 1986, which made it easier to distinguish individual birds. In fact, the 1986 value was so close to 1.0 that we felt it was appropriate to apply a G, value of 1 .O, especially given the small amount of in- herent error in the method that resulted in values over 1.0.
BREEDER : NON-BREEDER RATIO
On the census day at the Farallon Islands, we also determined the number of non-breeding sites (i.e., con- sistently occupied sites where eggs were never ob- served), numbers of birds attending these sites, and the numbers of “other” birds (i.e., not associated with a specific site) in the Upper Shubrick Point plot (Table 1). All of these birds were considered to be non-breed- ers even though at some sites eggs may have been laid and lost between site checks (see Gaston et al. 1983)
and some may have been off-duty mates. To examine relative differences in the numbers of non-breeding birds between years, we calculated a breeder: non- breeder ratio (BNR) as follows:
BNR = n,Q)/n,&,) (5)
where: n, = total number of non-breeding birds in a plot at time t, on the census day. This index does not take into account numbers of non-breeding birds that visit the colony but were absent during the census or younger non-breeding birds that are not yet visiting the colony. BNR varied greatly between years (R = 3.44-42.86).
BREEDING AND MINIMAL NON-BREEDING POPULATION ESTIMATES
To estimate numbers of breeding birds (B) at a col- ony, we used the following formula:
B = N,,(K)/G, (6)
where: N., = number of birds counted from aerial pho- tos; K = number of breeding birds/bird counted, and G, = ground truthing correction factor. In 1985 and 1986, we added the number of birds counted on SEFI and neighboring islets from boat and ground counts (multiplied by K) to that derived using Equation 6 for West End Island to derive an overall breeding popu-
TABLE A-2. SUMMARY OF GROUND TRLJTHING CORRECTION FACTORS (G,) USED IN 1985 AND 1986
1985 1986
No. birds per plot No. plots G, Range No. plots G, Range
l-99 1 0.917 0.905-0.929 1 1.198 1.122-1.263 100-199 - - - 2 1.085 1.030-1.140 200-299 - - - 2 0.918 0.775-1.060 500-599 1 0.764 - - Mean 2 0.841 0.764-0.929 3 1.067 0.775-1.263

MURRE DECLINE IN CALIFORNIA- Tukekuwu et al. 163
lation estimate for South Farallon Islands. To estimate where: C = direct count of birds in non-breeding “clubs” minimal numbers of non-breeding birds (NB) at South from boat and ground counts. These clubs were excluded Farallon Islands, we used the following formula: from boat and ground counts when determining B.
NB = B/BNR + C (7)