declining productivity and competitiveness in the ...€¦ · develop a comprehensive solution to...
TRANSCRIPT
Declining Productivity and Competitiveness in the Ethiopian Leather Sector
Berhanu Nega (Ph.D.)
Director, EEPRI
and
Kibre Moges
Senior Researcher, Trade & Industry Section
Email: [email protected]
March 2002
EEA/Ethiopian Economic Policy Research Institute
Working Paper No. 1/2002
Contents
1. Introduction
2. Analytical framework
2.1 Determinants of competitiveness
2.2 The measurement of total factor productivity
2.3 Factors affecting total factor productivity change
2.4 Factors influencing competitiveness in the leather sector
3. Profile of the Ethiopian leather industry
3.1 The tanning sub-sector
3.2 Leather products: the footwear sub-sector
4. Ethiopian leather in international trade
4.1 Export performance in the tanning sub-sector
4.2 Trade in leather products
4.3 Trade balance in the leather industry
5. Why the leather sector is not competitive
6. Factor productivities and growth
6.1 Productivity in the tanning sub-sector
6.2 Sources of productivity change
6.3 Productivities in the footwear sub-sector
7. Conclusion and recommendations.
Annex
Bibliography
List of Tables
Table 1. Livestock population distribution 1999 (million heads)
Table 2. Capacity utilization
Table 3. Input source, specialization and processing
Table 4. Production and export of the tanning sub-sector
Table 5. External trade in leather products (Mill. USD)
Table 6. External balance of the leather sector (Million USD)
Table 7. Ethiopian tanning: factor productivity of all sample firms 1995-1999
Table 8. Characteristics of sample tanning firms 1995-1999
Table 9. Sources of labor productivity change 1995-1999 (%)
Table 10. Labor productivity in the tanning sub-sector of selected countries (VA/L in ‘000
USD)
Table 11. Productivity in the footwear sub-sector 1995-1999
Table 12. Productivity in the footwear establishments-average for 1995-1999
Table 13. Labor productivity in the footwear sub-sector of selected countries (VA/L in ‘000
USD)
Table A. Regression results for sample tanning firms
Table B. Regression results for sample footwear firms
1. Introduction
Theoretically, the case for trade liberalization is well known. It is long argued that lower protection and neutrality of incentives between import-substituting and export-promoting activities will produce both static and dynamic benefits.
The static benefits arise from increased actual or potential competition from imports, which confronts domestic producers as a result of lowering of protection levels. This has the effect of stimulating domestic manufacturers to lower their costs and/or improve quality. Such improvement in technical efficiency does not require new investment or significant resource reallocation. Additional static benefits can also occur through allocative efficiency gains. The removal of protective barriers introduces a set of relative prices for traded goods that correspond to international opportunity costs. This allows for the allocation of resources between and within sectors in accordance with comparative advantage.
A more open trade regime is expected to result in a higher rate of growth from outward looking policies. This is the dynamic efficiency gain from a liberal trade regime. Exports are viewed as the key stimulus to greater capacity utilization, greater horizontal specialization, increased familiarity with and absorption of new technologies, greater learning by doing as a result of expanded output levels, and the stimulation effect of having to achieve international price and quality levels.
Beyond the theoretical assertion, however, the evidence from countries’ experience is mixed. Many observers agree that though developing countries are more open and their trade regimes are more efficient today than decades before, the gains from trade liberalization are less than satisfactory. For instance, a study on trade policy reform and performance in Sub-Saharan Africa showed that “The majority, with low values of the liberalization index1[1] show a very weak performance during the 1980s, whilst a smaller number, in the above average liberalizer groups, have a stronger, but none the less far from satisfactory performance”. [Kirckpatrick & Weiss, 1994, p7] A similar study on the impact of trade liberalization on industrial development concluded that “… empirical results, therefore, failed to offer convincing evidence of trade liberalization having a significant impact on manufacturing performance in developing countries during the 1980s”. [Kirckpatrick, 1994, p10]
1[1] Referring to a group of countries classified in the study as the relatively ‘below-average liberaliser group’.
Theoretically, trade liberalization (openness) in general, understood to mean a movement in relative domestic prices of traded goods towards international price levels, should contribute to improved trade performance by altering the product composition of existing production and at the same time promoting the growth of exports. A fundamental question in this connection is that in today’s globalization, could openness for a developing country bring about higher competitiveness and promote export? There is little evidence that it could.
Many agree that developing countries are increasingly liberalizing their economy. Clearly, today the trade regime of developing countries is relatively more open than a decade ago. However, their share in world export has either declined or at best remained the same. Between 1990 and 1999 the share of low income countries remained the same at 3.1 percent, while that of Sub-Saharan Africa declined from 1.9 to 1.4 percent. On the other hand the share of middle-income countries increased form 16.5 to 20 percent during the same period. [World Bank, 2001] High-income countries, though their share declined marginally, still maintain a massive 76 percent of world export. The underlying difference between these groups of countries is their level of industrialization. Today, the share of agriculture value added in GDP for high, middle and low-income countries is respectively 2, 10 and 26 percent. For least developed countries the share could go as high as 50%. Therefore, underlying the degree of competitiveness, and hence export performance, is the level of industrialization; the higher the level of industrialization, the greater the degree of competitiveness in international trade.
Therefore, before some degree of industrialization is achieved, openness could not necessarily lead to better competitiveness and diversification, and hence improved export performance. This is so because high level and sustained growth of productivity, the prime factor which determines competitiveness, can only be achieved with industrialization.
One of the sectors that Ethiopia (and most African countries too) seems to have a clear comparative advantage in manufacturing is the leather sector. The highly labor intensive nature of the industry, its not too sophisticated technological requirements, combined with Ethiopia’s large resource base for the raw material needs of the industry makes the leather sector a good candidate for a concerted effort to expand production and achieve competitiveness at the international level. If Ethiopia has to fully exploit its vast livestock resource, therefore, the leather sector need to be transformed to a full fledged manufacturing stage, with integrated leather and leather product industries. As noted above, this is so because increased productivity or value added, and hence competitiveness, is achieved with higher stage of processing/manufacturing in the sector. It is only then that the leather sector could live up to the challenge of international competition. Having these attributes, however, does not guarantee success in achieving competitiveness, as the region’s current level of production and export
attests. It is necessary to identify all the constraints that inhibit the expansion of the sector and develop a comprehensive solution to make the industry competitive.
This study hopes to address the problems involved in the lack of competitiveness in the Ethiopian leather sector with particular focus on the level of factor productivity based on experiences of sample firms. For this purpose, a survey of the leather and footwear manufacturing firms was conducted. However, only a limited number of firms provided satisfactory information. These include Dessie Tannery, Bahar Dar Tannery, Modjo Tannery, Bale Tannery and Anbassa Shoe Factory. To fill the gap, time series data for 7 tanning and 19 footwear firms has been obtained from the Central Statistical Authority (CSA).
The paper proceeds as follows. Section two outlines the general framework for analyzing overall competitiveness and total productivity levels, followed by the characteristics of the Ethiopian leather industry. Section four explains the external trade performance, which reflects their competitiveness status. Section five investigates why Ethiopian leather is not competitive, based on a small survey conducted for this purpose in selected firms, particularly based on interviews conducted with firm managers. Section six analyzes one of the key determinants of competitiveness, total factor productivities, based on data from sample firms. The final section provides some recommendations on improving the performance of the leather and leather goods sector in Ethiopia.
2. Analytical Framework
2.1 Determinants of competitiveness
Domestic and international competitiveness2[2] for a firm/industry is influenced by factors internal as well as external to the firm/industry. External factors include government policies and incentives in which firms in the industry operate including macroeconomic and sectoral policies, legal and regulatory measures, trade and investment specific incentives, etc. The level of industrialization or stage of development of a country, supply of export support services, and the nature of the international trading regime (i.e., international trade laws and regulations) are also external factors that affect competitiveness. [Berhanu & Kibre, 2002] These factors significantly
2[2] In this study we follow the general definition of competitiveness as the ability to sell both in the international and domestic markets.
affect the competitive status of industries, particularly in the international arena. On the other hand, factors internal to the firm basically determine the physical productivity level, and hence the unit cost of production of a given quality product.
While external factors can seriously affect or even determine the international competitiveness of an otherwise efficient firm, inefficient firms can hardly compete in international markets even if they have conducive external environment. That is partly why it is generally said that the fundamental determinant of competitiveness is the level and rate of growth of productivity of factors, which is largely influenced by aspects internal to the firm. Factor productivity is an important component of industrial growth and development. On the supply side, the growth of an economy, an industry, or a firm is determined by the rate of expansion of its productive resources and by improvement in their efficiency – that is, the rate of growth of total factor productivity (TFP). Perhaps, one of the most significant stylized facts that have emerged from the empirical literature is the importance of TFP’s contribution to output growth. As much as one-third to one-half of output growth can be contributed by growth in TFP. [Dollar, et al, 1990] Where the growth of employable resources is constrained, high rates of TFP growth are critical to the growth of production.
Productivity growth can be used for policy impact analysis including foreign exchange payments and exchange rates, trade policy, investment licensing and pricing policy. It can be used for comparative purposes between different economies (developed and developing, liberalized and less liberalized, etc). Productivity differences between technologically similar plants in different countries are of interest in themselves for the insight they provide into the industrialization process. Productivity levels in developed economies also serve as the productivity frontier for the developing ones. They also suggest that there may be high social rates of return from industrial projects that improve performance.
Moreover, for any economy, sustained international competitiveness requires a productivity level and rates of change equal to or exceeding those of competing countries. Therefore, investigating the levels and rates of growth of productivities of the leather industry in Ethiopia is of paramount importance for an assessment of the sector’s current or potential competitiveness. This is the central focus of the study. This is not, however, to deny the fact that factors external to the firm are important. In fact, recent studies about the process of industrialization based on experiences in South East Asian countries or the lack of competitiveness of the African manufacturing sector emphasize the role of deliberate strategic interventions by the state through subsidies and the like, (Rodrik, 1999) or other policy variables such as real exchange rate misalignment (Elbadawi, 1999) or factors affecting transaction costs (Collier, 1997) as the most crucial determinants of industrialization and international competitiveness. We will look at the impact that some of this factors have in reducing competitiveness in the leather sector. As suggested earlier, the emphasis on looking at factor productivities more closely emanates from the belief that without high levels
of productivity growth industrial expansion in general and competitiveness in international markets in particular will not be possible or at least sustainable.
Accordingly, in addition to looking at policy issues and factors affecting transaction costs, the study attempts to calculate total factor productivities in the leather and leather goods sector and draw some comparative assessments and implications for future competitiveness.
2.2 The measurement of total factor productivity
In manufacturing, both quantity and quality of labor and capital constitute the major factors for enhancing productivity. With respect to labor there is a close relationship between worker productivity and human capital acquired through training or schooling. Technological capability, i.e., the ability of workers (and firms) to use, adapt and develop the technology, significantly influences productivity level. Similarly, the size of the capital stock, the quality or technology embodied, and social overhead capital (availability and reliability of infrastructure) all affect productivity. Accordingly, using TFP analysis also captures some of the indirect effects on costs of factors seemingly external to the firm.
These have implications for calculating productivities. The size of physical labor by itself (as man-years) can’t explain the quality of human capital. Quality of labor may differ from one firm to the other and also within a firm. So to account for labor heterogeneity the measurement is taken in value terms, assuming that differences in skills will be captured by wage differentials.
Similarly, measuring output in quantity may not be quite appropriate. Leather and leather products are produced in different qualities making quantitative aggregation and comparison difficult. Measuring output in value terms is essential to address such shortfalls.
The choice between partial and total productivity is also an issue to consider. A partial (single factor) measure of productivity may show the development of productivity overtime as a result of changes in the given factor within a firm, keeping the other factor(s) constant. It is able to capture the relative/comparative productivity level of a given factor between firms having identical production function. In practice, however, it is not normally possible to find firms having identical production function. One firm may adopt a labor and intermediate inputs-intensive production technique, while the other prefers a capital-intensive production technology. Moreover, a change in one factor inevitably affects the productivity level of the other. For example, a change in the technological level of physical capital not only affects the productivity
level of capital itself but that of labor too. Furthermore, productivities of labor and capital may change with a change in the quality of intermediate inputs. The productivity of equipment may increase because of better maintenance or because workers become more skilled in its usage; the productivity of material inputs may increase because of better quality, or improved inventory management. Labor productivity growth may be observed because of increased productivity of other inputs rather than greater efficiency on the part of labor itself. So, partial productivities do not measure overall changes in productive efficiency since they are affected by changes in the composition of inputs, i.e., by factor substitutions.
Therefore, measuring total productivity level is essential. Total factor productivity (TFP) can be thought of as an index that sums up the partial productivities of all inputs in a production process, so that the efficiency with which all inputs are utilized and combined in production can be captured jointly. In quantitative terms it is a measure that compares output not only with labor input but also with tangible capital each weighted by market value of its services.
Consider a production function with labor and capital as the major factors of production and a parameter, which measures the total productivity of the available technology. The available production technology is therefore, the production function, which determines how factors combine to produce output.
Y = ALα Kβ3[3] (1)
Where, Y is output (in our case value added4[4]);
L is labor measured in wages;
K is capital (net fixed asset);
3[3] Here the assumption is that factors are paid according to their marginal productivity (hence, constant return to scale production function). The framework derives from a constant-return-to-scale production function with neutral technical progress occurring at a constant rate over time. Under this assumption elasticities sum up to unity, i.e., β = 1- α.
4[4] If over the period of estimation, the quality of inputs change and also if the industry begins to use more processed raw material inputs, then using value added for TFPG will be biased. In this exercise we assume that in most firms a significant change will not take place with regard to the quality of inputs during the period under consideration.

A indicates the current level of technology, measuring total factor productivity; and
α & β are output elasticities (factor shares) of labor and capital respectively5[5].
Total factor productivity (TFP) is thus measured by:
A = Y/Lα Kβ (2)
“A” in equation 2 above measures the TFP for a firm or the average TFP for an industry. But average productivity at a point in time and by itself, may not give full information about a firm or an industry. Comparison of average productivity levels of different firms within an industry, and of similar industries in different countries (output valued at the same international price), provides relative efficiency levels. TFP also has some implication for the level of efficiency of a given firm or industry. If factors are paid their marginal product, then a productivity level greater than one implies efficiency; conversely, a productivity level less than one implies inefficiency, hence less competitive. Therefore, for a firm to stay in business, A >= 1.
This is a measure of efficiency. Improvement or deterioration in the efficiency of production, however, will also be reflected in changes in the unit cost of production. A TFP increase (decrease) implies a decrease (increase) in unit cost of production accounted for changes in all input prices.
2.3 Factors affecting total factor productivity change
What is more important, however, is the rate of change of total productivity over time, that is, technological progress. Technological capability, the learning process of production and engineering management improves the production function, hence productivity levels. More output would be generated with the same level of inputs. Considering the same production
5[5] Output elasticities of each input can be estimated using regression analysis or by attaching a conventional condition to the producer’s equilibrium in competitive markets: that cost shares of each input in total cost of production are equal to output elasticities of each input.
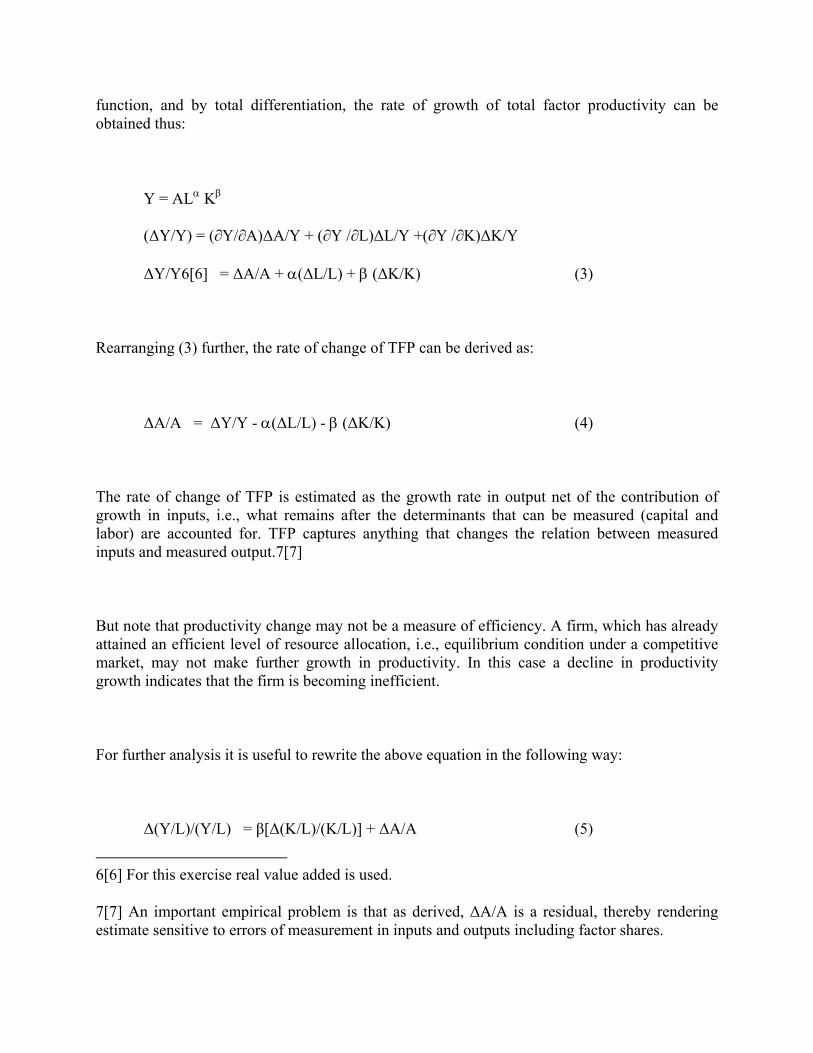
function, and by total differentiation, the rate of growth of total factor productivity can be obtained thus:
Y = ALα Kβ
(∆Y/Y) = (∂Y/∂A)∆A/Y + (∂Y /∂L)∆L/Y +(∂Y /∂K)∆K/Y
∆Y/Y6[6] = ∆A/A + α(∆L/L) + β (∆K/K) (3)
Rearranging (3) further, the rate of change of TFP can be derived as:
∆A/A = ∆Y/Y - α(∆L/L) - β (∆K/K) (4)
The rate of change of TFP is estimated as the growth rate in output net of the contribution of growth in inputs, i.e., what remains after the determinants that can be measured (capital and labor) are accounted for. TFP captures anything that changes the relation between measured inputs and measured output.7[7]
But note that productivity change may not be a measure of efficiency. A firm, which has already attained an efficient level of resource allocation, i.e., equilibrium condition under a competitive market, may not make further growth in productivity. In this case a decline in productivity growth indicates that the firm is becoming inefficient.
For further analysis it is useful to rewrite the above equation in the following way:
∆(Y/L)/(Y/L) = β[∆(K/L)/(K/L)] + ∆A/A (5)
6[6] For this exercise real value added is used.
7[7] An important empirical problem is that as derived, ∆A/A is a residual, thereby rendering estimate sensitive to errors of measurement in inputs and outputs including factor shares.
This is a decomposition of labor productivity growth into the contribution of capital deepening plus the residual, the rate of growth of TFP. [Dollar, et al. 1990] The first term in the right hand side of equation (5) is the rate of growth of labor productivity attributable to the increase in capital utilized per unit of labor. The residual, (∆A/A), is the difference between the actual growth in labor productivity and the amount of the advance that can be accounted for by capital deepening.
Conceptually, the factors affecting the efficiency of an economic unit of production, such as a firm, can be classified into two categories: those within the firm’s sphere of direct influence and those outside a firm’s direct control. [Nishimizu, et al. 1986] The distinction between these categories is useful in understanding some of the limitations of the analytical framework for measuring TFP, appreciating what TFP indices represent, their uses and applications.
Factors within a firm’s sphere of direct control are those referred to as technology. These factors can be further divided into two groups. One group has to do with the efficiency of each input, which can change quite independently of the input’s quantity in production and also independently of the amount and efficiency of any other input combined in production. This group includes factors such as the influence of training and education on labor productivity, new technology embodied in machinery and equipment, and high grades of primary inputs. The other group of factors affect the efficiency of performance of different inputs simultaneously and the efficiency of interaction among different inputs in a production process. It includes management of a firm, layout of physical plant, economies of scale, efficiency in the management of product portfolio, and other factors that take advantage of what is called economies of scope (for example, shared overhead costs among different production lines).
Factors beyond a firm’s direct control have to do with the production environment. They include availability of infrastructure (roads, telecommunication, power, water, etc.) and demand conditions that affect the performance of a firm through fluctuations in capacity utilization. They include, inter alia, government policies and regulations that affect prices or allocation of products and inputs (for example, tariffs, taxes, subsidies, foreign exchange allocation system, pricing policy), the degree of competition in the market place (for example, investment, licensing, state monopoly), and the management autonomy of firms themselves.
Measured TFP changes capture the impact of all these factors. Changes in technological levels – that is shift in the production function – are difficult to distinguish empirically from changes in TFP that occur within the given level of technology. Both changes, however, respond to
decisions at the enterprise level. These decisions in turn are motivated and constrained by changes in the production environment. One objective of TFP analysis is to measure the impact of changes in the production environment on cost performance. For all these reasons, TFP analysis, when there is good quality data, is quite comprehensive and tells a good story about the firm or the industry. However, as useful as TFP analysis is, it is quite sensitive to the availability and quality of data; hence the need to be cautious in its interpretation especially in countries where there is reason to suspect the quality of the data.
2.4 Factors influencing competitiveness in the leather sector
Similar to other sectors, the competitive status of the Ethiopian leather sector is determined by factors internal as well as external to the industry discussed above. With respect to the internal factors, perhaps the most crucial determinant is the technological capability, that is the learning process, manifested by the management of production and the level of available skill in tanning industries. The technology employed, too, is another major determinant of total productivity, and hence competitiveness, which is internal to an industry or a firm.
Regarding external factors, major determinants of the competitive status of the leather sector include the availability and quality of raw materials, availability of infrastructure which affects transaction costs, trade and overall industrialization policy of governments, exchange rate policy and the like. In addition to government policies, the international competitiveness of the leather sector also crucially depends on the fairness of the trading regime that operate at the international level.
3. Profile of the Ethiopian Leather Industry
3.1 The tanning sub-sector
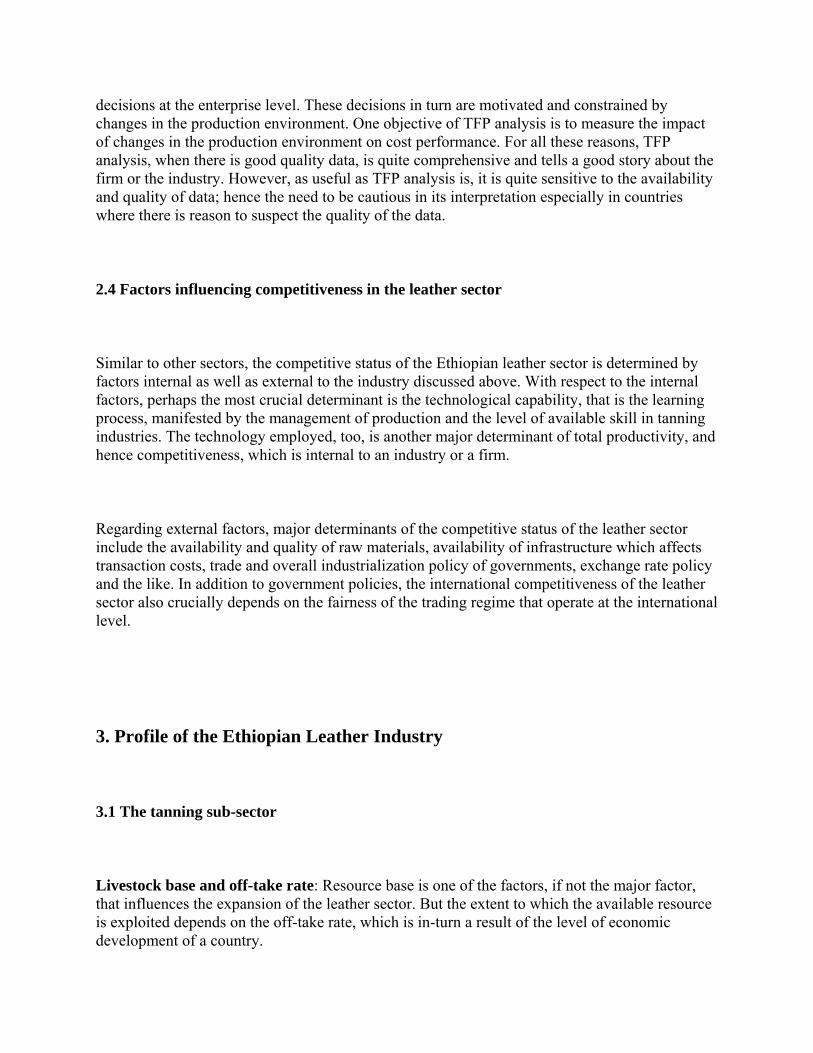
Livestock base and off-take rate: Resource base is one of the factors, if not the major factor, that influences the expansion of the leather sector. But the extent to which the available resource is exploited depends on the off-take rate, which is in-turn a result of the level of economic development of a country.
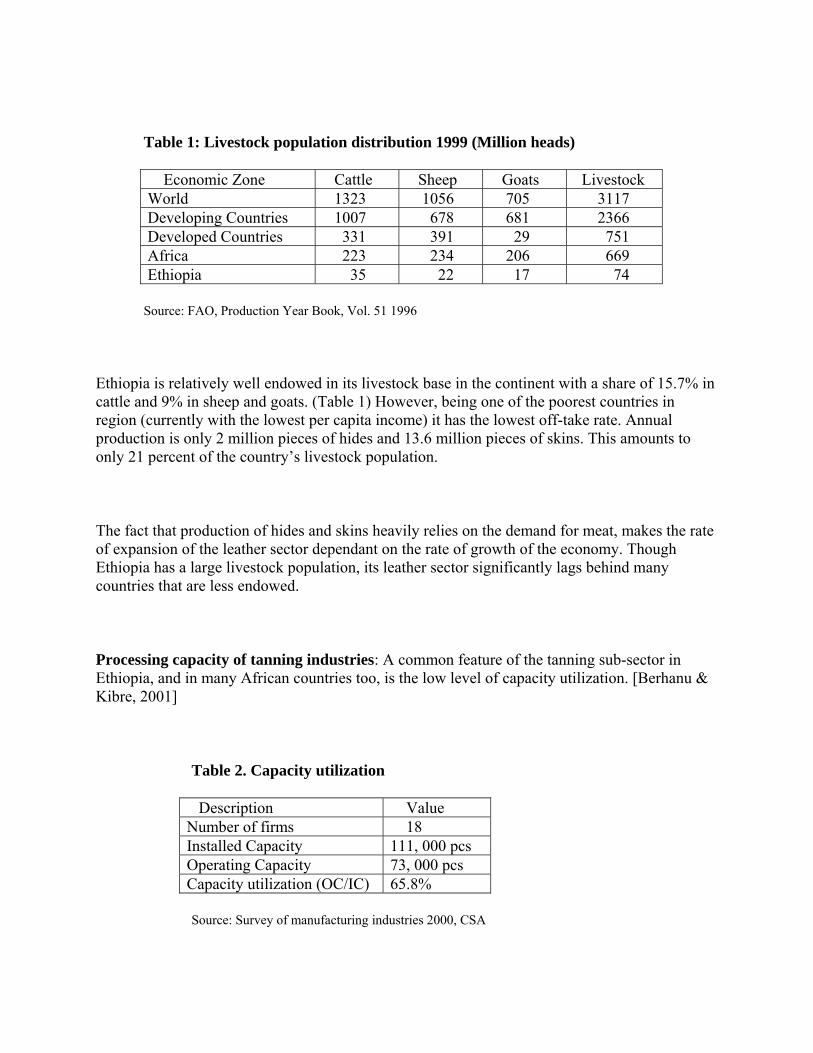
Table 1: Livestock population distribution 1999 (Million heads)
Economic Zone Cattle Sheep Goats Livestock World 1323 1056 705 3117 Developing Countries 1007 678 681 2366 Developed Countries 331 391 29 751 Africa 223 234 206 669 Ethiopia 35 22 17 74
Source: FAO, Production Year Book, Vol. 51 1996
Ethiopia is relatively well endowed in its livestock base in the continent with a share of 15.7% in cattle and 9% in sheep and goats. (Table 1) However, being one of the poorest countries in region (currently with the lowest per capita income) it has the lowest off-take rate. Annual production is only 2 million pieces of hides and 13.6 million pieces of skins. This amounts to only 21 percent of the country’s livestock population.
The fact that production of hides and skins heavily relies on the demand for meat, makes the rate of expansion of the leather sector dependant on the rate of growth of the economy. Though Ethiopia has a large livestock population, its leather sector significantly lags behind many countries that are less endowed.
Processing capacity of tanning industries: A common feature of the tanning sub-sector in Ethiopia, and in many African countries too, is the low level of capacity utilization. [Berhanu & Kibre, 2001]
Table 2. Capacity utilization
Description Value Number of firms 18 Installed Capacity 111, 000 pcs Operating Capacity 73, 000 pcs Capacity utilization (OC/IC) 65.8%
Source: Survey of manufacturing industries 2000, CSA
The tanning industry in Ethiopia operates, on average, at two-third of its full potential. (Table 2) Though various reasons are provided for this under capacity utilization, the major ones include shortage of hides and skins due, inter alia, to low level of domestic livestock production, the high traditional human consumption of hides and skins for traditional clothing, furnishing and handicrafts, low off-take rate and low recovery rate (damage) of hides and skins arising from the process of flaying and preservation. Moreover, the poor quality of their semi-processed leather, which resulted in low export demand, also contributed to this low capacity operation.
All tanning firms interviewed asserted that they are operating at much below full capacity due mainly to lack of demand and partly to lack of raw material inputs. The latter is due to absence of effective marketing networks between households who supplied the great proportion of raw materials through out the country and factory gate points. One tanning firm also pointed out that the price of hides and skins supplied to firms by traders is based on international price speculation and exchange rate movement which does not correspond to the quality of domestic raw materials, often damaged and badly handled.
As the degree of utilizing available capacity is a significant factor for lowering unit costs, the low level of operating capacity of the leather industry is an indication of its weak potential for competitiveness.
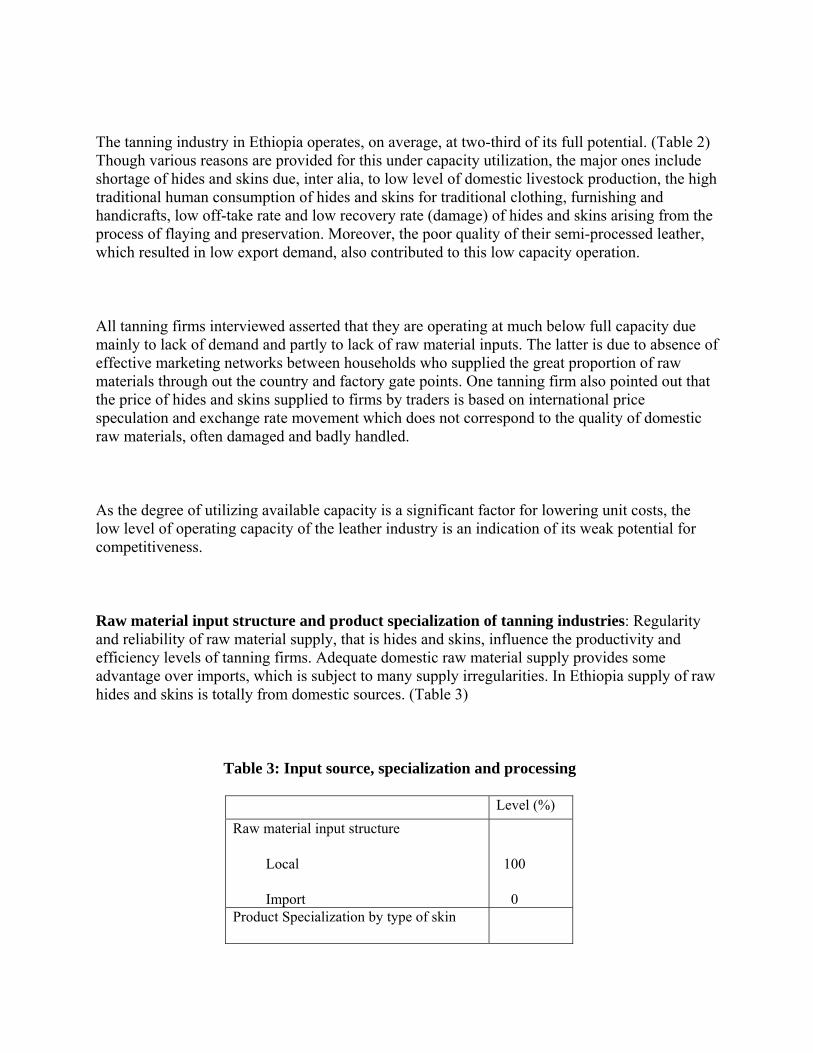
Raw material input structure and product specialization of tanning industries: Regularity and reliability of raw material supply, that is hides and skins, influence the productivity and efficiency levels of tanning firms. Adequate domestic raw material supply provides some advantage over imports, which is subject to many supply irregularities. In Ethiopia supply of raw hides and skins is totally from domestic sources. (Table 3)
Table 3: Input source, specialization and processing
Level (%)Raw material input structure
Local
Import
100
0Product Specialization by type of skin
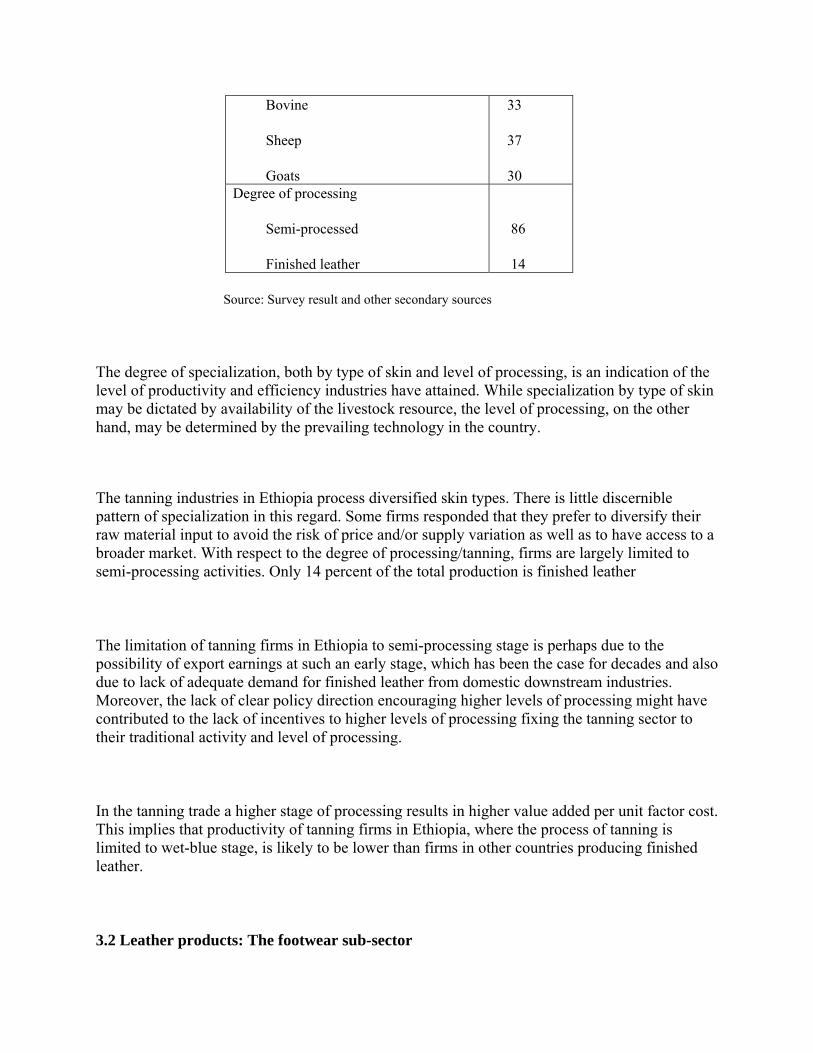
Bovine
Sheep
Goats
33
37
30Degree of processing
Semi-processed
Finished leather
86
14
Source: Survey result and other secondary sources
The degree of specialization, both by type of skin and level of processing, is an indication of the level of productivity and efficiency industries have attained. While specialization by type of skin may be dictated by availability of the livestock resource, the level of processing, on the other hand, may be determined by the prevailing technology in the country.
The tanning industries in Ethiopia process diversified skin types. There is little discernible pattern of specialization in this regard. Some firms responded that they prefer to diversify their raw material input to avoid the risk of price and/or supply variation as well as to have access to a broader market. With respect to the degree of processing/tanning, firms are largely limited to semi-processing activities. Only 14 percent of the total production is finished leather
The limitation of tanning firms in Ethiopia to semi-processing stage is perhaps due to the possibility of export earnings at such an early stage, which has been the case for decades and also due to lack of adequate demand for finished leather from domestic downstream industries. Moreover, the lack of clear policy direction encouraging higher levels of processing might have contributed to the lack of incentives to higher levels of processing fixing the tanning sector to their traditional activity and level of processing.
In the tanning trade a higher stage of processing results in higher value added per unit factor cost. This implies that productivity of tanning firms in Ethiopia, where the process of tanning is limited to wet-blue stage, is likely to be lower than firms in other countries producing finished leather.
3.2 Leather products: The footwear sub-sector
As discussed in the introduction, one of the major advantages that could give a competitive edge to the Ethiopian leather sector is its large livestock base. However, maximizing the benefit from this resource requires expanding the leather products industries including footwear & accessories, leather garments, auto upholstery, etc, and fully integrating it into the domestic upstream industry. This, primarily, necessitates establishing a tanning sub-sector that is capable of producing high-grade finished leather to feed the downstream industries. This is so because in this sector relatively higher value added can be attained by processing raw hides & skins to the finish and further proceeding to the leather product industry than being limited to semi-processing for export. It is this network, the linkage between the tanning and leather products industries, which is missing most in Ethiopia and also in many African leather sectors.
As explained above, what is domestically supplied to the leather products industry is only the 14 percent of the total product of the tanning industry. The bulk of the tanning industry output is exported in semi-processed form, a testimony to the underdeveloped nature of the sector as a whole: inefficient tanning and infant leather products sub-sectors. On average, Ethiopia produces only 25 million dollars worth of footwear annually. But this is less than 50 percent of the tanning industry’s output.
4. Ethiopian Leather in International Trade
4.1 Export performance of the tanning sub-sector
Given that labor is currently Ethiopia’s most abundant factor, and that activities in the leather sector are relatively labor-intensive, such a significant livestock resource potential provides the opportunity for substantially expanding the leather and leather products output for the external market.
Despite this potential, however, Ethiopia has not yet exploited this resource to any appreciable extent. At the outset, animals are not raised for the value of their hides or skins. The supply of hides and skins is constrained by the production of animals for their meat and milk, which is a high-income consumption item. Given the low level of income of the majority of the population, the effective demand for meat is very low. This is despite the fact that meat is the most preferred consumption item in the Ethiopian diet. Second, its export share in meat production is insignificant, hence unable to exploit the external market. Third, cattle in traditional Ethiopian
agriculture are also and largely used as a means of production. Fourth, hide recovery is very low for a variety of reasons, including low hide quality caused by a variety of traditional animal husbandry practices as well as poor slaughter treatment. These factors collectively result in low supply of hides and skins relative to the available livestock potential. So Ethiopia’s share in the export market for leather and leather products is from the outset constrained, at least partly, by internal factors associated with inadequate raw material supply.
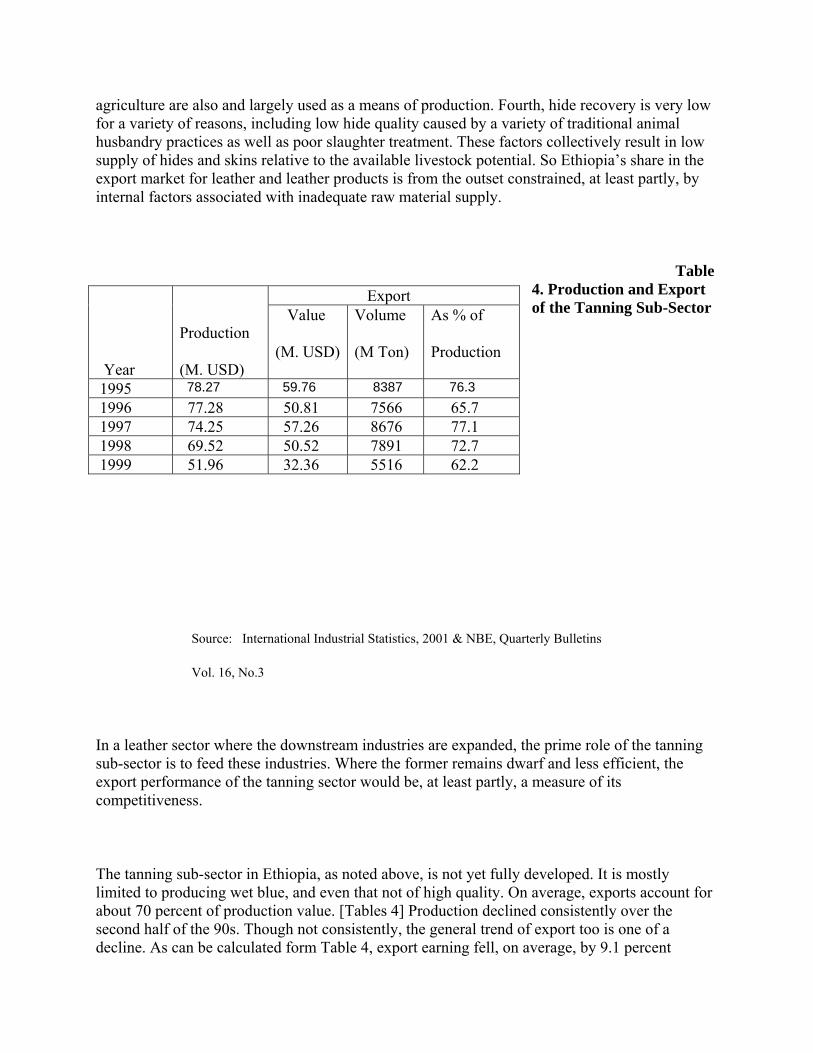
Table 4. Production and Export of the Tanning Sub-Sector
Source: International Industrial Statistics, 2001 & NBE, Quarterly Bulletins
Vol. 16, No.3
In a leather sector where the downstream industries are expanded, the prime role of the tanning sub-sector is to feed these industries. Where the former remains dwarf and less efficient, the export performance of the tanning sector would be, at least partly, a measure of its competitiveness.
The tanning sub-sector in Ethiopia, as noted above, is not yet fully developed. It is mostly limited to producing wet blue, and even that not of high quality. On average, exports account for about 70 percent of production value. [Tables 4] Production declined consistently over the second half of the 90s. Though not consistently, the general trend of export too is one of a decline. As can be calculated form Table 4, export earning fell, on average, by 9.1 percent
Year
Production
(M. USD)
Export Value
(M. USD)
Volume
(M Ton)
As % of
Production
1995 78.27 59.76 8387 76.3 1996 77.28 50.81 7566 65.7 1997 74.25 57.26 8676 77.1 1998 69.52 50.52 7891 72.7 1999 51.96 32.36 5516 62.2
annually. This is largely due to a decrease in the volume of export. The latter declined by an average of 8.6 percent annually.
4.2 Trade in leather products
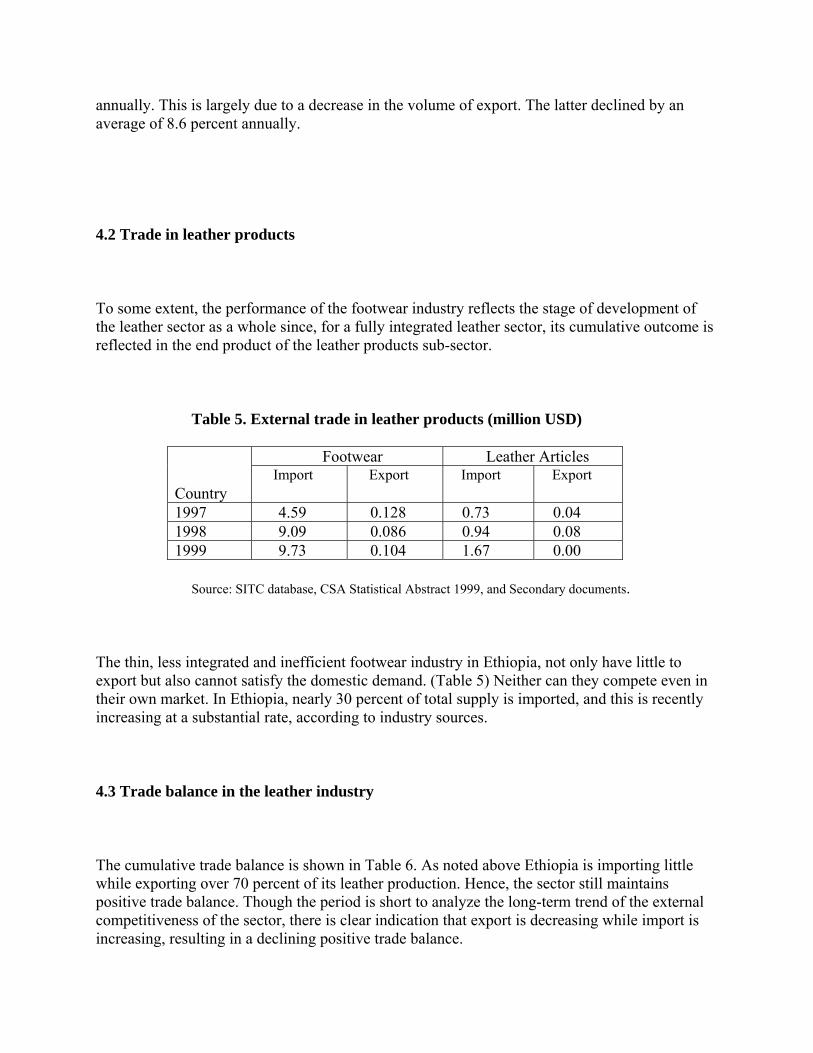
To some extent, the performance of the footwear industry reflects the stage of development of the leather sector as a whole since, for a fully integrated leather sector, its cumulative outcome is reflected in the end product of the leather products sub-sector.
Table 5. External trade in leather products (million USD)
Country
Footwear Leather Articles Import Export Import Export
1997 4.59 0.128 0.73 0.04 1998 9.09 0.086 0.94 0.08 1999 9.73 0.104 1.67 0.00
Source: SITC database, CSA Statistical Abstract 1999, and Secondary documents.
The thin, less integrated and inefficient footwear industry in Ethiopia, not only have little to export but also cannot satisfy the domestic demand. (Table 5) Neither can they compete even in their own market. In Ethiopia, nearly 30 percent of total supply is imported, and this is recently increasing at a substantial rate, according to industry sources.
4.3 Trade balance in the leather industry
The cumulative trade balance is shown in Table 6. As noted above Ethiopia is importing little while exporting over 70 percent of its leather production. Hence, the sector still maintains positive trade balance. Though the period is short to analyze the long-term trend of the external competitiveness of the sector, there is clear indication that export is decreasing while import is increasing, resulting in a declining positive trade balance.
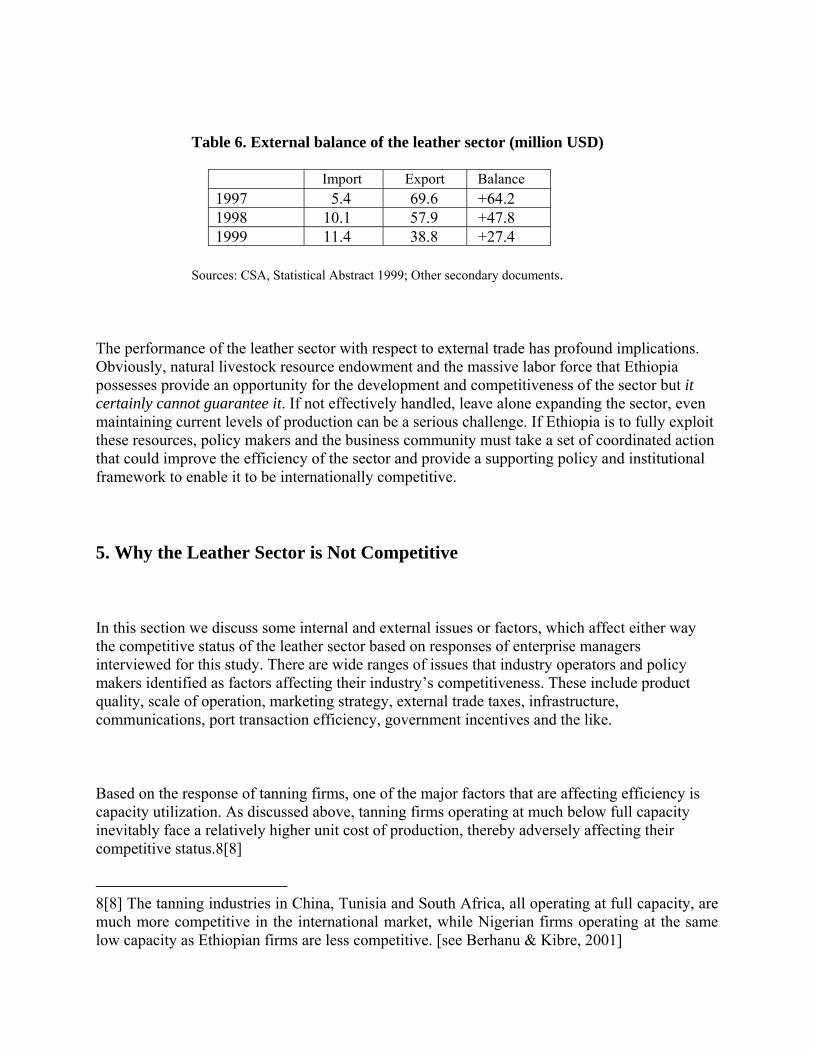
Table 6. External balance of the leather sector (million USD)
Import Export Balance1997 5.4 69.6 +64.2 1998 10.1 57.9 +47.8 1999 11.4 38.8 +27.4
Sources: CSA, Statistical Abstract 1999; Other secondary documents.
The performance of the leather sector with respect to external trade has profound implications. Obviously, natural livestock resource endowment and the massive labor force that Ethiopia possesses provide an opportunity for the development and competitiveness of the sector but it certainly cannot guarantee it. If not effectively handled, leave alone expanding the sector, even maintaining current levels of production can be a serious challenge. If Ethiopia is to fully exploit these resources, policy makers and the business community must take a set of coordinated action that could improve the efficiency of the sector and provide a supporting policy and institutional framework to enable it to be internationally competitive.
5. Why the Leather Sector is Not Competitive
In this section we discuss some internal and external issues or factors, which affect either way the competitive status of the leather sector based on responses of enterprise managers interviewed for this study. There are wide ranges of issues that industry operators and policy makers identified as factors affecting their industry’s competitiveness. These include product quality, scale of operation, marketing strategy, external trade taxes, infrastructure, communications, port transaction efficiency, government incentives and the like.
Based on the response of tanning firms, one of the major factors that are affecting efficiency is capacity utilization. As discussed above, tanning firms operating at much below full capacity inevitably face a relatively higher unit cost of production, thereby adversely affecting their competitive status.8[8]
8[8] The tanning industries in China, Tunisia and South Africa, all operating at full capacity, are much more competitive in the international market, while Nigerian firms operating at the same low capacity as Ethiopian firms are less competitive. [see Berhanu & Kibre, 2001]
Tanning firms complained that poor quality of raw material inputs (hides & skins), which is beyond their control, is the main factor for the substantial reduction of external demand and lower prices for their leather output. Nearly all hides and skins are collected from households via small traders. This way of handling, in addition to natural damages, causes all kind of damage associated with traditional slaughtering, storage and lack of appropriate preservation. A study by one firm (who is also one of the respondents) shows that only 20 % of bovine and goatskins and 35 percent of sheepskins of the total purchase are of good quality. Over 30 percent of hides and skins are labeled as rejects, poor and low quality. As quality check is made only physically, it is difficult to fully identify the quality of hides and skins. As a result of poor quality of raw materials tanning firms are attempting to export all grades of leather (1 to 6). One firm mentioned that less than 50 percent of their export is of good quality.
Another factor that adversely affects competitiveness is poor economic infrastructure. Communication facilities like telephone, fax, Internet, etc., are not readily available; delays in ports and customs clearance are extremely time consuming and cuts in electric supply hamper production efficiency. Problems of timely delivery of raw materials to factories, as well as exported leather to foreign customers are commonplace in Ethiopia. All these incur additional cost thereby limiting the degree of competitiveness. Modern communication facilities, like the Internet service, have not been introduced until very recently; only one firm out of the seven interviewed for this survey acknowledged having Internet connection.
The technology employed is the other factor that makes a difference in productivities, and hence competitiveness. One tanning firm stated that it is 37 years since its establishment while all other firms interviewed are not more than six years old. However, age of establishment may not necessarily be the best indicator of the level of technology used since new firms could start operation using second hand equipment, which has been serving for decades in other countries.
Another factor that limits competitiveness is the lack of hard currency. In Ethiopia spare parts and chemicals for tanning firms are largely imported and foreign currency is not readily available to these importers. Long delays to acquire foreign exchange are not uncommon. Therefore, in addition to the depreciation of the birr, the lack of foreign exchange availability causes reduced capacity of operation, which in turn significantly constrains their degree of competitiveness.
Export support/promotion service is another determinant of competitiveness. This includes market information, contact making, pre-export support services and the like. In Ethiopia, except

for limited participation in trade fairs, practices like trade missions abroad, advertisement in foreign media, stationing own agents abroad, etc., are not well known.
Finally, firms were asked about additional problems which affect their competitiveness in the domestic and international markets. In Ethiopia, firms raised issues related to raw material price instability, financial problems and lack of policy focus to the leather sector in general as major problems. All firms stated that finance is a major constraint. Firms depend on commercial bank loans for their financial requirement. However, they complained that it is too difficult to secure loans and takes an inordinately long time. Interestingly they also complained about high interest rates, although the lending rate of about 11.5% is comparably low by African standards. The high variation in the domestic price of hides and skins, which is based on international price and exchange rate variation, is the other problem that firms face in Ethiopia. This makes it very difficult to plan their production and cost. Moreover, firms do complain about the lack of attention to the sector on the part of the government.
In the footwear industry, none of the firms that responded to the survey questionnaire in Ethiopia and Nigeria export shoes, although there are three firms in footwear, and five in other leather articles that have started to export recently. [EEPA, 2001] The most common problems stated by firms are poor quality of domestic leather and high cost of imported inputs such as shoe accessories, due to high tariff rates and the depreciation of the respective domestic currencies. But most firms are not competitive even in their own domestic market. All complained that unfair competition created by new and second hand shoes smuggled into the country (dumping) is the prime factor for their lack of competitiveness in the domestic market.9[9]
6. Factor Productivities and Growth
6.1 Productivity in the tanning sub-sector
9[9] The leather industries in China and Tunisia, which are highly competitive in the international market, receive extensive export support (incentives) from their respective governments. In China one interviewed firm categorically stated that manufacturers are required by a government-imposed regulation to export all quality products. Although it is not clear whether this regulation requires firms to export irrespective of export prices, it is an interesting admission that potentially validates the claims of Ethiopian and also other African producers about the problem of dumping.
As discussed earlier, the prime determinant of competitiveness, particularly external competitiveness, is intra-firm efficiency of production, reflected by total factor productivity. TFP reflects the technical efficiency of labor, technology employed, production management, streamlining communication and transportation facilities, etc. A relatively less productive firm, having low total factor productivity, may not be competitive even if all other external factors, including wage policies, trade liberalization, transportation costs are all made to be efficient. The level of total factor productivity is therefore the underlying factor, which determines the degree of competitiveness. This is the prime reason for investigating factor productivities in Ethiopia. This section will address productivity related issues.
As discussed earlier, calculating factor productivities requires time series and/or cross section data of physical labor or wage bill, fixed capital stock and value added for estimating factor (labor and capital) elasticities (factor shares).
The study of the sources of total factor productivities and growth for Ethiopia is calculated from the performance of seven, out of fourteen, selected tanning firms for the period 1995 – 1999. This body of evidence contains output measured in value added terms, the wage bill and net capital stock, all in real terms. The wage bill includes all benefits paid out in monetary terms.
A summary of factor productivity levels for the tanning industry in Ethiopia is presented in Table 7 below. Considering the value added per wage bill, on average, labor produces a value four times as much as its wage. In relation to the capital stock, the average value added per unit of fixed productive capital is 2.33. The picture of individual sample firms with respect to productivities is quite diverse. (Table 8) The value added per wage bill ranges from 2.2 to 8.2 while the value added per unit of capital stock varies from less than half to 3.6.
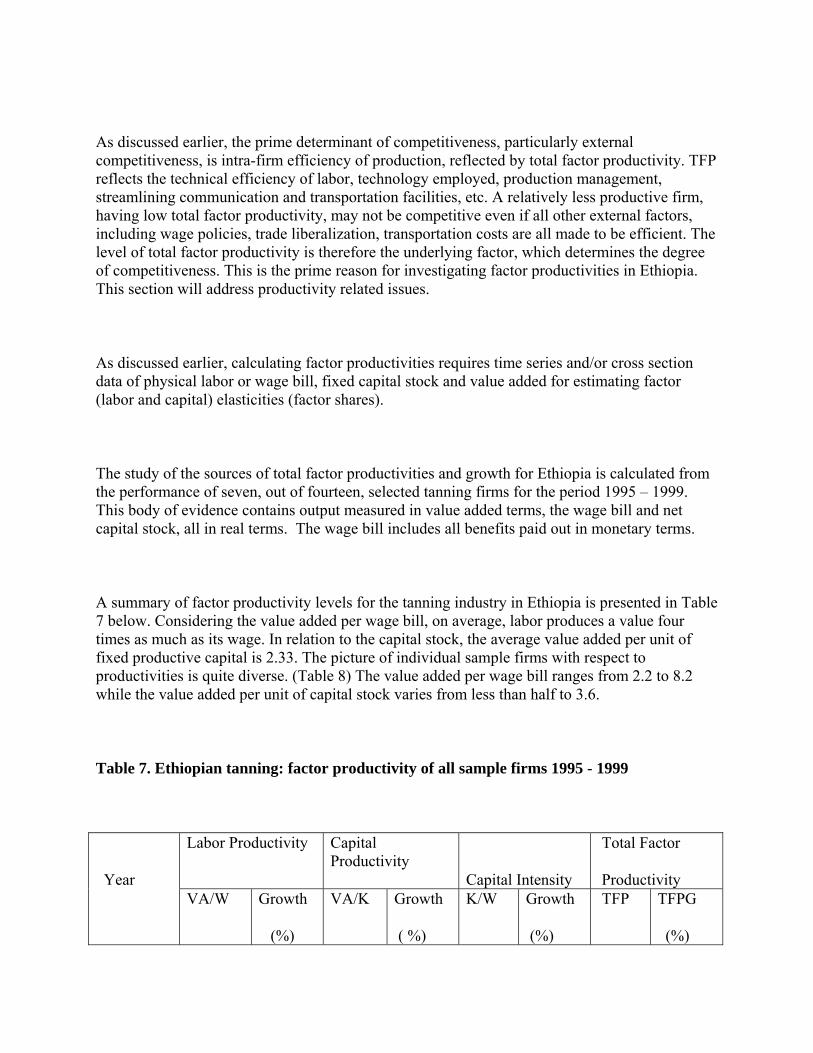
Table 7. Ethiopian tanning: factor productivity of all sample firms 1995 - 1999
Year
Labor Productivity Capital Productivity
Capital Intensity
Total Factor
Productivity VA/W Growth
(%)
VA/K Growth
( %)
K/W Growth
(%)
TFP TFPG
(%)
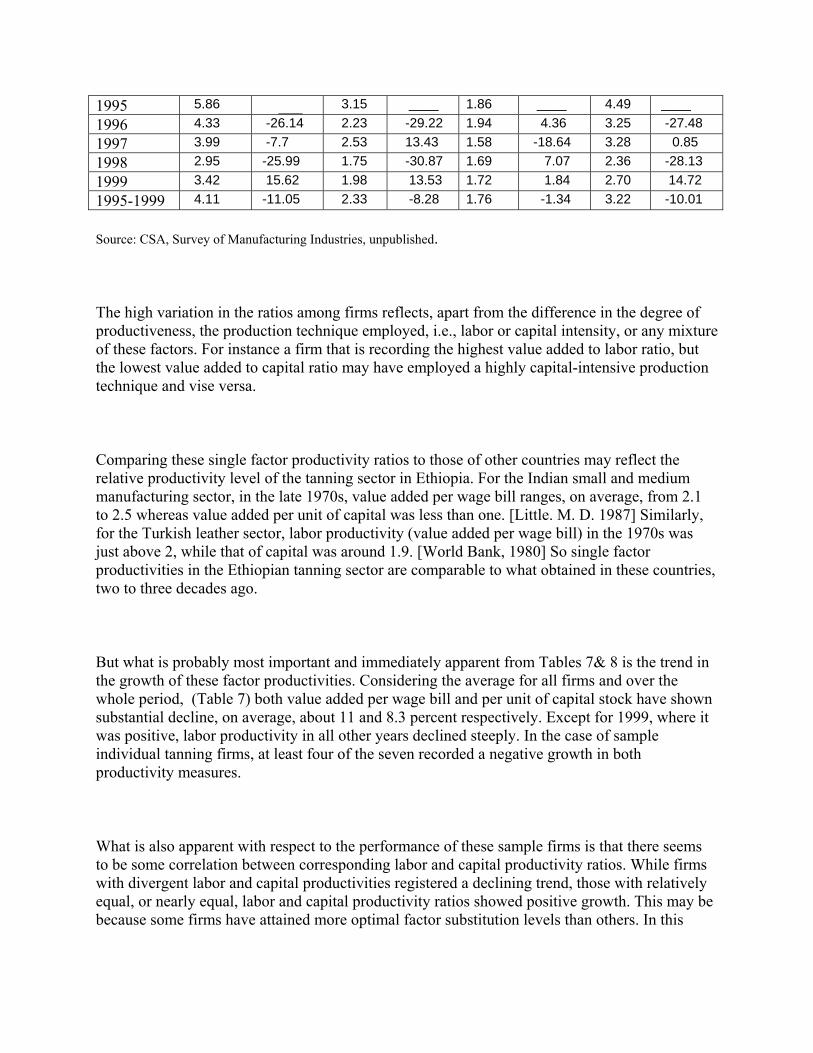
1995 5.86 ___ 3.15 ____ 1.86 ____ 4.49 ____1996 4.33 -26.14 2.23 -29.22 1.94 4.36 3.25 -27.481997 3.99 -7.7 2.53 13.43 1.58 -18.64 3.28 0.851998 2.95 -25.99 1.75 -30.87 1.69 7.07 2.36 -28.131999 3.42 15.62 1.98 13.53 1.72 1.84 2.70 14.721995-1999 4.11 -11.05 2.33 -8.28 1.76 -1.34 3.22 -10.01
Source: CSA, Survey of Manufacturing Industries, unpublished.
The high variation in the ratios among firms reflects, apart from the difference in the degree of productiveness, the production technique employed, i.e., labor or capital intensity, or any mixture of these factors. For instance a firm that is recording the highest value added to labor ratio, but the lowest value added to capital ratio may have employed a highly capital-intensive production technique and vise versa.
Comparing these single factor productivity ratios to those of other countries may reflect the relative productivity level of the tanning sector in Ethiopia. For the Indian small and medium manufacturing sector, in the late 1970s, value added per wage bill ranges, on average, from 2.1 to 2.5 whereas value added per unit of capital was less than one. [Little. M. D. 1987] Similarly, for the Turkish leather sector, labor productivity (value added per wage bill) in the 1970s was just above 2, while that of capital was around 1.9. [World Bank, 1980] So single factor productivities in the Ethiopian tanning sector are comparable to what obtained in these countries, two to three decades ago.
But what is probably most important and immediately apparent from Tables 7& 8 is the trend in the growth of these factor productivities. Considering the average for all firms and over the whole period, (Table 7) both value added per wage bill and per unit of capital stock have shown substantial decline, on average, about 11 and 8.3 percent respectively. Except for 1999, where it was positive, labor productivity in all other years declined steeply. In the case of sample individual tanning firms, at least four of the seven recorded a negative growth in both productivity measures.
What is also apparent with respect to the performance of these sample firms is that there seems to be some correlation between corresponding labor and capital productivity ratios. While firms with divergent labor and capital productivities registered a declining trend, those with relatively equal, or nearly equal, labor and capital productivity ratios showed positive growth. This may be because some firms have attained more optimal factor substitution levels than others. In this

respect, not more than 30 percent of the tanning firms in Ethiopia have attained optimal combination of productive factors.
The overall declining trend of both labor and capital productivities may not be surprising in light of the lack of capital deepening, or lack of investment/renovation in these firms. For all sample firms, capital intensity declined at an annual average rate of 3.5 percent, implying a gradual de-capitalization process. Considering individual establishments, four out of the seven recorded a substantial decline in capital intensity.
The lack of capital deepening, therefore, is one of the major factors for the deterioration in labor productivity. The overall decline in capital intensity, labor and capital productivities have an obvious implication for total factor productivity. Over the period under consideration and even for earlier periods, [Befekadu & Berhanu, 1999/2000] TFP has been consistently falling. This is precisely the trend in the Ethiopian tanning sector.
Table 8. Characteristics of sample tanning firms 1995 - 1999
Firm
Identity
Number
Labor Productivity Productivity of
Capital
Capital Intensity Total Factor
Productivity VA/W Growth-
percent VA/K Growth-
percent K/W Growth-
percent TFP Growth-
percent 1 4.47 -2.49 4.56 9.82 1.00 -11.94 4.48 2.09 2 2.59 -18.64 1.32 -1.74 1.98 6.21 1.92 -13.56 3 2.21 -4.97 1.44 -32.53 2.32 74.88 1.76 -21.55 4 3.74 20.85 3.44 44.86 1.22 -18.39 3.54 30.18 5 7.29 -51.64 3.61 -38.62 1.76 -7.63 5.35 -46.64 6 3.25 33.09 3.03 44.91 1.12 4.23 3.14 36.57 7 8.21 -30.44 0.39 -13.76 18.96 -13.95 2.17 -25.12
Source: CSA, Survey of Manufacturing Industries, unpublished.
To extend the analysis further, we ran a regression to estimate elasticities of labor and capital. [see Annex for details of the regression] The regression result shows that labor has a higher share, about 0.57, than that of capital (0.43) for the firms under consideration. Based on these elasticities (factor shares), total factor productivities are calculated for each firm (Table 8) and for all firms. (Table 7) Accordingly, the average total factor productivity (TFP) of all firms over this five years period was about 3.2, implying that labor and capital together produce three times higher than what is paid out for these factors. But, the variation among different firms is quite considerable. The most productive firm has a TFP of 5.5 while the least productive recorded only 1.7, that is, a coefficient of variation of about 22.5 percent.
Again an important aspect related to TFPs is the trend overtime. For all sample firms collectively, total factor productivity decreased at an annual average rate of 10 percent over the five years period. Very much in line with single factor productivities, in the case of total productivities too, four out of the seven firms have registered double digit negative growth. Moreover, parallel to what has been noted above, firms whose labor and capital productivities have relatively small differences, recorded positive TFP growth, while the rest, with marked differences between labor and capital productivities, show declining trends. This might be because the former achieved a relatively more optimal factor substitution than the latter.
The foregoing productivity analysis of tanning firms in Ethiopia has profound implications for the competitiveness of the tanning sector. The level of total factor productivities for most firms (except two having 5.4 & 4.5) is low. It is only comparable to that of other developing countries two decades back. What is even more concerning is that productivity levels are falling over time. These tanning firms are losing ground in one of the most fundamental measures of competitiveness. What is also interesting in this connection is that productivities happen to decline steeply during the period where the country is liberalizing (opening up) the external sector.
6.2 Sources of productivity change
What is perhaps useful in this analysis is to identify the relative contribution of capital intensity on the one hand, and all the remaining factors collectively on the other, to labor productivity. As discussed earlier, one way of explaining the sources of changes in productivities, is to decompose the change in labor productivity into that of capital deepening and total factor productivity (general technological change), that is the difference between the actual change in labor productivity and that which can be accounted for by capital deepening. [Dollar, et al. 1990]
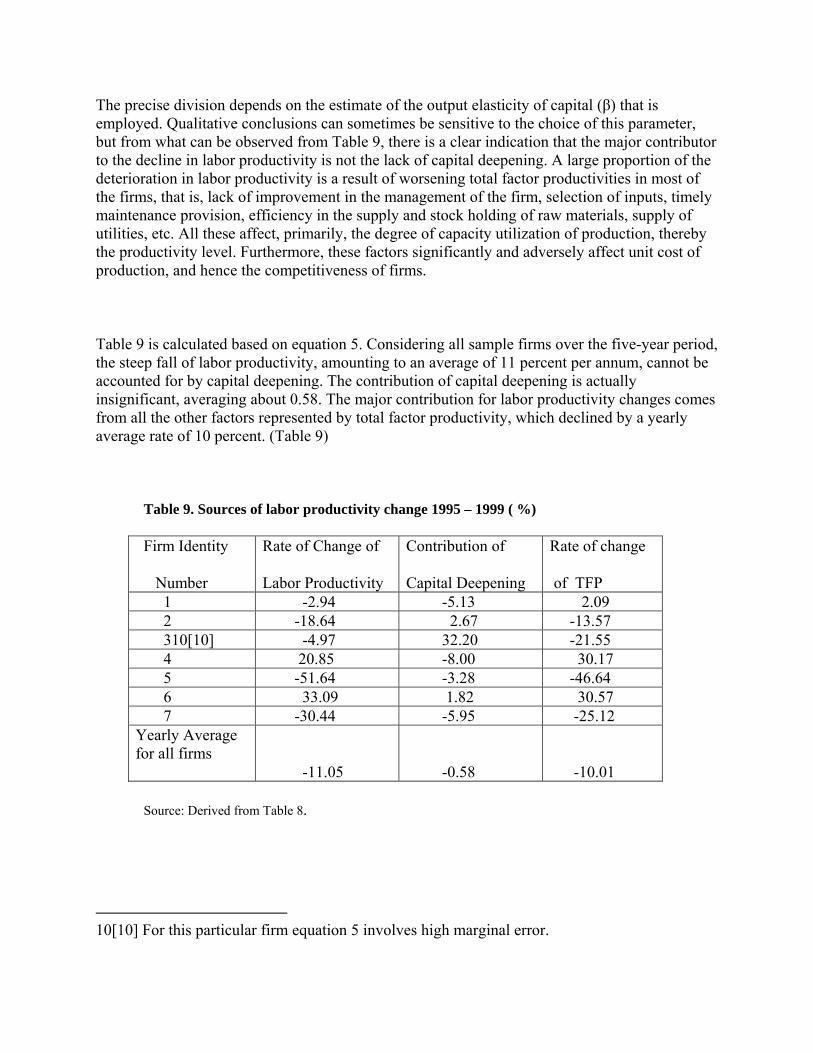
The precise division depends on the estimate of the output elasticity of capital (β) that is employed. Qualitative conclusions can sometimes be sensitive to the choice of this parameter, but from what can be observed from Table 9, there is a clear indication that the major contributor to the decline in labor productivity is not the lack of capital deepening. A large proportion of the deterioration in labor productivity is a result of worsening total factor productivities in most of the firms, that is, lack of improvement in the management of the firm, selection of inputs, timely maintenance provision, efficiency in the supply and stock holding of raw materials, supply of utilities, etc. All these affect, primarily, the degree of capacity utilization of production, thereby the productivity level. Furthermore, these factors significantly and adversely affect unit cost of production, and hence the competitiveness of firms.
Table 9 is calculated based on equation 5. Considering all sample firms over the five-year period, the steep fall of labor productivity, amounting to an average of 11 percent per annum, cannot be accounted for by capital deepening. The contribution of capital deepening is actually insignificant, averaging about 0.58. The major contribution for labor productivity changes comes from all the other factors represented by total factor productivity, which declined by a yearly average rate of 10 percent. (Table 9)
Table 9. Sources of labor productivity change 1995 – 1999 ( %)
Firm Identity
Number
Rate of Change of
Labor Productivity
Contribution of
Capital Deepening
Rate of change
of TFP 1 -2.94 -5.13 2.09 2 -18.64 2.67 -13.57 310[10] -4.97 32.20 -21.55 4 20.85 -8.00 30.17 5 -51.64 -3.28 -46.64 6 33.09 1.82 30.57 7 -30.44 -5.95 -25.12 Yearly Average for all firms
-11.05
-0.58
-10.01
Source: Derived from Table 8.
10[10] For this particular firm equation 5 involves high marginal error.
In the case of individual firms too, though the magnitude varies from firm to firm, changes in total factor productivity remain a major factor.11[11]
The implication is straightforward. To reverse the declining trend of labor productivity, more focus should be given towards improving the overall management of firms mentioned above.
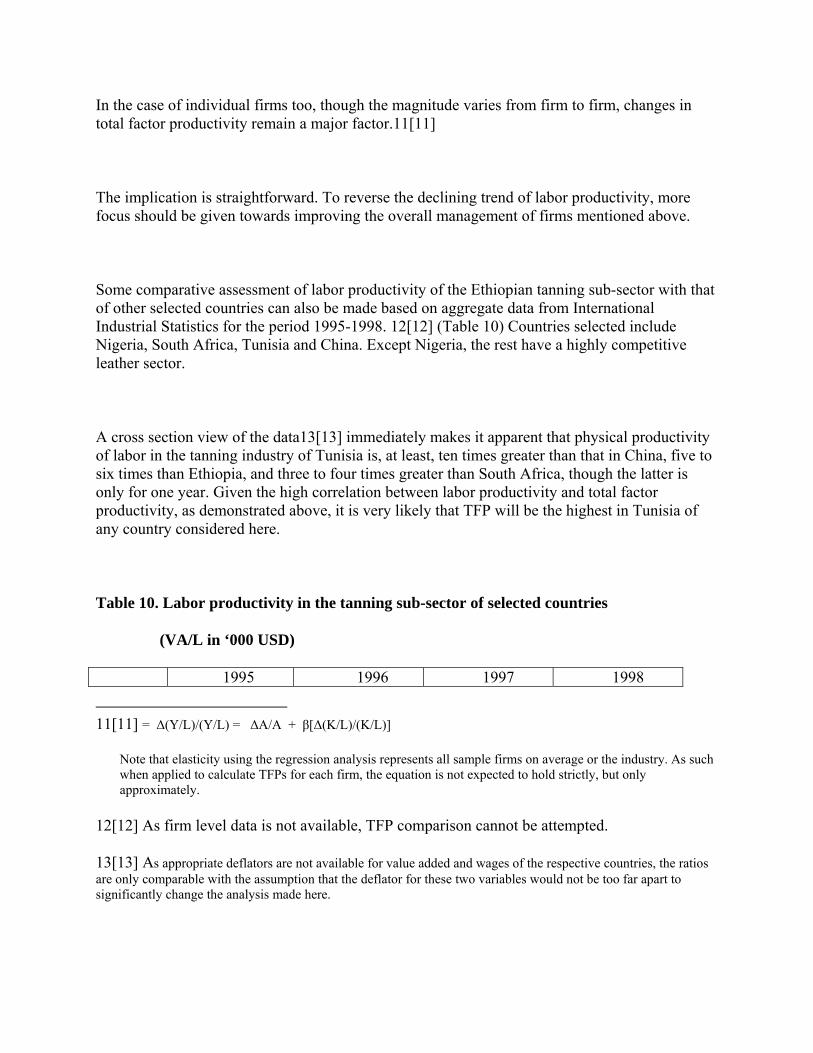
Some comparative assessment of labor productivity of the Ethiopian tanning sub-sector with that of other selected countries can also be made based on aggregate data from International Industrial Statistics for the period 1995-1998. 12[12] (Table 10) Countries selected include Nigeria, South Africa, Tunisia and China. Except Nigeria, the rest have a highly competitive leather sector.
A cross section view of the data13[13] immediately makes it apparent that physical productivity of labor in the tanning industry of Tunisia is, at least, ten times greater than that in China, five to six times than Ethiopia, and three to four times greater than South Africa, though the latter is only for one year. Given the high correlation between labor productivity and total factor productivity, as demonstrated above, it is very likely that TFP will be the highest in Tunisia of any country considered here.
Table 10. Labor productivity in the tanning sub-sector of selected countries
(VA/L in ‘000 USD)
1995 1996 1997 1998
11[11] = ∆(Y/L)/(Y/L) = ∆A/A + β[∆(K/L)/(K/L)]
Note that elasticity using the regression analysis represents all sample firms on average or the industry. As such when applied to calculate TFPs for each firm, the equation is not expected to hold strictly, but only approximately.
12[12] As firm level data is not available, TFP comparison cannot be attempted.
13[13] As appropriate deflators are not available for value added and wages of the respective countries, the ratios are only comparable with the assumption that the deflator for these two variables would not be too far apart to significantly change the analysis made here.
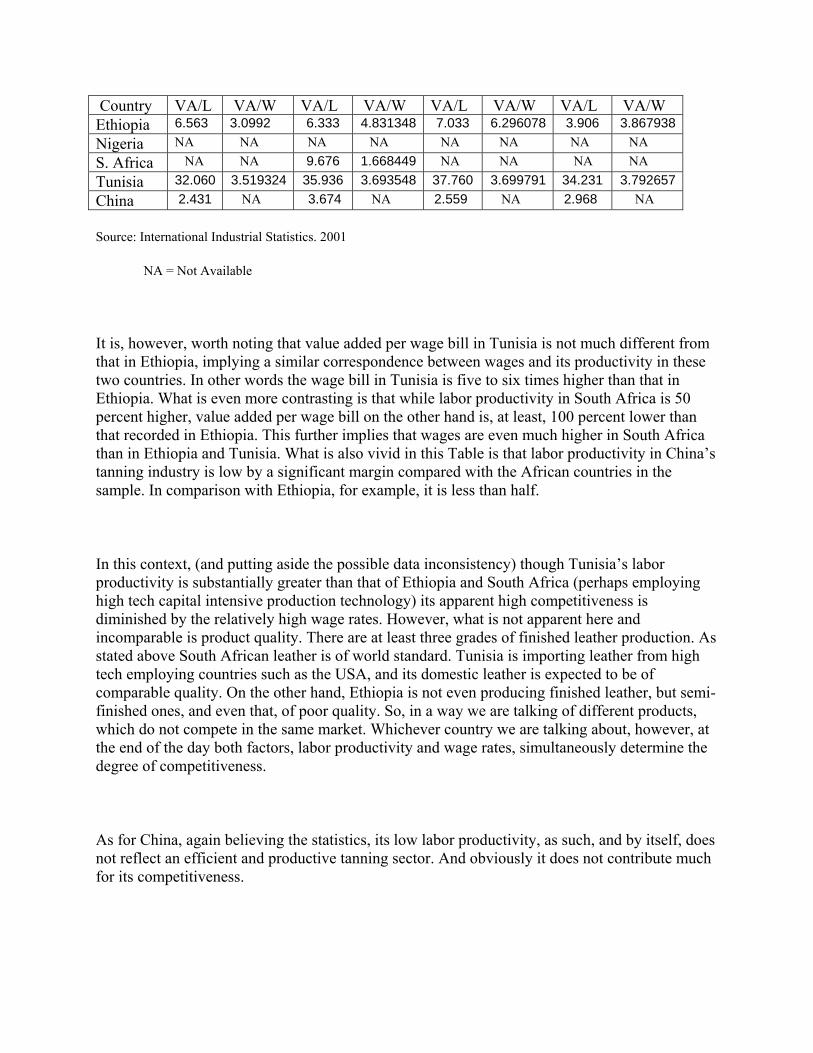
Country VA/L VA/W VA/L VA/W VA/L VA/W VA/L VA/W Ethiopia 6.563 3.0992 6.333 4.831348 7.033 6.296078 3.906 3.867938Nigeria NA NA NA NA NA NA NA NA S. Africa NA NA 9.676 1.668449 NA NA NA NA Tunisia 32.060 3.519324 35.936 3.693548 37.760 3.699791 34.231 3.792657China 2.431 NA 3.674 NA 2.559 NA 2.968 NA
Source: International Industrial Statistics. 2001
NA = Not Available
It is, however, worth noting that value added per wage bill in Tunisia is not much different from that in Ethiopia, implying a similar correspondence between wages and its productivity in these two countries. In other words the wage bill in Tunisia is five to six times higher than that in Ethiopia. What is even more contrasting is that while labor productivity in South Africa is 50 percent higher, value added per wage bill on the other hand is, at least, 100 percent lower than that recorded in Ethiopia. This further implies that wages are even much higher in South Africa than in Ethiopia and Tunisia. What is also vivid in this Table is that labor productivity in China’s tanning industry is low by a significant margin compared with the African countries in the sample. In comparison with Ethiopia, for example, it is less than half.
In this context, (and putting aside the possible data inconsistency) though Tunisia’s labor productivity is substantially greater than that of Ethiopia and South Africa (perhaps employing high tech capital intensive production technology) its apparent high competitiveness is diminished by the relatively high wage rates. However, what is not apparent here and incomparable is product quality. There are at least three grades of finished leather production. As stated above South African leather is of world standard. Tunisia is importing leather from high tech employing countries such as the USA, and its domestic leather is expected to be of comparable quality. On the other hand, Ethiopia is not even producing finished leather, but semi-finished ones, and even that, of poor quality. So, in a way we are talking of different products, which do not compete in the same market. Whichever country we are talking about, however, at the end of the day both factors, labor productivity and wage rates, simultaneously determine the degree of competitiveness.
As for China, again believing the statistics, its low labor productivity, as such, and by itself, does not reflect an efficient and productive tanning sector. And obviously it does not contribute much for its competitiveness.
As noted above, the relatively low productivity level, and most of all its deteriorating trend reflected by tanning firms in Ethiopia stems largely from the low capacity operation and the lack of learning in production management. The gradual depreciation of the birr and accompanying foreign currency constraint make spare parts, machinery and equipments expensive and less accessible for updating and replacing obsolete factories. Moreover, the current process of privatization, which lacks clear guidance and transparency, and which is not yet over, seems to create (at least in the short term) unrest and insecurity on the part of labor and management. The cumulative effect has significantly contributed to the decline in factor productivities.
6.3 Productivities in the footwear sub-sector
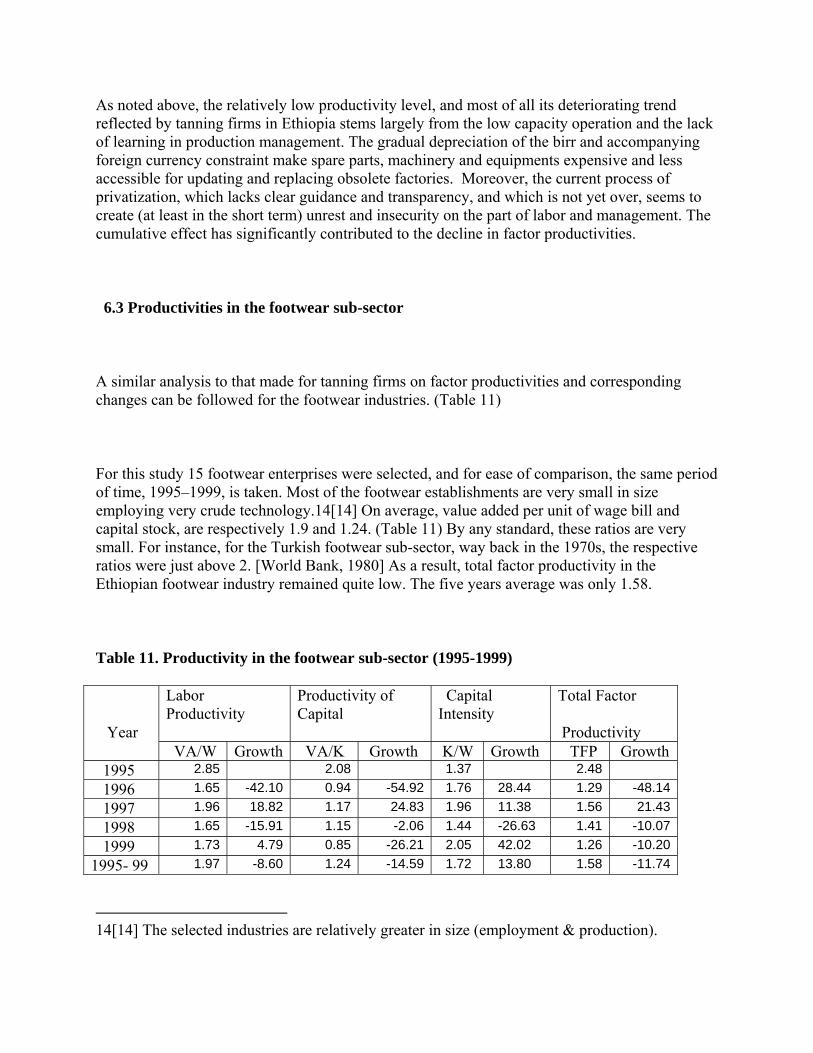
A similar analysis to that made for tanning firms on factor productivities and corresponding changes can be followed for the footwear industries. (Table 11)
For this study 15 footwear enterprises were selected, and for ease of comparison, the same period of time, 1995–1999, is taken. Most of the footwear establishments are very small in size employing very crude technology.14[14] On average, value added per unit of wage bill and capital stock, are respectively 1.9 and 1.24. (Table 11) By any standard, these ratios are very small. For instance, for the Turkish footwear sub-sector, way back in the 1970s, the respective ratios were just above 2. [World Bank, 1980] As a result, total factor productivity in the Ethiopian footwear industry remained quite low. The five years average was only 1.58.
Table 11. Productivity in the footwear sub-sector (1995-1999)
Year
Labor Productivity
Productivity of Capital
Capital Intensity
Total Factor
Productivity VA/W Growth VA/K Growth K/W Growth TFP Growth
1995 2.85 2.08 1.37 2.48 1996 1.65 -42.10 0.94 -54.92 1.76 28.44 1.29 -48.14 1997 1.96 18.82 1.17 24.83 1.96 11.38 1.56 21.43 1998 1.65 -15.91 1.15 -2.06 1.44 -26.63 1.41 -10.07 1999 1.73 4.79 0.85 -26.21 2.05 42.02 1.26 -10.201995- 99 1.97 -8.60 1.24 -14.59 1.72 13.80 1.58 -11.74
14[14] The selected industries are relatively greater in size (employment & production).
Source: CSA, Survey of Manufacturing Industries, unpublished.
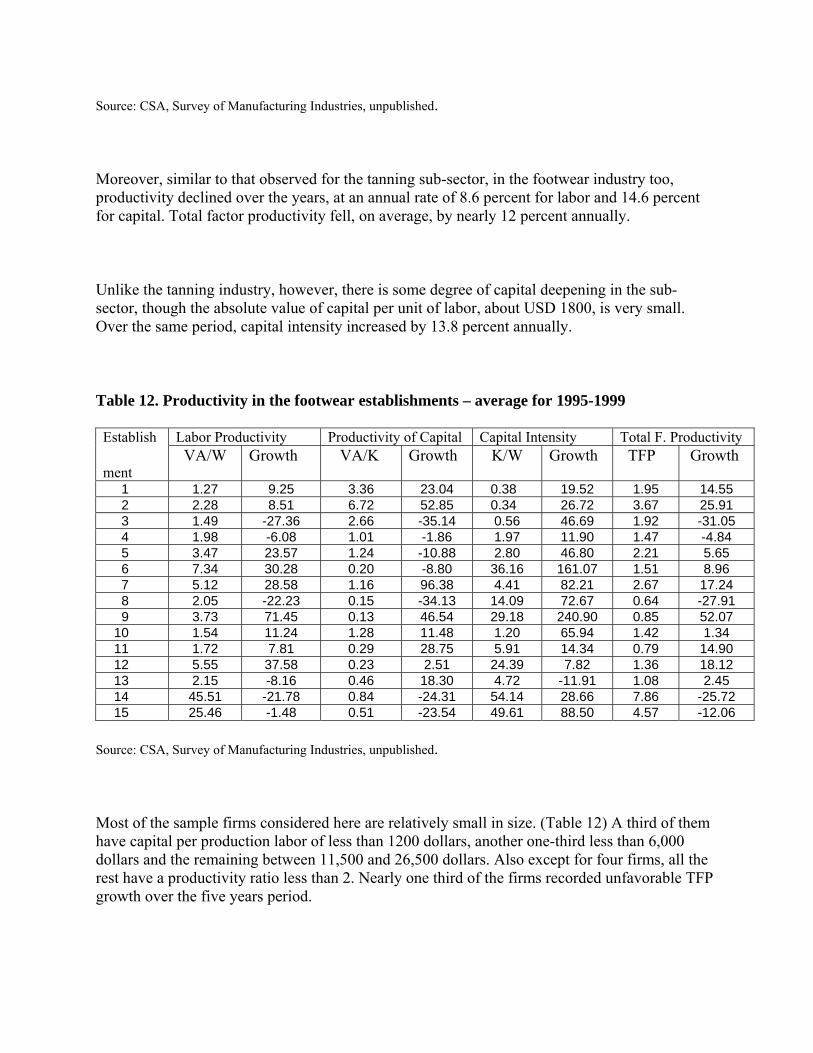
Moreover, similar to that observed for the tanning sub-sector, in the footwear industry too, productivity declined over the years, at an annual rate of 8.6 percent for labor and 14.6 percent for capital. Total factor productivity fell, on average, by nearly 12 percent annually.
Unlike the tanning industry, however, there is some degree of capital deepening in the sub-sector, though the absolute value of capital per unit of labor, about USD 1800, is very small. Over the same period, capital intensity increased by 13.8 percent annually.
Table 12. Productivity in the footwear establishments – average for 1995-1999
Establish
ment
Labor Productivity Productivity of Capital Capital Intensity Total F. Productivity VA/W Growth VA/K Growth K/W Growth TFP Growth
1 1.27 9.25 3.36 23.04 0.38 19.52 1.95 14.55 2 2.28 8.51 6.72 52.85 0.34 26.72 3.67 25.91 3 1.49 -27.36 2.66 -35.14 0.56 46.69 1.92 -31.05 4 1.98 -6.08 1.01 -1.86 1.97 11.90 1.47 -4.84 5 3.47 23.57 1.24 -10.88 2.80 46.80 2.21 5.65 6 7.34 30.28 0.20 -8.80 36.16 161.07 1.51 8.96 7 5.12 28.58 1.16 96.38 4.41 82.21 2.67 17.24 8 2.05 -22.23 0.15 -34.13 14.09 72.67 0.64 -27.91 9 3.73 71.45 0.13 46.54 29.18 240.90 0.85 52.07 10 1.54 11.24 1.28 11.48 1.20 65.94 1.42 1.34 11 1.72 7.81 0.29 28.75 5.91 14.34 0.79 14.90 12 5.55 37.58 0.23 2.51 24.39 7.82 1.36 18.12 13 2.15 -8.16 0.46 18.30 4.72 -11.91 1.08 2.45 14 45.51 -21.78 0.84 -24.31 54.14 28.66 7.86 -25.72 15 25.46 -1.48 0.51 -23.54 49.61 88.50 4.57 -12.06
Source: CSA, Survey of Manufacturing Industries, unpublished.
Most of the sample firms considered here are relatively small in size. (Table 12) A third of them have capital per production labor of less than 1200 dollars, another one-third less than 6,000 dollars and the remaining between 11,500 and 26,500 dollars. Also except for four firms, all the rest have a productivity ratio less than 2. Nearly one third of the firms recorded unfavorable TFP growth over the five years period.
What can be drawn from the footwear industry in Ethiopia is that most firms not only have low total productivity ratios, but also show a declining trend over the years, implying deterioration in the capacity of the footwear sub-sector to compete.
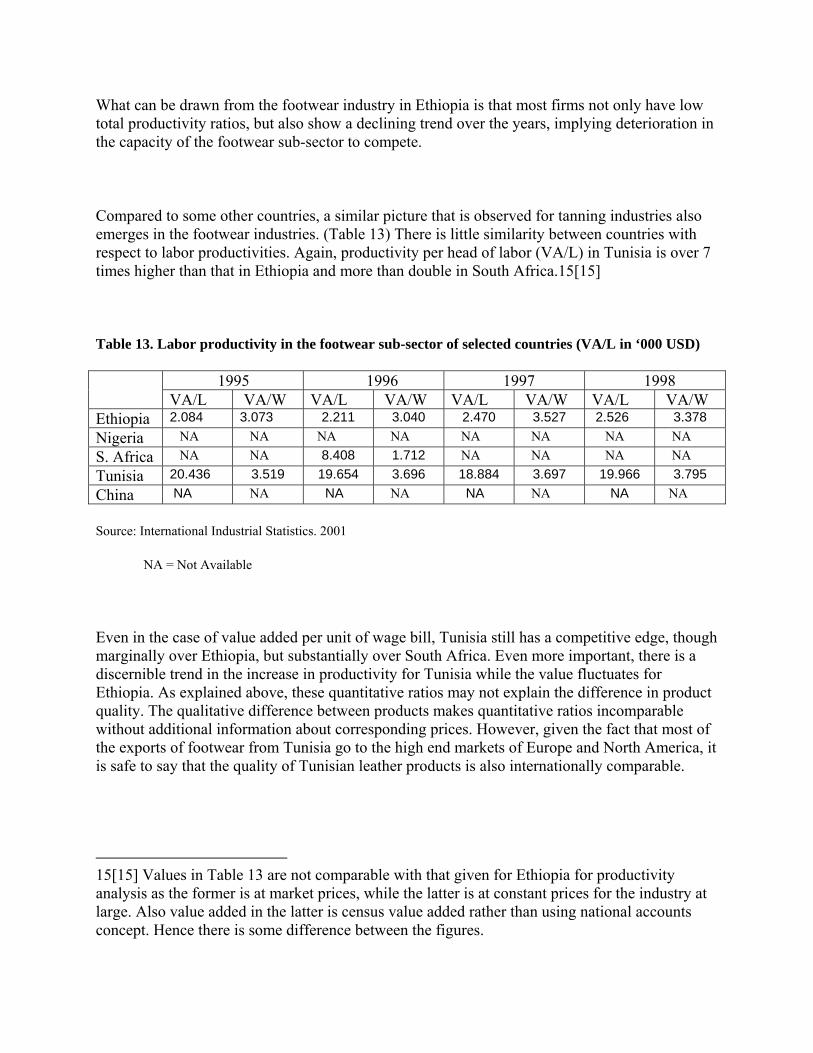
Compared to some other countries, a similar picture that is observed for tanning industries also emerges in the footwear industries. (Table 13) There is little similarity between countries with respect to labor productivities. Again, productivity per head of labor (VA/L) in Tunisia is over 7 times higher than that in Ethiopia and more than double in South Africa.15[15]
Table 13. Labor productivity in the footwear sub-sector of selected countries (VA/L in ‘000 USD)
1995 1996 1997 1998 VA/L VA/W VA/L VA/W VA/L VA/W VA/L VA/W
Ethiopia 2.084 3.073 2.211 3.040 2.470 3.527 2.526 3.378Nigeria NA NA NA NA NA NA NA NAS. Africa NA NA 8.408 1.712 NA NA NA NATunisia 20.436 3.519 19.654 3.696 18.884 3.697 19.966 3.795China NA NA NA NA NA NA NA NA
Source: International Industrial Statistics. 2001
NA = Not Available
Even in the case of value added per unit of wage bill, Tunisia still has a competitive edge, though marginally over Ethiopia, but substantially over South Africa. Even more important, there is a discernible trend in the increase in productivity for Tunisia while the value fluctuates for Ethiopia. As explained above, these quantitative ratios may not explain the difference in product quality. The qualitative difference between products makes quantitative ratios incomparable without additional information about corresponding prices. However, given the fact that most of the exports of footwear from Tunisia go to the high end markets of Europe and North America, it is safe to say that the quality of Tunisian leather products is also internationally comparable.
15[15] Values in Table 13 are not comparable with that given for Ethiopia for productivity analysis as the former is at market prices, while the latter is at constant prices for the industry at large. Also value added in the latter is census value added rather than using national accounts concept. Hence there is some difference between the figures.
7. Conclusion and Recommendations
Clearly, the study shows that resource endowment is not enough for competitiveness. Neither does the lack of it hinder from being competitive. [Berhanu & Kibre, 2001] Irrespective of the fact that Ethiopia has relatively abundant resource potential, the leather sector is not able to be competitive even in the domestic market. Achieving competitiveness requires effective utilization of available resources. Moreover, in today’s competitive global market, competition is not only about price but also about supplying quality products.
Similarly, availability of cheap (abundant) labor, by itself does not seem to be sufficient to compete internationally. Ethiopia (and perhaps many African countries too) is typical of this. Irrespective of the availability of cheap labor resource (the basic wage in Ethiopia is around USD 0.7 per day), the leather sector is the least competitive.16[16]
Neither does the lack of technological capacity, although a crucial factor, finally explain lack of competitiveness as is evident in the case of China.17[17] What is perhaps more relevant with respect to technology is the lack of timely and efficient maintenance, modification and innovation which has to do with the lack of spare parts (foreign currency shortage) and unsatisfactory learning effort exhibited by labor and management, which is reflected in the declining of total factor productivities.
There is still more that can be said about competitiveness in this study, beyond price and quality. Though Chinese firms attribute low labor cost (said to be around USD 1 per day) and low raw material price for their competitiveness and thus huge market share of the world leather trade, having the same attributes did not result in competitiveness in Ethiopia whose labor and raw material cost is not more than that in China (actually less in Ethiopia). [Berhanu & Kibre, 2001] Hence, labor cost by itself can hardly be the sole factor for competitiveness. This lends credence to the claim by Ethiopian producers (and some African producers too) that unfair trading
16[16] On the other hand despite the fact that wages in other countries (like Tunisia and South Africa) are relative high, they are competitive because of corresponding high factor productivity. [Berhanu & Kibre, 2001]
17[17] For instance, China, whose technology is not much more superior than many poor performing African countries, is highly competitive. [Berhanu & Kibre, 2001]
practices including invisible state subsidies (such as variable cost pricing) could be at play here. Although this claim cannot be totally discounted, and above all indicates the crucial role government policies could play in helping firms achieve international competitiveness, the production problems of countries such as Ethiopia (and it is very likely that these conditions prevail in many African countries) largely rest in factors internal to the firms and the countries involved.
One such crucial internal factor common to low performing countries, such as Ethiopia, is the lack of adequate and efficient infrastructure, which in turn puts additional cost on firms and also limits their capacity of operation. The combined effect of inefficient infrastructure and inefficient bureaucratic structures is to significantly raise the transactions costs to firms making it difficult to compete with firms that do not suffer from these maladies. Lack of adequate social and physical infrastructure, is a common problem that affects not only the leather sector but also all economic activities in the continent.
What is also explicit in this study is the absence of strategic partnerships between government and the private sector. In Ethiopia, export tax exemption is in place (and though too complicated and frustrating, duty draw back system is also recently implemented). However, given the resource endowment Ethiopia has in the leather sector, and thus the potential on the one hand and the extreme backwardness of the economy on the other, the incentive provided seems to be too little to be effective.18[18]
What should be done to enhance productivity and improve the competitiveness of the leather and leather goods sector in Ethiopia? Clearly, there are lessons to be learnt from better performing African countries. But there are also specific features that need to be addressed in the Ethiopian context only. In what follows, a number of recommendations that could be identified from this study to help the future competitiveness of the Ethiopian leather and leather goods industry, based on Ethiopia’s and other better performing countries experiences are provided.
In low productivity and less competitive countries such as Ethiopia, one of the fundamental problems of the leather sector seems to be poor quality of raw materials (hides and skins). There are essentially two causes affecting the quality of raw materials. The first one is related to defects of hides and skins resulting from various types of diseases. To date, in Ethiopia (and probably in most African countries), provision of veterinary services has been the exclusive task
18[18] In China and Tunisia much more (deliberate and targeted) incentives are provided by the respective governments. [Berhanu & Kibre, 2001]
of the public sector. While the involvement of government is necessary, in countries such as Ethiopia where the livestock population is dispersed across the country, government alone can hardly provide full coverage. To license and simultaneously extend full support to the private sector for providing veterinary services is a move that could make a difference.
With respect to handling defects associated with traditional slaughtering, storage and preservation methods, improvement in this area primarily requires provision of ‘quality improvement services’ by government in the form of training and infrastructure. It is here where local governments’ involvement will play a vital role. This needs to be supported by enforceable regulatory measures on grading hides and skins which goes along with corresponding price differentials and also, licensing buyers so as to create formal marketing channels. What is crucial in this context is that households, who are the major suppliers of hides and skins, are not traditionally the beneficiaries from higher prices due to lack of information and competitive markets. Provision of price information on a regular basis to households might as well create the incentive to improve the quality of hides and skins. This could be provided through the media, agricultural development agents, etc., who have close contact with rural households.
But quality improvement and, particularly, increased productivity in general is also a product of the technology deployed in the process of tanning. This is a question of technology as well as the know how of labor and technical management. The choice of appropriate technology and improvement in labor and management skills require the concerted effort of government, firms, trade associations, institutes such as the recently established Leather and Leather Products Training and Development Institute (LLPTDI) in Ethiopia and also regional organizations, such as the Common Market for Eastern and Southern Africa (COMESA). Supporting firms in the selection of technology, training labor in operating, maintenance and servicing, training management to improve administrative, planning and accounting services as well as setting and supervising quality standards will significantly improve the quality of leather and leather products and their efficient production. With quality improvement of leather and leather products, it is very likely that external demand for leather will increase, leading to a higher capacity utilization and thereby reducing unit cost of production and enhancing competitiveness. These very same support measures are crucial for significantly enhancing total factor productivity at the industry level, leading to an even higher degree of competitiveness.
The limitation of tanning firms to a semi-processing stage implies lower productivity levels, as higher productivity comes with higher level of processing. Perhaps, attaching some regulation to the type and quality of products to be produced (for instance, only finished leather and/or crust) supplemented by strong government incentive may be essential for the leather sector to achieve improved competitiveness within a limited timeframe. Support could be extended in the form of credit provision, priority in foreign exchange allocation, export promotion, marketing services, and the like.
The damage done to the leather sector by imported, legally and/or smuggled cheap second hand footwear cannot be underestimated. It stifles not only the footwear industry itself but also the tanning industry as well as producers of hides and skins. According to industry sources and trade associations, many footwear firms in Ethiopia (and very likely in other African countries) are closing down because of what they consider to be unfair competition (dumping). Government need to study the legitimacy of such claims and, when found credible, must stand vigilant to protect domestic industries from being destroyed by unfair competition.
It is an incontestable fact that poor infrastructure is one of the major factors for lack of competitiveness. This, however, is partly a reflection of the general development level of countries. But, it could also reflect warped priorities in government budget allocations. In the case where this prevails, it is high time that government puts high priority for the development of infrastructure in its expenditure allocation. What is relevant to the leather sector in this context is the lack of sectoral policy pertinent to the resource endowment of the country. An industrial policy, which identifies the comparative advantage of a country and accordingly prioritizes its resource allocation could be helpful in providing infrastructural services specific to the sectors of higher priority.
Finally what should be underlined is that all the measures recommended above are equally important and need to be taken more or less simultaneously. These measures are complementary and reinforcing. Isolated piecemeal approach may not produce the expected higher productivity and competitiveness. Also, for the leather sector to be competitive (and it can be), it requires a concerted effort by the private sector, trade associations and regional organizations in terms of increasing TFP and improving quality. Unreserved effort of the public sector in helping to reduce transaction costs, protecting the industry from unfair trade practices, and helping the industry penetrate foreign markets is also crucial.
ANNEX
Elasticities of labor and capital for the Ethiopian leather sector
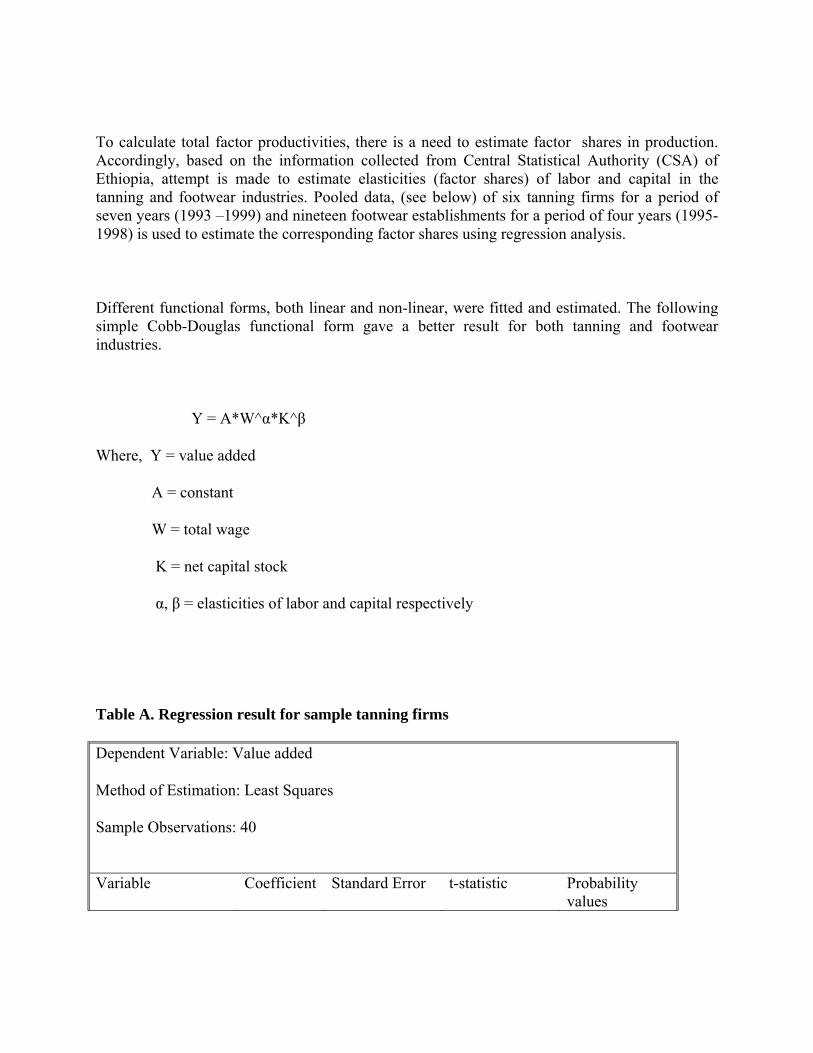
To calculate total factor productivities, there is a need to estimate factor shares in production. Accordingly, based on the information collected from Central Statistical Authority (CSA) of Ethiopia, attempt is made to estimate elasticities (factor shares) of labor and capital in the tanning and footwear industries. Pooled data, (see below) of six tanning firms for a period of seven years (1993 –1999) and nineteen footwear establishments for a period of four years (1995-1998) is used to estimate the corresponding factor shares using regression analysis.
Different functional forms, both linear and non-linear, were fitted and estimated. The following simple Cobb-Douglas functional form gave a better result for both tanning and footwear industries.
Y = A*W^α*K^β
Where, Y = value added
A = constant
W = total wage
K = net capital stock
α, β = elasticities of labor and capital respectively
Table A. Regression result for sample tanning firms
Dependent Variable: Value added
Method of Estimation: Least Squares
Sample Observations: 40
Variable Coefficient Standard Error t-statistic Probability
values
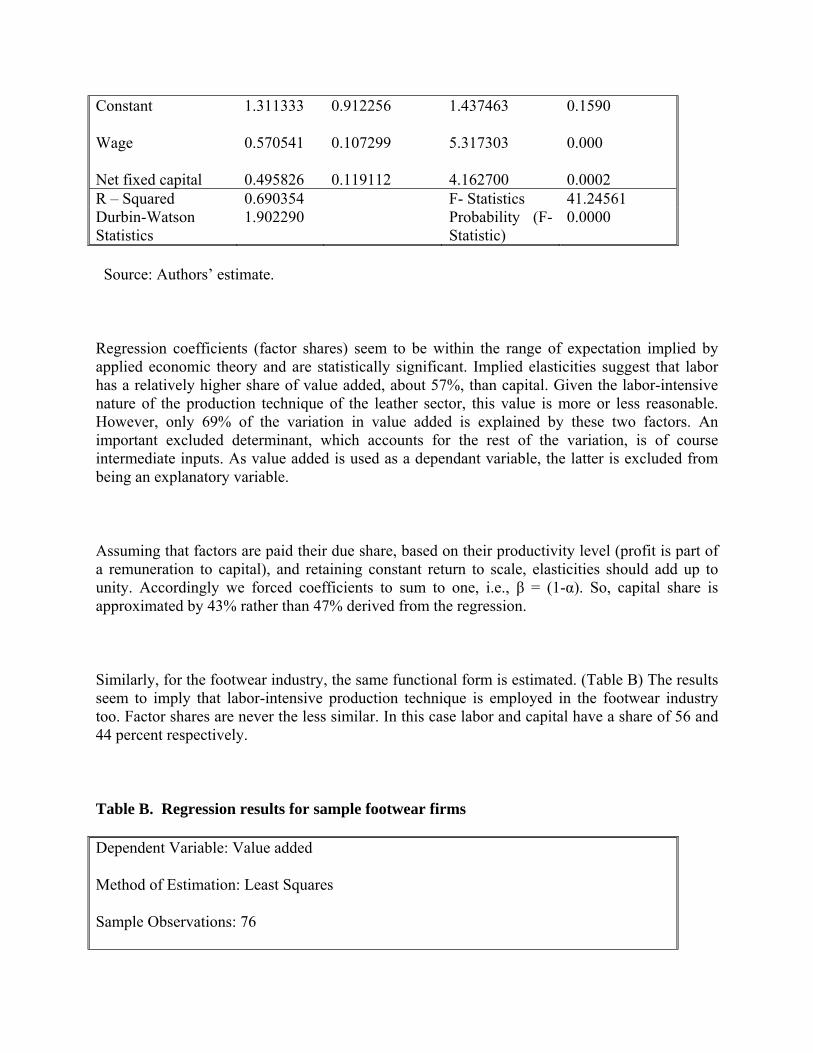
Constant
Wage
Net fixed capital
1.311333
0.570541
0.495826
0.912256
0.107299
0.119112
1.437463
5.317303
4.162700
0.1590
0.000
0.0002 R – Squared 0.690354 F- Statistics 41.24561 Durbin-Watson Statistics
1.902290 Probability (F-Statistic)
0.0000
Source: Authors’ estimate.
Regression coefficients (factor shares) seem to be within the range of expectation implied by applied economic theory and are statistically significant. Implied elasticities suggest that labor has a relatively higher share of value added, about 57%, than capital. Given the labor-intensive nature of the production technique of the leather sector, this value is more or less reasonable. However, only 69% of the variation in value added is explained by these two factors. An important excluded determinant, which accounts for the rest of the variation, is of course intermediate inputs. As value added is used as a dependant variable, the latter is excluded from being an explanatory variable.
Assuming that factors are paid their due share, based on their productivity level (profit is part of a remuneration to capital), and retaining constant return to scale, elasticities should add up to unity. Accordingly we forced coefficients to sum to one, i.e., β = (1-α). So, capital share is approximated by 43% rather than 47% derived from the regression.
Similarly, for the footwear industry, the same functional form is estimated. (Table B) The results seem to imply that labor-intensive production technique is employed in the footwear industry too. Factor shares are never the less similar. In this case labor and capital have a share of 56 and 44 percent respectively.
Table B. Regression results for sample footwear firms
Dependent Variable: Value added
Method of Estimation: Least Squares
Sample Observations: 76
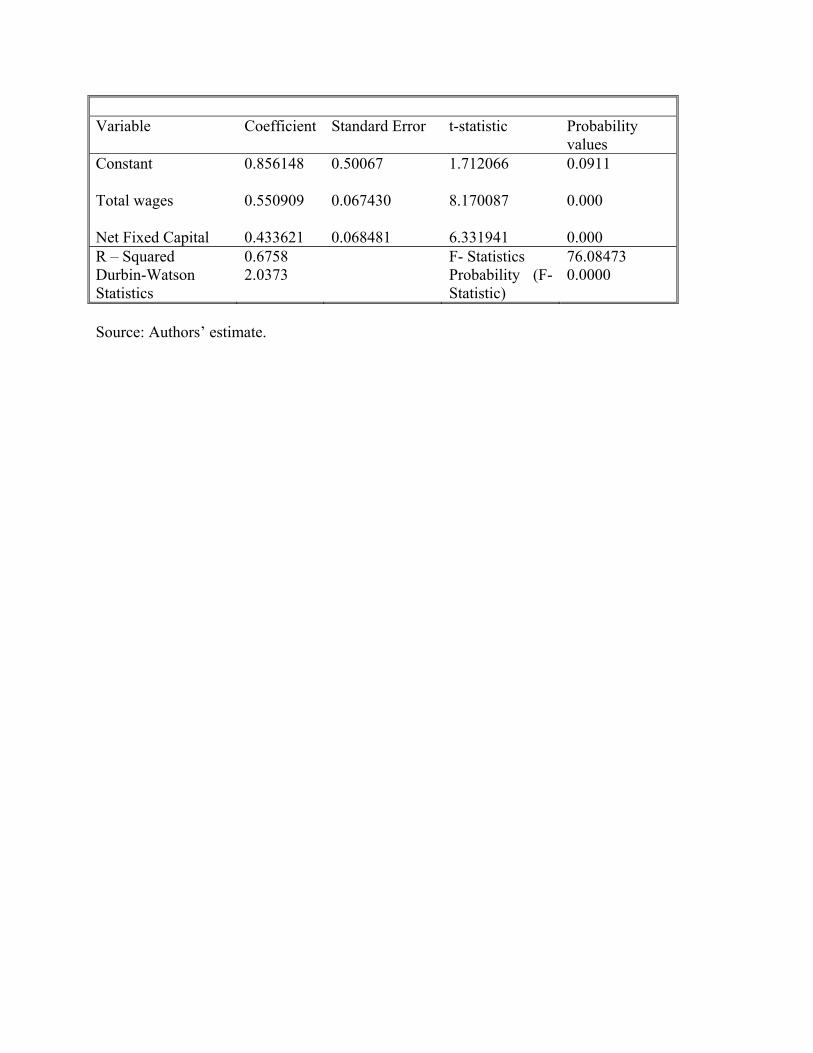
Variable Coefficient Standard Error t-statistic Probability
values Constant
Total wages
Net Fixed Capital
0.856148
0.550909
0.433621
0.50067
0.067430
0.068481
1.712066
8.170087
6.331941
0.0911
0.000
0.000 R – Squared 0.6758 F- Statistics 76.08473 Durbin-Watson Statistics
2.0373 Probability (F-Statistic)
0.0000
Source: Authors’ estimate.
Bibliography
Befekadu Degefe and Berhanu Nega (eds.) (1999/2000) Ethiopian Economic Association “Annual Report on the Ethiopian Economy”, second edition, Addis Ababa.
Berhanu Nega and Kibre Moges (2001) “Productivity and Competitiveness of the Leather Sector in Africa: Findings from Four Countries Case Studies”, UNECA sponsored, Unpublished, Addis Ababa.
Berhanu Nega and Kibre Moges (2002) “Sources and Uses of Export Support Services in Ethiopia” OECD sponsored, Unpublished, Addis Ababa.
Central Statistical Authority (2000) “Statistical Abstract”, Addis Ababa.
Cockburn, J. et al. (1999) “Measuring Competitiveness and its Sources: The Case of Mali’s Manufacturing Sector.” Canadian Journal of Development Studies, Vol. XX, No. 3, pp. 491-519, 1999.
Colin Kirckpatrick (1994) “Does Trade Liberalization Assist Third World Industrial Development: Experience and Lessons of the 1980’s”, New Series Discussion Papers No. 49, Development and Project Planning Center, University of Bradford.
Colin Kirckpatrick and John Weiss (1994) “Trade Policy Reform and Performance in Sub-Saharan Africa in the 1980s”, New Series Discussion Papers No. 54, Development and Project Planning Center, University of Bradford.
Dollar, D. and K. Sokoloff (1990) “Patterns of Productivity Growth in South
Korean Manufacturing Industries, 1963-1979.” Journal of
Development Economics, Vol.33, pp. 309-308.
Elbedawi, I. (1999) “Can Africa Export Manufactures? The Role of Endowment, Exchange Rates, and Transaction Costs”, World Bank Policy Research Paper 2120, April 1999.
Ethiopian Export Promotion Agency (2000). “Leather and Leather Products Study”. In Amharic, Addis Ababa.
FAO (1996) “Production Year Book.”
FAO (2000) “Production Year Book.”
International Industrial Statistics (2001)
International Trade Center Databases: Aggregate Trade Statistics (2001).
http://www.intracen.org/tradstat/sitc3-3d/ep611.htm
Little, I.M.D., D.Mazumdar and J.M.Page (1987), “Small Manufacturing
Enterprises: A Comparative Analysis of India and other
Economies.” World Bank Research Publication, Oxford University
Press.
National Bank of Ethiopia (1999), “Annual Report, 1997/98.”
Addis Ababa.
National Bank of Ethiopia (1997), “Quarterly Bulletin.” Vol. 12, No.4. & Vol. 13, No.4
Addis Ababa.
Nishimizu, M. and J. M. Page (1986) “Productivity Change and Dynamic
Comparative Advantage.” Review of Economics and Statistics,
Vol. 68, No. 2, pp. 241-247.
Pack, Howard (1993) “Productivity and Industrial Development in Sub-Saharan Africa.” World Development, Vol. 21, No. 1, pp. 1-16, 1993
UNCTAD (2000) “Investment and Innovation Policy of Ethiopia.” Geneva.
World Bank (2001) “World Development Indicator”.
World Bank (1980) “Estimating Total Factor Productivity Growth in the
Developing Country.” Staff paper No.422.
