decomposing socioeconomic inequality in child vaccination: results from ireland
TRANSCRIPT
J
Df
EQ1
a
b
a
ARRAA
KCICI
1
oiseEiagtprba
h0
1
2
3
4
5
6
7
8
9
10
11
12
13
14
15
16
17
18
19
20
21
22
23
24
25
26
27
28
29
30
31
32
33
34
35
ARTICLE IN PRESSG ModelVAC 15267 1–7
Vaccine xxx (2014) xxx–xxx
Contents lists available at ScienceDirect
Vaccine
j our na l ho me page: www.elsev ier .com/ locate /vacc ine
ecomposing socioeconomic inequality in child vaccination: Resultsrom Ireland
del Dohertya, Brendan Walshb, Ciaran O’Neill b,∗
Centre for Pain Research and Discipline of Economics, J.E. Cairnes School of Business and Economics, National University of Ireland, Galway, IrelandDiscipline of Economics, J.E. Cairnes School of Business and Economics, National University of Ireland, Galway, Ireland
r t i c l e i n f o
rticle history:eceived 27 September 2013eceived in revised form 10 January 2014ccepted 26 March 2014vailable online xxx
eywords:hildhood vaccination
nequalitiesoncentration index
reland
a b s t r a c t
Background: There is limited knowledge of the extent of or factors underlying inequalities in uptake ofchildhood vaccination in Ireland. This paper aims to measure and decompose socioeconomic inequalitiesin childhood vaccination in the Republic of Ireland.Methods: The analysis was performed using data from the first wave of the Growing Up in Ireland sur-vey, a nationally representative survey of the carers of over 11,000 nine-month old babies collected in2008 and 2009. Multivariate analysis was conducted to explore the child and parental factors, includingsocioeconomic factors that were associated with non-vaccination of children. A concentration index wascalculated to measure inequality in childhood vaccination. Subsequent decomposition analysis identifiedkey factors underpinning observed inequalities.Results: Overall the results confirm a strong socioeconomic gradient in childhood vaccination in theRepublic of Ireland. Concentration indices of vaccination (CI = −0.19) show a substantial pro-rich gradi-ent. Results from the decomposition analysis suggest that a substantial proportion of the inequality is
explained by household level variables such as socioeconomic status, household structure, income andentitlement to publicly funded care (34.2%, 25.2% 29.5% and 9.2% respectively). Substantial differencesare also observed between children of Irish mothers and immigrant mothers from developing countries.Conclusions: Vaccination was less likely in lower than in higher income households. Access to publiclyfunded services was an important factor in explaining inequalities.© 2014 Published by Elsevier Ltd.
36
37
38
39
40
41
42
43
44
45
46
47
48
. Introduction
Many developed countries have well-established programmesf childhood vaccinations. On the whole, concerted efforts to elim-nate communicable diseases among children have been highlyuccessful. For example, the World Health Organisation (WHO)stimated that the total number of people contracting measles inurope had fallen from approximately 850,000 in 1980 to 27,000n 2010 [1]. To prevent an outbreak of vaccine preventable diseasesmbitious targets have been set by the WHO and many nationalovernments to achieve childhood vaccination rates of 95%. In ordero achieve such high rates many countries have established specificrogrammes for vaccination in childhood. Despite this, vaccination
Please cite this article in press as: Doherty E, et al. Decomposing sociVaccine (2014), http://dx.doi.org/10.1016/j.vaccine.2014.03.084
ates often fall below the targets and uptake varies substantiallyetween countries. Taking the EU-27 as an example, while theverage vaccination rate achieved in 2010 was 95% for Diphteria,
∗ Corresponding author. Tel.: +353 91492409; fax: +353 91534130.E-mail address: [email protected] (C. O’Neill).
ttp://dx.doi.org/10.1016/j.vaccine.2014.03.084264-410X/© 2014 Published by Elsevier Ltd.
49
50
51
Tetanus and Pertussis, this varied from a high of 99% in a numberof countries to much lower rates of 76%, 83%, 89% in Malta, Austriaand Latvia respectively [2]. Moreover, the European objective ofeliminating Measles and Rubella by 2010 was not achieved due tolower than required vaccination coverage prevailing in a numberof countries [3]. With free movement of people across Europeancountries, low achievement on vaccination in one country may haveimplications for other countries also.
A growing number of studies, using data for industrialisedcountries have shown considerable variability in childhood vacci-nation associated with a number of factors. Factors that have beenexamined previously relate to socioeconomic and demographiccharacteristics such as household income, parental age, parentaleducation, parental ethnicity, number of siblings, birth order, insur-ance status, parental and physician attitudes and structural factors,associated with the type and accessibility of healthcare services
oeconomic inequality in child vaccination: Results from Ireland.
[4–16]. While not every study observed a link between socio-economic circumstances and vaccination rates (which may reflectdifferences in healthcare systems across countries), there is anemerging consensus across studies that factors associated with
52
53
54
55
ING ModelJ
2 ccine
lIpu
latbitocstvfdTp
isuGfeauIcsmtcii
2
2
m(dit
vmpbit6hPrc1tftt
56
57
58
59
60
61
62
63
64
65
66
67
68
69
70
71
72
73
74
75
76
77
78
79
80
81
82
83
84
85
86
87
88
89
90
91
92
93
94
95
96
97
98
99
100
101
102
103
104
105
106
107
108
109
110
111
112
113
114
115
116
117
118
119
120
121
122
123
124
125
126
127
128
129
130
131
132
133
134
135
136
137
138
139
140
141
142
143
144
145
146
147
148
149
150
151
152
153
154
155
156
157
158
159
160
161
162
163
164
165
166
167
168
169
170
171
172
173
174
175
ARTICLEVAC 15267 1–7
E. Doherty et al. / Va
ower socioeconomic status contribute to lower vaccination rates.n some cases, socioeconomic status was found to play a morerominent role in affecting vaccination rates than other contrib-tors such as negative parental perceptions of vaccines [11].
Findings from the literature suggest that there are also particu-ar groups of children within developed countries where targetedction may be required to overcome potential barriers to vaccina-ion. However, to be effective, policies that target low uptake shoulde informed by an assessment of the factors driving potential
nequalities in childhood vaccination. In this respect, the concen-ration index (CI) is a method used to quantify socioeconomic andther potential inequalities in health and health care, with appli-ations across a number of health-related areas [17–19]. The CIhows how a health measure, such as vaccination, varies accordingo some measure of socioeconomic status, such as income, pro-iding a single metric of any income related inequality. CIs can beurther decomposed at the individual level to allow elements whichrive the income-related inequality to be identified separately [19].his can be a useful tool to inform the development of appropriateolicy responses.
The present study seeks to quantify using a CI the extent ofnequality in vaccination uptake and shed light on the role thatocioeconomic and other factors play in explaining vaccinationptake in the Republic of Ireland. The paper uses data from therowing Up in Ireland (GUI) study, collected during 2008–2009 from
amilies of approximately 11,134 infants. The paper quantifies thextent of the socioeconomic gradient in infant vaccination using a CInd decomposes the determinants of the inequality in infant uptakesing decomposition analysis. One previous study conducted in
reland found that there was inequality in access to the MMR vac-ination based on approximately 550 observations from a cohorttudy [15]. However, this study did not decompose the socioecono-ic gradient. As far as we are aware, this is the first paper to utilise
he decomposition technique to quantify the main determinants ofhildhood vaccination in a developed country. The findings havemplications for the formulation of policies which seek to addressnequalities in childhood vaccinations in developed countries.
. Materials and methods
.1. Data description
The GUI data includes approximately one-third of all nine-onth old babies born in the state during the study period
2008–2009). The purpose of the GUI study is to provide data thatescribes the lives of Irish children and thereby inform public pol-
cy and service delivery [20]. Further details of the survey, includinghe sampling procedures, are discussed elsewhere [20,21].
In Ireland, there is an immunisation programme for infants pro-ided free of charge from when they are born until they are thirteenonths old. Babies receive their first immunisation at birth in hos-
ital (the BCG tuberculosis vaccine), after this, parents are asked toring their baby to receive courses of vaccinations when the baby
s two months, four months, six months, twelve months and thir-een months respectively. At two months infants receive their first
in 1 vaccination (covering diphtheria, tetanus, whooping cough,ib (haemophilus influenzae B), polio and hepatitis B) and theCV (pneumococcal conjugate) vaccination. At four months infantseceive their second 6 in 1 vaccination and the Men C (meningococ-al C) vaccination and at six months infants receive their final 6 in
vaccination and the PCV and Men C vaccinations. These vaccina-
Please cite this article in press as: Doherty E, et al. Decomposing sociVaccine (2014), http://dx.doi.org/10.1016/j.vaccine.2014.03.084
ions are given primarily by general practitioners (GPs) and are freeor all infants born in Ireland. Prior to the two month vaccination,he Health Service Executive (HSE) writes to the infant’s parentso remind them to arrange to visit the GP for their vaccination, for
PRESSxxx (2014) xxx–xxx
the four and six month vaccinations, it is up to parents to arrangethese appointments [22]. In this paper we examine the uptake of thesix month vaccination in order to understand factors driving non-uptake by infants at this stage (almost 99% of children had receivedat least one of the vaccine doses whereas 92% received their sixmonth vaccination, this equates to 888 infants in the sample whodid not receive their six month vaccination). Since our data is fromnine-month old babies, we cannot explore the uptake of the twelveand thirteen month vaccinations (at twelve months infants receivethe MMR and PCV vaccinations and at thirteen months infantsreceive the Men C and Hib vaccinations). For our explanatory vari-ables we include a range of characteristics that may contributeto vaccination uptake, and explain any potential socioeconomicgradient. These variables include equivalised household income,which is used as the ranking variable in the construction of theconcentration curves and indices. To compute equivalised income,an equivalence scale was used to assign a weight to each householdmember. The equivalence scales reflect those used by governmentin Ireland and assign a weight of 1 to the first adult in the house-hold, 0.66 to each subsequent adult (aged 14 years or older livingin the household) and 0.33 to each child (younger than 14 years).Equivalised income is calculated as disposable income divided byequivalised household size [21]. Other variables included representa range of socioeconomic variables, household variables, parentallevel variables, as well as a set of variables relating to the child.
2.2. Econometric analysis
In modelling the probability of infants not receiving their sixmonth vaccination a logit model was used. The outcome variabletakes a value of 1 if an infant did not receive their six month vacci-nation or 0 otherwise. For our analysis we only present the resultsfrom a multivariate model where we control for a range of otherexplanatory variables. The inclusion of variables was based on find-ings from previous studies that examined factors associated withvaccination uptake and availability of variables in the GUI dataset[4–16]. We present the results where all our independent vari-ables were entered simultaneously into the model. We note thatsome of our variables are likely to be correlated such as householdsocial class, equivalised income and maternal education. As a resultwe also discuss some findings from univariate analyses where thevariables were entered separately into the model.
2.3. Concentration index
Within the literature CIs are routinely used as a means of quan-tifying socioeconomic inequalities. A number of other inequalitymeasures are available (such as Odds Ratios following logisticregressions, Theil Entropy Index, Relative Index of Inequality), how-ever the CI has some advantages over these methods. For example,the CI can estimate inequalities across continuous, bounded andbinary variables as opposed to indices such as the Theil Index whichare much more cumbersome. Importantly, the CI allows for inequal-ities to be measured across the whole population (according toincome) as opposed to between groups, which is the case withOdds Ratios and the Theil Index. The results from the CI can alsobe easily compared to other studies that have used this method-ology regardless of the population under investigation, the meanand distribution of the dependent variable and/or the mean anddistribution of the income variable. Finally a key strength of the CIover other inequality measures is the fact that the indices can bedecomposed into a range of variables not just equivalised house-
oeconomic inequality in child vaccination: Results from Ireland.
hold income. For further discussion on the alternative inequalitymeasures see Wagstaff et al. [23].
Inequalities in the uptake of childhood vaccinations have beenstudied previously; though most studies using CIs have been
176
177
178
179
IN PRESSG ModelJ
ccine xxx (2014) xxx–xxx 3
cairicaw
C
nadtartftta
wiinI[tWspm
C
2
sthdbdvi0itsupct
�
wi
Table 1Breakdown of sample characteristics.
Variables Samplecharacteristics (%)a
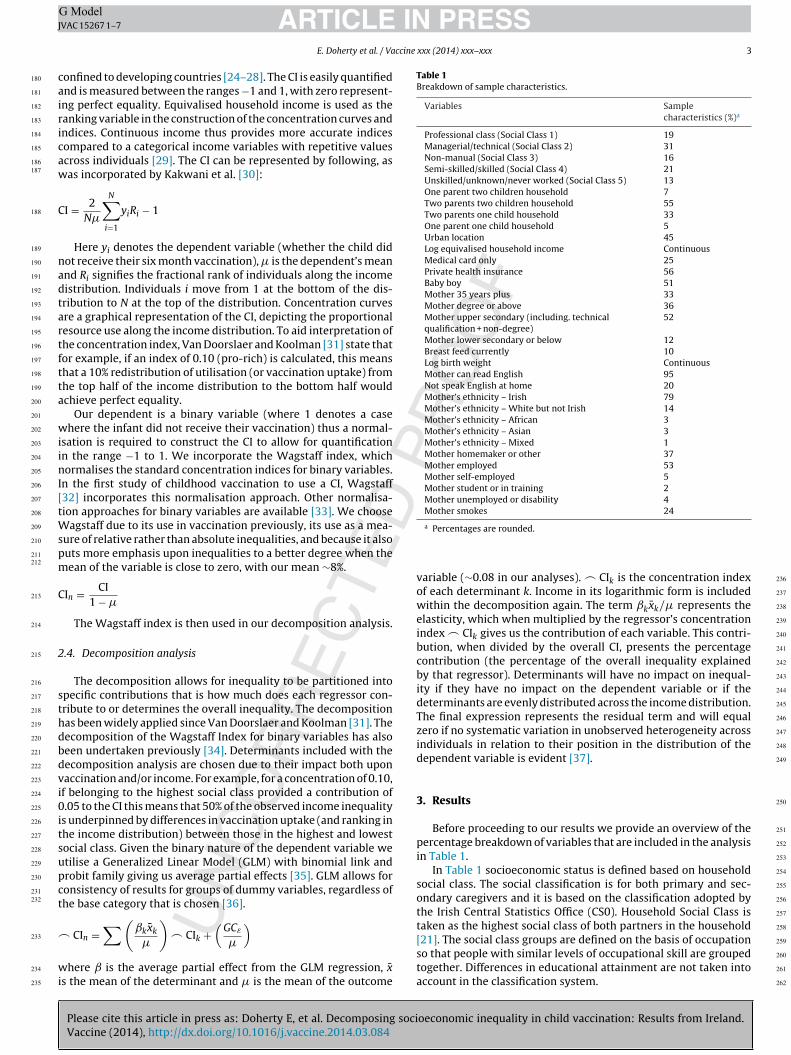
Professional class (Social Class 1) 19Managerial/technical (Social Class 2) 31Non-manual (Social Class 3) 16Semi-skilled/skilled (Social Class 4) 21Unskilled/unknown/never worked (Social Class 5) 13One parent two children household 7Two parents two children household 55Two parents one child household 33One parent one child household 5Urban location 45Log equivalised household income ContinuousMedical card only 25Private health insurance 56Baby boy 51Mother 35 years plus 33Mother degree or above 36Mother upper secondary (including. technicalqualification + non-degree)
52
Mother lower secondary or below 12Breast feed currently 10Log birth weight ContinuousMother can read English 95Not speak English at home 20Mother’s ethnicity – Irish 79Mother’s ethnicity – White but not Irish 14Mother’s ethnicity – African 3Mother’s ethnicity – Asian 3Mother’s ethnicity – Mixed 1Mother homemaker or other 37Mother employed 53Mother self-employed 5Mother student or in training 2Mother unemployed or disability 4Mother smokes 24
180
181
182
183
184
185
186187
188
189
190
191
192
193
194
195
196
197
198
199
200
201
202
203
204
205
206
207
208
209
210
211212
213
214
215
216
217
218
219
220
221
222
223
224
225
226
227
228
229
230
231232
233
234
235
236
237
238
239
240
241
242
243
244
245
246
247
248
249
250
251
252
253
254
255
256
257
258
ARTICLEVAC 15267 1–7
E. Doherty et al. / Va
onfined to developing countries [24–28]. The CI is easily quantifiednd is measured between the ranges −1 and 1, with zero represent-ng perfect equality. Equivalised household income is used as theanking variable in the construction of the concentration curves andndices. Continuous income thus provides more accurate indicesompared to a categorical income variables with repetitive valuescross individuals [29]. The CI can be represented by following, asas incorporated by Kakwani et al. [30]:
I = 2N�
N∑i=1
yiRi − 1
Here yi denotes the dependent variable (whether the child didot receive their six month vaccination), � is the dependent’s meannd Ri signifies the fractional rank of individuals along the incomeistribution. Individuals i move from 1 at the bottom of the dis-ribution to N at the top of the distribution. Concentration curvesre a graphical representation of the CI, depicting the proportionalesource use along the income distribution. To aid interpretation ofhe concentration index, Van Doorslaer and Koolman [31] state thator example, if an index of 0.10 (pro-rich) is calculated, this meanshat a 10% redistribution of utilisation (or vaccination uptake) fromhe top half of the income distribution to the bottom half wouldchieve perfect equality.
Our dependent is a binary variable (where 1 denotes a casehere the infant did not receive their vaccination) thus a normal-
sation is required to construct the CI to allow for quantificationn the range −1 to 1. We incorporate the Wagstaff index, whichormalises the standard concentration indices for binary variables.
n the first study of childhood vaccination to use a CI, Wagstaff32] incorporates this normalisation approach. Other normalisa-ion approaches for binary variables are available [33]. We choose
agstaff due to its use in vaccination previously, its use as a mea-ure of relative rather than absolute inequalities, and because it alsouts more emphasis upon inequalities to a better degree when theean of the variable is close to zero, with our mean ∼8%.
In = CI1 − �
The Wagstaff index is then used in our decomposition analysis.
.4. Decomposition analysis
The decomposition allows for inequality to be partitioned intopecific contributions that is how much does each regressor con-ribute to or determines the overall inequality. The decompositionas been widely applied since Van Doorslaer and Koolman [31]. Theecomposition of the Wagstaff Index for binary variables has alsoeen undertaken previously [34]. Determinants included with theecomposition analysis are chosen due to their impact both uponaccination and/or income. For example, for a concentration of 0.10,f belonging to the highest social class provided a contribution of.05 to the CI this means that 50% of the observed income inequality
s underpinned by differences in vaccination uptake (and ranking inhe income distribution) between those in the highest and lowestocial class. Given the binary nature of the dependent variable wetilise a Generalized Linear Model (GLM) with binomial link androbit family giving us average partial effects [35]. GLM allows foronsistency of results for groups of dummy variables, regardless ofhe base category that is chosen [36].
∑(ˇkx̄k
) (GCε
)
Please cite this article in press as: Doherty E, et al. Decomposing sociVaccine (2014), http://dx.doi.org/10.1016/j.vaccine.2014.03.084
CIn =�
� CIk +�
here ̌ is the average partial effect from the GLM regression, x̄s the mean of the determinant and � is the mean of the outcome
259
a Percentages are rounded.
variable (∼0.08 in our analyses). � CIk is the concentration indexof each determinant k. Income in its logarithmic form is includedwithin the decomposition again. The term ˇkx̄k/� represents theelasticity, which when multiplied by the regressor’s concentrationindex � CIk gives us the contribution of each variable. This contri-bution, when divided by the overall CI, presents the percentagecontribution (the percentage of the overall inequality explainedby that regressor). Determinants will have no impact on inequal-ity if they have no impact on the dependent variable or if thedeterminants are evenly distributed across the income distribution.The final expression represents the residual term and will equalzero if no systematic variation in unobserved heterogeneity acrossindividuals in relation to their position in the distribution of thedependent variable is evident [37].
3. Results
Before proceeding to our results we provide an overview of thepercentage breakdown of variables that are included in the analysisin Table 1.
In Table 1 socioeconomic status is defined based on householdsocial class. The social classification is for both primary and sec-ondary caregivers and it is based on the classification adopted bythe Irish Central Statistics Office (CS0). Household Social Class istaken as the highest social class of both partners in the household[21]. The social class groups are defined on the basis of occupation
oeconomic inequality in child vaccination: Results from Ireland.
so that people with similar levels of occupational skill are groupedtogether. Differences in educational attainment are not taken intoaccount in the classification system.
260
261
262
ARTICLE IN PRESSG ModelJVAC 15267 1–7
4 E. Doherty et al. / Vaccine xxx (2014) xxx–xxx
Table 2Multivariate analysis of determinants of infant six month non-vaccination.Q5
Variables Odds ratio P-value 95% Confidenceinterval
Professional class (Social Class 1) Base categoryManagerial/technical (Social Class 2) 1.377 0.026 1.039 1.824Non-manual (Social Class 3) 1.237 0.236 0.870 1.757Semi-skilled/skilled (Social Class 4) 1.310 0.128 0.926 1.855Unskilled/unknown/never worked (Social Class 5) 1.612 0.056 0.988 2.632One parent two children household Base categoryTwo parents two children household 0.908 0.634 0.610 1.352Two parents one child household 0.291 0.000 0.182 0.463One parent one child household 0.383 0.000 0.226 0.647Urban location 0.979 0.823 0.814 1.178Log equivalised household income 0.853 0.116 0.699 1.040Uninsured Base categoryMedical card 0.934 0.640 0.701 1.245Private health insurance 0.671 0.002 0.525 0.859Baby boy 1.085 0.365 0.909 1.296Mother aged 35 plus 1.063 0.529 0.880 1.283Mother degree or above Base categoryMother upper secondary 0.960 0.724 0.766 1.204Mother lower secondary or below 1.010 0.955 0.727 1.401Breast feed currently 1.951 0.000 1.470 2.590Log birth weight 0.687 0.150 0.413 1.145Mother can read English 0.916 0.75 0.538 1.561Not speak English at home 0.889 0.58 0.585 1.350Mother’s ethnicity – Irish Base categoryMother’s ethnicity – White but not Irish 0.773 0.246 0.500 1.195Mother’s ethnicity – African 0.331 0.010 0.143 0.766Mother’s ethnicity – Asian 0.322 0.024 0.121 0.860Mother’s ethnicity – Mixed 0.915 0.884 0.276 3.032Mother homemaker or other Base categoryMother employed 0.852 0.180 0.674 1.077Mother self-employed 2.091 0.000 1.469 2.976Mother student or in training 1.105 0.767 0.571 2.141Mother unemployed or disability 0.511 0.023 0.286 0.913Mother smokes 1.526 0.000 1.247 1.867
)
P
dI
dppenlimiticabtoccii
iwshn
autocorrelation). The results show that significant inequalities areobserved. In particular the interpretation of our results, using VanDoorslaer and Koolman explanation [31], suggests that a redistribu-tion of ∼19% of vaccination from the richest half of the distribution
263
264
265
266
267
268
269
270
271
272
273
274
275
276
277
278
279
280
281
282
283
284
285
286
287
288
289
290
291
292
293
294
295
296
297
298
299
300
301
302
303
Sample size (N = 9851
-values indicate statistical significance.
Table 2 presents odds ratios from a logit model exploring theeterminants of the non-uptake of the six month vaccination in
reland.Results from Table 2 highlight a number of significant pre-
ictors of the non-uptake of infant vaccination at six months. Inarticular, household structure-relative to belonging to a singlearent household with two or more children, health insurance,quivalised income, having a mother who is of Asian or African eth-icity or having a mother who is unemployed or on disability (10%
evel) is associated with a greater likelihood of an infant receiv-ng their vaccination. On the other hand, having a self-employed
other, a mother who smokes or currently breast feeds signif-cantly increases the probability that the infant did not receiveheir vaccination. While in separate univariate analyses, variablesncluding household social class (all categories) and maternal edu-ation were significant, they do not remain so in the multivariatenalysis shown in Table 2. This is likely because of collinearityetween variables such as household social class, maternal educa-ion and household income. Despite this, we felt that the inclusionf all these variables in the multivariate model was important toapture the full effect associated with socioeconomic status on vac-ination uptake. Other variables, such as the child’s gender, livingn an urban location, mother’s English literacy levels are not signif-cant in either the multivariate or univariate analyses.
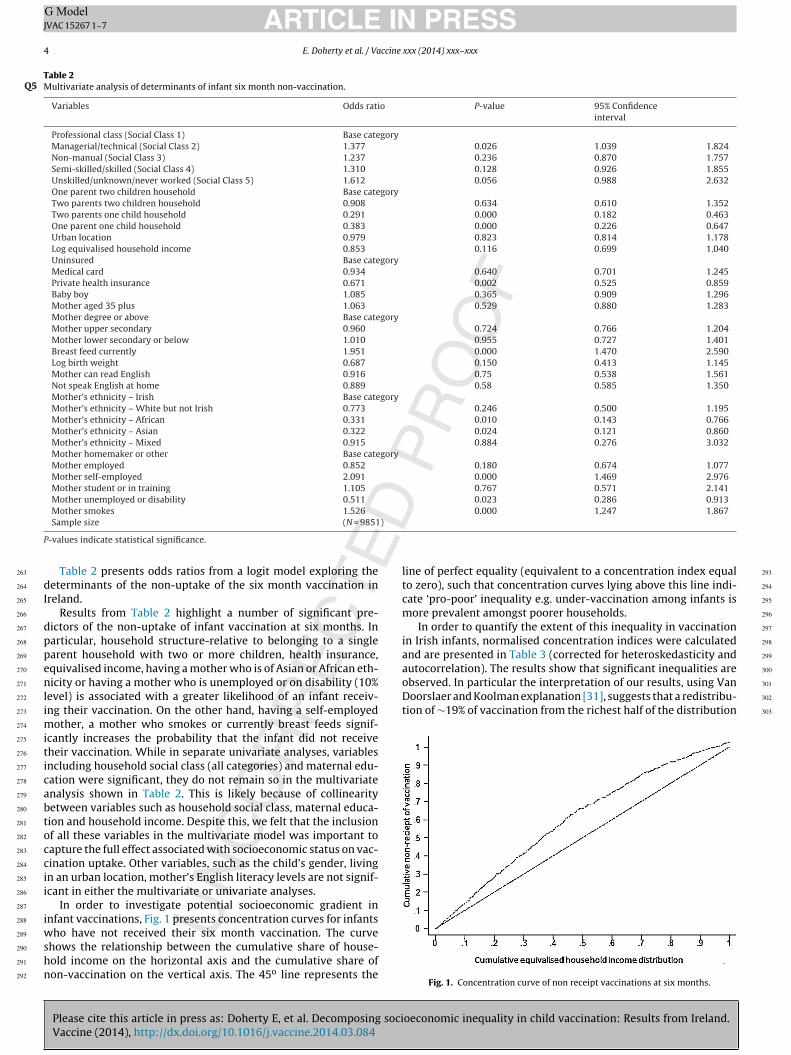
In order to investigate potential socioeconomic gradient innfant vaccinations, Fig. 1 presents concentration curves for infants
Please cite this article in press as: Doherty E, et al. Decomposing sociVaccine (2014), http://dx.doi.org/10.1016/j.vaccine.2014.03.084
ho have not received their six month vaccination. The curvehows the relationship between the cumulative share of house-old income on the horizontal axis and the cumulative share ofon-vaccination on the vertical axis. The 45o line represents the
line of perfect equality (equivalent to a concentration index equalto zero), such that concentration curves lying above this line indi-cate ‘pro-poor’ inequality e.g. under-vaccination among infants ismore prevalent amongst poorer households.
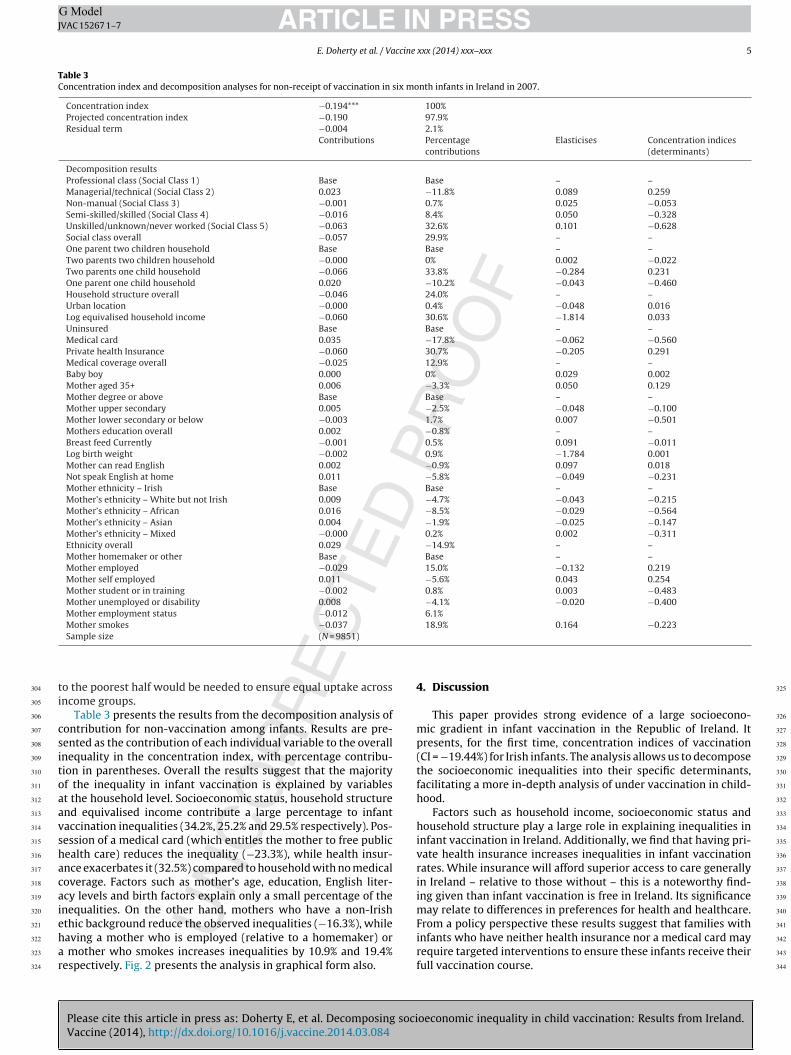
In order to quantify the extent of this inequality in vaccinationin Irish infants, normalised concentration indices were calculatedand are presented in Table 3 (corrected for heteroskedasticity and
oeconomic inequality in child vaccination: Results from Ireland.
Fig. 1. Concentration curve of non receipt vaccinations at six months.
ARTICLE IN PRESSG ModelJVAC 15267 1–7
E. Doherty et al. / Vaccine xxx (2014) xxx–xxx 5
Table 3Concentration index and decomposition analyses for non-receipt of vaccination in six month infants in Ireland in 2007.
Concentration index −0.194*** 100%Projected concentration index −0.190 97.9%Residual term −0.004 2.1%
Contributions Percentagecontributions
Elasticises Concentration indices(determinants)
Decomposition resultsProfessional class (Social Class 1) Base Base – –Managerial/technical (Social Class 2) 0.023 −11.8% 0.089 0.259Non-manual (Social Class 3) −0.001 0.7% 0.025 −0.053Semi-skilled/skilled (Social Class 4) −0.016 8.4% 0.050 −0.328Unskilled/unknown/never worked (Social Class 5) −0.063 32.6% 0.101 −0.628Social class overall −0.057 29.9% – –One parent two children household Base Base – –Two parents two children household −0.000 0% 0.002 −0.022Two parents one child household −0.066 33.8% −0.284 0.231One parent one child household 0.020 −10.2% −0.043 −0.460Household structure overall −0.046 24.0% – –Urban location −0.000 0.4% −0.048 0.016Log equivalised household income −0.060 30.6% −1.814 0.033Uninsured Base Base – –Medical card 0.035 −17.8% −0.062 −0.560Private health Insurance −0.060 30.7% −0.205 0.291Medical coverage overall −0.025 12.9% – –Baby boy 0.000 0% 0.029 0.002Mother aged 35+ 0.006 −3.3% 0.050 0.129Mother degree or above Base Base – –Mother upper secondary 0.005 −2.5% −0.048 −0.100Mother lower secondary or below −0.003 1.7% 0.007 −0.501Mothers education overall 0.002 −0.8% – –Breast feed Currently −0.001 0.5% 0.091 −0.011Log birth weight −0.002 0.9% −1.784 0.001Mother can read English 0.002 −0.9% 0.097 0.018Not speak English at home 0.011 −5.8% −0.049 −0.231Mother ethnicity – Irish Base Base – –Mother’s ethnicity – White but not Irish 0.009 −4.7% −0.043 −0.215Mother’s ethnicity – African 0.016 −8.5% −0.029 −0.564Mother’s ethnicity – Asian 0.004 −1.9% −0.025 −0.147Mother’s ethnicity – Mixed −0.000 0.2% 0.002 −0.311Ethnicity overall 0.029 −14.9% – –Mother homemaker or other Base Base – –Mother employed −0.029 15.0% −0.132 0.219Mother self employed 0.011 −5.6% 0.043 0.254Mother student or in training −0.002 0.8% 0.003 −0.483Mother unemployed or disability 0.008 −4.1% −0.020 −0.400Mother employment status −0.012 6.1%Mother smokes −0.037 18.9% 0.164 −0.223
ti
csitoaavshacaiehar
304
305
306
307
308
309
310
311
312
313
314
315
316
317
318
319
320
321
322
323
324
325
326
327
328
329
330
331
332
333
334
335
336
337
338
339
340
341
Sample size (N = 9851)
o the poorest half would be needed to ensure equal uptake acrossncome groups.
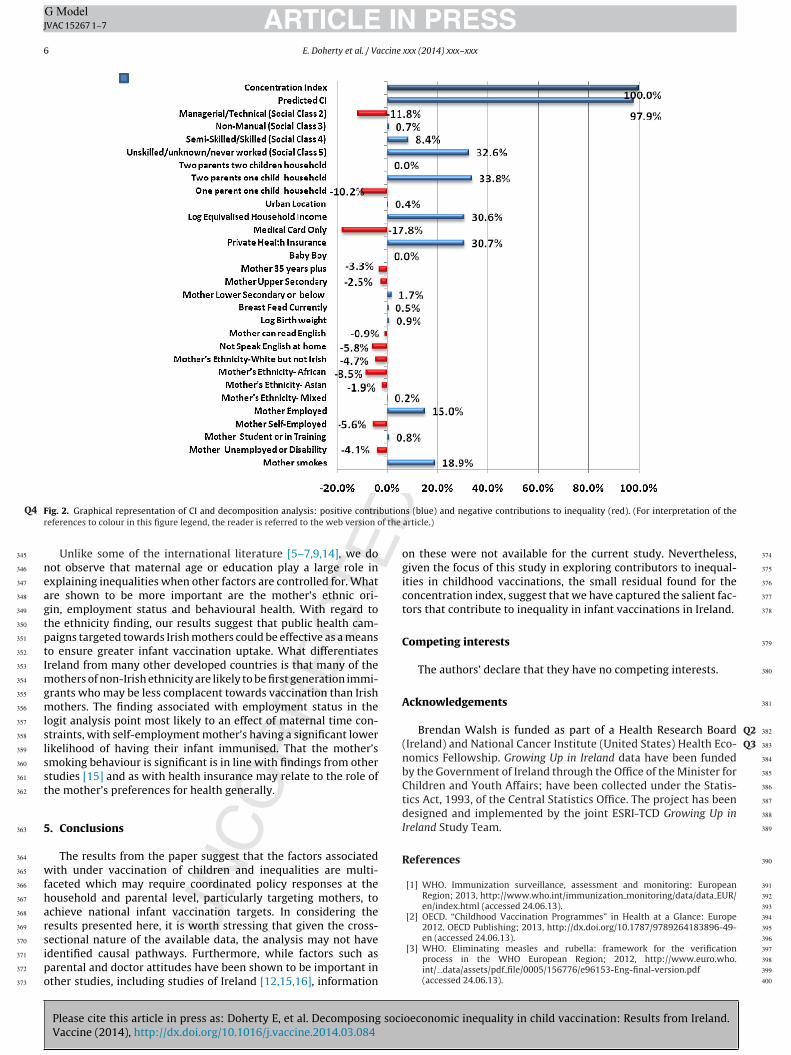
Table 3 presents the results from the decomposition analysis ofontribution for non-vaccination among infants. Results are pre-ented as the contribution of each individual variable to the overallnequality in the concentration index, with percentage contribu-ion in parentheses. Overall the results suggest that the majorityf the inequality in infant vaccination is explained by variablest the household level. Socioeconomic status, household structurend equivalised income contribute a large percentage to infantaccination inequalities (34.2%, 25.2% and 29.5% respectively). Pos-ession of a medical card (which entitles the mother to free publicealth care) reduces the inequality (−23.3%), while health insur-nce exacerbates it (32.5%) compared to household with no medicaloverage. Factors such as mother’s age, education, English liter-cy levels and birth factors explain only a small percentage of thenequalities. On the other hand, mothers who have a non-Irishthic background reduce the observed inequalities (−16.3%), while
Please cite this article in press as: Doherty E, et al. Decomposing sociVaccine (2014), http://dx.doi.org/10.1016/j.vaccine.2014.03.084
aving a mother who is employed (relative to a homemaker) or mother who smokes increases inequalities by 10.9% and 19.4%espectively. Fig. 2 presents the analysis in graphical form also.
4. Discussion
This paper provides strong evidence of a large socioecono-mic gradient in infant vaccination in the Republic of Ireland. Itpresents, for the first time, concentration indices of vaccination(CI = −19.44%) for Irish infants. The analysis allows us to decomposethe socioeconomic inequalities into their specific determinants,facilitating a more in-depth analysis of under vaccination in child-hood.
Factors such as household income, socioeconomic status andhousehold structure play a large role in explaining inequalities ininfant vaccination in Ireland. Additionally, we find that having pri-vate health insurance increases inequalities in infant vaccinationrates. While insurance will afford superior access to care generallyin Ireland – relative to those without – this is a noteworthy find-ing given than infant vaccination is free in Ireland. Its significancemay relate to differences in preferences for health and healthcare.From a policy perspective these results suggest that families with
oeconomic inequality in child vaccination: Results from Ireland.
infants who have neither health insurance nor a medical card mayrequire targeted interventions to ensure these infants receive theirfull vaccination course.
342
343
344
ARTICLE IN PRESSG ModelJVAC 15267 1–7
6 E. Doherty et al. / Vaccine xxx (2014) xxx–xxx
F butionQ4r f the
neagtptImgmlslsst
5
wfharsipo
Q2Q3
345
346
347
348
349
350
351
352
353
354
355
356
357
358
359
360
361
362
363
364
365
366
367
368
369
370
371
372
373
374
375
376
377
378
379
380
381
382
383
384
385
386
387
388
389
390
391
392
393
394
395
ig. 2. Graphical representation of CI and decomposition analysis: positive contrieferences to colour in this figure legend, the reader is referred to the web version o
Unlike some of the international literature [5–7,9,14], we doot observe that maternal age or education play a large role inxplaining inequalities when other factors are controlled for. Whatre shown to be more important are the mother’s ethnic ori-in, employment status and behavioural health. With regard tohe ethnicity finding, our results suggest that public health cam-aigns targeted towards Irish mothers could be effective as a meanso ensure greater infant vaccination uptake. What differentiatesreland from many other developed countries is that many of the
others of non-Irish ethnicity are likely to be first generation immi-rants who may be less complacent towards vaccination than Irishothers. The finding associated with employment status in the
ogit analysis point most likely to an effect of maternal time con-traints, with self-employment mother’s having a significant lowerikelihood of having their infant immunised. That the mother’smoking behaviour is significant is in line with findings from othertudies [15] and as with health insurance may relate to the role ofhe mother’s preferences for health generally.
. Conclusions
The results from the paper suggest that the factors associatedith under vaccination of children and inequalities are multi-
aceted which may require coordinated policy responses at theousehold and parental level, particularly targeting mothers, tochieve national infant vaccination targets. In considering theesults presented here, it is worth stressing that given the cross-
Please cite this article in press as: Doherty E, et al. Decomposing sociVaccine (2014), http://dx.doi.org/10.1016/j.vaccine.2014.03.084
ectional nature of the available data, the analysis may not havedentified causal pathways. Furthermore, while factors such asarental and doctor attitudes have been shown to be important inther studies, including studies of Ireland [12,15,16], information
s (blue) and negative contributions to inequality (red). (For interpretation of thearticle.)
on these were not available for the current study. Nevertheless,given the focus of this study in exploring contributors to inequal-ities in childhood vaccinations, the small residual found for theconcentration index, suggest that we have captured the salient fac-tors that contribute to inequality in infant vaccinations in Ireland.
Competing interests
The authors’ declare that they have no competing interests.
Acknowledgements
Brendan Walsh is funded as part of a Health Research Board
(Ireland) and National Cancer Institute (United States) Health Eco-
nomics Fellowship. Growing Up in Ireland data have been fundedby the Government of Ireland through the Office of the Minister forChildren and Youth Affairs; have been collected under the Statis-tics Act, 1993, of the Central Statistics Office. The project has beendesigned and implemented by the joint ESRI-TCD Growing Up inIreland Study Team.
References
[1] WHO. Immunization surveillance, assessment and monitoring: EuropeanRegion; 2013, http://www.who.int/immunization monitoring/data/data EUR/en/index.html (accessed 24.06.13).
[2] OECD. “Childhood Vaccination Programmes” in Health at a Glance: Europe2012. OECD Publishing; 2013, http://dx.doi.org/10.1787/9789264183896-49-
oeconomic inequality in child vaccination: Results from Ireland.
en (accessed 24.06.13).[3] WHO. Eliminating measles and rubella: framework for the verification
process in the WHO European Region; 2012, http://www.euro.who.int/ data/assets/pdf file/0005/156776/e96153-Eng-final-version.pdf(accessed 24.06.13).
396
397
398
399
400
ING ModelJ
ccine
[
[
[
[
[
[
[
[
[
[[
[
[
[
[
[
[
[
[
[
[
[
[
[
[
[
[
401
402
403
404
405
406
407
408
409
410
411
412
413
414
415
416
417
418
419
420
421
422
423
424
425
426
427
428
429
430
431
432
433
434
435
436
437
438
439
440
441
442
443
444
445
446
447
448
449
450
451
452
453
454
455
456
457
458
459
460
461
462
463
464
465
466
467
468
469
470
471
472
473
474
475
476
477
478
479
480
481
482
ARTICLEVAC 15267 1–7
E. Doherty et al. / Va
[4] Bates AS, Wolinsky FD. Personal, financial, and structural barriers toimmunization in socioeconomically disadvantaged urban children. Pediatrics1998;101:591–6.
[5] Luman ET, McCauley MM, Shefer A, Chu SY. Maternal characteristics associatedwith vaccination of young children. Pediatrics 2003;111:1215–8.
[6] Bobo JK, Gale JL, Thapa PB, Wassilak SG. Risk factors for delayed immunizationin a random sample of 1163 children from Oregon and Washington. Pediatrics1993;91:308–14.
[7] Theeten H, Hens N, Vandermeulen C, et al. Infant vaccination coverage in 2005and predictive factors for complete or valid vaccination in Flanders, Belgium:an EPI-survey. Vaccine 2007;25:4940–8.
[8] Fiks AG, Alessandrini EA, Luberti AA, et al. Identifying factors predicting immu-nization delay for children followed in an urban primary care network usingan electronic health record. Pediatrics 2006;118:e1680–6.
[9] Miller LA, Hoffman RE, Barón AE, et al. Risk factors for delayed immuniza-tion against measles, mumps, and rubella in Colorado two year-olds. Pediatrics1994;94:213–9.
10] Allred NJ, Wooten KG, Kong Y. The association of health insurance and con-tinuous primary care in the medical home on vaccination coverage for 19- to35-month-old children. Pediatrics 2007;119(Suppl 1):S4–11.
11] Danis K, Georgakopoulou T, Stavrou T, et al. Socioeconomic factors play a moreimportant role in childhood vaccination coverage than parental perceptions: across-sectional study in Greece. Vaccine 2010;28:1861–9.
12] Santoli JM, Huet NJ, Smith PJ, et al. Insurance status and vaccination coverageamong US preschool children. Pediatrics 2004;113(Suppl):1959–64.
13] Samad L, Tate AR, Dezateux C, et al. Differences in risk factors for partialand no vaccination in the first year of life: prospective cohort study. BMJ2006;332:1312–3.
14] Swennen B, Van Damme P, Vellinga A, et al. Analysis of factors influencingvaccine uptake: perspectives from Belgium. Vaccine 2001;20:S5.
15] Jessop LJ, Murrin C, Lotya J, et al. Socio-demographic and health-related predic-tors of uptake of first MMR vaccination in the Lifeway’s Cohort Study. Vaccine2010;28:6338–43.
16] Harrington PM, Woodman C, Shannon WF. Low vaccination uptake: is the pro-cess the problem? J Epidemiol Commun Health 2000;54:394–400.
17] McGrail KM, Doorslaer EKA, van Ross NA, Sanmartin C. Income-related healthinequalities in Canada and the United States: a decomposition analysis. AM JPublic Health 2009;99:1856–63.
18] Nedjat S, Hosseinpoor AR, Forouzanfar MH, et al. Decomposing socioecono-
Please cite this article in press as: Doherty E, et al. Decomposing sociVaccine (2014), http://dx.doi.org/10.1016/j.vaccine.2014.03.084
mic inequality in self-rated health in Tehran. J Epidemiol Commun Health2012;66:495–500.
19] Walsh B, Cullinan J.Decomposing inequalities in childhood obesity. 2012.20] Greene S, Williams J, Layte R, et al.Growing Up in Ireland: National Longitudinal
Study of Children: Background and conceptual framework 2010. 2010.
[
PRESSxxx (2014) xxx–xxx 7
21] Quail A, Williams J, McCrory R, et al.A Summary Guide to Wave 1 of the InfantCohort (at 9 months) of Growing Up in Ireland 2011. 2011.
22] HSE. Your child’s immunisation: a guide for parents 2013; 2013, http://www.immunisation.ie/en/ChildhoodImmunisation/PrimaryImmunisationSchedule/#d.en.15392 (accessed 12.08.13).
23] Wagstaff A, Paci P, van Doorslaer E. On the measurement of inequalities inhealth. Soc Sci Med 1991;33:545–57.
24] Lauridsen J, Pradhan J. Socioeconomic inequality of immunization coverage inIndia. Health Econ Rev 2011:1–11, http://dx.doi.org/10.1186/2191-1991-1-11.
25] Barros ADJ, Ronsmans C, Axelson H, et al. Equity in maternal, newborn, andchild health interventions in Countdown to 2015: a retrospective review ofsurvey data from 54 countries. Lancet 2012;379:1225–33.
26] Joe W, Mishra US, Navaneetham K. Socioeconomic inequalities in child health:recent evidence from India. Glob Public Health 2010;5:493–508.
27] Wattananon S, Tangcharoensathien V, Prakongsai P. Equity in maternal andchild health in Thailand. Bull World Health Org 2010;88:420–7.
28] Victora CG, Fenn B, Bryce J, Kirkwood BR. Co-coverage of preventive inter-ventions and implications for child-survival strategies: evidence from nationalsurveys. Lancet 2005;366:1460–6.
29] Chen Z, Roy K. Calculating concentration index with repetitive values of indi-cators of economic welfare. J Health Econ 2009;28:169–75.
30] Kakwani N, Wagstaff A, Van Doorlsaer E. Socioeconomic inequalities inhealth: measurement, computation and statistical inference. J Econometrics1997;77:87–104.
31] Van Doorslaer E, Koolman X. Exploring the differences in income-related healthinequalities across European countries. Health Econ 2004;13:609–28.
32] Wagstaff A. The bounds of the concentration index when the variable of inter-est is binary, with an application to immunization inequality. Health Econ2005;14:429–32.
33] Erreygers G, Van Ourti T. Measuring socioeconomic inequality in health, healthcare and health financing by means of rank-dependent indices: a recipe forgood practice. J Health Econ 2011;30:685–94.
34] Walsh B, Silles M, O’Neill C. The role of private medical insurance in socio-economic inequalities in cancer screening uptake in Ireland. Health Econ2012;21:1250–6.
35] Van Doorslaer E, Wagstaff A, Bleichrodt H, et al. Income-related inequal-ities in health: some international comparisons. J Health Econ 1997;16:93–112.
36] Yiengprugsawan V, Lim LL, Carmichael G, et al. Decomposing socioeconomic
oeconomic inequality in child vaccination: Results from Ireland.
inequality for binary health outcomes: an improved estimation that does notvary by choice of reference group. BMC Res Notes 2007;3:57.
37] Jones AM, Lopez-Nicolas A. Measurement and explanation of socioeco-nomic inequality in health with longitudinal data. Health Econ 2004;13:1015–30.
483
484
485
486
487