decreased stage migration rate of early gastric …...computed tomography decreased stage migration...
TRANSCRIPT
COMPUTED TOMOGRAPHY
Decreased stage migration rate of early gastric cancer with a newreconstruction algorithm using dual-energy CT images:a preliminary study
Cen Shi1,2 & Huan Zhang1 & Jing Yan3& Baisong Wang4 & Lianjun Du1
&
Zilai Pan1& Fuhua Yan1
Received: 9 November 2015 /Revised: 31 March 2016 /Accepted: 23 May 2016 /Published online: 8 June 2016# The Author(s) 2016. This article is published with open access at Springerlink.com
AbstractObjectives To evaluate the potential value of advancedmonoenergetic images (AMEIs) on early gastric cancer(EGC) using dual-energy CT (DECT).Methods 31 EGC patients (19 men, 12 women; age range,38–81 years; mean age, 57.19 years) were retrospectively en-rolled in this study. Conventionally reconstructedpolyenergetic images (PEIs) at 120 kV and virtualmonoenergetic images (MEIs) and AMEIs at six differentkiloelectron volt (keV) levels (from 40 to 90 keV) were eval-uated from the 100 and Sn 140 kV dual energy image data,respectively. The visibility and stage migration of EGC for allthree image data sets were evaluated and statistically ana-lyzed. The objective and subjective image qualities were alsoevaluated.Results AMEIs at 40 keV showed the best visibility (80.7 %)and the lowest stage migration (35.5 %) for EGC. The stagemigration for AMEIs at 40 keV was significantly lower thanthat for PEIs (p=0.026). AMEIs at 40 keV had statistically
higher CNR in the arterial and portal phases, gastric-specific diagnostic performance and visual sharpnesscompared with other AMEIs, MEIs and PEIs (allp< 0.05).Conclusions AMEIs at 40 keV with MPR increase the CNRof EGC and thus potentially lower the stage migration ofEGC.Key Points• AMEIs benefits from the recombination of low-keV imagesand medium energies.
• AMEIs could receive better CNR results than MEIs.• AMEIs at 40 keV potentially lower the stage migration ofEGC.
Keywords Early gastric cancer . Dual-energy ComputedTomography .Monoenergetic images . Advancedmonoenergetic images . Polyenergetic images
AbbreviationsEGC Early gastric cancerMPR Multiplanar reconstruction2D Two-dimensional3D Three-dimensionalkV KilovoltagekeV Kiloelectron voltPEIs Polyenergetic imagesMEIs Monoenergetic imagesAMEIs Advanced monoenergetic imagesAP Arterial phasePP Portal venous phaseDEP Delayed phase
Electronic supplementary material The online version of this article(doi:10.1007/s00330-016-4442-z) contains supplementary material,which is available to authorized users.
* Huan [email protected]
1 Department of Radiology, Ruijin Hospital, Shanghai Jiao TongUniversity School of Medicine, No.197, Ruijin 2nd Road,Shanghai 200025, China
2 Department of Radiology, the First Affiliated Hospital of SoochowUniversity, 188 Shizi Road, Suzhou 215006, China
3 Siemens Medical System, Shanghai 201318, China4 Department of biological statistics, Shanghai Jiao Tong University
School of Medicine, Shanghai 200025, China
Eur Radiol (2017) 27:671–680DOI 10.1007/s00330-016-4442-z
Introduction
In clinical, therapeutic approach decisions depend on accuratepreoperative staging. Early gastric cancer (EGC) can be treat-ed with more limited surgeries, such as endoscopic mucosalresection (EMR) and laparoscopic surgery [1–3]. Preoperativechemotherapy or radiation therapy is usually recommendedfor advanced gastric cancer (AGC) to downstage the tumourand increase the chance for curative resection [4]. Currently,two-dimensional (2D) multi-detector computed tomography(MDCT) imaging using multiplanar reconstruction (MPR)has been widely used for the preoperative staging of gastriccancer because of the ability to detect the depth of tumourinvasion and the presence or absence of metastasis [5–8].However, its detection rates of EGC are unsatisfactory. Forexample, Makino et al. reported a detection rate of only19 % using MDCTwith MPR [6].
In the evaluation of EGC, the use of various three-dimensional (3D) reconstruction techniques, such as virtualgastroscopy, has led to improved diagnostic performancecompared with conventional 2D imaging [9–13].Nevertheless, one main disadvantage of 3D techniques ishow time consuming they are. Although greater computerprocessing power makes more rapid reconstructions possible,the entire procedure takes approximately 20–30 minutes perpatient [10]. Compared with 3D technologies, 2D imaging ismore straightforward.
Dual-energy CT (DECT) can provide material decomposi-tion information, especially iodine concentrations whichcould be used to analyse tumour perfusion and detect smalliodine content lesions [14, 15]. DECTcan also create Bvirtual^monochromatic images at a range of keV. Most previous stud-ies have focused on CT angiography, which is significantlyaffected by the lower keV required to obtain image qualitieswith acceptable CNR and signal-to-noise ratio (SNR) or loweramount of contrast medium [16–18]. Few studies have inves-tigated the effect of lower keVon tissue applications, particu-larly in hollow viscera, such as the stomach, because the en-hancement on their walls is less concentrated than that ob-served in solid organ (e.g., liver). In addition, because theimage noise usually increases even more than the iodine con-trast at lower energy levels due to the absorption of lower-energy photons, the CNR might decrease at low keV. Thus,few applications employ lower keV (e.g., 40 keVor 50 keV)while simultaneously obtaining higher contrast and lowernoise [19, 20].
A new prototype algorithm has been developed to calculateadvanced monoenergetic images (AMEIs) (Dual energyMono+, syngo IPIPE, Siemens Healthcare, Forchheim,Germany). As the prototype software has not been availablefor commercial use, it has been used for research purposesonly in our institution. The purpose of this study was to ex-plore the potential value of AMEIs in EGC.
Materials and methods
Patients
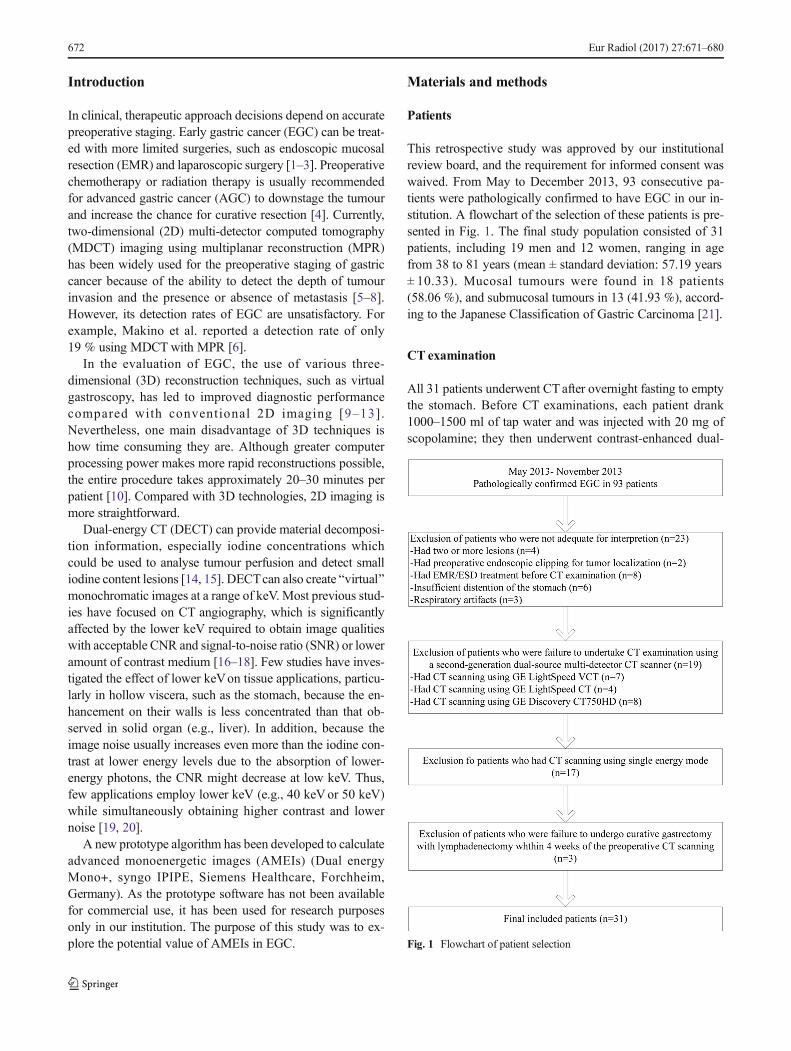
This retrospective study was approved by our institutionalreview board, and the requirement for informed consent waswaived. From May to December 2013, 93 consecutive pa-tients were pathologically confirmed to have EGC in our in-stitution. A flowchart of the selection of these patients is pre-sented in Fig. 1. The final study population consisted of 31patients, including 19 men and 12 women, ranging in agefrom 38 to 81 years (mean ± standard deviation: 57.19 years± 10.33). Mucosal tumours were found in 18 patients(58.06 %), and submucosal tumours in 13 (41.93 %), accord-ing to the Japanese Classification of Gastric Carcinoma [21].
CTexamination
All 31 patients underwent CT after overnight fasting to emptythe stomach. Before CT examinations, each patient drank1000–1500 ml of tap water and was injected with 20 mg ofscopolamine; they then underwent contrast-enhanced dual-
Fig. 1 Flowchart of patient selection
672 Eur Radiol (2017) 27:671–680
energy CT (Siemens SOMATOM Definition Flash, SiemensMedical Solutions, Forchheim, Germany). CT scans were ac-quired with the tube voltages at 100 and 140 kV with a tinfilter (i.e., 100/Sn140 kV), using reference mAs values of 230and 178, respectively. The collimator was 32×0.6 mm, andthe pitch was 0.6. All acquisitions were obtained with real-time tube current modulation (CARE Dose 4D, SiemensMedical Solutions). To estimate the time to peak enhancementof the celiac trunk, 16 ml contrast was first injected as a testbolus. Then the main bolus (1.5 ml iopromide per kilogram ofbody weight, Ultravist 370; Schering, Berlin, Germany) wasinjected at a rate of 3 ml/s. Three phasic, contrast-enhanced,dual-energy CT scans were performed on each patient, whichincluded an arterial phase (AP) (determined by the time topeak enhancement of the celiac trunk) covering the wholestomach, a portal venous phase (PP) (20 s after the AP), rang-ing from the diaphragmatic domes to the anal verge, and adelayed phase (DEP) (150 s after the administration of con-trast agents), covering the whole stomach. The mean scandelay time of AP was 15.10±6.710 seconds (range, 6–28 sec-onds after injection), and the mean scan delay time of PP was35.06±6.673 seconds (range, 26–48 seconds after injection).For radiation dose, the mean CTDvol and DLP, which in-cludes all phases, were 34.8 ± 7.1 mGy and 1080.5±336.9 mGy · cm, respectively.
The DE raw data were reconstructed using a kernel ofD30f. Three different series of images were generated:100 kV images, Sn140 kV images, and mixed 120 kV PEIs,with a linear blending technique using a slice-thickness ratioof 0.5. Low 100 kV and high Sn140 kV images were thentransferred to the workstation (Dual energy Monoenergetic,syngo MMWP, version 2008A; Siemens Healthcare,Forchheim, Germany) to generate six data sets of MEIs in10-keV intervals (40-90 keV). Low 100 kV and highSn140 kVimages were also transferred to a personal computerwith the prototype software (Dual Energy Mono+, SyngoIPIPE, Siemens Healthcare, Forchheim, Germany) to generatethe six data sets of AMEIs in Dicom format with the same keVlevels in 10 seconds for each patient in each scan phase. Then,all images were imported to the workstation and MPR imageswere also reconstructed, which were interpreted on the diag-nostic monitors by radiologists. As the prototype software hasnot been available for commercial use, it has been used forresearch purposes only in our institution.
Image analysis
All images were evaluated by two abdominal radiologists(L.J.D. and Z.L.P), both with 10 years of experience in gas-trointestinal imaging, who were completely blinded to thesurgical and histological findings (they were aware that thepatients had histologically proven gastric cancers, butcompletely blinded to lesion location, size, macroscopic
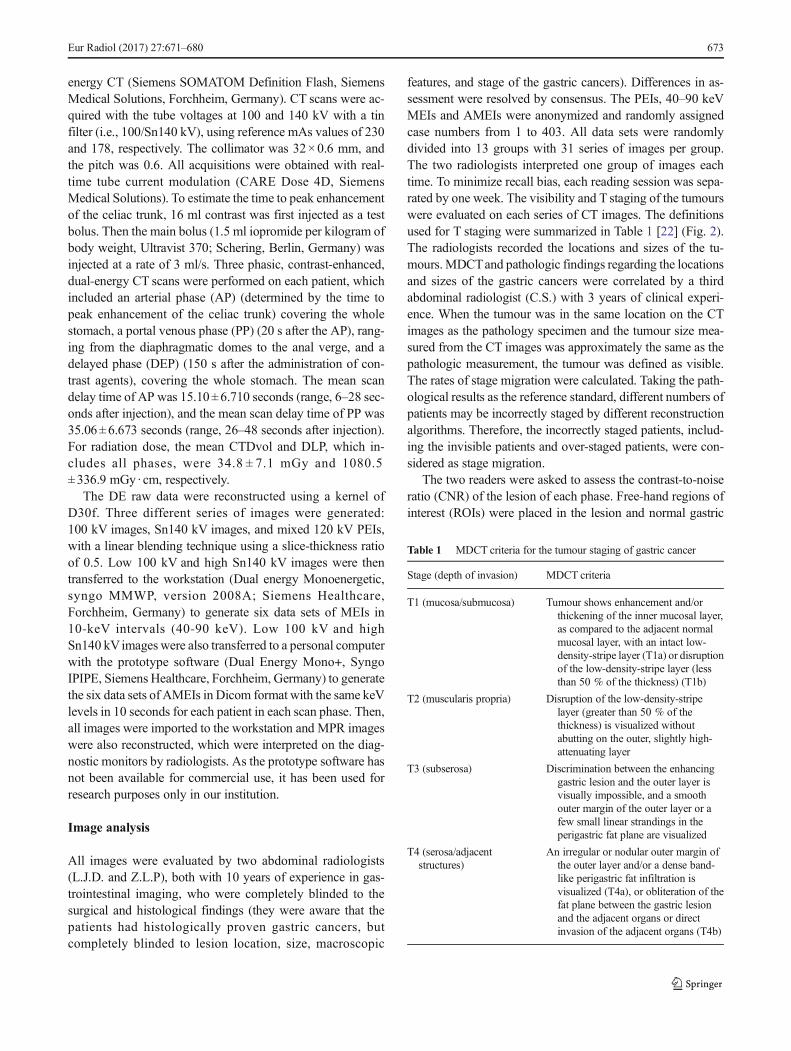
features, and stage of the gastric cancers). Differences in as-sessment were resolved by consensus. The PEIs, 40–90 keVMEIs and AMEIs were anonymized and randomly assignedcase numbers from 1 to 403. All data sets were randomlydivided into 13 groups with 31 series of images per group.The two radiologists interpreted one group of images eachtime. To minimize recall bias, each reading session was sepa-rated by one week. The visibility and T staging of the tumourswere evaluated on each series of CT images. The definitionsused for T staging were summarized in Table 1 [22] (Fig. 2).The radiologists recorded the locations and sizes of the tu-mours.MDCTand pathologic findings regarding the locationsand sizes of the gastric cancers were correlated by a thirdabdominal radiologist (C.S.) with 3 years of clinical experi-ence. When the tumour was in the same location on the CTimages as the pathology specimen and the tumour size mea-sured from the CT images was approximately the same as thepathologic measurement, the tumour was defined as visible.The rates of stage migration were calculated. Taking the path-ological results as the reference standard, different numbers ofpatients may be incorrectly staged by different reconstructionalgorithms. Therefore, the incorrectly staged patients, includ-ing the invisible patients and over-staged patients, were con-sidered as stage migration.
The two readers were asked to assess the contrast-to-noiseratio (CNR) of the lesion of each phase. Free-hand regions ofinterest (ROIs) were placed in the lesion and normal gastric
Table 1 MDCT criteria for the tumour staging of gastric cancer
Stage (depth of invasion) MDCT criteria
T1 (mucosa/submucosa) Tumour shows enhancement and/orthickening of the inner mucosal layer,as compared to the adjacent normalmucosal layer, with an intact low-density-stripe layer (T1a) or disruptionof the low-density-stripe layer (lessthan 50 % of the thickness) (T1b)
T2 (muscularis propria) Disruption of the low-density-stripelayer (greater than 50 % of thethickness) is visualized withoutabutting on the outer, slightly high-attenuating layer
T3 (subserosa) Discrimination between the enhancinggastric lesion and the outer layer isvisually impossible, and a smoothouter margin of the outer layer or afew small linear strandings in theperigastric fat plane are visualized
T4 (serosa/adjacentstructures)
An irregular or nodular outer margin ofthe outer layer and/or a dense band-like perigastric fat infiltration isvisualized (T4a), or obliteration of thefat plane between the gastric lesionand the adjacent organs or directinvasion of the adjacent organs (T4b)
Eur Radiol (2017) 27:671–680 673
wall to measure the attenuation values in Hounsfield units(HU). When the lesion was invisible, their attenuation wasrecorded as equal to the normal gastric wall. In addition,ROIs were placed in the psoas muscle to estimate the imagenoise. Subsequently, CNR was calculated using the followingformula:
CNR ¼ HUlesion‐ HUnormalð Þ.
noisemuscle
The readers were also asked to assess gastric-specific diag-nostic confidence using a 5-point scale (1 = undiagnostic;2 =will potentially miss lesions; 3 =will likely not miss ormischaracterize lesions; 4=most likely will identify all abnor-malities; 5= can easily detect all lesions). Visual sharpnesswas graded on a 5-point scale (1 = unacceptable; 2 = poor;3=equivocal; 4=good; 5= excellent). Image noise was ratedon a 4-point scale (1= less than usual; 2 = optima [routine]noise; 3 = increased noise, does not affect interpretation;4= increased noise affecting interpretation).
Statistical analysis
Statistical analysis was performed using SPSS software (SPSSversion 16.0, SPSS, Chicago, IL, USA). Continuous variableswere expressed as the mean ± standard deviation. Ordinalvariables are reported as median (range). Comparisons of allvariables between MEIs, AMEIs and PEIs were performed.Comparisons of visibility and stage migration were performed
using the McNemar test. Differences in CNR were estimatedusing a paired t-test. In addition, a Wilcoxon signed rank testwas performed to compare gastric-specific diagnostic perfor-mance, image noise and visual sharpness. Box plots were usedto visualize means, upper and lower extremes and upper andlower quartiles of CNR. p values were adjusted using theAdaptive False Discovery Rate method (SAS, version 9.2;SAS Institute, Gary, NC) as multiple comparisons were per-formed. A two-tailed p value of less than 0.05 was consideredto indicate a statistically significant difference. To assess thedegree of observer agreement, we used weighted kappa statis-tics. We considered a k value greater than 0.81 to be represen-tative of almost perfect agreement and values of 0.61 to 0.80,0.41 to 0.60, and less than 0.41 to be representative of sub-stantial, moderate, and poor agreement, respectively.
Results
Pathology findings
EGCs can be divided into three macroscopic types [21]:I, protruding type; II, superficial type (IIa: elevated, IIb:flat, and IIc: depressed); and III, excavated type.According to the histological findings, two lesions wereclassified as protruding type, 19 lesions as superficialtype (2 as IIa, 6 as IIb and 11 as IIc), and ten lesionsas excavated type. By location, nine tumours occurred onthe body, seven on the angle, and 15 on the antrum. Themean maximum diameter of the tumours was 1.74± 1.37 cm (range, 0.6–3.0 cm).
Visibility and stage migration of the primary tumour
The visibility and stage migration values are summarizedin Table 2. Visibility was significant higher for AMEIs at40 keV (AM40 keV) compared with MEIs at 40 keV(M40 keV), 50 keV (M50 keV), and 60 keV (M60 keV)(p= 0.008, 0.008, and 0.045, respectively). There were nosignificant differences between AM40 keV and the otherMEIs and PEIs (all p > 0.05). M40 keV and M50 keVshowed significantly worse visibility than the otherMEIs or PEIs, with the exception of M60 keV. The rateof stage migration was significantly lower for AM40 keVcompared with other AMEIs, MEIs and PEIs (allp< 0.05), with the exception of AM50 keV, AM60 keVand AM70 keV (p= 0.250, 0.083 and 0.064, respectively).In addition, only AM40 keV showed a significantly lowerstage migration compared with the PEIs (p = 0.026).(Details are provided in BSupplementary Information^.)
Twenty-five lesions from 31 patients were visible onAM40 keV data sets. Of these 25 lesions, five (16.1 %)lesions showed focal enhancement in AP, and 23Fig. 2 Pictorial examples for each stage presented by CT
674 Eur Radiol (2017) 27:671–680
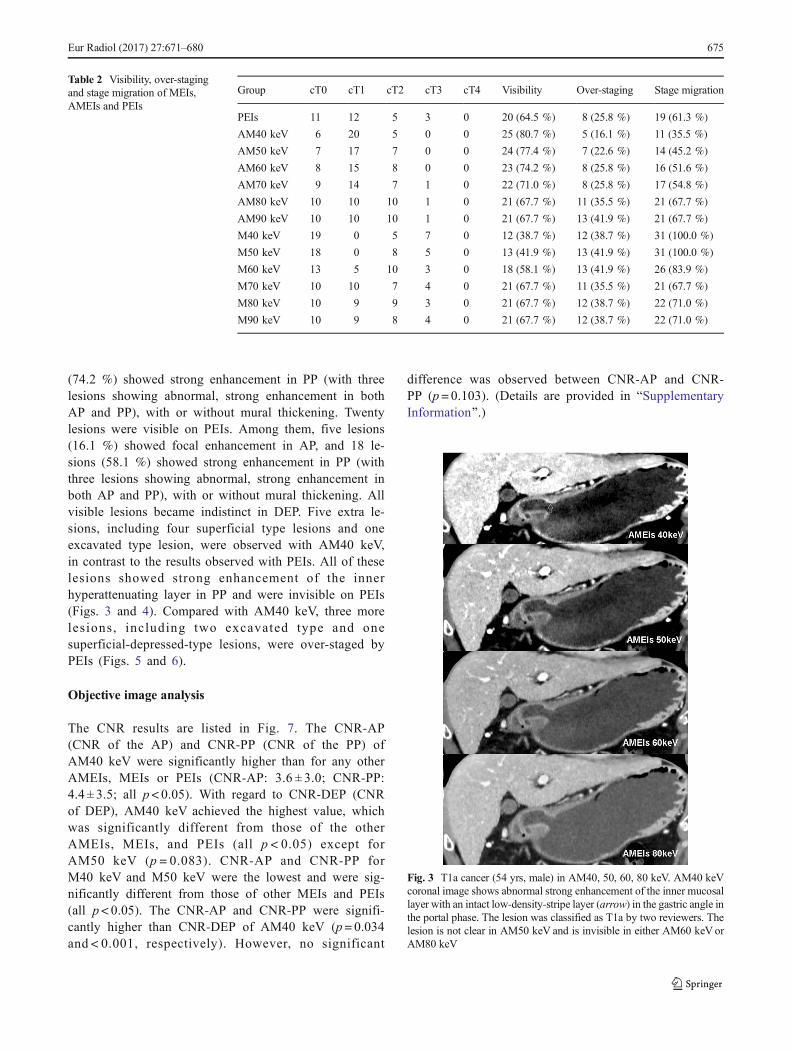
(74.2 %) showed strong enhancement in PP (with threelesions showing abnormal, strong enhancement in bothAP and PP), with or without mural thickening. Twentylesions were visible on PEIs. Among them, five lesions(16.1 %) showed focal enhancement in AP, and 18 le-sions (58.1 %) showed strong enhancement in PP (withthree lesions showing abnormal, strong enhancement inboth AP and PP), with or without mural thickening. Allvisible lesions became indistinct in DEP. Five extra le-sions, including four superficial type lesions and oneexcavated type lesion, were observed with AM40 keV,in contrast to the results observed with PEIs. All of theselesions showed strong enhancement of the innerhyperattenuating layer in PP and were invisible on PEIs(Figs. 3 and 4). Compared with AM40 keV, three morelesions, including two excavated type and onesuperficial-depressed-type lesions, were over-staged byPEIs (Figs. 5 and 6).
Objective image analysis
The CNR results are listed in Fig. 7. The CNR-AP(CNR of the AP) and CNR-PP (CNR of the PP) ofAM40 keV were significantly higher than for any otherAMEIs, MEIs or PEIs (CNR-AP: 3.6 ± 3.0; CNR-PP:4.4 ± 3.5; all p< 0.05). With regard to CNR-DEP (CNRof DEP), AM40 keV achieved the highest value, whichwas significantly different from those of the otherAMEIs, MEIs, and PEIs (all p < 0.05) except forAM50 keV (p = 0.083). CNR-AP and CNR-PP forM40 keV and M50 keV were the lowest and were sig-nificantly different from those of other MEIs and PEIs(all p< 0.05). The CNR-AP and CNR-PP were signifi-cantly higher than CNR-DEP of AM40 keV (p= 0.034and < 0.001, respectively). However, no significant
difference was observed between CNR-AP and CNR-PP (p= 0.103). (Details are provided in BSupplementaryInformation^.)
Table 2 Visibility, over-stagingand stage migration of MEIs,AMEIs and PEIs
Group cT0 cT1 cT2 cT3 cT4 Visibility Over-staging Stage migration
PEIs 11 12 5 3 0 20 (64.5 %) 8 (25.8 %) 19 (61.3 %)
AM40 keV 6 20 5 0 0 25 (80.7 %) 5 (16.1 %) 11 (35.5 %)
AM50 keV 7 17 7 0 0 24 (77.4 %) 7 (22.6 %) 14 (45.2 %)
AM60 keV 8 15 8 0 0 23 (74.2 %) 8 (25.8 %) 16 (51.6 %)
AM70 keV 9 14 7 1 0 22 (71.0 %) 8 (25.8 %) 17 (54.8 %)
AM80 keV 10 10 10 1 0 21 (67.7 %) 11 (35.5 %) 21 (67.7 %)
AM90 keV 10 10 10 1 0 21 (67.7 %) 13 (41.9 %) 21 (67.7 %)
M40 keV 19 0 5 7 0 12 (38.7 %) 12 (38.7 %) 31 (100.0 %)
M50 keV 18 0 8 5 0 13 (41.9 %) 13 (41.9 %) 31 (100.0 %)
M60 keV 13 5 10 3 0 18 (58.1 %) 13 (41.9 %) 26 (83.9 %)
M70 keV 10 10 7 4 0 21 (67.7 %) 11 (35.5 %) 21 (67.7 %)
M80 keV 10 9 9 3 0 21 (67.7 %) 12 (38.7 %) 22 (71.0 %)
M90 keV 10 9 8 4 0 21 (67.7 %) 12 (38.7 %) 22 (71.0 %)
Fig. 3 T1a cancer (54 yrs, male) in AM40, 50, 60, 80 keV. AM40 keVcoronal image shows abnormal strong enhancement of the inner mucosallayer with an intact low-density-stripe layer (arrow) in the gastric angle inthe portal phase. The lesion was classified as T1a by two reviewers. Thelesion is not clear in AM50 keV and is invisible in either AM60 keV orAM80 keV
Eur Radiol (2017) 27:671–680 675
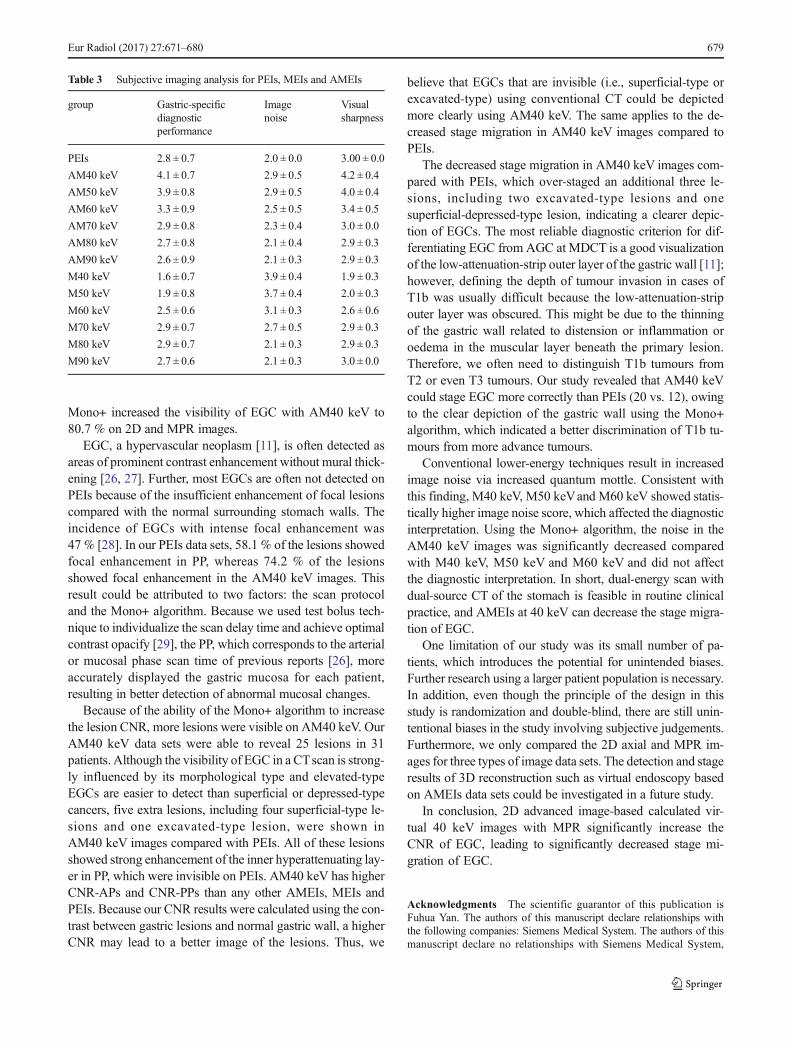
Subjective image analysis
Table 3 summarizes the subjective results for the MEIs,AMEIs and PEIs. AM40 keV gave a significantly highergastric-specific diagnostic performance and visual sharpnesscompared with other AMEIs, MEIs and PEIs (all p<0.05).With respect to image noise, PEIs had significant less noisecompared with AMEIs and MEIs (all p<0.05). M40 keV,M50 keV, and M60 keV had significantly higher image noisethan did the other MEIs. The mean scores of image noise wereacceptable for AM40 keV, AM50 keV, AM60 keV, AM70keV, M70 keV and M80 keV. (Details are provided inBSupplementary Information^.)
Inter-observer agreement
There is disagreement between two reviewers for the inde-pendent readings. The weighted k values of the visibility
and over-staging were 0.806 and 0.734 (both p<0.001),respectively. There was excellent inter-observer agreementwith respect to the subjective image quality (k=0.906 forgastric-specific diagnostic confidence, k=0.922 for visualsharpness, and k=0.891 for image noise, respectively) (allp<0.001).
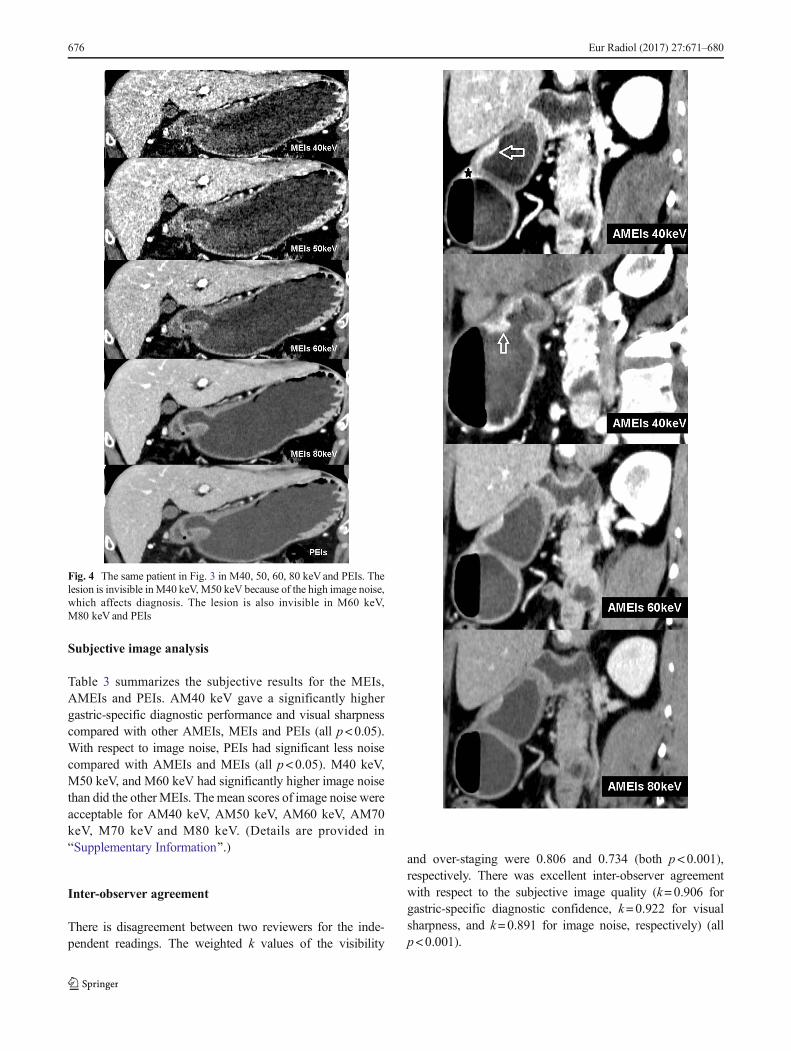
Fig. 4 The same patient in Fig. 3 in M40, 50, 60, 80 keVand PEIs. Thelesion is invisible inM40 keV,M50 keV because of the high image noise,which affects diagnosis. The lesion is also invisible in M60 keV,M80 keV and PEIs
676 Eur Radiol (2017) 27:671–680
Discussion
A previous study demonstrated that MEIs at 70 keV providedsubjectively improved image qualities compared with PEIs inthe evaluation of hepatic metastases [23], and that MEIs at100 keV could significantly reduce dark-band-like artefacts,making it possible to evaluate the condition of bone-encirclingdental implant bodies [24]. Nevertheless, few studies to datehave investigated the application of MEIs or AMEIs to thestomach. Our study used the Mono+ algorithm to increase theCNR and decrease image noise at a low keV, and the resultsindicated that AM40 keV had the highest overall score: itresulted in significantly better visibility than M40 keV,M50 keV and M60 keV and showed a statistically significantlower stage migration than PEIs; it also had the highest CNR-AP, CNR-PP, and CNR-DEP, consistent with the gastric-specific diagnostic performance and visual sharpness results.
Although MEIs provides several benefits, such as in-creased signal of contrast agent and the possibility to reducebeam hardening, it carries the main drawback of a substantialincrease in image noise at lower keVs. Thus, the gain in CNRwith monoenergetic imaging, compared with a PEIs, or asingle-energy scan at optimal kV is limited. To obtain betterCNR results, a frequency-based recombination of the low-keV images (which contain high iodine contrast) and mediumenergies (typically approximately 70 keV, which received su-perior noise properties) was performed to combine the bene-fits of both stacks—the improved contrast and low noise [25].Grant et al. investigated different image sets of phantoms toassess MEIs and AMEIs. Their results found out that theMono+ algorithm provides the optimum iodine CNR at thelowest energy level of 40 keV [25]. As applied in our study,
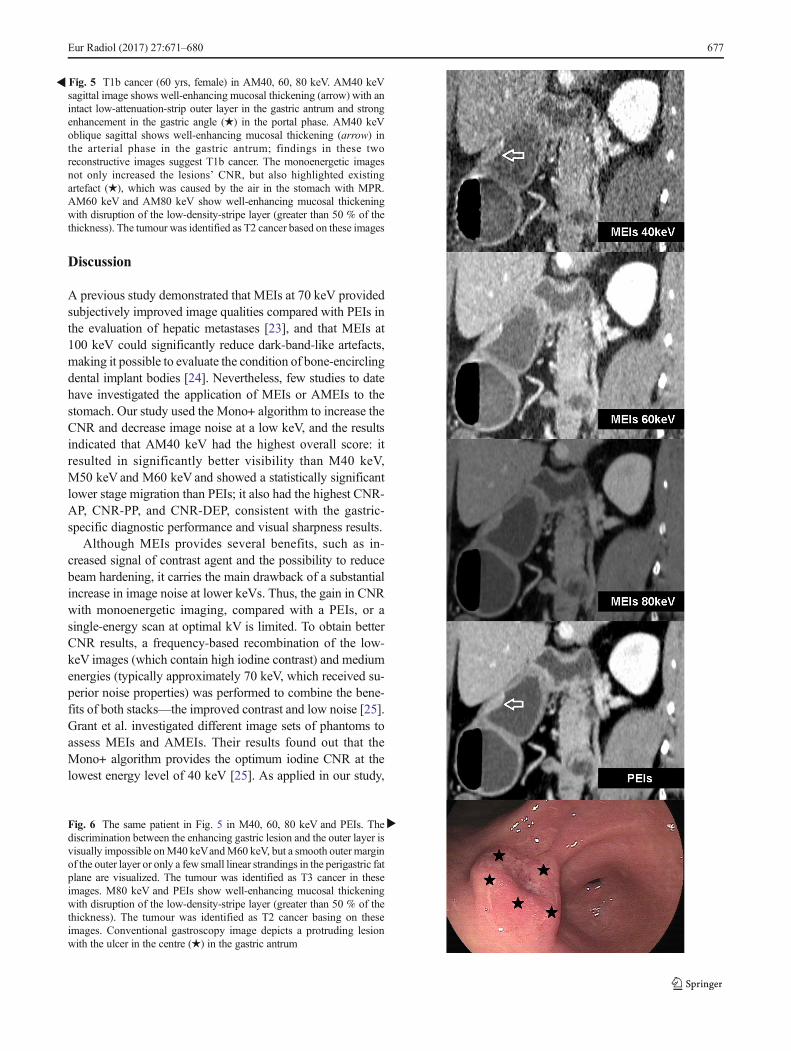
�Fig. 5 T1b cancer (60 yrs, female) in AM40, 60, 80 keV. AM40 keVsagittal image shows well-enhancing mucosal thickening (arrow) with anintact low-attenuation-strip outer layer in the gastric antrum and strongenhancement in the gastric angle (★) in the portal phase. AM40 keVoblique sagittal shows well-enhancing mucosal thickening (arrow) inthe arterial phase in the gastric antrum; findings in these tworeconstructive images suggest T1b cancer. The monoenergetic imagesnot only increased the lesions’ CNR, but also highlighted existingartefact (★), which was caused by the air in the stomach with MPR.AM60 keV and AM80 keV show well-enhancing mucosal thickeningwith disruption of the low-density-stripe layer (greater than 50 % of thethickness). The tumour was identified as T2 cancer based on these images
�Fig. 6 The same patient in Fig. 5 in M40, 60, 80 keV and PEIs. Thediscrimination between the enhancing gastric lesion and the outer layer isvisually impossible onM40 keVandM60 keV, but a smooth outer marginof the outer layer or only a few small linear strandings in the perigastric fatplane are visualized. The tumour was identified as T3 cancer in theseimages. M80 keV and PEIs show well-enhancing mucosal thickeningwith disruption of the low-density-stripe layer (greater than 50 % of thethickness). The tumour was identified as T2 cancer basing on theseimages. Conventional gastroscopy image depicts a protruding lesionwith the ulcer in the centre (★) in the gastric antrum
Eur Radiol (2017) 27:671–680 677
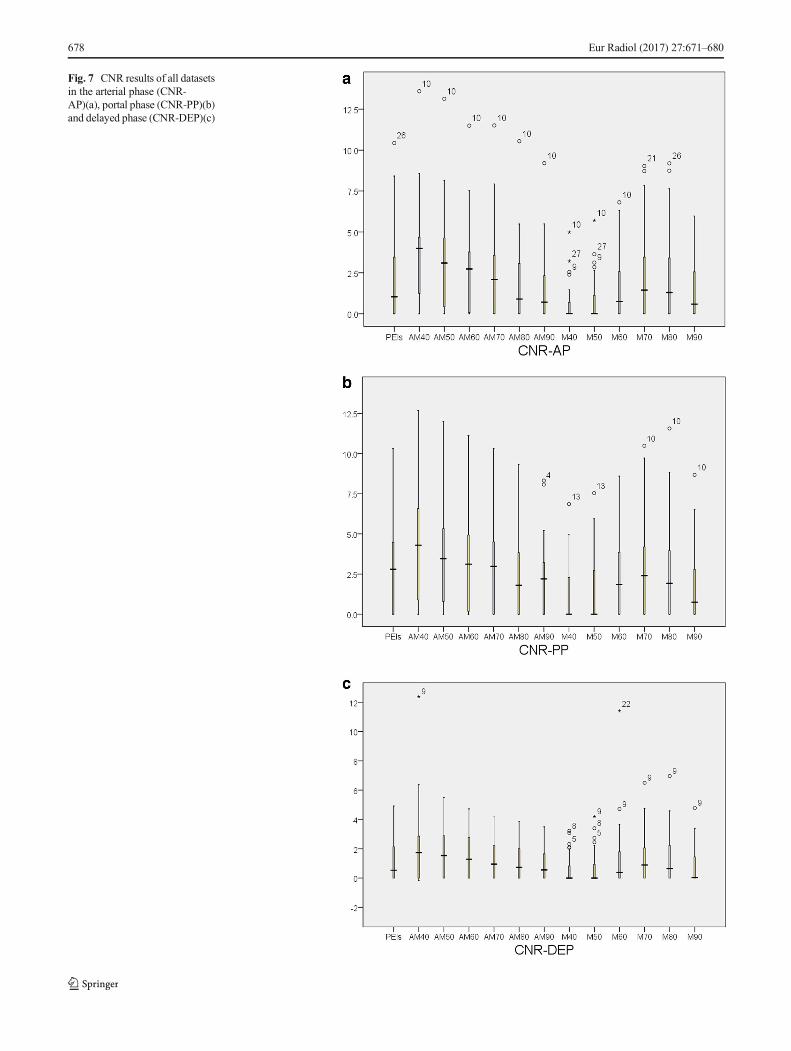
Fig. 7 CNR results of all datasetsin the arterial phase (CNR-AP)(a), portal phase (CNR-PP)(b)and delayed phase (CNR-DEP)(c)
678 Eur Radiol (2017) 27:671–680
Mono+ increased the visibility of EGC with AM40 keV to80.7 % on 2D and MPR images.
EGC, a hypervascular neoplasm [11], is often detected asareas of prominent contrast enhancement without mural thick-ening [26, 27]. Further, most EGCs are often not detected onPEIs because of the insufficient enhancement of focal lesionscompared with the normal surrounding stomach walls. Theincidence of EGCs with intense focal enhancement was47 % [28]. In our PEIs data sets, 58.1 % of the lesions showedfocal enhancement in PP, whereas 74.2 % of the lesionsshowed focal enhancement in the AM40 keV images. Thisresult could be attributed to two factors: the scan protocoland the Mono+ algorithm. Because we used test bolus tech-nique to individualize the scan delay time and achieve optimalcontrast opacify [29], the PP, which corresponds to the arterialor mucosal phase scan time of previous reports [26], moreaccurately displayed the gastric mucosa for each patient,resulting in better detection of abnormal mucosal changes.
Because of the ability of the Mono+ algorithm to increasethe lesion CNR, more lesions were visible on AM40 keV. OurAM40 keV data sets were able to reveal 25 lesions in 31patients. Although the visibility of EGC in a CTscan is strong-ly influenced by its morphological type and elevated-typeEGCs are easier to detect than superficial or depressed-typecancers, five extra lesions, including four superficial-type le-sions and one excavated-type lesion, were shown inAM40 keV images compared with PEIs. All of these lesionsshowed strong enhancement of the inner hyperattenuating lay-er in PP, which were invisible on PEIs. AM40 keV has higherCNR-APs and CNR-PPs than any other AMEIs, MEIs andPEIs. Because our CNR results were calculated using the con-trast between gastric lesions and normal gastric wall, a higherCNR may lead to a better image of the lesions. Thus, we
believe that EGCs that are invisible (i.e., superficial-type orexcavated-type) using conventional CT could be depictedmore clearly using AM40 keV. The same applies to the de-creased stage migration in AM40 keV images compared toPEIs.
The decreased stage migration in AM40 keV images com-pared with PEIs, which over-staged an additional three le-sions, including two excavated-type lesions and onesuperficial-depressed-type lesion, indicating a clearer depic-tion of EGCs. The most reliable diagnostic criterion for dif-ferentiating EGC from AGC at MDCT is a good visualizationof the low-attenuation-strip outer layer of the gastric wall [11];however, defining the depth of tumour invasion in cases ofT1b was usually difficult because the low-attenuation-stripouter layer was obscured. This might be due to the thinningof the gastric wall related to distension or inflammation oroedema in the muscular layer beneath the primary lesion.Therefore, we often need to distinguish T1b tumours fromT2 or even T3 tumours. Our study revealed that AM40 keVcould stage EGC more correctly than PEIs (20 vs. 12), owingto the clear depiction of the gastric wall using the Mono+algorithm, which indicated a better discrimination of T1b tu-mours from more advance tumours.
Conventional lower-energy techniques result in increasedimage noise via increased quantum mottle. Consistent withthis finding, M40 keV, M50 keVand M60 keV showed statis-tically higher image noise score, which affected the diagnosticinterpretation. Using the Mono+ algorithm, the noise in theAM40 keV images was significantly decreased comparedwith M40 keV, M50 keV and M60 keV and did not affectthe diagnostic interpretation. In short, dual-energy scan withdual-source CT of the stomach is feasible in routine clinicalpractice, and AMEIs at 40 keV can decrease the stage migra-tion of EGC.
One limitation of our study was its small number of pa-tients, which introduces the potential for unintended biases.Further research using a larger patient population is necessary.In addition, even though the principle of the design in thisstudy is randomization and double-blind, there are still unin-tentional biases in the study involving subjective judgements.Furthermore, we only compared the 2D axial and MPR im-ages for three types of image data sets. The detection and stageresults of 3D reconstruction such as virtual endoscopy basedon AMEIs data sets could be investigated in a future study.
In conclusion, 2D advanced image-based calculated vir-tual 40 keV images with MPR significantly increase theCNR of EGC, leading to significantly decreased stage mi-gration of EGC.
Acknowledgments The scientific guarantor of this publication isFuhua Yan. The authors of this manuscript declare relationships withthe following companies: Siemens Medical System. The authors of thismanuscript declare no relationships with Siemens Medical System,
Table 3 Subjective imaging analysis for PEIs, MEIs and AMEIs
group Gastric-specificdiagnosticperformance
Imagenoise
Visualsharpness
PEIs 2.8 ± 0.7 2.0 ± 0.0 3.00 ± 0.0
AM40 keV 4.1 ± 0.7 2.9 ± 0.5 4.2 ± 0.4
AM50 keV 3.9 ± 0.8 2.9 ± 0.5 4.0 ± 0.4
AM60 keV 3.3 ± 0.9 2.5 ± 0.5 3.4 ± 0.5
AM70 keV 2.9 ± 0.8 2.3 ± 0.4 3.0 ± 0.0
AM80 keV 2.7 ± 0.8 2.1 ± 0.4 2.9 ± 0.3
AM90 keV 2.6 ± 0.9 2.1 ± 0.3 2.9 ± 0.3
M40 keV 1.6 ± 0.7 3.9 ± 0.4 1.9 ± 0.3
M50 keV 1.9 ± 0.8 3.7 ± 0.4 2.0 ± 0.3
M60 keV 2.5 ± 0.6 3.1 ± 0.3 2.6 ± 0.6
M70 keV 2.9 ± 0.7 2.7 ± 0.5 2.9 ± 0.3
M80 keV 2.9 ± 0.7 2.1 ± 0.3 2.9 ± 0.3
M90 keV 2.7 ± 0.6 2.1 ± 0.3 3.0 ± 0.0
Eur Radiol (2017) 27:671–680 679
whose products or services are related to the subject matter of the article.This study has received funding by Shanghai science and technologydevelopment (No. 134119a5900), Medical Engineer cross subject ofJiao Tong University (No.YG2012MS48), NSFC (No. 81171312), andNSFC (No.U1532107).
Baisong Wang kindly provided statistical advice for this manuscript.Institutional ReviewBoard approval was obtained.Written informed con-sent was waived by the Institutional Review Board. No study subjects orcohorts have been previously reported. Methodology: retrospective, di-agnostic study, performed at one institution.
Open Access This article is distributed under the terms of the CreativeCommons At t r ibut ion 4 .0 In te rna t ional License (h t tp : / /creativecommons.org/licenses/by/4.0/), which permits unrestricted use,distribution, and reproduction in any medium, provided you giveappropriate credit to the original author(s) and the source, provide a linkto the Creative Commons license, and indicate if changes were made.
References
1. Lian J, Chen S, Zhang Y, Qiu F (2012) A meta-analysis of endo-scopic submucosal dissection and EMR for early gastric cancer.Gastrointest Endosc 76:763–770
2. Gotoda T, Jung HY (2013) Endoscopic resection (endoscopic mu-cosal resection/ endoscopic submucosal dissection) for early gastriccancer. Dig Endosc 25:55–63
3. Takahashi T, Saikawa Y, Kitagawa Y (2013) Gastric cancer: currentstatus of diagnosis and treatment. Cancers 5:48–63
4. Yoshikawa T, SasakoM, Yamamoto S et al (2009) Phase II study ofneoadjuvant chemotherapy and extended surgery for locally ad-vanced gastric cancer. Br J Surg 96:1015–1022
5. Yan C, Zhu ZG, Yan M et al (2009) Value of multidetector‐rowcomputed tomography in the preoperative T and N staging of gastriccarcinoma: A large‐scale Chinese study. J Surg Oncol 100:205–214
6. Makino T, Fujiwara Y, Takiguchi S et al (2011) Preoperative Tstaging of gastric cancer by multi-detector row computed tomogra-phy. Surgery 149:672–679
7. Shimizu K, Ito K, Matsunaga N, Shimizu A, Kawakami Y (2005)Diagnosis of gastric cancer with MDCT using the water-fillingmethod and multiplanar reconstruction: CT–histologic correlation.Am J Roentgenol 185:1152–1158
8. Woo S, Kim S, Kim T et al (2008) Investigation of the associationbetween CT detection of early gastric cancer and ultimate histology.Clin Radiol 63:1236–1244
9. Kim HJ, Kim AY, Oh ST et al (2005) Gastric Cancer Staging atMulti–Detector Row CT Gastrography: Comparison of Transverseand Volumetric CT Scanning 1. Radiology 236:879–885
10. Kim JH, Eun HW, Goo DE, Shim CS, Auh YH (2006) Imaging ofVarious Gastric Lesions with 2D MPR and CT GastrographyPerformed with Multidetector CT1. Radiographics 26:1101–1116
11. Chen C-Y, Hsu J-S, Wu D-C et al (2007) Gastric Cancer:Preoperative Local Staging with 3D Multi–Detector Row CT—Correlation with Surgical and Histopathologic Results 1.Radiology 242:472–482
12. Kim JH, Eun HW, Hong SS, Kim YJ, Han JK, Choi BI (2012)Gastric cancer detection using MDCT compared with 2D axialCT: diagnostic accuracy of three different reconstruction tech-niques. Abdom Imaging 37:541–548
13. Park HS, Lee JM, Kim SH et al (2010) Three-dimensional MDCTfor preoperative local staging of gastric cancer using gas and water
distention methods: a retrospective cohort study. AJR Am JRoentgenol 195:1316–1323
14. Thaiss WM, Haberland U, Kaufmann S et al (2015) Iodine concen-tration as a perfusion surrogate marker in oncology: Further eluci-dation of the underlying mechanisms using Volume Perfusion CTwith 80 kVp. Eur Radiol. doi:10.1007/s00330-015-4154-9
15. Marin D, Pratts-Emanuelli JJ, Mileto A et al (2015)Interdependencies of acquisition, detection, and reconstructiontechniques on the accuracy of iodine quantification in varying pa-tient sizes employing dual-energy CT. Eur Radiol 25:679–686
16. Wan Y, Li Z, Ji N, Gao J (2014) Comparison of gastric vascularanatomy by monochromatic and polychromatic dual-energy spec-tral computed tomography imaging. J Int Med Res 42:26–34
17. Sudarski S, Apfaltrer P (2013) Optimization of keV-settings in ab-dominal and lower extremity dual-source dual-energy CT angiog-raphy determined with virtual monoenergetic imaging. Eur J Radiol82:e574–e581
18. Apfaltrer P, Sudarski S, Schneider D et al (2014) Value ofmonoenergetic low-kV dual energy CT datasets for improved im-age quality of CT pulmonary angiography. Eur J Radiol 83:322–328
19. Yu L, Leng S, McCollough CH (2012) Dual-energy CT–basedmonochromatic imaging. Am J Roentgenol 199:S9–S15
20. Delesalle MA, Pontana F, Duhamel A et al (2013) Spectral optimi-zation of chest CT angiography with reduced iodine load: experi-ence in 80 patients evaluated with dual-source, dual-energy CT.Radiology 267:256–266
21. Association JGC (2011) Japanese classification of gastric carcino-ma: 3rd English edition. Gastric Cancer: Off J Int Gastric CancerAssoc Jpn Gastric Cancer Assoc 14:101
22. Kim JW, Shin SS, Heo SH et al (2012) Diagnostic performance of64-section CT using CT gastrography in preoperative T staging ofgastric cancer according to 7th edition of AJCC cancer stagingmanual. Eur Radiol 22:654–662
23. Sudarski S, Apfaltrer P, Nance JW Jr et al (2014) Objective andSubjective Image Quality of Liver Parenchyma and HepaticMetastases with Virtual Monoenergetic Dual-source Dual-energyCT Reconstructions: An Analysis in Patients with GastrointestinalStromal Tumor. Acad Radiol 21:514–522
24. Tanaka R, Hayashi T, Ike M, Noto Y, Goto TK (2013) Reduction ofdark-band-like metal artifacts caused by dental implant bodiesusing hypothetical monoenergetic imaging after dual-energy com-puted tomography. Oral Surg Oral Med Oral Pathol Oral Radiol115:833–838
25. Grant KL, Flohr TG, Krauss B, Sedlmair M, Thomas C, Schmidt B(2014) Assessment of an Advanced Image-Based Technique toCalculate Virtual Monoenergetic Computed Tomographic ImagesFrom a Dual-Energy Examination to Improve Contrast-To-NoiseRatio in Examinations Using Iodinated Contrast Media. InvestigRadiol. doi:10.1097/rli.0000000000000060
26. Lee JH, Jeong YK, Kim DH et al (2000) Two-phase helical CT fordetection of early gastric carcinoma: importance of the mucosalphase for analysis of the abnormal mucosal layer. J ComputAssist Tomogr 24:777–782
27. Kim H, Han H, Choi J et al (2001) Preoperative evaluation ofgastric cancer: value of spiral CT during gastric arteriography(CTGA). Abdom Imaging 26:123–130
28. Lee IJ, Lee JM, Kim SH et al (2010) Diagnostic performance of 64-channel multidetector CT in the evaluation of gastric cancer: differ-entiation of mucosal cancer (T1a) from submucosal involvement(T1b and T2). Radiology 255:805–814
29. Rodrigues J, Mathias H, Negus I, Manghat N, Hamilton M (2012)Intravenous contrast medium administration at 128 multidetectorrow CT pulmonary angiography: Bolus tracking versus test bolusand the implications for diagnostic quality and effective dose. ClinRadiol 67:1053–1060
680 Eur Radiol (2017) 27:671–680