dee valley water annual performance report 2016-17 · dee valley water annual performance report...
TRANSCRIPT

Dee Valley Water Annual Performance Report 2016-17

Dee Valley Water Annual Performance Report 2016-17 Dee Valley Group plc

Contents
Certificate of Compliance (Licence Condition F6A.2A) 4
Strategic Overview 5
Directors’ Report 10
Director’s Responsibilities Statement 13
Independent Auditor’s Report to the Water Services Regulation Authority (“WSRA”) and Members of Dee Valley Water Plc
14
Section 1 - Regulatory Financial Reporting 19
Section 1 – Regulatory Financial Accounting Disclosures 24
Section 2 - Price Control and Additional Segmental Reporting 29
Section 3 - Performance Summary 38
Section 4 – Other Information 43
Other Regulatory Disclosures 52
3
Your Local Water Company

The main factors taken into account by the Directors in giving this certificate were:
• that the Appointee’s processes and systems of internal control had operated as expected;
• that the Appointee operated as if the appointed business were substantially the Appointee’s sole business and that the Appointee were a separate public limited Company;
• that the Appointee’s resources and facilities were adequate to enable the Appointee to meet its regulatory obligations;
• the net worth of the Appointee and the strength of its key performance indicators as shown in the Operating and Financial review; and
• the Appointee’s borrowing facilities and the size of its undrawn bank facilities.
The certificate was approved at a duly convened meeting of the Board of Directors on 13 July 2017 and is signed on behalf of the Directors on 13 July 2017 by:
Liv Garfield Chief Executive
Certificate of Compliance (Licence Condition F6A.2A)
Diversification and protection of the core businessThis is to certify that, in the opinion of the Directors of Dee Valley Water plc (the “Appointee”), the Appointee:
• will have available to it sufficient financial resources and facilities to enable it to carry out, for at least the next 12 months, the Regulated Activities (including the investment programme necessary to fulfil its obligations under its Instrument of Appointment);
• will, for at least the next 12 months, have available to it management resources and systems of planning and internal control which are sufficient to enable it to carry out those functions;
• is in compliance with paragraph 3.1 of condition K of its Instrument of Appointment and
• all contracts entered into with any Associated Company include all necessary provisions and requirements concerning the standard of service to be supplied to the Appointee, to ensure that it is able to meet all its obligations as a water undertaker.
4
Dee Valley Water Annual Performance Report 2016-17 Dee Valley Group plc

A1: Discoloured water contacts
There has been a strong year-on-year improvement in discoloured water contacts. The improvement has been driven by our strategy of upgrading treatment works to stop discolouration potential entering our network and then systematically cleaning the water mains. We have maintained our enhanced level of mains cleaning and completed 307km of mains flushing in 2016 (around one seventh of our network).
A2: Mean zonal compliance
This is another strong area of performance. Compliance now stands at 99.99%, with this achievement attributable to the benefits from our new treatment works at Llwyn Onn and a significant increase in network cleaning.
During 2016, we also delivered an ultraviolet disinfection plant and a phosphate dosing scheme to control lead levels in our distribution system to further reduce water quality risk. We are planning to invest around £25m in the 2015-20 period to improve water quality, with measures such as rebuilding of reservoirs to working with landowners to reduce catchment risks.
Dee Valley Water supplies drinking water to people in northwest Wales, Cheshire and the surrounding areas. We have around 126,000 customers and provide 62 million litres of water a day.
Every year we publish a diverse range of information to our customers and stakeholders about our performance, activities and assets. Providing accurate, clear and understandable information which can be trusted by our stakeholders is important to us. This document summarises the outcomes of our assurance plans for this year.
In February 2017 we became part of the Severn Trent group. This acquisition is a natural fit, and we are enjoying learning new skills and sharing our knowledge as we look to collectively improve our customer experience. Both Dee Valley’s and Severn Trent’s customers will benefit from sharing best practice from both businesses. The combined Severn Trent group will also benefit from a separate Welsh water licence and a stronger voice for our Welsh customers.
This strategic acquisition helps us grow our business while also bringing in new skills and expertise to the wider company. We look forward to continuing to integrate our two businesses over the coming months.
Customer Performance (Outcome Delivery Incentives for 2016/17)Performance against the Company’s Performance Commitments (PCs) and Outcome Delivery Incentives (ODIs) is detailed in Section 3 of this report. The Section 3 table also includes the notional reward or penalty earned at 31 March 2017, based on performance to that date. The Service Incentive Mechanism (SIM) reward/penalty will be awarded by OFWAT at the end of the AMP period (2020). Performance for each of the PCs at the 31 March 2017 is as:
Strategic Overview
Year Performance PC
2016/17 99.99% 100%
2015/16 99.95% 100%
Year Performance PC
2016/17 1.07 contacts per 1,000 population
1.90 contacts per 1,000 population
2015/16 1.32 contacts per 1,000 population
2.80 contacts per 1,000 population
5
Your Local Water Company

A3: Delivery of the outcomes of the Legacy treatment works major scheme(PC: completion required by 31 March 2018)
The Company intends to decommission the Legacy treatment works, implementing an alternative solution through which water treated at the Llwyn Onn treatment works will be pumped across to the Legacy distribution zone. There are a number of key components required to successfully deliver the outcome, including the construction of additional pumping stations, laying 8.5km of pipeline and improving connectivity both within our own network and with neighbouring water companies.
Construction work is on-going at various sites and we are on track to meet our commitment to deliver the required customer outcomes by 31 March 2018.
We have also provided regular updates about progress to our stakeholders, including our Customer Challenge Group (CCG) and the Consumer Council for Water (CCWater) throughout the year and will continue to do so as the scheme progresses. Future updates will be published on our website.
A4: Delivery of the outcomes of the service reservoir water quality risk management scheme(PC: completion required by 31 March 2020)
We remain on track to complete all planned service reservoir schemes by 31 March 2020, as agreed with the Drinking Water Inspectorate (DWI). We have provided regular updates about progress to our stakeholders, including our CCG and CCWater throughout the year and will continue to do so as the scheme progresses.
Our reservoir inspection programme aims to ensure that all 42 service reservoirs are inspected by 2020. As part of the programme, all remedial works will be identified
and addressed prior to the reservoir being returned to service. We continue to work closely with the DWI to demonstrate that we are addressing risks associated with service reservoir membranes and joints.
B1: Average duration of interruptions
Our performance this year was significantly impacted by a severe interruption on a strategic main during August 2016, which impacted over 8,000 customers in the Wrexham supply area. As a result, our overall performance has fallen this year and will marginally breach the penalty threshold.
We remain committed to minimise interruptions, and wherever possible return supply within the 3 hour deadline and so return to our previous excellent performance in this area.
B2: Sustainable economic level of leakage
Leakage has increased this year, but remained within expected levels for this performance commitment. The deterioration is due to an increase in mains bursts and a major interruption on a strategic main in Wrexham affecting over 8,000 customers. Total leakage, as measured in million litres per day, is higher than assumed in our Water Resource Management Plan (11.31 Ml/d compared to 10.17 Ml/d). We will investigate the reasons for this during 2017/18.
Year Performance PC
2016/17 0.35 hours/property/year
0.24 hours/property/year
2015/16 0.09 hours/property/year
0.29 hours/property/year
Year Performance PC
2016/17 89.0 l/prop/day 90.8 l/prop/day
2015/16 78.4 l/prop/day 90.8 l/prop/day
6
Dee Valley Water Annual Performance Report 2016-17 Dee Valley Group plc

B3: Security of supply index
We maintained our performance of 100% security of supply, primarily due to the level of resource resilience available on the River Dee.B4: Number of bursts
The number of mains bursts increased this year, but remain within expected levels of performance. The increase is attributable to bursts within the Chester area. To better understand our network, we are deploying loggers in the areas, which experienced the largest increases. This work will enable us to better target our mains replacement programme to replace problem or failing mains.C1: Gross operational greenhouse gas emissions
The strong improvement in greenhouse gas emissions achieved this year can be attributed partly to a change in the grid electricity conversion factor (calculated emissions from electricity fell by 4.4%) and partly to the improvements we made at Boughton treatment works for power resilience, significantly reducing the amount of fuel burned by reducing our reliance on a stand-by generator.
D1: Customers perception based on market research
A survey was conducted last year to assess customer satisfaction with our service and establish a baseline target for the ‘value for money’ component (80%). Customer satisfaction and trust measures within the survey this year scored highly and in line with other metrics produced by CCWater and Ofwat’s Service Incentive Mechanism. In particular, CCWater recently recognised us as being among one of the companies with the most customer satisfaction with the value for money of their water supply . Despite this, our performance against our baseline target for ‘value for money’ declined.
We have carried out a number of customer engagement activities throughout the year with the aim of improving customer perception including:
• The extension of Rant and Rave, our customer sentiment tool, to all operational departments.
• Hosting the industry’s first Customer Vulnerability event where 50 organisations met to network and share information in relation to supporting customers in our community. As a result of this we have made a number of new connections and regularly attend DWP offices and foodbanks in Wrexham and Chester to offer our support services to their clients.
• Launching our Social Tariff, paperless billing and self-service options via our newly designed website.
• Improvements in customer communication tools such as customer letter templates etc. to ensure ease of use and understanding for all our customers. To complement this, customer facing staff have undertaken bespoke training to better assist vulnerable circumstances.
Year Performance PC
2016/17 100% 100%
2015/16 100% 100%
Year Performance PC
2016/17 77% Improved
2015/16 80% Set target
Year Performance PC
2016/17 209 no. burst mains/year
234 no. burst mains/year
2015/16 169 no. burst mains/year
246 no. burst mains/year
Year Performance PC
2016/17 8385 tCO2e 9762 tCO2e
2015/16 9219 tCO2e 9783 tCO2e
7
Your Local Water Company

8
Dee Valley Water Annual Performance Report 2016-17 Dee Valley Group plc

E1: Per capita consumption and water efficiency
We continue to promote the efficient use of water through a number of different initiatives throughout the year including:• Our school education programme managed by
our third party supplier, Core Assets who conduct learning sessions at local schools.
• The distribution of water efficiency devices both at local events and online.
• Water efficiency presentations to vulnerable customer organisations to help customers not only save water but also save money.
Our performance this year represents an increase in per capita consumption in comparison to the prior year and is outside the target performance. Driving a reduction in per capita consumption throughout the remainder of the AMP is a key area of focus and we aim to achieve progress towards this objective during the coming year.
E2 / F1: Service Incentive Mechanism and Non-Household Service Incentive Mechanism (SIM)
We have delivered another strong year-on-year improvement in this area. We have continued to focus on the root causes of customer dissatisfaction, leading to the identification of training needs and process improvements. Our real time feedback system, Rant & Rave, also continues to help us identify and resolve customer service issues, primarily complaints and unwanted contacts.
Further improvements in text messaging and other communication channels, alongside continuous improvement in both the skills of the customer service team and existing processes have ensured the SIM score has improved during the year and have exceeded the performance commitment of 80.
Comparing our performance to others in the sectorWe have designed our report to be accessible to all stakeholders so that they show how we are delivering for our customers, our stakeholders and the environment.
In addition to this report, we will be producing a summary report for our customers in early August to provide an overview of our performance, and we will also ensure that a Welsh language performance summary is also made available.
We are also working with Ofwat and other water companies to improve consistency of how we measure and report performance, particularly on leakage and supply interruptions. This work will be used in our next business plan to Ofwat (this will cover 2020-25). We will provide an update in our Annual Performance Report for 2018.
To find out more about Dee Valley Water’s service performance in comparison to other water companies please go to www.discoverwater.co.uk. This ‘dashboard’ brings together key information about water companies in England and Wales in one place in a clear and simple way for customers. All data is provided by the water companies with oversight from our water regulators, the UK and Welsh Governments and the Consumer Council for Water.
1. https://www.ccwater.org.uk/blog/2017/06/20/water-trailing-energy-suppliers-on-value-for-money/
Year Performance PC
2016/17 135.21 l/capita/day 130.45 l/capita/day
2015/16 134.87 l/capita/day 131.44 l/capita/day
Year Performance (HH)
Performance (NHH) PC
2016/17 85.94 SIM score
90.43 SIM score 80 SIM score
2015/16 83.42 SIM score
88.51 SIM score 80 SIM score
9
Your Local Water Company

The Directors present the Annual Performance Report of Dee Valley Water plc for the year ended 31 March 2017.
The Annual Performance Report is separate from the statutory accounts of the Company, which were prepared to 31 March 2017. These regulatory accounts are prepared to comply with Condition F of the Company’s Instrument of Appointment granted under the Water Industry Act 1991.
Principal ActivityThe principal activity of the Company is the provision of water services to customers in an area of 835 square kilometres, in North-East Wales and North-West England, for which Dee Valley Water plc is the licensed water supply undertaker.
Directors and Directors’ InterestsThe Directors who held office during the year were as follows:
A A Bickerton (resigned 25 April 2016)
P B Holder (resigned 17 February 2017)
II J A Plenderleith (resigned 17 February 2017)
J H Schofield (resigned 17 February 2017)
K Starling (resigned 17 February 2017)
J B Coghlan (appointed 17 February 2017)
E Fitzgerald (appointed 17 February 2017)
P J Remnant (appointed 17 February 2017)
A R E Strank (appointed 17 February 2017)
D J N Reiniche (appointed 17 February 2017)
A J Duff (appointed 17 February 2017)
K S Beeston (appointed 17 February 2017)
J Bowling (appointed 17 February 2017)
O R Garfield (appointed 17 February 2017)
DividendsDividends of £1,945,511 (2016: £2,895,000) were paid in the year.
No interim dividend has been paid in the year. The Directors are not proposing a final dividend in respect of the financial year ended 31 March 2017.
Directors’ Report
Dividends per share paid during the year £
2015/16 Final paid per ordinary share 8.09
Total for 2016/17 8.09
10
Dee Valley Water Annual Performance Report 2016-17 Dee Valley Group plc

Statement of Directors’ Remuneration and Standards of Performance(as required under S35A of the Water Industry Act 1991)
Information regarding Directors’ Remuneration can be found in the Severn Trent Water Limited Annual Report and Accounts 2016, including details of the link to performance, how remuneration was calculated and details of amounts paid.
Long Term Viability StatementThe directors’ assessment of the company’s current financial position is set out in the Financial review on pages 9 to 10 of the Dee Valley Water Annual Report and Accounts. Their assessment of the company’s principal risks is set out in the Principal risks section on pages 5 to 8 of the Dee Valley Water Annual Report and Accounts.
The company is a regulated long-term business characterised by multi-year investment programmes and stable revenues. The water industry in England and Wales is currently subject to economic regulation rather than market competition and Ofwat, the economic regulator, has a statutory obligation to secure that water companies are able to finance their appointed activities. Ofwat meets this obligation by setting price controls for five year Asset Management Periods (AMPs). This mechanism reduces the potential for variability in revenues from the regulated business. The current AMP runs until March 2020.
The Severn Trent Group has an established process to assess its prospects. The Board of Severn Trent Plc undertakes a detailed assessment of the Group’s strategy on an annual basis and the output from this assessment sets the framework for the Group’s medium term plan which is updated annually. The company was included in that process for the first time this year and the company’s input to that process was used to assess its prospects.
The assessment of the company’s prospects considered the potential impacts of the principal risks and uncertainties. Stress tests were performed to assess the potential impacts of combinations of those risks and uncertainties. The assessment also considered the mitigating actions that might be taken to reduce the impact of such risks and uncertainties and their likely effectiveness.
The company is funded through loans and facilities provided by the Severn Trent Group. The company has sufficient loans and facilities in place to cover its cash flow requirements throughout the period under review.
Bearing in mind the long term nature of the company’s business; the enduring demand for its services; the nature of the Group’s established planning process and the changing nature of the regulation of the water industry in England and Wales, the directors have determined that three years is an appropriate period over which to assess the Group’s prospects and make its viability statement.
The directors have assessed the viability of the company over a three year period to March 2020, taking into account:
• the company’s current position and future prospects;
• the loans and facilities available to the company; and
• its principal risks.
Based on that assessment, the directors have a reasonable expectation that the company will be able to continue in operation and meet its liabilities as they fall due over the period to 31 March 2020.
11
Your Local Water Company

Going ConcernThe Annual Performance Report has been prepared on the going concern basis. The Company has considerable financial resources together with a customer monopoly in its area of supply. Consequently, the Directors believe that the Company is well placed to manage its business risks successfully over the forthcoming twelve months.
The external funding has now been restructured such that it is held by the parent company, Severn Trent Water Limited. The former RCF facility has been closed and this has been replaced by an intercompany loan with Severn Trent Water Limited.
The Directors therefore have a reasonable expectation that the Company has adequate resources to continue in operational existence for the foreseeable future and consider that the going concern basis continues to be appropriate in preparing the Financial Statements.
AuditorDeloitte LLP have expressed their willingness to continue in office and a resolution to reappoint them will be proposed at the forthcoming Annual General Meeting.
Disclosure of Information to our AuditorEach of the persons who is a Director at the date of approval of this report confirms that:
• so far as the Director is aware, there is no relevant audit information of which the Company’s auditor is unaware; and
• the Director has taken all the steps that he ought to have taken as a Director in order to make himself aware of any relevant audit information and to establish that the Company’s auditor is aware of that information.
This confirmation is given and should be interpreted in accordance with the provisions of s418 of the Companies Act 2006.
Approved by the Board and signed on its behalf by:
Liv Garfield Chief Executive
13 July 2017
12
Dee Valley Water Annual Performance Report 2016-17 Dee Valley Group plc

Directors’ Responsibilities Statement
The Directors are responsible under Condition F of the Instrument of Appointment issued under the Water Industry Act 1991 for:
• Ensuring that proper accounting records are maintained by the Appointee to enable compliance with the requirements of Condition F and having regard also to the terms of guidelines notified by the Water Services Regulation Authority (“Ofwat”) to the appointee from time to time;
• Preparing regulatory accounts on a consistent basis for each financial year in accordance with Condition F, having regard also to the terms of guidelines notified by Ofwat from time to time, which, so far as is reasonably practicable, have the same content as the annual financial statements of the appointee prepared under the Companies Act 2006 and which are prepared in accordance with the formats, accounting policies and principles which apply to those financial statements;
• Preparing regulatory accounts on a current cost basis in respect of the same accounting period in accordance with guidelines issued by Ofwat from time to time;
• Preparing such other financial and related information as is required by Condition F having regard also to the terms of guidelines issued by Ofwat from time to time;
• Ensuring that the Company maintain an investment grade credit rating (license condition F6A.6); and
• Ensuring that the Company has adequate resources to continue as a going concern for the foreseeable future.
Signed on behalf of the Board On 13 July 2017
13
Your Local Water Company

Opinion on Annual Performance Report In our opinion, Dee Valley Water plc’s Regulatory Accounting Statements within the Annual Performance Report:
• have been properly prepared in accordance with Condition F, the Regulatory Accounting Guidelines issued by the WSRA (RAG 1.07, RAG 2.06, RAG 3.09, RAG 4.06 and RAG 5.06) and the accounting policies (including the company’s published accounting methodology statement as defined in RAG 3.09, Appendix 3) set out on pages 24 to 27.
Emphasis of matter – basis of preparationWithout modifying our opinion on the Regulatory Accounting Statements within the Annual Performance Report, we draw attention to the fact that the Annual Performance Report has been prepared in accordance with Condition F, the Regulatory Accounting Guidelines, the accounting policies (including the company’s published accounting methodology statement, as defined in RAG 3.09, Appendix 3) set out in the statement of accounting policies and under the historical cost convention. The nature, form and content of the Regulatory Accounting Statements are determined by the WSRA. It is not appropriate for us to assess whether the nature of the information being reported upon is suitable or appropriate for the WSRA’s purposes. Accordingly we make no such assessment.
The Annual Performance Report is separate from the statutory financial statements of the Company and has not been prepared under the basis of International Financial Reporting Standards as adopted by the European Union (“IFRSs”). Financial information other than that prepared on the basis of IFRSs does not necessarily represent a true and fair view of the financial performance or financial position of a company as shown in statutory financial statements prepared in accordance with the Companies Act 2006.
The Regulatory Accounting Statements on pages 18 to 36 have been drawn up in accordance with Regulatory Accounting Guidelines with a number of departures from IFRSs. A summary of the effect of these departures from Generally Accepted Accounting Practice in the Company’s statutory financial statements is included in the tables within section 1.
What we have auditedThe tables within Dee Valley Water plc’s Annual Performance Report that we have audited (“the Regulatory Accounting Statements”) comprise:
• the regulatory financial reporting tables comprising the income statement (table 1A), the statement of comprehensive income (table 1B), the statement of financial position (table 1C), the statement of cash flows (table 1D) and the net debt analysis (table 1E) and the related notes; and
• the regulatory price review and other segmental reporting tables comprising the segmental income statement (table 2A), the totex analysis for wholesale water (table 2B), the operating cost analysis for retail (table 2C), the historical cost analysis of fixed assets for wholesale and retail (table 2D), the analysis of capital contributions and land sales for wholesale (table 2E), the household revenues by customer type (table 2F), the non-household water revenues by customer type (table 2G) and the revenue analysis by customer type (table 2I) and the related notes.
The financial reporting framework that has been applied in their preparation comprises Condition F, the Regulatory Accounting Guidelines issued by the WSRA and the accounting policies (including the accounting separation methodology) set out in pages 24 to 27 of the Annual Performance Report.
Independent Auditor’s Report to the Water Services Regulation Authority (“WSRA”) and Members of Dee Valley Water Plc
14
Dee Valley Water Annual Performance Report 2016-17 Dee Valley Group plc

In applying the financial reporting framework, the directors have made a number of subjective judgements, for example in respect of significant accounting estimates. In making such estimates, they have made assumptions and considered future events.
We have not audited the Outcome performance tables (tables 3A to 3C) and the additional regulatory information in tables 4A to 4I.
This report is made, on terms that have been agreed, solely to the Company and the WSRA in order to meet the requirements of Condition F of the Instrument of Appointment granted by the Secretary of State for the Environment to the Company as a water and sewage undertaker under the Water Industry Act 1991 (“Condition F”). Our audit work has been undertaken so that we might state to the Company and the WSRA those matters that we have agreed to state to them in our report, in order (a) to assist the Company to meet its obligation under Condition F to procure such a report and (b) to facilitate the carrying out by the WSRA of its regulatory functions, and for no other purpose. To the fullest extent permitted by law, we do not accept or assume responsibility to anyone other than the Company and the WRSA, for our audit work, for this report or for the opinions we have formed.
An overview of the scope of our auditOur audit was scoped by obtaining an understanding of the entity and its environment, including internal control, and assessing the risks of material misstatement. Audit work to respond to the risks of material misstatement was performed directly by the audit engagement team.
Our application of materialityWe define materiality as the magnitude of misstatement in the financial statements that makes it probable that the economic decisions of a reasonably knowledgeable person would be changed or influenced. We use materiality both in planning the scope of our audit work and in evaluating the results of our work.
Respective responsibilities of the WSRA, the Directors and AuditorsAs explained more fully in the Statement of Directors’ Responsibilities set out on page 13, the directors are responsible for the preparation of the Annual Performance Report in accordance with Condition F, the Regulatory Accounting Guidelines issued by the Regulator and the Company’s accounting policies (including the accounting separation methodology).
15
Your Local Water Company
Our responsibility is to audit and express an opinion on the Regulatory Accounting Statements within the Annual Performance Report in accordance with International Standards on Auditing (UK and Ireland) (“ISAs (UK & Ireland)”), except as stated in the section on ‘What an audit of the Annual Performance report involves’ below, and having regard to the guidance contained in ICAEW Technical Release Tech 02/16 AAF ‘Reporting to Regulators on Regulatory Accounts’ issued by the Institute of Chartered Accountants in England & Wales. Those standards require us to comply with the Auditing Practices Board’s Ethical Standards for Auditors.
What an audit of the Annual Performance Report involvesAn audit involves obtaining evidence about the amounts and disclosures in the Regulatory Accounting Statements sufficient to give reasonable assurance that the Regulatory Accounting Statements within the Annual Performance Report are free from material misstatement, whether caused by fraud or error. This includes an assessment of: whether the accounting policies are appropriate to the company’s circumstances and have been consistently applied and adequately disclosed; and the reasonableness of significant accounting estimates made by the directors. In addition, we read all the financial and non-financial information in the Annual Performance Report to identify material inconsistencies with the audited tables within the Annual Performance Report and to identify any information that is apparently materially incorrect based on, or materially inconsistent with, the knowledge acquired by us in the course of performing the audit. If we become aware of any apparent material misstatements or inconsistencies we consider the implications for our report.
We have not assessed whether the accounting policies are appropriate to the circumstances of the Company where these are laid down by Condition F. Where Condition F does not give specific guidance on the accounting policies to be followed, our audit includes an assessment of whether the accounting policies adopted in respect of the transactions and balances required to be included in the Annual Performance Report are consistent with those used in the preparation of the statutory financial statements of the company. Furthermore, as the nature, form and content of Annual Performance Report is determined by the WSRA, we did not evaluate the overall adequacy of the presentation of the information, which would have been required if we were to express an audit opinion under International Standards on Auditing (UK & Ireland).
The Company has presented the allocation of operating costs and assets in accordance with the accounting separation policy set out in pages 24 to 27 and its Accounting Methodology Statement published on the Company’s website on 14 July 2017. We are not required to assess whether the methods of cost allocation set out in the Methodology Statement are appropriate to the circumstances of the Company or whether they meet the requirements of the WSRA, which would have been required if we were to express an audit opinion under International Standards on Auditing (UK & Ireland).
16
Dee Valley Water Annual Performance Report 2016-17 Dee Valley Group plc

Opinion on other matters prescribed by Condition FUnder the terms of our contract we have assumed responsibility to provide those additional opinions required by Condition F in relation to the accounting records. In our opinion:
• proper accounting records have been kept by the appointee as required by paragraph 3 of Condition F; and
• the Regulatory Accounting Statements are in agreement with the accounting records and returns retained for the purpose of preparing the Annual Performance Report.
Matters on which we are required to report by exceptionWe have nothing to report in respect of the following matters where under International Standards on Auditing (UK and Ireland), we are required to report to you if, in our opinion, information in the Annual Performance Report is:
• materially inconsistent with the information in the audited Regulatory Accounting Statements; or
• apparently materially incorrect based on, or materially inconsistent with, our knowledge of the Company acquired in the course of performing our audit; or
• otherwise misleading.
In particular, we are required to consider whether we have identified any inconsistencies between our knowledge acquired during the audit and the directors’ statement that they consider the Annual Performance Report is fair, balanced and understandable and whether the Annual Performance Report appropriately discloses those matters that we communicated to the Audit Committee which we consider should be disclosed.
Other mattersThe nature, form and content of the Annual Performance Report is determined by the WSRA. It is not appropriate for us to assess whether the nature of the information being reported upon is suitable or appropriate for the WRSA’s purposes. Accordingly we make no such assessment.
Our opinion on the Regulatory Accounting Statements within the Annual Performance Report is separate from our opinion on the statutory financial statements of the Company for the year ended 31 March 2017 on which we reported on 13 July 2017, which are prepared for a different purpose. Our audit report in relation to the statutory financial statements of the Company (our “Statutory audit”) was made solely to the Company’s members, as a body, in accordance with Chapter 3 of Part 16 of the Companies Act 2006. Our Statutory audit work was undertaken so that we might state to the Company’s members those matters we are required to state to them in a statutory audit report and for no other purpose. In these circumstances, to the fullest extent permitted by law, we do not accept or assume responsibility for any other purpose or to any other person to whom our Statutory audit report is shown or into whose hands it may come save where expressly agreed by our prior consent in writing.
Deloitte LLP Manchester, United Kingdom
13 July 2017
17
Your Local Water Company

SectionOne
18
Dee Valley Water Annual Performance Report 2016-17 Dee Valley Group plc

Regulatory Financial Reporting
1A - Income Statement
1 Revenue 24.433 0.058 – 0.058 24.491
2 Operating costs (23.316) 0.037 3.087 3.124 (20.192)
3 Other operating income 2.477 (0.361) (2.072) (2.433) 0.044
4 Operating profit 3.594 (0.266) 1.015 0.749 4.343
5 Other income – 0.266 (0.030) 0.236 0.236
6 Interest income 0.347 (0.345) – (0.345) 0.002
7 Interest expense (3.369) – – – (3.369)
8 Other interest expense – 0.345 – 0.345 0.345
9 Profit before tax and fair value movements 0.572 – 0.985 0.985 1.557
10 Fair value gains/(losses) on financial instruments – – – – –
11 Profit before tax 0.572 – 0.985 0.985 1.557
12 UK Corporation tax 0.100 – 0.278 0.278 0.378
13 Deferred tax (0.399) – – – (0.399)
14 Profit for the year 0.273 – 1.263 1.263 1.536
15 Dividends (1.946) – – – (1.946)
For the 12 months ended 31 March 2017
Statutory
£m
Differences between statutory and RAG
definitions £m
Non-appointed
£m
Total adjustments
£m
total appointed
activities £m
19
Your Local Water Company

1B - Statement of comprehensive income
1 Profit for the year 0.273 – 1.263 1.263 1.536
2 Actuarial losses on post employment plans 1.153 – – – 1.153
3 Other comprehensive income – – – – –
4 Total Comprehensive income for the year 1.426 – 1.263 1.263 2.689
For the 12 months ended 31 March 2017
Statutory
£m
Differences between statutory and RAG
definitions
£m
Non-appointed
£m
Total adjustments
£m
Total appointed
activities
£m
20
Dee Valley Water Annual Performance Report 2016-17 Dee Valley Group plc

1C - Statement of financial position
A Non-current assets
1 Fixed assets 101.530 – – – 101.530
2 Intangible assets – – – – –
3 Investments - loans to group companies – 9.746 – 9.746 9.746
4 Investments - other – – – – –
5 Financial instruments – – – – –
6 Retirement benefit assets 9.845 – – – 9.845
7 Total non-current assets 111.375 9.746 – 9.746 121.121
B Current assets
8 Inventories 0.372 – – – 0.372
9 Trade & other receivables 18.455 (9.746) 6.437 (3.309) 15.146
10 Financial instruments 0.000 – – – –
11 Cash & cash equivalents 0.050 7.228 (7.277) (0.049) 0.001
12 Total current assets 18.877 (2.518) (0.840) (3.358) 15.519
C Current liabilities
13 Trade & other payables (14.260) – – – (14.260)
14 Capex creditor (0.817) – – – (0.817)
15 Borrowings – (7.228) – (7.228) (7.228)
16 Financial instruments – – – – –
17 Current tax liabilities (0.012) – (0.197) (0.197) (0.209)
18 Provisions – (0.204) – (0.204) (0.204)
19 Total current liabilities (15.089) (7.432) (0.197) (7.629) (22.718)
20 Net current assets / (liabilities) 3.788 (9.950) (1.037) (10.987) (7.199)
D Non-Current liabilities
21 Trade & other payables – – – – –
22 Borrowings (55.193) – – – (55.193)
23 Financial instruments – – – – –
24 Retirement benefit obligations – – – – –
25 Provisions – – – – –
26 Deferred income - G&C's (10.430) 0.204 – 0.204 (10.226)
27 Preference share capital (0.114) – – – (0.114)
28 Deferred tax (13.561) – – – (13.561)
29 Total non-current liabilities (79.298) 0.204 – 0.204 (79.094)
30 Net assets 35.865 0.000 (1.037) (1.037) 34.828
E Equity
31 Called up share capital 0.240 – – – 0.240
32 Retained earnings & other reserves 35.625 – (1.037) (1.037) 34.588
33 Total equity 35.865 – (1.037) (1.037) 34.828
For the 12 months ended 31 March 2017
Statutory
£m
Differences between statutory and
RAG definitions £m
Non-appointed
£m
Total adjustments
£m
Total appointed
activities £m
21
Your Local Water Company

1D - Statement of cash flows
A Statement of cashflows
1 Operating profit 3.594 (0.266) 1.015 0.749 4.343
2 Other income – 0.266 (0.030) 0.236 0.236
3 Depreciation 4.951 – – – 4.951
4 Amortisation - G&C's (0.226) – – – (0.226)
5 Changes in working capital 2.540 – 0.170 0.170 2.710
6 Pension contributions (0.296) – – – (0.296)
7 Movement in provisions – – – – –
8 Profit on sale of fixed assets (0.044) – – – (0.044)
9 Cash generated from operations 10.519 – 1.155 1.155 11.674
10 Net interest paid (3.367) – – – (3.367)
11 Tax paid (0.111) – 0.422 0.422 0.311
12 Net cash generated from operating activities 7.041 – 1.577 1.577 8.618
C Investing activities
13 Capital expenditure (8.961) – – – (8.961)
14 Grants & Contributions 0.777 – – – 0.777
15 Disposal of fixed assets 0.044 – – – 0.044
16 Other – – – – –
17 Net cash used in investing activities (8.140) – – – (8.140)
18 Net cash generated before financing activities (1.099) – 1.577 1.577 0.478
D Cashflows from financing activities
19 Equity dividends paid (1.946) – – – (1.946)
20 Net loans received (0.001) – – – (0.001)
21 Cash inflow from equity financing – – – – –
22 Net cash generated from financing activities (1.947) – – – (1.947)
23 Increase (decrease) in net cash (3.046) – 1.577 1.577 (1.469)
For the 12 months ended 31 March 2017
Statutory
£m
Differences between statutory and RAG
definitions £m
Non-appointed
£m
Total adjustments
£m
total appointed
activities £m
22
Dee Valley Water Annual Performance Report 2016-17 Dee Valley Group plc

1 Borrowings (excluding preference shares) 7.228 2.000 53.193 62.421
2 Preference share capital 0.114
3 Total borrowings 62.535
4 Cash (0.050)
5 Short term deposits –
6 Net Debt 62.485
7 Gearing 70.21%
8 Full year equivalent nominal interest cost – 0.107 3.724 3.831
9 Full year equivalent cash interest payment – 0.107 2.006 2.113
Indicative interest rates
10 Indicative weighted average nominal interest rate – 1.49% 6.75% 6.14%
11 Indicative weighted average cash interest rate – 1.49% 3.64% 3.39%
12 Weighted average years to maturity – 5.00 15.0 14.64
For the 12 months ended 31 March 2017
Interest rate risk profile Total
£m/%Fixed rate
£mFloating rate
£mIndex linked
£m
1E - Net debt analysis at 31 March 2017
23
Your Local Water Company
This Annual Performance Report has been prepared for the appointed Business of Dee Valley Water plc in accordance with guidance issued by the Water Services Regulation Authority (‘Ofwat’) for regulatory accounts suitable for regulation in the water industry. The accounting policies used are the same as those adopted in the statutory financial statements with the exceptions noted below and described on pages 24 to 27 of this report.
Basis of accounting The Company meets the definition of a qualifying entity under Financial Reporting Standard (FRS 101) ‘Reduced Disclosure Framework’ issued by the Financial Reporting Council. Accordingly, in the year ended 31 March 2017 the Company has adopted the accounting framework for FRS 101 and has, in doing so, applied the requirements of IFRS 1. These financial statements have been prepared in accordance with FRS 101, with the exception of adjustments and disclosures required to ensure compliance with the Regulatory Accounting Guidelines (‘RAGs’).
Explanation of transition to FRS 101 This is the second year that the Company has presented its financial statements under FRS 101. Previous financial statements under a previous GAAP (pre-2015 UK GAAP) were for the year ended 31 March 2015 and the date of transition to FRS 101 was therefore 1 April 2015.
Price control segments The tables in Sections 2 and 4 of this report have been prepared in accordance with the Company’s accounting separation methodology statement published on the Dee Valley Water website.
The allocation of operating costs and assets between the three relevant price controls (wholesale water, retail household and retail non-household) is consistent with the guidance in ‘RAG 2 – guideline for the classification of costs across the price controls’, published by Ofwat in April 2017.
Wherever possible it is the Company’s policy that assets and costs should be assigned directly to the appropriate business unit.
Where this is not possible methods of allocation have been adopted following the Ofwat guidance. The basis of allocation has been updated as appropriate where the Ofwat guidance has been revised in the current year, primarily to clarify the cost drivers applicable to the allocation of certain operating costs.
The creditor related to sewerage charges collected on behalf of the sewerage service providers in the Dee Valley Water area has been allocated to the non-appointed business. The related commission debtor has also been allocated to the non-appointed business.
Capitalisation policy No item with an initial cost of less than £300 shall be capitalised.
All items of capital expenditure are subject to a project approval process, during which the finance department ensures that the expenditure to be capitalised meets the appropriate accounting and regulatory guidelines and is classified appropriately.
Employee costs arising directly from the construction of property, plant and equipment are identified through an internal process and are transferred from employee benefit operating costs to fixed assets.
Regulatory Financial Accounting DisclosuresFor the year ended 31 March 2017
24
Dee Valley Water Annual Performance Report 2016-17 Dee Valley Group plc
Revenue recognition Turnover comprises amounts due in respect of water supplied to measured and unmeasured customers during the year in the normal course of business. Turnover from the supply of other goods and services is immaterial. Turnover from measured water charges includes amounts billed plus an estimate of amounts unbilled at 31 March. Revenue is stated net of VAT, where applicable.
There are no material differences between the statutory and regulatory revenue recognition policies.
Unoccupied properties Where a property is unoccupied water service charges remain payable unless the Company is requested to turn off the supply and furniture is removed. No allowances will be made retrospectively.
Where a request is received to turn off a supply, but it cannot be turned off because of joint supply issues, the Company will request confirmation that the property is vacant of furniture and that the water supply has been turned off inside the property. No further charges will be levied from this time. Where a supply can be turned off, charges will cease from the date that supply is turned off.
Unoccupied properties are routinely inspected by the Company and the billing system updated to confirm the date of inspection.
New accounts Where a property is found to be occupied, but the occupier name is unknown, a form will be left at the property asking customers to complete and return details of their occupancy. When a completed form is returned billing will commence accordingly.
Where a form is not returned the Company will carry out checks to determine occupier details (checks may include Land Registry, 192.com or electoral roll searches. Information may also be obtained from neighbours or local post offices). Once an occupier name has been established a bill will be raised. If the date of occupancy is not known charges will be levied from the start of the financial year, the date of the last void inspection or from the date the account was previously void, whichever is deemed most appropriate.
Where the Company has been unable to determine the name of the occupier, bills will be raised in the name of ‘the new occupiers’ and charges levied from the start of the financial year, the date of the last void inspection or from the date the account was previously void. As previously stated, checks will be made to establish the occupiers name and a suite of letters will also be used to initiate contact with the Company. More frequent visits will be made to properties believed to be occupied to ascertain relevant information.
In all instances, customers will be required to provide documentary evidence of the date they became responsible for water service charges before any alteration to an account will be made.
TURNOVER
25
Your Local Water Company

New properties New properties are brought on to charge upon receipt of meter fixed data provided by the Company’s Network Operations team. This data will provide the name of the person or Company responsible for charges and all meter information needed to bring the account on to charge. The address of the property will determine when bills will be raised and the meter read and a meter round number identifying this will be allocated accordingly. Charges will be levied from the date the meter is installed and billed in arrears.
Charges on income Court costs are added to customers’ accounts as incurred when it is necessary to issue court proceedings to recover outstanding debt. Solicitors’ costs are not incurred.
Court costs recharged to customers are not recognised as revenue but are deducted from the costs incurred.
Bad debt policy The Company’s policy regarding the write off of debt is detailed below. There have been no changes to the policy in the year, and no significant variation in the level of write off.
Previous Occupier - No Forwarding Address The final bill is always issued to last known address on the basis that mail could be forwarded by Royal Mail.
If debt is under £50.00 (over 1 month old) and there has been no response from issuing of the final bill the debt is written off.
26
Dee Valley Water Annual Performance Report 2016-17 Dee Valley Group plc

If the debt is greater than £50.00 the account is passed to a third party trace collection agency. Provided this service is on a ‘no trace no fee’ basis more than one agency may be used to trace the same debtor. If third parties cannot trace the debt it will be written off.
In most instances debt can be left on the system for longer than 12 months if it is believed that information can be obtained to enable the debt to be pursued.
Previous Occupier with Forwarding Address Where appropriate all debts are transferred to a current address within the Dee Valley Water plc area of supply.
All debts will go through the in-house collection cycle. If payment is not made, debts up to £50.00 will be written off as uneconomical to collect. Debts over £50.00 will be passed to a third party agency for collection. Again, several third party agencies may be used.
Only where third party collection fails will the debt be written off.
Bankruptcy/Debt Relief Orders In cases where the Company becomes aware that a customer has filed for bankruptcy or a Debt Relief Order charges will be apportioned to the date of bankruptcy/DRO and relevant paperwork completed and returned to register the debt. Following the issue of the paperwork and a final bill the outstanding debt subject to bankruptcy/DRO will be written off. Ongoing charges will be pursued in accordance with normal collection processes.
Accounting DeclarationsWe confirm in our Regulatory Accounts that:
• we have sufficient financial resources to enable the business to carry out its regulated activities, for at least the next 12 months (licence condition F6A); and
• we have produced them in compliance with paragraph 3.1 of condition K of the Instrument of Appointment.
There have been no transactions with associated companies during the year.
We hold confidential, investment grade ratings from both Standard and Poor’s and Moody’s. The ratings were first granted in 2002 and have remained unchanged since that date.
I certify that this statement is endorsed by the Board of Dee Valley Water plc.
Liv Garfield Chief Executive
For and on behalf of Dee Valley Water Plc
27
Your Local Water Company

SectionTwo
28
Dee Valley Water Annual Performance Report 2016-17 Dee Valley Group plc

2 - Price Control and Additional Segmental Reporting
2A - Segmental income statement
For the 12 months ended 31 March 2017
Retail Wholesale Total
£m
Household
£m
Non-Household
£m
Water resources
£m
Water Network+
£m
Water Total
£m
Waste water
Network+
£m
Sludge
£m
Wastewater total
£m
1 Revenue - price control 2.831 0.353 – 21.221 21.221 – – – 24.405
2Revenue - non price control
– – – 0.086 0.086 – – – 0.086
3 Operating expenditure (1.803) (0.140) (1.574) (11.724) (13.298) – – – (15.241)
4 Depreciation (0.715) (0.051) (0.111) (4.074) (4.185) – – – (4.951)
5 Amortisation – – – – – – – – –
6Other operating income
– – – 0.044 0.044 – – – 0.044
7Operating profit before recharges
0.313 0.162 (1.685) 5.553 3.868 – – – 4.343
8Recharges from other segments
– – – – – – – – –
9Recharges to other segments
– – – – – – – – –
10 Operating profit 0.313 0.162 (1.685) 5.553 3.868 – – – 4.343
11Surface water drainage rebates
–
29
Your Local Water Company

2B - Totex analysis- wholesale water and wastewater
For the 12 months ended 31 March 2017
Water Resources
£m
Water Network+
£m
Wastewater Network+
£m
Sludge
£m
Total
£m
A Operating expenditure
1 Power 0.011 1.920 – – 1.931
2 Income treated as negative expenditure – – – – –
3 Service charges/ discharge consents 0.801 – – – 0.801
4 Bulk supply/ Bulk discharge 0.003 – – – 0.003
5 Other operating expenditure 0.654 8.811 – – 9.465
6 Local authority and Cumulo rates 0.105 0.993 – – 1.098
7 Total operating expenditure excluding third party services 1.574 11.724 – – 13.298
8 Third party services – – – – –
9 Total operating expenditure 1.574 11.724 – – 13.298
C Cash Expenditure
19 Pension deficit recovery payments 0.024 0.427 – – 0.451
20 Other cash items – – – – –
B Capital Expenditure
10 Maintaining the long term capability of the assets - infra 0.001 3.523 – – 3.524
11 Maintaining the long term capability of the assets - non- infra 0.026 0.392 – – 0.418
12 Other capital expenditure - infra – 0.626 – – 0.626
13 Other capital expenditure - non-infra 1.047 2.850 – – 3.897
14 Total gross capital expenditure excluding third party services 1.074 7.391 – – 8.465
15 Third party services – – – – –
16 Total gross capital expenditure 1.074 7.391 – – 8.465
17 Grants and contributions – (0.777) – – (0.777)
18 Totex 2.648 18.338 – – 20.986
D Total cash expenditure 0.024 0.427 – – 0.451
21 Totex including cash items 2.672 18.765 – – 21.437
30
Dee Valley Water Annual Performance Report 2016-17 Dee Valley Group plc
2C - Operating cost analysis (retail)
For the 12 months ended 31 March 2017
Household £m
Non-household £m
Total £m
Operating expenditure
1 Customer services 1.212 0.075 1.287
2 Debt management 0.093 0.034 0.127
3 Doubtful debts 0.340 0.015 0.355
4 Meter reading 0.135 0.009 0.144
5 Services to developers – 0.005 0.005
6 Other operating expenditure 0.023 0.002 0.025
7 Total operating expenditure excluding third party services 1.803 0.140 1.943
8 Third party services – – –
9 Total operating expenditure 1.803 0.140 1.943
10 Depreciation - tangible fixed assets 0.715 0.051 0.766
11 Amortisation - intangible fixed assets – – –
12 Total operating costs 2.518 0.191 2.709
13 Debt written off 0.135 0.016 0.151
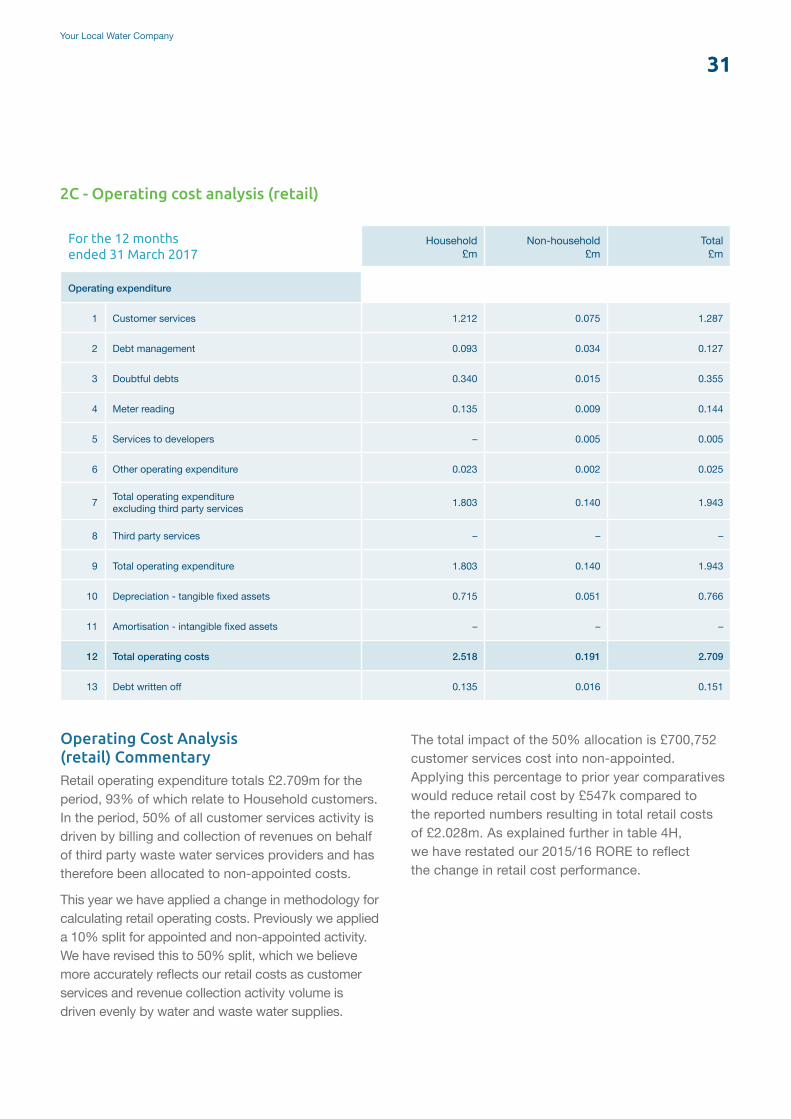
Operating Cost Analysis (retail) CommentaryRetail operating expenditure totals £2.709m for the period, 93% of which relate to Household customers. In the period, 50% of all customer services activity is driven by billing and collection of revenues on behalf of third party waste water services providers and has therefore been allocated to non-appointed costs.
This year we have applied a change in methodology for calculating retail operating costs. Previously we applied a 10% split for appointed and non-appointed activity. We have revised this to 50% split, which we believe more accurately reflects our retail costs as customer services and revenue collection activity volume is driven evenly by water and waste water supplies.
The total impact of the 50% allocation is £700,752 customer services cost into non-appointed. Applying this percentage to prior year comparatives would reduce retail cost by £547k compared to the reported numbers resulting in total retail costs of £2.028m. As explained further in table 4H, we have restated our 2015/16 RORE to reflect the change in retail cost performance.
31
Your Local Water Company

For the 12 months ended 31 March 2017
Wholesale Retail Total
£m
Water resources
£m
Water Network+
£m
Waste water Network+
£m
Sludge
£m
Household
£m
Non-Household
£m
A Cost
1 At 1 April 2016 4.461 137.594 – – 11.314 0.896 154.265
2 Disposals (0.012) (0.436) – – (0.049) (0.003) (0.500)
3 Additions 1.074 7.392 – – 0.462 0.033 8.961
4 Assets adopted at nil cost – – – – – – –
5 At 31 March 2017 5.523 144.550 – – 11.727 0.926 162.726
B Depreciation
6 At 1 April 2016 (1.293) (48.441) – – (6.489) (0.522) (56.745)
7 Disposals 0.012 0.436 – – 0.049 0.003 0.500
8 Charge for the year (0.111) (4.074) – – (0.715) (0.051) (4.951)
9 At 31 March 2017 (1.392) (52.079) – – (7.155) (0.570) (61.196)
D Depreciation charge for year
12 Principal services (0.111) (4.074) – – (0.715) (0.051) (4.951)
13 Third party services – – – – – – –
14 Total (0.111) (4.074) – – (0.715) (0.051) (4.951)
10 Net book amount at 31 March 2017 4.131 92.471 – – 4.572 0.356 101.530
11 Net book amount at 1 April 2016 3.168 89.153 – – 4.825 0.374 97.520
2D - Historic cost analysis of fixed assets
32
Dee Valley Water Annual Performance Report 2016-17 Dee Valley Group plc

For the 12 months ended 31 March 2017
Fully recognised in income statement
£m
Capitalised and amortised against
depreciation £m
Total
£m
A Grants and contributions - water
1 Connection charges (s45) – 0.218 0.218
2 Infrastructure charge receipts (s146) – 0.476 0.476
3 Requisitioned mains (s43, s55 & s56) – – –
4 Diversions (s185) – 0.083 0.083
5 Other contributions – – –
6 Total – 0.777 0.777
7 Value of adopted assets – – –
B Grants and contributions - wastewater
8 Infrastructure charge receipts (s146) – – –
9 Requisitioned sewers (s100) – – –
10 Diversions (s185) – – –
11 Other contributions – – –
12 Total – – –
13 Value of adopted assets – – –
For the 12 months ended 31 March 2017
Water
£m
Wastewater
£m
Total
£m
C Movements in capitalised grants and contributions
14 Brought forward as at 1 April 2016 10.084 – 10.084
15 Capitalised in year 0.777 – 0.777
16 Amortisation (in income statement) (0.226) – (0.226)
17 Carried forward as at 31 March 2017 10.635 – 10.635
D Land sales
18 Proceeds from disposals of protected land – – –
2E - Analysis of capital contributions and land sales (wholesale)
33
Your Local Water Company

For the 12 months ended 31 March 2017
Wholesale charges revenue
£m
Retail revenue
£m
Total revenue
£m
Number of customers
(000s)
Average household retail
revenue per customer £
1 Unmeasured water only customer 7.110 1.042 8.152 46.222 22.54
2 Unmeasured wastewater only customer – – – – –
3 Unmeasured water and wastewater customer – – – – –
4 Measured water only customer 6.919 1.789 8.708 69.028 25.92
5 Measured wastewater only customer – – – – –
6 Measured water and wastewater customer – – – – –
7 Total 14.029 2.831 16.860 115.250 24.56
2F - Household revenues by customer type
For the 12 months ended 31 March 2017
Wholesale charges revenue
£m
Retail revenue
£m
Total revenue
£m
Number of connections
(000s)
Average non-household retail
revenue per connection £
A Non-Default tariffs
1 Total non-default tariffs – – – – –
B Default tariffs
2 Tariff band 01 - Unmeasured 0.092 0.013 0.105 0.477 27.25
3 Tariff band 02 - Measured less than 50Ml 4.903 0.326 5.229 7.603 42.88
4 Tariff band 03 - Untreated measured less than 50Ml 1.929 0.009 1.938 0.017 529.41
5 Tariff band 04 - Large user – – – – –
6 Tariff band 05 - Measured 50Ml – 250 Ml 0.029 0.001 0.030 0.007 142.86
7 Tariff band 06 - Untreated measured greater than 50Ml 0.239 0.004 0.243 0.003 1,333.33
8 Total default tariffs 7.192 0.353 7.545 8.107 43.54
9 Total 7.192 0.353 7.545 8.107 43.54
C Revenue per customer
10 Total 8.107 43.54
Number of customers
(number)
Average non-household retail
revenue per customer £
2G - Non household water revenues by customer type
34
Dee Valley Water Annual Performance Report 2016-17 Dee Valley Group plc

For the 12 months ended 31 March 2017
Household £m
Non-household £m
Total £m
A Wholesale charge - water
1 Unmeasured 7.110 0.092 7.202
2 Measured 6.919 6.832 13.751
3 Third party revenue – 0.268 0.268
4 Total 14.029 7.192 21.221
B Wholesale charge - wastewater
5 Unmeasured – – –
6 Measured – – –
7 Third party revenue – – –
8 Total – – –
D Third party revenue - non-price control
14 Bulk Supplies - water 0.003
15 Bulk Supplies - wastewater –
16 Other third party revenue 0.083
C Retail revenue
10 Unmeasured 1.042 0.013 1.055
11 Measured 1.789 0.334 2.123
12 Other third party revenue – 0.006 0.006
13 Retail total 2.831 0.353 3.184
E Principal services - non-price control
17 Other appointed revenue –
18 Total appointed revenue 24.491
Water Wastewater Total
19 Wholesale revenue governed by price control 21.221 – 21.221
20 Grants & contributions 0.777 – 0.777
21 Total revenue governed by wholesale price control 21.998 – 21.998
22 Amount assumed in wholesale determination 22.455 – 22.455
23 Adjustment for in-period ODI revenue – – –
24 Adjustment for WRFIM – – –
25 Total assumed revenue 22.455 – 22.455
26 Difference (0.457) – (0.457)
9 Wholesale Total 14.029 7.192 21.221
2I - Revenue analysis & wholesale control reconciliation
35
Your Local Water Company

Revenue analysis & wholesale control reconciliation CommentaryWholesale revenue in the year is in line with allowed revenues in the Final Determination. Following a review of the inflation calculation in the 2015/16 values, correction of an error has resulted in a £0.34m additional difference in the comparative; the prior year difference was driven by lower customers and NHH volumes.
36
Dee Valley Water Annual Performance Report 2016-17 Dee Valley Group plc

SectionThree
37
Your Local Water Company

Row Unique ID Performance Commitment Unit Unit description Decimal places
2015-16 performance level - actual
2016-17 performance level - actual
2016-17 CPL met?
2016-17 reward
or penalty (in-period
ODIs)
2016-17 reward
or penalty (in-period ODIs) £m
(4 DPs)
2016-17 notional
reward or penalty
accrued
2016-17 notional
reward or penalty
accrued £m (4 DPs)
Total AMP6 reward or
penalty 31 March
2020 forecast
Total AMP6 reward or
penalty 31 March
2020 forecast £m
(4 DPs)
1 PR14DVWWSW_A1 A1: Discoloured water contacts nr No. per 1,000 population 2 1.32 1.07 Yes - Reward deadband -
2 PR14DVWWSW_A2 A2: Mean zonal compliance (MZC) % Mean zonal compliance (%) 2 99.95 99.99 No - Penalty deadband -
3 PR14DVWWSW_A3A3: Delivery of the outcomes of the Legacy water treatment works (south west Wrexham) major scheme
text Pass/fail (until completion) na Pass Pass Yes - - -
4 PR14DVWWSW_A4 A4: Delivery of the outcomes of the service reservoir water quality risk management schemes text Pass/fail (for each scheme) na Pass Pass Yes - - -
5 PR14DVWWSW_B1 B1: Average duration of interruptions - 3 hours or longer (planned and unplanned interruptions) time Hours / property / year 2 0.087 0.35 No - Penalty -0.0077 -
6 PR14DVWWSW_B2 B2: Sustainable economic level of leakage target nr Litres per property per day (l/prop/day) 1 78.4 89.0 Yes - Reward
deadband -
7 PR14DVWWSW_B3 B3: Security of supply index (SOSI) score Security of Supply Index (SOSI) 0 100 100 Yes
8 PR14DVWWSW_B4 B4: Number of bursts nr No. of burst mains per year 0 169 209 Yes - Reward deadband -
9 PR14DVWWSW_C1 C1: Gross operational greenhouse gas emissions nr tCO2e 0 9219 8385 Yes
10 PR14DVWWSW_D1 D1: Customers’ perception based on market research % % customer satisfaction na 80 77 No
11 PR14DVWNHHR_F1 F1: Non-household Service incentive mechanism (SIM) score Service incentive
mechanism (SIM) score 1 88.51 90.4 Yes - - -
12 PR14DVWHHR_E1 E1: Per capita consumption and water efficiency nr Litres per capita per day 2 134.87 135.21 No
13 PR14DVWHHR_E2 E2: Service incentive mechanism (SIM) score Service incentive mechanism (SIM) score 1 83.42 85.9 Yes - - -
3 - Performance Summary
3A - Outcome Performance TableFor the 12 months ended 31 March 2017
38
Dee Valley Water Annual Performance Report 2016-17 Dee Valley Group plc

Row Unique ID Performance Commitment Unit Unit description Decimal places
2015-16 performance level - actual
2016-17 performance level - actual
2016-17 CPL met?
2016-17 reward
or penalty (in-period
ODIs)
2016-17 reward
or penalty (in-period ODIs) £m
(4 DPs)
2016-17 notional
reward or penalty
accrued
2016-17 notional
reward or penalty
accrued £m (4 DPs)
Total AMP6 reward or
penalty 31 March
2020 forecast
Total AMP6 reward or
penalty 31 March
2020 forecast £m
(4 DPs)
1 PR14DVWWSW_A1 A1: Discoloured water contacts nr No. per 1,000 population 2 1.32 1.07 Yes - Reward deadband -
2 PR14DVWWSW_A2 A2: Mean zonal compliance (MZC) % Mean zonal compliance (%) 2 99.95 99.99 No - Penalty deadband -
3 PR14DVWWSW_A3A3: Delivery of the outcomes of the Legacy water treatment works (south west Wrexham) major scheme
text Pass/fail (until completion) na Pass Pass Yes - - -
4 PR14DVWWSW_A4 A4: Delivery of the outcomes of the service reservoir water quality risk management schemes text Pass/fail (for each scheme) na Pass Pass Yes - - -
5 PR14DVWWSW_B1 B1: Average duration of interruptions - 3 hours or longer (planned and unplanned interruptions) time Hours / property / year 2 0.087 0.35 No - Penalty -0.0077 -
6 PR14DVWWSW_B2 B2: Sustainable economic level of leakage target nr Litres per property per day (l/prop/day) 1 78.4 89.0 Yes - Reward
deadband -
7 PR14DVWWSW_B3 B3: Security of supply index (SOSI) score Security of Supply Index (SOSI) 0 100 100 Yes
8 PR14DVWWSW_B4 B4: Number of bursts nr No. of burst mains per year 0 169 209 Yes - Reward deadband -
9 PR14DVWWSW_C1 C1: Gross operational greenhouse gas emissions nr tCO2e 0 9219 8385 Yes
10 PR14DVWWSW_D1 D1: Customers’ perception based on market research % % customer satisfaction na 80 77 No
11 PR14DVWNHHR_F1 F1: Non-household Service incentive mechanism (SIM) score Service incentive
mechanism (SIM) score 1 88.51 90.4 Yes - - -
12 PR14DVWHHR_E1 E1: Per capita consumption and water efficiency nr Litres per capita per day 2 134.87 135.21 No
13 PR14DVWHHR_E2 E2: Service incentive mechanism (SIM) score Service incentive mechanism (SIM) score 1 83.42 85.9 Yes - - -
39
Your Local Water Company

3B - Sub-measure performance tableFor the 12 months ended 31 March 2017
3C - AIM Table For the 12 months ended 31 March 2017
Row Unique ID PC/sub-measure ID
PC / sub-measure Unit Decimal
places
2015-16 performance level - actual
2016-17 performance level - actual
2016-17 CPL met?
Row Abstraction site Decimal places
2016-17 AIM performance
[Ml]
2016-17 normalised AIM
performance
Cumulative AIM performance 2016-17 [Ml]
Cumulative normalised AIM
performance 2016-17
Contextual information
relating to AIM performance
Please note, this table has intentionally been left blank, as Dee Valley Water does not have any sub performance measures.
Please note, this table has intentionally been left blank, as Dee Valley Water does not have any abstraction sites.
40
Dee Valley Water Annual Performance Report 2016-17 Dee Valley Group plc

3D - SIM TableFor the 12 months ended 31 March 2017
A Qualitative performance
1 1st survey score score 2 4.38
2 2nd survey score score 2 4.36
3 3rd survey score score 2 4.54
4 4th survey score score 2 4.57
5 Qualitative SIM score (out of 75) score 2 64.88
B Quantitative performance
6 Quantitative composite score score 2 78.76
7 Quantitative SIM score (out of 25) calc 2 21.06
C SIM score
8 Total annual SIM score (out of 100) calc 0 86
Row For the 12 months ended 31 March 2017 Units Decimal places Score
41
Your Local Water Company

SectionFour
42
Dee Valley Water Annual Performance Report 2016-17 Dee Valley Group plc
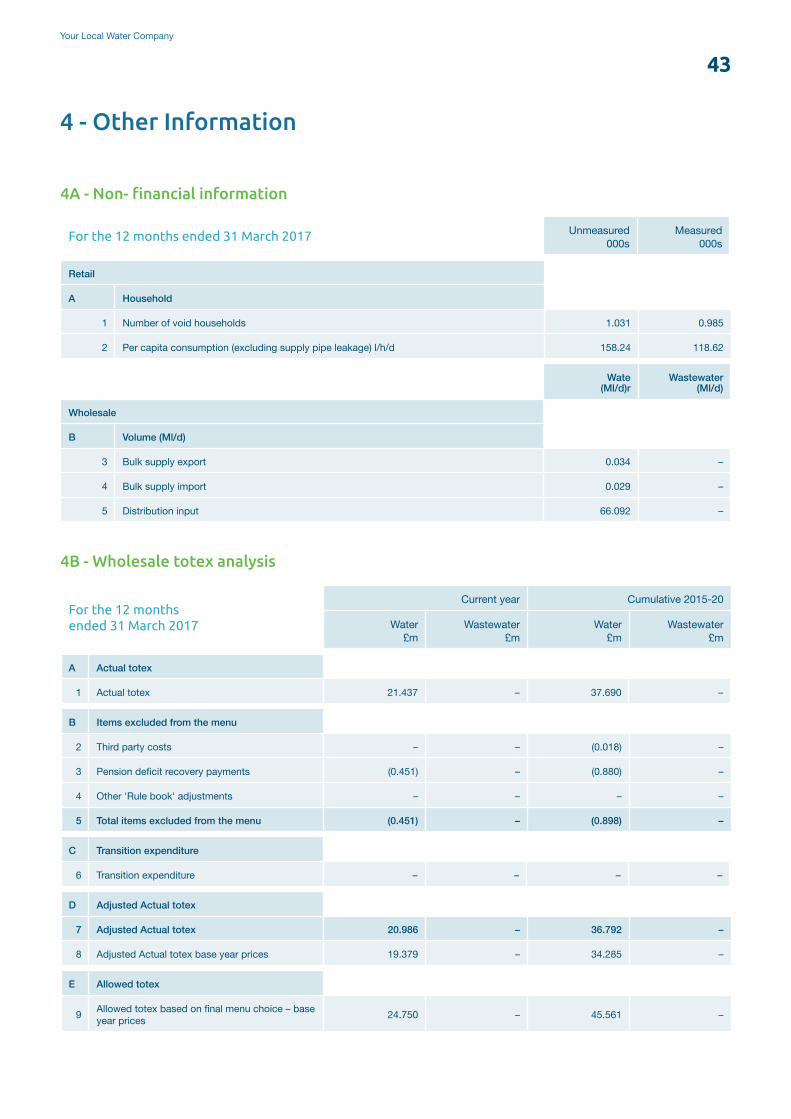
4 - Other Information
For the 12 months ended 31 March 2017 Unmeasured 000s
Measured 000s
Retail
A Household
1 Number of void households 1.031 0.985
2 Per capita consumption (excluding supply pipe leakage) l/h/d 158.24 118.62
Wate (Ml/d)r
Wastewater (Ml/d)
Wholesale
B Volume (Ml/d)
3 Bulk supply export 0.034 –
4 Bulk supply import 0.029 –
5 Distribution input 66.092 –
4A - Non- financial information
For the 12 months ended 31 March 2017
Current year Cumulative 2015-20
Water £m
Wastewater £m
Water £m
Wastewater £m
A Actual totex
1 Actual totex 21.437 – 37.690 –
B Items excluded from the menu
2 Third party costs – – (0.018) –
3 Pension deficit recovery payments (0.451) – (0.880) –
4 Other 'Rule book' adjustments – – – –
5 Total items excluded from the menu (0.451) – (0.898) –
C Transition expenditure
6 Transition expenditure – – – –
D Adjusted Actual totex
7 Adjusted Actual totex 20.986 – 36.792 –
8 Adjusted Actual totex base year prices 19.379 – 34.285 –
E Allowed totex
9 Allowed totex based on final menu choice – base year prices 24.750 – 45.561 –
4B - Wholesale totex analysis
43
Your Local Water Company

Totex in £m 15-16 (outturn prices)
15-16 (12/13 prices)
16-17 (outturn prices)
16-17 (12/13 prices)
Cumulative (12/13 prices)
Adjusted actual totex (menu) £15.8m £14.9m £21.0m £19.4m £34.3m
Totex for menu exclusions £0.4m – £0.5m – –
FD menu assumptions – £20.8m – £24.8m £45.6m
Total variance £-6.0m £-5.4m £-11.3m
Wholesale totex analysis commentaryFor the year ended 31 March 2017The PR14 final determination (FD) included total expenditure (totex) assumptions for the wholesale water service. Unlike previous price reviews, the FD did not include a breakdown by output or investment area for the entire programme. The only areas where specific investment FD assumptions were made relate to our Legacy water treatment works (WTW) and the service reservoir programme. The service reservoir programme is not material until the latter three years of the AMP and therefore this has not been reviewed in this report year. We have reviewed actual expenditure relating to the Legacy WTW to better understand variances and categorise them as either timing (delayed investment) or efficiency (finding better ways of delivering the outcomes our customers want or finding more efficient ways of delivering the same outcome).
Total cumulative expenditure is £11.3m (24.8%) lower than assumed in the FD menu. Total cumulative expenditure on Legacy is £12.1m lower than in the FD menu.
The cumulative totex in table 4B is calculated in line with the PR14 reconciliation rulebook which means it is the sum of the actual reported figures, in their respective price base. The following table sets out the cumulative variance position rebased into 12-13 prices to enable comparison with the FD. Both actual and FD values represent the menu allowance (i.e. after removing menu exclusions).
Totals may not add due to rounding.
44
Dee Valley Water Annual Performance Report 2016-17 Dee Valley Group plc

The main variance is associated with the investment to maintain drinking water quality for the population served by Legacy WTW. The breakdown of the £12.1m variance (in 12/13 prices) is set out below.
Reason for variance Cumulative £m
Efficiency (through innovative design and contract efficiencies) £-5.5m
Timing delays £-6.6m
Sub-total £-12.1m
NOTE negative represents actual spend is less than FD, positive means actual is greater than FD.
45
Your Local Water Company

For the 12 months ended 31 March 2017Water
£m
Wastewater
£m
1 RCV determined at FD at 31 March 88.993 –
2 RCV element of cumulative totex over/underspend so far in the price control period (5.416) –
3 Adjustment for ODI rewards or penalties – –
4 Projected 'shadow' RCV 83.577 –
4C - Forecast impact of performance on RCV
46
Dee Valley Water Annual Performance Report 2016-17 Dee Valley Group plc

For the 12 months ended 31 March 2017
Water resources Network+ Total
£m
Abstraction licences
£m
Raw water abstraction
£m
Raw water transport
£m
Raw water storage
£m
Water treatment
£m
Treated water
distribution £m
A Operating expenditure1 Power – 0.011 0.679 – 0.935 0.306 1.9312 Income treated as negative expenditure – – – – – – –3 Abstraction charges 0.801 – – – – – 0.8014 Bulk supply 0.003 – – – – – 0.0035 Other operating expenditure – 0.654 0.230 0.026 3.851 4.704 9.4656 Local authority and Cumulo rates – 0.105 0.025 – 0.071 0.897 1.098
7 Total operating expenditure excluding third party services 0.804 0.770 0.934 0.026 4.857 5.907 13.298
B Capital Expenditure
10 Maintaining the long term capability of the assets - infra – 0.001 0.146 – 0.003 3.374 3.524
11 Maintaining the long term capability of the assets - non-infra – 0.026 0.033 – 0.104 0.255 0.418
12 Other capital expenditure - infra – – (0.001) – – 0.627 0.62613 Other capital expenditure - non-infra – 1.047 0.021 – 0.425 2.404 3.897
14 Total gross capital expenditure (excluding third party) – 1.074 0.199 – 0.532 6.660 8.465
15 Third party services – – – – – – –16 Total gross capital expenditure – 1.074 0.199 – 0.532 6.660 8.46517 Grants and contributions – – – – – (0.777) (0.777)18 Totex 0.804 1.844 1.133 0.026 5.389 11.790 20.986
Water resources Network+
Abstraction licences
Raw water abstraction
Raw water transport
Raw water storage
Water treatment
Treated water
distribution
D Unit cost information (operating expenditure)
22 Licenced volume available MI 39406.16023 Volume abstracted MI 24304.98524 Volume transported MI 24304.98525 Average volume stored MI 1547.500
26 Distribution input volume - water treatment MI 24123.580
27 Distribution input volume - treated water MI 24123.580
28 Unit cost £/MI 20.403 31.681 38.428 16.801 201.338 244.86429 Population 000s 261.770 261.770 261.770 261.770 261.770 261.77030 Unit cost £/pop 3.071 2.942 3.568 0.099 18.554 22.566
C Cash Expenditure19 Pension deficit recovery payments – 0.024 0.007 0.001 0.130 0.289 0.45121 Totex including cash items 0.804 1.868 1.140 0.027 5.519 12.079 21.437
8 Third party services – – – – – – -9 Total operating expenditure 0.804 0.770 0.934 0.026 4.857 5.907 13.298
4D - Wholesale totex analysis (water)
47
Your Local Water Company

For the 12 months ended 31 March 2017
Household unmeasured Household measured Total
£m
Water only £m
Wastewater only £m
Water and wastewater
£m
Total
£m
Water only £m
Wastewater only £m
Water and wastewater
£m
Total
£m
A Operating expenditure
1 Customer services 0.467 – – 0.467 0.745 – – 0.745 1.212
2 Debt management 0.049 – – 0.049 0.044 – – 0.044 0.093
3 Doubtful debts 0.271 – – 0.271 0.069 – – 0.069 0.340
4 Meter reading – – – – 0.135 – – 0.135 0.135
5 Other operating expenditure 0.009 – – 0.009 0.014 – – 0.014 0.023
6Total operating expenditure excluding third party services
0.796 – – 0.796 1.007 – – 1.007 1.803
7 Third party services – – – – – – – – –
8 Total operating expenditure 0.796 – – 0.796 1.007 – – 1.007 1.803
9 Depreciation 0.287 – – 0.287 0.428 – – 0.428 0.715
10 Amortisation – – – – – – – – –
11 Total operating costs 1.083 – – 1.083 1.435 – – 1.435 2.518
BDemand-side efficiency and customer-side leaks analysis - Household
£m
12Demand-side water efficiency - gross expenditure
0.012
13Demand-side water efficiency - expenditure funded by wholesale
–
14Demand-side water efficiency - net retail expenditure
0.012
15 Customer-side leak repairs - gross expenditure 0.074
16Customer-side leak repairs - expenditure funded by wholesale
–
17 Customer-side leak repairs - net retail expenditure 0.074
4F - Operating cost analysis (household retail)
48
Dee Valley Water Annual Performance Report 2016-17 Dee Valley Group plc

For the 12 months ended 31 March 2017
Water £m
Wastewater £m
Total £m
1 Revenue 21.307 – 21.307
2 Operating expenditure (13.298) – (13.298)
3 Capital maintenance charges (5.914) – (5.914)
4 Other operating income 0.044 – 0.044
5 Current cost operating profit 2.139 – 2.139
6 Other income 0.236 – 0.236
7 Interest income 0.002 – 0.002
8 Interest expense (3.369) – (3.369)
9 Other interest expense 0.345 – 0.345
10 Current cost profit before tax and fair value movements (0.647) – (0.647)
11 Fair value gains/(losses) on financial instruments – – –
12 Current cost profit before tax (0.647) – (0.647)
4G - Wholesale current cost financial performance
49
Your Local Water Company

For the 12 months ended 31 March 2017 Units DPs MetricFor the 12 months ended 31 March 2017 Units DPs Metric
A Financial indicators
1 Net debt £m 3 63.800
2 Regulated equity £m 3 23.801
3 Regulated gearing % 2 72.83%
4 Post tax return on regulated equity % 2 -6.28%
5 RORE (return on regulated equity) % 2
6 Dividend yield % 2 3.51%
7 Retail profit margin - Household % 2 1.00%
8 Retail profit margin - Non household % 2 2.00%
9 Credit rating n/a n/a Baa1
10 Return on RCV % 2 2.40%
11 Dividend cover dec 2
12 Funds from operations (FFO) £m 3 3.171
13 Interest cover (cash) dec 2
14 Adjusted interest cover (cash) dec 2
15 FFO/Debt dec 2 0.05
16 Effective tax rate % 2
17 RCF £m 3 2.334
18 RCF/capex dec 2 0.27
A Financial indicators
1 Net debt £m 3 62.485
2 Regulated equity £m 3 26.508
3 Regulated gearing % 2 70.21%
4 Post tax return on regulated equity % 2 8.62%
5 RORE (return on regulated equity) % 2 8.80%
6 Dividend yield % 2 7.34%
7 Retail profit margin - Household % 2 1.86%
8 Retail profit margin - Non household % 2 2.15%
9 Credit rating n/a n/a Baa1
10 Return on RCV % 2 6.00%
11 Dividend cover d.p 2 0.79
12 Funds from operations (FFO) £m 3 5.908
13 Interest cover (cash) d.p 2 2.89
14 Adjusted interest cover (cash) d.p 2 1.46
15 FFO/Debt d.p 2 0.09
16 Effective tax rate % 2 21.31%
17 Free cash flow (RCF) £m 3 3.962
18 RCF/capex d.p 2 0.44
B Revenue and earnings
19 Revenue (actual) £m 3 24.405
20 EBITDA (actual) £m 3 6.624
B Revenue and earnings
19 Revenue (actual) £m 3 24.405
20 EBITDA (actual) £m 3 9.164
C Borrowings
21 Proportion of borrowings which are fixed rate % 2 13.49%
22 Proportion of borrowings which are floating rate % 2 0.00%
23 Proportion of borrowings which are index linked % 2 86.51%
24 Proportion of borrowings due within 1 year or less % 2
25 Proportion of borrowings due in more than 1 year but no more than 2 years % 2
26 Proportion of borrowings due in more than 2 years but but no more than 5 years % 2
27 Proportion of borrowings due in more than 5 years but no more than 20 years % 2
28 Proportion of borrowings due in more than 20 years % 2
C Borrowings
21 Proportion of borrowings which are fixed rate % 2 11.74%
22 Proportion of borrowings which are floating rate % 2 3.20%
23 Proportion of borrowings which are index linked % 2 85.06%
24 Proportion of borrowings due within 1 year or less % 2 14.94%
25 Proportion of borrowings due in more than 1 year but no more than 2 years % 2 –
26 Proportion of borrowings due in more than 2 years but but no more than 5 years % 2 –
27 Proportion of borrowings due in more than 5 years but no more than 20 years % 2 85.06%
28 Proportion of borrowings due in more than 20 years % 2 –
4H - Financial metrics 4H - Financial metrics
50
Dee Valley Water Annual Performance Report 2016-17 Dee Valley Group plc

4I - Financial derivatives 4I - Financial derivatives
For the 12 months ended 31 March 2017
Nominal value by maturity (net) Total value Total accretion
Interest rate (weighted average)
“1 to 2 years”
£m
“2 to 5 years”
£m
Over 5 years
£m
“Nominal value (net)”
£m
“Mark to Market”
£m
£m
Payable
%
Receivable
%
AInterest rate swap (sterling)
1 Floating to fixed rate – – – – – – – –
2 Floating from fixed rate – – – – – – – –
3 Floating to index linked – – – – – – – –
4 Floating from index linked – – – – – – – –
5 Fixed to index-linked – – – – – – – –
6 Fixed from index-linked – – – – – – – –
7 Total – – – – – –
BCross currency swaps
8 USD – – – – – – – –
9 EUR – – – – – – – –
10 YEN – – – – – – – –
11 Other – – – – – – – –
12 Total – – – – – –
COther financial derivatives
13Other financial derivatives
– – – – – – – –
14 Total – – – – – –
16 Total financial derivatives – – – – – –
Please note, this table has intentionally been left blank, as Dee Valley Water has no financial derivatives.
51
Your Local Water Company

Current Tax ReconciliationA reduction in the UK corporation tax rate from 20% to 17% (effective from 1 April 2020) was substantively enacted on 6 September 2016. The deferred tax liability at 31 March 2017 was calculated based on the rate of 17% substantively enacted at the balance sheet date. This has resulted in an overall deferred tax credit in the income statement.
The current tax charge for the year ended 31 March 2017 is lower than the standard rate of corporation tax in the UK.
The differences to the standard rate of corporation tax and the reconciliation to the current tax charge allowed in price limits are outlined in the below table:
The appointed current tax charge for the appointed business is lower than the total tax charge allowed in price limits due to the net impact of the following:
• Profit before tax is lower than FD primarily due to higher staff costs following additional recruitment to support delivery of key commitments, alongside reduced revenues as a result of lower customer tariffs. In addition, asset revaluations have driven additional depreciation costs
• Expenditure that is not deductible for tax purposes has decreased from the level assumed within the FD tax charge as no restriction has been made in respect of the company’s capital structure.
• Unrelieved losses brought forward from previous years have reduced the tax charge.
• Capital allowances within the appointed business are lower than the level forecast within the FD due mainly to delays in expenditure on the Legacy Treatment Works.
• The prior year adjustment within the appointed business of £710,000 reflects the over provision of the tax charge in prior years.
Factors that will impact future tax charges will include:
• Planned reductions in corporation tax rates; and
• Any changes in tax legislation or practice not reflected in the FD.
Tax StrategyBackground Finance Act 2016 introduced a requirement for certain businesses in the UK to publish their approach to the management of UK taxes. The requirement applies to periods beginning on or after 15th September 2016. The required publication date for Dee Valley Water is 31 March 2018.
This is an interim statement on behalf of the Appointed Business. Although it reflects the requirements of the publication standard, it is not a substitute for the Group’s forthcoming statutory publication.
Our Approach to TaxWe are committed to managing our tax affairs in a responsible manner. This means paying the right amount of tax at the right time in compliance with UK tax rules and acting in accordance with the values set out in our corporate responsibility framework.
Our approach to tax is overseen by the Severn Trent Plc board and is governed by the following principles:
• We will manage our tax affairs responsibly, in a manner consistent with our objective of being the most trusted water company;
• We will not undertake aggressive tax planning or any planning not otherwise in support of business requirements;
Other Regulatory Disclosures
Actual
£m
FD
£m
Variance
£mProfit on ordinary activities before tax 1.557 2.838 (1.281)
Tax at the standard UK corporation tax rate of 20% 0.312 0.568 (0.255)
Tax effect of expenditure not deductible in determining taxable profits
0.004 0.365 (0.361)
Utilisation of losses brought forward (0.097) 0.000 (0.097)
Capital allowances in excess of depreciation 0.241 (0.074) 0.315
Other temporary differences (0.128) (0.521 ) 0.393
Current tax charge before prior year adjustments 0.332 0.337 (0.005)
Prior year adjustment (0.710) 0.000 (0.710)
Current tax charge after prior year adjustments (0.378) 0.337 (0.715)
52
Dee Valley Water Annual Performance Report 2016-17 Dee Valley Group plc

Reported 2015/16
%
Changes arising from Ofwat
guidance
%
Restatement of retail
methodology
%
Restated 2015/16
%
2016/17
%
AMP6 to Date
%
Base return 5.8% 5.8% 5.8% 5.8%
Totex outperformance 0.5% -0.4% 0.1% 5.5% 2.8%
Retail cost performance 0.0% -0.1% 1.6% 1.5% 0.6% 1.1%
RCV run off performance 0.0% -0.2% -0.2% -0.5% -0.3%
ODI outperformance 0.1% 0.1% 0.0% 0.0%
Financing outperformance -1.4% 0.5% -0.9% -0.3% -0.6%
Regulatory return for the year 5.0% -0.2% 1.6% 6.4% 11.1% 8.8%
• We will make use of widely claimed incentives that Government has chosen to make available to encourage investment;
• We will maintain an open, transparent and collaborative relationship with HMRC consistent with our objective of being a low risk and responsible taxpayer and maintaining our good working relationship
In accordance with Plc group risk management procedures, tax risks are monitored throughout the year. If a material uncertainty is identified, external advice may be sought to ensure that our interpretation of the relevant UK tax rules is appropriate. Alternatively, we may seek to resolve an uncertain tax position directly with HMRC at the time of filing. Any significant tax risk is overseen by the Group’s Audit Committee.
In maintaining a good working relationship with HMRC, we seek to ensure that HMRC are kept up to date with business developments, including any transactions with potentially significant tax implications. When queries arise, these are managed on the basis of full disclosure.
Differences between statutory and RAG DefinitionsIncome statement
Amounts classified as other operating income in the statutory accounts have been reclassified to Revenue or Other income where specifically required by the RAGs.Statement of Financial Position
Intra-group loans have been reclassified from Trade and other receivables to Investments.
After allocating cash to the non-appointed business the balance remaining is a liability and this has been reclassified to borrowings.
Grants and contributions falling due within one year have been reclassified to current liabilities.
Return on Regulated Equity (RORE) StatementMovements in RORE against the price review base
The return on regulated equity (RoRE) has been calculated in accordance with RAG 3.14 and the recent guidance provided by Ofwat. The additional guidance has resulted in reducing our 2015/16 reported RoRE by 0.2% to 4.8%.
In addition as explained in table 2C, during the year we have changed the methodology for allocating retail costs between retail and non-appointed. Applying the methodology change to retail performance for 2015/16 results in improving the retail cost component of RoRE by 1.6% as shown in the following table.
53
Your Local Water Company

Totex performance For 2016/17, total wholesale totex of £19.4m (adjusted for menu exclusions) in 2012/13 prices is £5.4m lower than assumed in the FD. An adjustment for timing delays relating to the Legacy water treatment works has been made to the profile of spend assumed in the FD as explained in table 4B (wholesale totex analysis). Totex outperformance of £1.6m after adjusting for customer sharing and tax is recognised in RoRE.
Retail cost performance Total retail cost performance after adjusting for tax results in outperformance of £0.2m. As mentioned above and in table 2C, we have also restated our 2015/16 performance for the methodology change in the allocation of retail costs so that it is on a consistent basis with the performance reported on retail costs in this year.
RCV run off performance The RCV run off impact on RoRE is calculated by comparing the difference in depreciation from spending above or below allowed expenditure. As explained in table 4B, as a result of timing delays and the efficiencies achieved, cumulative expenditure is £11.3m lower than the FD, resulting in depreciation being lower than was assumed in the FD.
ODI performanceODI performance is based on the notional penalty of £0.01m relating to our overall performance on supply interruptions for the year.
Financing performance Compared to the prior year our real cost of debt has fallen by 0.5%, reducing the variance to the cost of debt assumed in the FD (2.6%) to 0.2%.
Transactions with associates and the non-appointed businessTransactions to be disclosedSupplementary disclosures
Year ended 31 March 2017
Information in respect of transactions during the year with any other business or activity of the appointee or any associated company a) Borrowings and intercompany lending
Sums borrowed and repaid by the appointee during the year from associated companies were as disclosed in the table below:
b) Transfer of assets/liabilities, omissions, waivers, guarantees
There were no transfers of assets or liabilities to associated companies, no guarantees were issued in favour of associated companies. There were no rights omitted to be exercised resulting in a reduction in the value of net assets of the company and no waivers of any consideration, remuneration, or any other payment receivable by the company.c) Supply of services
There were no services supplied by the appointee to associated companies or supplied to the appointee by associated companies.d) Group relief charges for tax losses
No group relief was claimed from, or surrendered to, other group companies in the year.
Amounts paid or
received £m
Interest rates
Balance as at 31 March
2017 £m
Severn Trent
Water Limited
Received 55.167 3.635% Receivable 55.167
54
Dee Valley Water Annual Performance Report 2016-17 Dee Valley Group plc


Dee Valley Group plc Packsaddle Wrexham Road Rhostyllen Wrexham LL14 4EH Registered in England and Wales Registered number 04316684