deep integrative analysis for survival...
TRANSCRIPT
Deep Integrative Analysis for Survival Prediction
Chenglong Huang, Albert Zhang and Guanghua Xiao
Colleyville Heritage High School, Colleyville, TX, 76034, USAHighland Park High School, Dallas, TX, 75205, USA
Department of Clinical Science, The University of Texas Southwestern Medical Center,Dallas, TX, 75390, USA
Survival prediction is very important in medical treatment. However, recent leading re-search is challenged by two factors: 1) the datasets usually come with multi-modality; and2) sample sizes are relatively small. To solve the above challenges, we developed a deepsurvival learning model to predict patients’ survival outcomes by integrating multi-viewdata. The proposed network contains two sub-networks, one view-specific and one commonsub-network. We designated one CNN-based and one FCN-based sub-network to efficientlyhandle pathological images and molecular profiles, respectively. Our model first explicit-ly maximizes the correlation among the views and then transfers feature hierarchies fromview commonality and specifically fine-tunes on the survival prediction task. We evaluateour method on real lung and brain tumor data sets to demonstrate the effectiveness of theproposed model using data with multiple modalities across different tumor types.
Keywords: Survival Prediction, Integrative Analysis, Deep Learning
1. Introduction
Survival analysis aims at modeling the time that will elapse from the present to the occurrenceof a certain event of interest (e.g. biological death). The prognostic models generated bysurvival analysis can be used to explore interactions between prognostic factors in certaindiseases, and also predict how a new patient will behave in the context of known data. Insurvival analysis, the Cox proportional hazards model1 and parametric survival distributions2
have long been used as important fundamental techniques. Clinicians and researchers usuallyapply these models to test for significant risk factors affecting survival. In order to handlethe high-dimensional data, dimension reduction and penalized regression have been proposedin the Cox model.3–7 However, the Cox model and its extensions are still built based onthe assumption that a patient’s risk is a linear combination of covariates. The parametriccensored regression approaches2,8 are highly dependent on the choice of the distribution. Infact, there are too many complex interactions that can affect the event (death) in variousways, and thus a more comprehensive survival model is needed to better fit data in real-worldapplications. To formulate the survival problem without any additional hypothesis, Li et al.modeled the prediction problem as standard multi-task learning using an additional indicatormatrix.9 However, the number of tasks corresponds to the maximum follow-up time of all theinstances. In fact, recent cancer datasets are collecting patient electronic health records (EHR)with a very long follow-up time. Another limitation for existing survival models is that theymainly focus on one view and cannot efficiently handle multi-modalities data. Since morecomprehensive multi-source data are available to health-care research, a powerful survival
© 2017 The Authors. Open Access chapter published by World Scientific Publishing Company and distributed under the terms of the Creative Commons Attribution Non-Commercial (CC BY-NC) 4.0 License.
Pacific Symposium on Biocomputing 2018
343
analysis that can learn from those multi-view data is required.One good way to learn highly complex survival functions is by using recent neural net-
work techniques.10–12 Katzman et al. proposed a deep fully-connected network (DeepSurv)to represent the nonlinear risk function.10 They demonstrated that DeepSurv outperformedthe standard linear Cox proportional hazard model. However, DeepSurv is still too simpleto handle real cancer data. First, real datasets contain complex imaging and genomic datafrom different views. Although using multiple pieces of information can provide complemen-tary characterizations of tumors at different levels, the view discrepancy and heterogeneitywill bring challenges for survival prediction. Second, compared to computer vision applica-tions, survival prediction problems only provide a very small training set due to the cost ofmultiple comprehensive data collections. To integrate multiple modalities and eliminate viewvariations, a good solution is to learn a joint embedding space in which different modalitiescan be compared directly. Such an embedding space will benefit the survival analysis sincerecent studies have suggested that common representation from different modalities providesimportant information for prognosis.13,14 For example, molecular profiling data and patholog-ical images actually share representations to describe the same event in tumor growth, whichis very important for diagnosis. Stromal tissue has been verified to have a surprising role inpredicting the overall survival of breast cancer patients.13 The proportion of stromal cells cor-related with the overexpression of genes, including FBLN1, FBLN2, COL6A2 and COL6A3,that encode extracellular matrix proteins .14
... ...
... ...
Common Representation
...
X Y
Survival Loss
1f
cg
2f
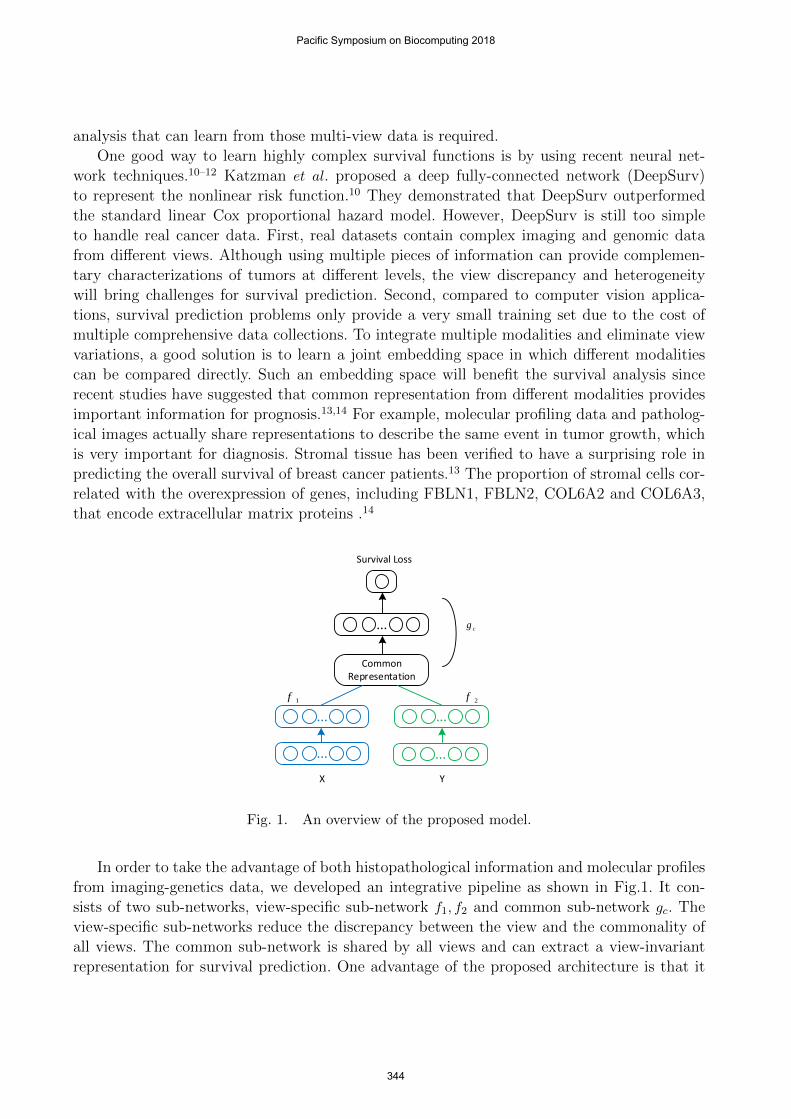
Fig. 1. An overview of the proposed model.
In order to take the advantage of both histopathological information and molecular profilesfrom imaging-genetics data, we developed an integrative pipeline as shown in Fig.1. It con-sists of two sub-networks, view-specific sub-network f1, f2 and common sub-network gc. Theview-specific sub-networks reduce the discrepancy between the view and the commonality ofall views. The common sub-network is shared by all views and can extract a view-invariantrepresentation for survival prediction. One advantage of the proposed architecture is that it
Pacific Symposium on Biocomputing 2018
344
has good generality, since the network can handle any kind of data sources with well-designedview-specific sub-networks. Motivated by recent deep learning methods,15,16 we proposed Con-volutional Neural Networks (CNNs) and Fully Connected Networks (FCNs) to learn deeprepresentations from pathological images and molecular profiling data, respectively.
To handle multi-modalities data, we integrate outputs of two networks into a commonspace where the two modalities have maximal correlation. The primary motivation of usingsuch a model is to eliminate the view variations and find the maximum correlated represen-tation from the views of pathological images and molecular data. Although the commonalityof two views reduces the view-discrepancy, it still cannot guarantee that the common space isdirectly associated with survival outcomes. To address this issue, the proposed model transfersfeature hierarchies from such common spaces and specifically fine-tunes on the survival regres-sion task. This will not only help to avoid over-fitting, but also accelerates the model training.Moreover, it has the ability to discover important markers that cannot be found by previousdeep correlational learning methods, which will benefit the survival prediction. The contri-bution of this paper can be summarized as: 1) We proposed a deep learning approach whichcan model very complex view distributions and learn good estimators for predicting patients’survival outcomes with insufficient training samples. 2) Our model used CNNs to represen-t much more abstract features from pathological images for survival prediction. Traditionalsurvival models usually adopted hand-crafted imaging features. 3) Extensive experiments onTCGA-LUSC and GBM demonstrate that the proposed model can achieve better predictionsacross different tumor types.
2. Related Work
In this section, we give a brief survey on recent survival analysis methods with basic notationsand then briefly review recent deep multi-modal embeddings.
2.1. Survival Analysis
Survival analysis aims to analyze the expected duration of time until events happen. It coversmany topics as the event can be defined very broadly such as failure in mechanical systemsand death in biological organisms. Survival analysis tries to find the answer of questions like:how does the proportion of a population survive past a certain time (e.g. 5 years)? what ratewill they die or fail? Given a set of N patients, {xi}, i = 1 . . . N , each patient has the label(ti, δi) indicating the survival status where ti is the observed time, δi is the indicator: 1 is for auncensored instance (death event happens during the study), and 0 is for a censored instance(death not observed). If and only if ti = min(Oi, Ci) can be observed during the study, thedataset is said to be right-censored.17
In Survival Analysis, the survival function S(t|x) = Pr(O ≥ t|x) is used to identify theprobability of being still alive at time t where x = (x1, ...xp)
ᵀ is the covariates of dimension p.The hazard function is defined as
h(t|x) = lim4t→0
Pr(t ≤ O ≤ t+4t|O ≥ t;x)
4t, (1)
Pacific Symposium on Biocomputing 2018
345
which assesses the instantaneous rate of failure at time t. In the modeling methods, Coxproportional hazard model1 is among the most popular one. The hazard function for the Coxproportional hazard model has the form
h(t|xi) = h0(t) exp(βᵀx) (2)
where β = (β1, ..., βp)ᵀ is a vector of regression parameters, and h0(t) is the baseline hazard. We
can define f(x) = βᵀx as a risk function. This gives the hazard rate at time t for the patient iwith covariate vector xi.
A major challenge is that the number of features p is much larger than the numberof patients n. To handle high-dimensional data, many feature selection methods have beenadapted to the Cox regression setting for censored survival data.3–7,18 Another type of hazardmodel is estimated by logistic regression such that the probability of surviving beyond t isPr(O ≥ t|x) = (1 + exp[x>β(t) + th])−1 with a threshold th.19,20 Instead of defining the hazardfunction, one recent work transforms the original survival analysis problem into a multi-tasklearning problem by decomposing the regression component into related classification tasks;the new objective function can be solved by popular ADMM based optimization.9 It is agood way to learn highly complex survival functions by using the advanced neural networkstechniques.10,12 We can get the risk score through neural networks and now denote the riskfor the patient i as oi. Deepsurv10 is the earlier attempt to learn a nonlinear risk function byreplacing the linear part βTx in f(x) with a nonlinear deep fully connected network.
One very simple way for data fusion is to create a concatenated feature vector comprising ofall features selected individually from each modality.21 However, a powerful feature selectionis required to search for those important biomarkers from the original features, and eachmodality is processed individually without considering their inter-connections. The inherentchallenge in combining data streams for survival analysis is that individual data sources arevery heterogeneous due to the heterogeneity of tumors. However, recent studies have shownthat different views actually share common representations to describe tumor morphology,which is very important for diagnosis.14 A key challenge for survival analysis is how to eliminateview-discrepancies and learn such common representations.
2.2. Deep multi-modal embeddings
Recent deep multi-modal embeddings22–26 provide a very good solution to the above chal-lenge. They have been successfully applied in computer vision applications such as image-textmatching23,26 and image reconstruction utilizing multiple auto-encoders.24,25
In finding a correlated meta-space for data fusion, recent DNN-based multi-view methodsprovide very complex representation learning using deep neural networks (DNNs) that maxi-mizes signals which are common to data from multiple modalities. They can learn much morecomprehensive representation and more easily process large amounts of training data. How-ever, these methods belong to unsupervised feature learning, which is incapable of survivalanalysis since it cannot guarantee that the integrated feature space is highly associated withpatients’ survival outcome. In addition, recent cancer datasets cannot provide multi-modalitiesdata with sufficient patient samples, while deep multi-modal embeddings need large amountsof data.
Pacific Symposium on Biocomputing 2018
346
3. Methodology
Pathological Images
Molecular Data(Protein, CNV,...)
Deep Correlational Survival Model (DeepCorrSurv)
X
Y
1f
2f
cg
O OL
Smooth C-index OL
32@7x7, st=332@5x5, st=2 32@3x3, st=2
32@1x1
128@1x1
32@1x1
32@1x1 16@1x1
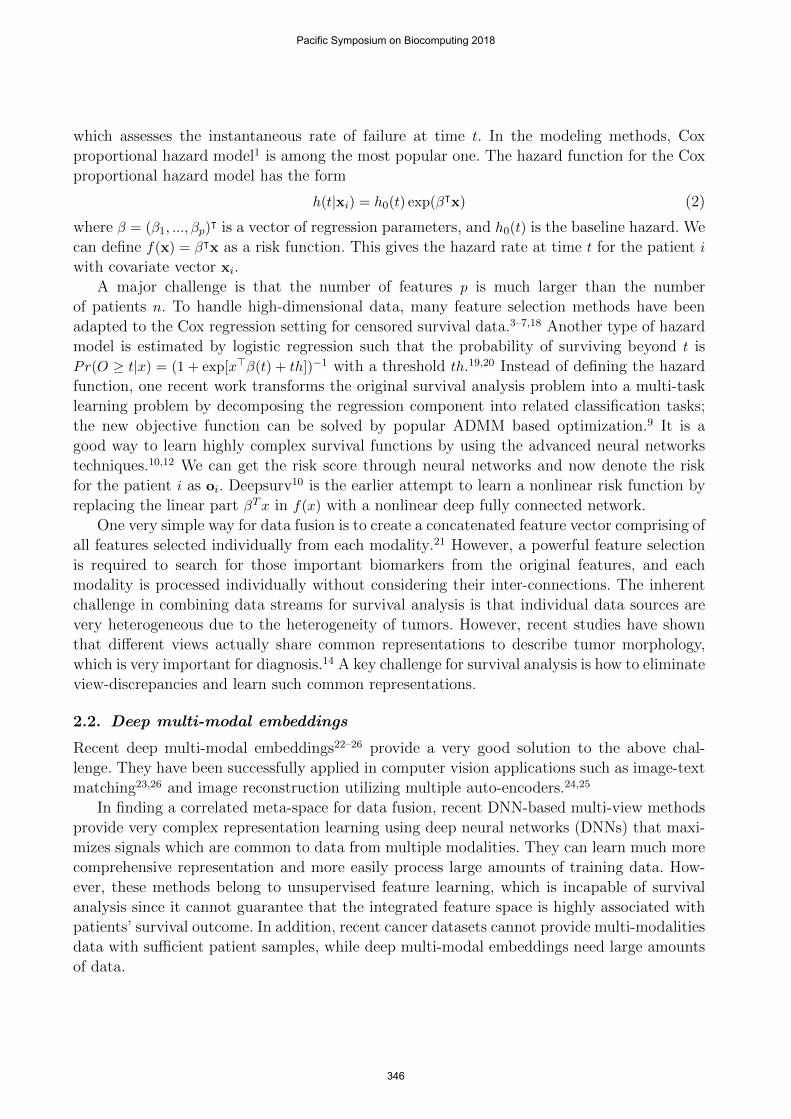
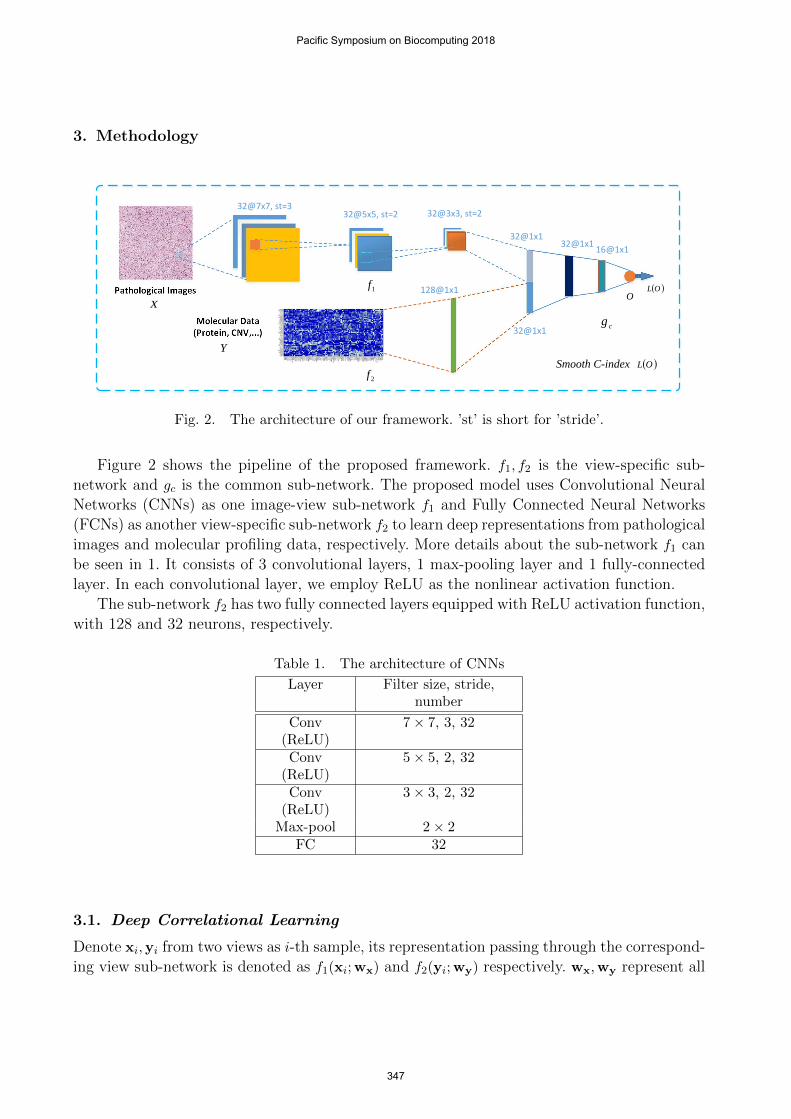
Fig. 2. The architecture of our framework. ’st’ is short for ’stride’.
Figure 2 shows the pipeline of the proposed framework. f1, f2 is the view-specific sub-network and gc is the common sub-network. The proposed model uses Convolutional NeuralNetworks (CNNs) as one image-view sub-network f1 and Fully Connected Neural Networks(FCNs) as another view-specific sub-network f2 to learn deep representations from pathologicalimages and molecular profiling data, respectively. More details about the sub-network f1 canbe seen in 1. It consists of 3 convolutional layers, 1 max-pooling layer and 1 fully-connectedlayer. In each convolutional layer, we employ ReLU as the nonlinear activation function.
The sub-network f2 has two fully connected layers equipped with ReLU activation function,with 128 and 32 neurons, respectively.
Table 1. The architecture of CNNs
Layer Filter size, stride,number
Conv(ReLU)
7× 7, 3, 32
Conv(ReLU)
5× 5, 2, 32
Conv(ReLU)
3× 3, 2, 32
Max-pool 2× 2FC 32
3.1. Deep Correlational Learning
Denote xi,yi from two views as i-th sample, its representation passing through the correspond-ing view sub-network is denoted as f1(xi;wx) and f2(yi;wy) respectively. wx,wy represent all
Pacific Symposium on Biocomputing 2018
347
parameters of the two sub-networks. The outputs of the two branches will be connected to acorrelation layer to form the common representation.
In the correlational layer, deep correlational learning tries to find pairs of projections thatmaximize the correlation of two outputs from each network f1(xi;wx), f2(yi;wy). If wx,wy
represent all parameters of two networks, then the commonality is enforced by maximizingthe correlation between two views as
L = corr(X,Y) =
∑mi=1(f1(xi)− f1(X))(f2(yi)− f2(Y))√∑m
i=1(f1(xi)− f1(X))2∑m
i=1(f2(yi)− f2(Y))2, (3)
where networks’ parameters wx,wy are omitted in the loss function (3). We can maximize thecorrelation loss function to generate the shared representation indicating the most correlatedfeatures from two modalities. Although different views of patients’ data are very heterogeneous,there still share some common information for survival prediction. Correlational learning pro-vides a very good way to find such common representation using the correlation function (3).However, it belongs to unsupervised learning and thus this procedure has a risk of losing thediscriminant markers for predicting patients’ survival outcomes.
3.2. Survival prediction with smooth C-index loss function
Denote O = [o1, ..., oN ]> as the outputs of common sub-network gc, i.e., oi = gc(zi). The finalmodel will be fine-tuned on the survival prediction task using the knowledge from the deepcorrelational learning. This will give the proposed model the ability to discover importantmarkers that are ignored by the correlational model, and learn the best representation forsurvival prediction. Different from the use of negative log partial likelihood as survival loss inrecent deep survival learning,11 we propose to minimize the smoothed empirical risk function27
which is from the concordance index (C-index) estimator and differentiable with respect tothe predictor oi.
During the past few decades, the C-index, a general discrimination measure for the e-valuation of prediction models, has gained enormous popularity in biomedical research. Theconcordance index (C-index) quantifies the ranking quality of rankings and is calculated as
c = P (oi > oj |Ti < Tj) (4)
where Ti, Tj and oi, oj are the event times and the predicted risk values. The C-index measureswhether large values of o are associated with short survival times T and vice versa. Uno et al.proposed a modified C-index estimation as follows:28
Cuno =
∑i,k δi(Gm(Ti))
−2I(Ti < Tk)I(oi > ok)∑i,k δi(Gm(Ti))−2I(Ti < Tk)
. (5)
where Gm(t) denotes the Kaplan-Meier estimator of the unconditional survival function ofCensored time (Ccens) estimated from the learning data. However, the Uno estimator is un-feasible because it is not differentiable to oi. To solve this problem, the indicator functionI(oi > ok) is approximated by the sigmoid function:
Pacific Symposium on Biocomputing 2018
348
L(o) =∑i,k
wi,k1
1 + exp(ok−oiσ ), (6)
where oi is the output of the i-th patient. We implement the smoothed C-index function (6)as the survival loss function in our method. The weights wik are defined as
wi,k =δi(Gm(Ti))
−2I(Ti < Tk)∑i,k δi(Gm(Ti))−2I(Ti < Tk)
. (7)
where I(Ti < Tk) is an indication function that indicates whether Ti is larger than Tk or not.It is easy to check the smoothed empirical risk is differentiable with respect to the predictoroi. The derivative is given by
∂L
∂oi= −
∑k
wi,kexp(ok−oiσ )
σ(1 + exp(ok−oiσ ))(8)
Compared with recent deep survival models,10,29 which can only handle one specific view ofdata, our model can achieve more complex architecture for the integration of multi-modalitiesdata, which can be used for practical applications on more challenging datasets.
4. Experiments
4.1. Dataset Description
TCGA (The Cancer Genome Atlas) data cohort30 is a very large dataset which containsboth high resolution whole slide pathological images and molecular profiling data. In TCGA-cohort, we focused on glioblastoma multiforme (GBM) and lung squamous cell carcinoma(LUSC). For each cancer type, we adopted a core sample set from UT MD Anderson CancerCenter31 in which each sample has information for the overall survival time, pathologicalimages, and molecular data related to gene expression. For model evaluation, 80% of patientswere randomly selected for training and the remaining 20% were used for testing.
• TCGA-LUSC: Lung squamous cell carcinoma (LUSC) is one major type in Non-Small-Cell Lung Carcinoma (NSCLC). 106 patients with pathological images and protein ex-pression (reverse-phase protein array, 174 proteins) are collected in our experiments.
• TCGA-GBM: Glioma is a type of brain cancer, and it is the most common malignantbrain tumor. 126 patients are selected from the core set with images and CNV data (Copynumber variation, 106 dimension).
4.2. Comparison approaches
We compare our model with four state-of-the-art survival approaches and three baseline deepsurvival models. The four survival methods include LASSO-Cox,18 Parametric censored regres-sion models with components with Weibull, Logistic distribution,2 and Boosting concordanceindex (BoostCI).27 Those above methods need hand-crafted features as inputs. To calculateimaging hand-crafted features, we used CellProfiler32 to analyze pathological images in com-parison survival models. CellProfiler is widely used as a state-of-the-art medical image feature
Pacific Symposium on Biocomputing 2018
349
extracting and quantitative analysis tool. Motivated by the pipeline,33 a total of 1,795 quan-titative features were calculated from each image tile.
The three baseline deep survival models are as follows:
• CNN-Surv: Deep convolutional survival model;29 we use the same architecture as thesub-network f1 .
• FCN-Surv: FCN sub-network f2 followed by negative log partial likelihood loss.10
• DeepCorr+DeepSurv: The shared representation learned by deep correlational learningis directly fed to another DeepSurv model.
To make fair comparisons, the architectures of different deep survival models are kept thesame as the corresponding parts in the proposed method.
4.3. Results and Discussion
To evaluate the performances in survival prediction, we take the concordance index (CI) asour evaluation metric.
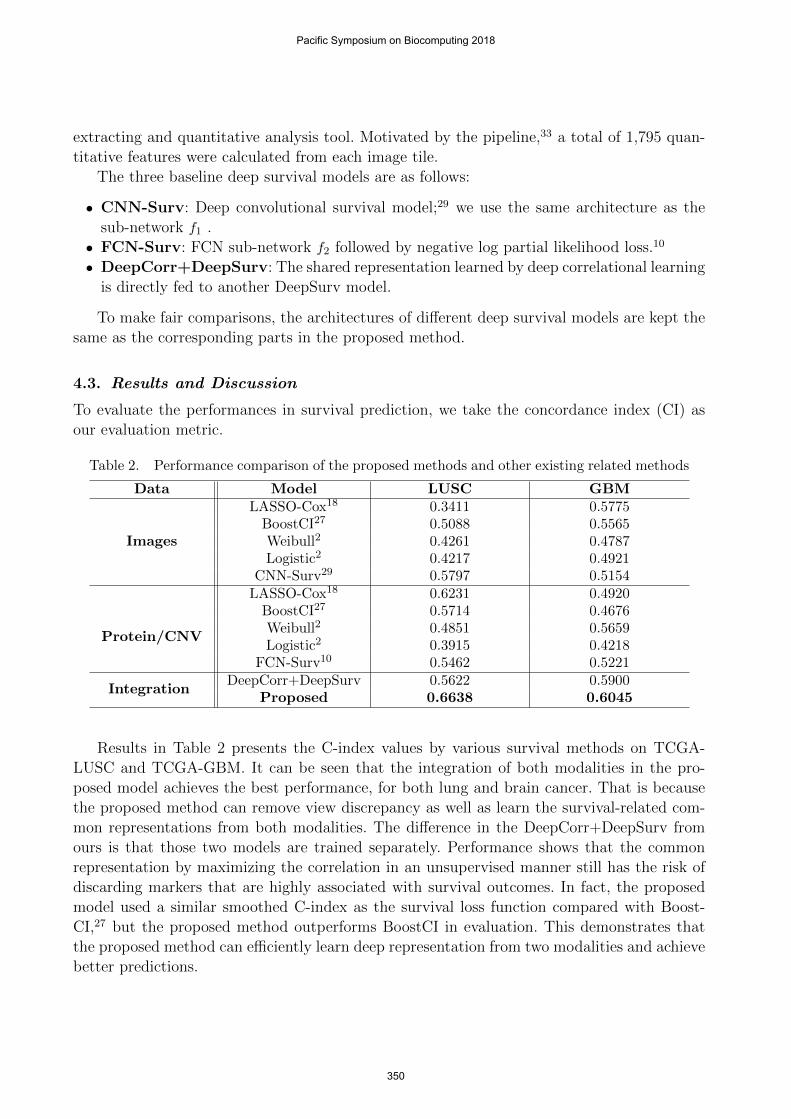
Table 2. Performance comparison of the proposed methods and other existing related methods
Data Model LUSC GBM
Images
LASSO-Cox18 0.3411 0.5775BoostCI27 0.5088 0.5565Weibull2 0.4261 0.4787Logistic2 0.4217 0.4921
CNN-Surv29 0.5797 0.5154
Protein/CNV
LASSO-Cox18 0.6231 0.4920BoostCI27 0.5714 0.4676Weibull2 0.4851 0.5659Logistic2 0.3915 0.4218
FCN-Surv10 0.5462 0.5221
IntegrationDeepCorr+DeepSurv 0.5622 0.5900
Proposed 0.6638 0.6045
Results in Table 2 presents the C-index values by various survival methods on TCGA-LUSC and TCGA-GBM. It can be seen that the integration of both modalities in the pro-posed model achieves the best performance, for both lung and brain cancer. That is becausethe proposed method can remove view discrepancy as well as learn the survival-related com-mon representations from both modalities. The difference in the DeepCorr+DeepSurv fromours is that those two models are trained separately. Performance shows that the commonrepresentation by maximizing the correlation in an unsupervised manner still has the risk ofdiscarding markers that are highly associated with survival outcomes. In fact, the proposedmodel used a similar smoothed C-index as the survival loss function compared with Boost-CI,27 but the proposed method outperforms BoostCI in evaluation. This demonstrates thatthe proposed method can efficiently learn deep representation from two modalities and achievebetter predictions.
Pacific Symposium on Biocomputing 2018
350
From the results, we can see that it is not easy to find a general model that can successfullyestimate patients’ survival outcomes across different tumor types using only one specific view,either images or molecule data. The reason might be the heterogeneous of different tumortypes and the original data in each view might contain variations or noise and thus affectthe estimation of survival models. Because the proposed model can effectively integrate twoviews, it can achieve good prediction performance across different tumor types.
5. Conclusion
In this paper, we proposed a deep survival model to efficiently integrate multi-modalities fromlung and brain tumor patients. Eliminating the view discrepancy between imaging data andmolecular profiling data, deep correlational learning provides a good solution to maximize thecorrelation of two views and find the common embedding space. However, deep correlationallearning belongs to an unsupervised learning which cannot ensure the common representationfrom correlational layer is suitable for survival prediction. To overcome this issue, the proposedmodel fine-tunes the whole network using smooth C-index loss after transferring knowledgefrom the embedding space. Experiments have demonstrated the proposed method can discoverimportant markers that might be ignored by correlational learning. Our model can find non-linear relationships between factors and prognosis; it achieved quite promising performancewith improvements. In the future, we will extend the proposed framework to directly processoriginal whole slide images (WSIs).
References
1. D. R. Cox, Journal of the Royal Statistical Society. Series B (Methodological) , 187 (1972).2. J. D. Kalbfleisch and R. L. Prentice, The statistical analysis of failure time data (John Wiley &
Sons, 2011).3. E. Bair and R. Tibshirani, PLoS Biol 2, p. E108 (2004).4. E. Bair, T. Hastie, D. Paul and R. Tibshirani, Journal of the American Statistical Association
101 (2006).5. H. C. van Houwelingen, T. Bruinsma, A. A. Hart, L. J. van’t Veer and L. F. Wessels, Statistics
in medicine 25, 3201 (2006).6. M. Y. Park and T. Hastie, Journal of the Royal Statistical Society: Series B (Statistical Method-
ology) 69, 659 (2007).7. H. M. Bøvelstad, S. Nygard, H. L. Størvold, M. Aldrin, Ø. Borgan, A. Frigessi and O. C.
Lingjærde, Bioinformatics 23, 2080 (2007).8. Y. Li, K. S. Xu and C. K. Reddy, Regularized parametric regression for high-dimensional survival
analysis, in In Proceedings of SIAM International Conference on Data Mining. SIAM , 2016.9. Y. Li, J. Wang, J. Ye and C. K. Reddy, A multi-task learning formulation for survival analysis,
in In Proceedings of the 22nd ACM SIGKDD International Conference on Knowledge Discoveryand Data Mining , 2016.
10. J. Katzman, U. Shaham, A. Cloninger, J. Bates, T. Jiang and Y. Kluger, arXiv preprint arX-iv:1606.00931 (2016).
11. J. Yao, X. Zhu, F. Zhu and J. Huang, Deep correlational learning for survival prediction frommulti-modality data, in International Conference on Medical Image Computing and Computer-Assisted Intervention, 2017.
12. X. Zhu, J. Yao, F. Zhu and J. Huang, Wsisa: Making survival prediction from whole slide
Pacific Symposium on Biocomputing 2018
351
histopathological images, in IEEE Conference on Computer Vision and Pattern Recognition,2017.
13. A. H. Beck, A. R. Sangoi, S. Leung, R. J. Marinelli, T. O. Nielsen, M. J. van de Vijver, R. B.West, M. van de Rijn and D. Koller, Science translational medicine 3, 108ra113 (2011).
14. Y. Yuan, H. Failmezger, O. M. Rueda, H. R. Ali, S. Graf, S.-F. Chin, R. F. Schwarz, C. Curtis,M. J. Dunning, H. Bardwell et al., Science translational medicine 4, 157ra143 (2012).
15. A. Krizhevsky, I. Sutskever and G. E. Hinton, Imagenet classification with deep convolutionalneural networks, in Advances in neural information processing systems, 2012.
16. K. Chatfield, K. Simonyan, A. Vedaldi and A. Zisserman, Return of the devil in the details:Delving deep into convolutional nets, in British Machine Vision Conference, 2014.
17. C. K. Reddy and Y. Li, A review of clinical prediction models, in Healthcare Data Analytics,(Chapman and Hall/CRC, 2015) pp. 343–378.
18. R. Tibshirani et al., Statistics in medicine 16, 385 (1997).19. H.-c. Lin, V. Baracos, R. Greiner and J. Y. Chun-nam, Learning patient-specific cancer survival
distributions as a sequence of dependent regressors, in Advances in Neural Information ProcessingSystems, 2011.
20. X. Song and C.-Y. Wang, Statistics in medicine 32 (2013).21. X. Zhu, J. Yao, X. Luo, G. Xiao, Y. Xie, A. Gazdar and J. Huang, Lung cancer survival prediction
from pathological images and genetic data - an integration study, in IEEE 13th InternationalSymposium on Biomedical Imaging (ISBI), 2016.
22. G. Andrew, R. Arora, J. A. Bilmes and K. Livescu, Deep canonical correlation analysis., inICML, 2013.
23. F. Yan and K. Mikolajczyk, Deep correlation for matching images and text, in CVPR, June2015.
24. W. Wang, R. Arora, K. Livescu and J. Bilmes, On deep multi-view representation learning, inProc. of the 32st Int. Conf. Machine Learning (ICML 2015), 2015.
25. S. Chandar, M. M. Khapra, H. Larochelle and B. Ravindran, Neural computation (2016).26. L. Wang, Y. Li and S. Lazebnik, arXiv preprint arXiv:1511.06078 (2015).27. A. Mayr and M. Schmid, Boosting the concordance index for survival data–a unified framework
to derive and evaluate biomarker combinations (1) (Public Library of Science, 2014) p. e84483.28. H. Uno, T. Cai, M. J. Pencina, R. B. D’Agostino and L. Wei, Statistics in medicine 30, 1105
(2011).29. X. Zhu, J. Yao and J. Huang, Deep convolutional neural network for survival analysis with patho-
logical images, in IEEE International Conference on Bioinformatics and Biomedicine (BIBM),2016.
30. C. Kandoth, M. D. McLellan, F. Vandin, K. Ye, B. Niu, C. Lu, M. Xie, Q. Zhang, J. F. McMichael,M. A. Wyczalkowski et al., Nature 502, 333 (2013).
31. Y. Yuan, E. M. Van Allen, L. Omberg, N. Wagle, A. Amin-Mansour, A. Sokolov, L. A. Byers,Y. Xu, K. R. Hess, L. Diao et al., Nature biotechnology 32, 644 (2014).
32. A. E. Carpenter, T. R. Jones, M. R. Lamprecht, C. Clarke, I. H. Kang, O. Friman, D. A. Guertin,J. H. Chang, R. A. Lindquist, J. Moffat et al., Genome biology 7, p. R100 (2006).
33. J. Yao, S. Wang, X. Zhu and J. Huang, Imaging biomarker discovery for lung cancer survivalprediction, in MICCAI 2016, Part II , eds. S. Ourselin, L. Joskowicz, M. R. Sabuncu, G. Unaland W. Wells, LNCS, Vol. 9901 (Springer, Heidelberg, 2016).
Pacific Symposium on Biocomputing 2018
352