deep learning methods improve polygenic risk analysis and
TRANSCRIPT

Deep learning methods improve polygenic risk analysis and
prediction for Alzheimer’s disease
Zhou et al.
SUPPLEMENTARY INFORMATION
Supplementary Methods ......................................................................................................... 3
Supplementary Note ................................................................................................................ 5
Supplementary Figure 1. Optimization of the neural network model for classifying
Alzheimer’s disease .................................................................................................................. 8
Supplementary Figure 2. Performance of different polygenic score models in the
European-descent population AD cohorts ............................................................................. 9
Supplementary Figure 3. Performance of polygenic risk models for classifying
Alzheimer’s disease risk in Chinese AD WGS cohort 1 ..................................................... 10
Supplementary Figure 4. Performance of polygenic risk models for classifying
Alzheimer’s disease risk in Chinese AD WGS cohort 2 ..................................................... 11
Supplementary Figure 5. Performance of different polygenic score models in the Chinese
AD WGS cohorts .................................................................................................................... 12
Supplementary Figure 6. Associations between polygenic scores and brain region
volumes.................................................................................................................................... 13
Supplementary Table 1. Demographic and clinical characteristics of study cohorts...... 14
Supplementary Table 2. Performance of the polygenic score models in the European-
descent population AD cohorts ............................................................................................. 16
Supplementary Table 3. Performance of polygenic score models in the European-descent
population AD cohorts ........................................................................................................... 17
Supplementary Table 4. Sources of the variants for the replication analysis .................. 18
Supplementary Table 5. Variants included for the replication analysis in the Chinese
population ............................................................................................................................... 19
Supplementary Table 6. Replication results of the associations of variants with
Alzheimer’s disease in the Chinese population ................................................................... 25
Supplementary Table 7. Variants significantly associated with Alzheimer’s disease in the
Chinese population................................................................................................................. 31
Supplementary Table 8. Meta-analysis results of the effects of variants on Alzheimer’s
disease in the Chinese population ......................................................................................... 33

Supplementary Table 9. Variants used to construct polygenic score models .................. 39
Supplementary Table 10. Performance of the polygenic score models in the Chinese WGS
cohorts ..................................................................................................................................... 41
Supplementary Table 11. Test of the polygenic score models performance in the Chinese
WGS cohorts........................................................................................................................... 42
Supplementary Table 12. Individual disease risk stratification based on polygenic scores
and their associations with phenotypes ................................................................................ 43
Supplementary Table 13. Association between polygenic scores and cognitive
performance............................................................................................................................ 44
Supplementary Table 14. Associations between polygenic scores and the plasma ATN
biomarker panel ..................................................................................................................... 45
Supplementary Table 15. Associations between polygenic scores and regional brain
volumes.................................................................................................................................... 46
Supplementary Table 16. Plasma proteins significantly associated with neural network
model risk score in normal controls ..................................................................................... 48
Supplementary Table 17. Gene Ontology analysis of plasma proteins associated with
polygenic scores in normal controls (i.e., positively associated with polygenic risk) ....... 50
Supplementary Table 18. Gene Ontology analysis of plasma proteins associated with
polygenic scores in normal controls (i.e., negatively associated with polygenic risk) ...... 56
Supplementary Table 19. Summary of protein–protein interaction network analysis for
plasma proteins associated with polygenic scores ............................................................... 57
Supplementary Table 20. Plasma proteins associated with individual modules in the
neural network model ............................................................................................................ 58
Supplementary Table 21. Cell-type enrichment analysis of the plasma proteins in each
cluster ...................................................................................................................................... 63
Supplementary Table 22. Plasma proteins in each cluster that are significantly enriched
in corresponding cell types .................................................................................................... 64
Supplementary Table 23. Summary of protein–protein interaction network analysis for
plasma proteins enriched in specific cell types .................................................................... 65
Supplementary Table 24. Transcript abundance of plasma proteins enriched in B cells
.................................................................................................................................................. 66
References ............................................................................................................................... 67

Supplementary Methods
Alzheimer’s Disease Neuroimaging Initiative cohort
We obtained genotype and phenotype data from the Alzheimer’s Disease
Neuroimaging Initiative (ADNI) database (adni.loni.usc.edu). The ADNI, led by Michael W.
Weiner, MD, was launched in 2003 as a public–private partnership. It is a 4-stage study that
aims to examine the brain’s structure and function aided by biomarker and clinical data in
people aged 55–90 years from the United States and Canada. For the present study, we included
array genotype data obtained from ADNI-1, ADNI-2/GO, and ADNI-3 for analysis. After
prefiltering, imputation, and postfiltering, 1,382 subjects (689 patients with Alzheimer’s
disease [AD] and 693 cognitively normal controls) were retained for downstream analysis. The
phenotypes of the ADNI subjects are from the latest diagnostic records (updated January 2021).
National Institute on Aging Alzheimer’s Disease Centers cohort
The clinical and neuropathology cores of the 29 National Institute on Aging (NIA)-
funded Alzheimer’s Disease Centers (ADCs) recruited and evaluated autopsy-confirmed and
clinically confirmed patients with AD as well as cognitively normal elderly subjects. We
retrieved the genotype and phenotype data of this AD cohort (N = 6,065) from the NIH dbGaP
(accession number: phs000372.v2.p1). Genotype information was generated from the Illumina
Human660W-Quad BeadChip or HumanOmniExpress Array. All autopsied subjects were ≥60
years old at death. Dementia in AD was determined according to the DSM-IV criteria or a
Clinical Dementia Rating ≥1. Further details can be found in publications arising from the
corresponding dbGaP project1,2. After prefiltering, imputation, and postfiltering, 5,692 subjects
(3,946 patients with AD and 1,746 cognitively normal controls) were retained for downstream
analysis.
Late Onset Alzheimer’s Disease Family Study
The Late Onset Alzheimer’s Disease (LOAD) Family Study recruited families with 2
or more siblings with late-onset AD as well as age- and ethnicity-matched, unrelated,
nondemented controls. Patients with definite AD were diagnosed according to established
neuropathological criteria (i.e., CERAD, Braak, Khachaturian, NIA-RI, or other established
criteria). Probable AD or possible AD was ascertained according to the NINCDS-ADRDA
criteria. Patients with AD with an age of onset or age at diagnosis ≥50 years old and normal
controls ≥50 years old were recruited. We retrieved genotype and phenotype data from the NIH
dbGaP (accession number: phs000168.v2.p2). Individual genotypes were generated from the
Human 610Quadv1_B Beadchips (Illumina). After prefiltering, imputation, and postfiltering,
4,278 subjects (2,046 patients with AD and 2,232 cognitively normal controls) were retained
for downstream analysis. Further details can be found in in publication arising from the
corresponding dbGaP project3.

Filtering and imputation for the array datasets
We converted array genotype information from the ADNI, LOAD, and ADC datasets
from PLINK to VCF format using VcfCooker (v1.1.1;
https://genome.sph.umich.edu/wiki/VcfCooker). We applied prefiltering at both the individual
and variant level, retaining individuals with a sample call rate ≥95% and variants with a
genotype call rate ≥80% separately for each dataset. We submitted the filtered genotype data
to the TOPMed Imputation Server4 (https://imputation.biodatacatalyst.nhlbi.nih.gov) using the
TOPMed Imputation Reference panel (TOPMed r2)5 for phasing and imputation in the form of
chromosome-separated VCF files generated by Eagle (v2.4)6. We performed post-imputation
filtering by removing imputed variants with an imputation r2 < 0.4 using the bcftools filter
function. We further annotated the dbSNP ID (v154) using the bcftools annotate function. We
retained single nucleotide polymorphisms with matched dbSNP IDs and alleles for subsequent
polygenic score analysis. For part of the quality control analysis, we use PLINK to estimate
the identity-by-descent (IBD) using variants with MAF > 0.01 and prune by R2 of 0.2, and
excluded suspected duplicated subjects using IBD > 0.90.

Supplementary Note
For the ADNI dataset, data collection and sharing for this project were funded by the
ADNI (National Institutes of Health Grant number: U01-AG024904) and the DoD ADNI
(Department of Defense award number: W81XWH12-2-0012). The ADNI is funded by the
NIA and the National Institute of Biomedical Imaging and Bioengineering as well as generous
contributions from the following organizations: AbbVie; the Alzheimer’s Association; the
Alzheimer’s Drug Discovery Foundation; Araclon Biotech; BioClinica, Inc.; Biogen; Bristol-
Myers Squibb Company; CereSpir, Inc.; Cogstate; Eisai, Inc.; Elan Pharmaceuticals, Inc.; Eli
Lilly and Company; EuroImmun; F. Hoffmann–La Roche Ltd. and its affiliated company
Genentech, Inc.; Fujirebio; GE Healthcare; IXICO, Ltd.; Janssen Alzheimer Immunotherapy
Research & Development, LLC; Johnson & Johnson Pharmaceutical Research & Development,
LLC; Lumosity; Lundbeck; Merck & Co., Inc.; Meso Scale Diagnostics, LLC; NeuroRx
Research; Neurotrack Technologies; Novartis 20 Pharmaceuticals Corporation; Pfizer, Inc.;
Piramal Imaging; Servier; Takeda Pharmaceutical Company; and Transition Therapeutics. The
Canadian Institutes of Health Research provides funding to support ADNI clinical sites in
Canada. Private-sector contributions are facilitated by the Foundation for the National
Institutes of Health (www.fnih.org). The grantee organization is the Northern California
Institute for Research and Education, and the study is coordinated by the Alzheimer’s
Therapeutic Research Institute at the University of Southern California. The data generated by
the ADNI are disseminated by the Laboratory for Neuro Imaging at the University of Southern
California. For the Alzheimer’s Disease Genetics Consortium (ADGC) Genome Wide
Association Study–NIA Alzheimer’s Disease Centers Cohort (i.e., the ADC dataset), funding
support for the Alzheimer’s Disease Genetics Consortium was provided through the NIA
Division of Neuroscience (grant number: U01-AG032984). For the National Institute on
Aging–Late Onset Alzheimer’s Disease Family Study (i.e., the LOAD dataset), funding
support for “the Genetic Consortium for Late Onset Alzheimer’s Disease” was provided
through the NIA Division of Neuroscience. The Genetic Consortium for Late Onset
Alzheimer’s Disease includes a genome-wide association study funded as part of the NIA
Division of Neuroscience. The Genetic Consortium for Late Onset Alzheimer’s Disease
assisted with phenotype harmonization and genotype cleaning as well as general study
coordination.

Alzheimer’s Disease Neuroimaging Initiative
ADNI I, GO, II, and III studies
Andrew J. Saykin, Arthur W. Toga, Bret Borowski, Chad Ward, Charles DeCarli, Chet Mathis,
Clifford R. Jack, Jr., Danielle Harvey, David Holtzman, David Jones, Devon Gessert, Eli Lilly,
Eric M. Reiman, Erin Franklin, Franz Hefti, Greg Sorensen, Gustavo Jimenez, Howard Fillit,
Jeff Gunter, Jennifer Salazar, John Hsiao, John Morris, John Q. Trojanowski, Karen Crawford,
Scott Neu, Kejal Kantarci, Kelley Faber, Kelly Harless, Kewei Chen, Kwangsik Nho, Laurel,
Beckett, Lean Thal, Leon Thal, Leslie M. Shaw , Lew Kuller, Li Shen, Lindsey Hergesheimer,
Lisa Taylor-Reinwald, M. Marcel Mesulam, Magdalena Korecka, Marc Raichle, Maria,
Carrillo, Marilyn Albert, Matt Senjem, Matthew Bernstein, Michael Donohue, Michael Weiner,
Michal Figurski, Neil Buckholtz, Nick Fox, Nigel J. Cairns, Norbert Schuff, Norm Foster, Paul
Aisen, Paul Thompson, Peter Davies, Peter J. Snyder, Peter Snyder, Prashanthi Vemuri,
Richard Frank, Robert A. Koeppe, Robert C. Green, Ronald Petersen, Sarah Walter, Steven
Paul, Steven Potkin, Sungeun Kim, Tatiana M. Foroud, Tom Montine, Virginia Lee, William
Jagust, William Potter, Yuliana Cabrera, Zaven Khachaturian
ADNI investigators from university and institutes
Adam Fleisher, Aimee Pierce, Akiva Mintz, Alan Lerner, Alexander Norbash, Allan I. Levey,
Allyson Rosen, Amanda Smith, Anaztasia Ulysse, Andrew E. Budson, Andrew Kertesz,
Angela Oliver, Ann Marie Hake, Anna Burke, Antero Sarrael, Anton P. Porsteinsson, Ashley
Lamb, Athena Lee, Balebail Ashok Raj, Barton Lane, Beatriz Yanez, Beau Ances, Benita
Mudge, Betty Lind, Bojana Stefanovic, Bonnie S. Goldstein, Borna Bonakdarpour, Brandy R.
Matthews, Brian R. Ott, Brigid Reynolds, Bruce L. Miller, Bryan M. Spann, Carl Sadowsky,
Charles Bernick, Charles D. Smith, Chiadi Onyike, Chris (Chinthaka) Heyn, Chris Hosein,
Christi Leach, Christine M. Belden, Christopher H. van Dyck, Christopher M. Clark, Chuang-
Kuo Wu, Colleen S. Albers, Connie Brand, Courtney Bodge, Curtis Tatsuoka, Cynthia M.
Carlsson, Dana Mathews, Daniel D’Agostino II, Daniel H.S. Silverman, Daniel Marson, David
A. Wolk, David Bachman, David Clark, David Geldmacher, David Hart, David Knopman,
David Perry, David Winkfield, Delwyn D. Miller, Diana Kerwin, Dick Drost, Donna M.
Simpson, Donna Munic, Douglas W. Scharre, Dr Rob Bartha, Dzintra Celmins, Earl A.
Zimmerman, Edmond Teng, Edward Coleman, Edward Zamrini, Effie Mitsis, Elizabeth Finger,
Elizabeth Oates, Elizabeth Sosa, Ellen Woo, Emily Rogalski, Evan Fletcher, Francine Parfitt,
Gaby Thai, Gad A. Marshall, Gary Conrad, Geoffrey Tremont, George Bartzokis, Ging-Yuek
Robin Hsiung, Gloria Chiang, Godfrey D. Pearlson, Greg Jicha, Helen Vanderswag, Hillel
Grossman, Horacio Capote, Howard Bergman, Howard Chertkow, Howard Feldman, Howard
J. Rosen, Hristina Koleva, Hyungsub Shim, Irina Rachinsky, Jacobo Mintzer, Jaimie
Ziolkowski, James Brewer, James J. Lah, Jamika, Singleton-Garvin, Janet S. Cellar, Jared R.
Brosch, Jared Tinklenberg, Jason H. Karlawish, Javier Villanueva-Meyer, Jeffrey A. Kaye,
Jeffrey M. Burns, Jeffrey R. Petrella, Jerome Yesavage, Joanne Allard, Joanne L. Lord, Joel
Hetelle, John Brockington, John C. Morris, John Olichney, John Rogers, Joseph Quinn, Joseph
S. Kass, Joy L. Taylor, Judith L. Heidebrink, Karen Anderson, Karen Blank, Karen Ekstam
Smith, Karen L. Bell, Kathleen Johnson, Kathleen Tingus, Kathryn DeMarco, Kaycee M. Sink,
Keith A. Johnson, Kelly M. Makino, Kenneth Spicer, Ki Won Nam, Kim Martin, Kim Poki-
Walker, Kris Johnson, Kristin Fargher, Kristine Lipowski, Kyle Womack, Laura A. Flashman,
Lawrence S. Honig, Liana Apostolova, Liberty Teodoro, Lisa C. Silbert, Lisa Ravdin, Lon S.
Schneider, Lori A. Daiello, M. Saleem Ismail, Marc Seltzer, Marek-Marsel Mesulam, Maria
Carroll, Maria Kataki, Maria T. Greig-Custo, Marissa Natelson Love, Mark A. Mintun, Martin
R. Farlow, Martin Sadowski, Mary L. Creech, Mary L. Hynes, Mary Quiceno, MaryAnn
Oakley, Mauricio Becerra, Megan Witbracht, Melanie Keltz, Melissa Lamar, Mia Yang,
Michael Borrie, Michael Lin, Michele Assaly, Michelle Rainka, Mimi Dang, Mohammed O.
Sheikh, Mrunalini Gaikwad, Munir Chowdhury, Nadira Trncic, Nancy Johnson, Nancy
Kowalksi, Nathaniel Pacini, Neil Kowall, Neill R Graff-Radford, Norman Relkin, Ntekim E.
Oyonumo, Nunzio Pomara, Olga James, Olu Ogunlana, Oscar L. Lopez, Owen Carmichael, P.
Murali Doraiswamy, Parianne Fatica, Patricia Lynn Johnson, Patricia Samuels, Paul Malloy,
Paula Ogrocki, Pauline Maillard, Peter Hardy, Pierre Tariot, Po H. Lu, Pradeep Varma,
Rachelle S. Doody, Raina Carter, Raj C. Shah, Randall Griffith, Randy Yeh, Ranjan Duara,
Rawan Tarawneh, Raymond Scott Turner, Raymundo Hernando, Reisa A., Richard E. Carson,
Riham El Khouli, Robert B. Santulli, Ronald Killiany, Rosemarie Rodriguez, Russell H.
Swerdlow, Salvador Borges-Neto, Sandra Black, Sandra Weintraub, Sanjay Asthana, Sanjeev
Vaishnavi, Sara Dolen, Sara S. Mason, Scott Herring, Sherye A. Sirrel, Smita Kittur, Sonia
Pawluczyk, Stacy Schneider, Stephanie Kielb, Stephanie Reeder, Stephen Correia, Stephen
Pasternack, Stephen Pasternak, Stephen Salloway, Sterling Johnson, Steven Chao, Steven E.
Arnold, Susan K. Schultz, Susan Rountree, T-Y Lee, Terence Z. Wong, Teresa Villena,
Thomas O. Obisesan, Valory Pavlik, Vernice Bates, Vesna Sossi, Victoria Shibley, William M.
Brooks, William Pavlosky, Yaakov Stern

Supplementary Figure 1. Optimization of the neural network model for classifying
Alzheimer’s disease

Supplementary Figure 2. Performance of different polygenic score models in the
European-descent population AD cohorts
Comparing the values of auROCs of AD cohorts obtained by different models. The y-axis
shows the mean auROC, with error bars represents the 95% CI. Bootstrap one-tailed test.
***P < 0.001, **P < 0.01, *P < 0.05.

Supplementary Figure 3. Performance of polygenic risk models for classifying
Alzheimer’s disease risk in Chinese AD WGS cohort 1
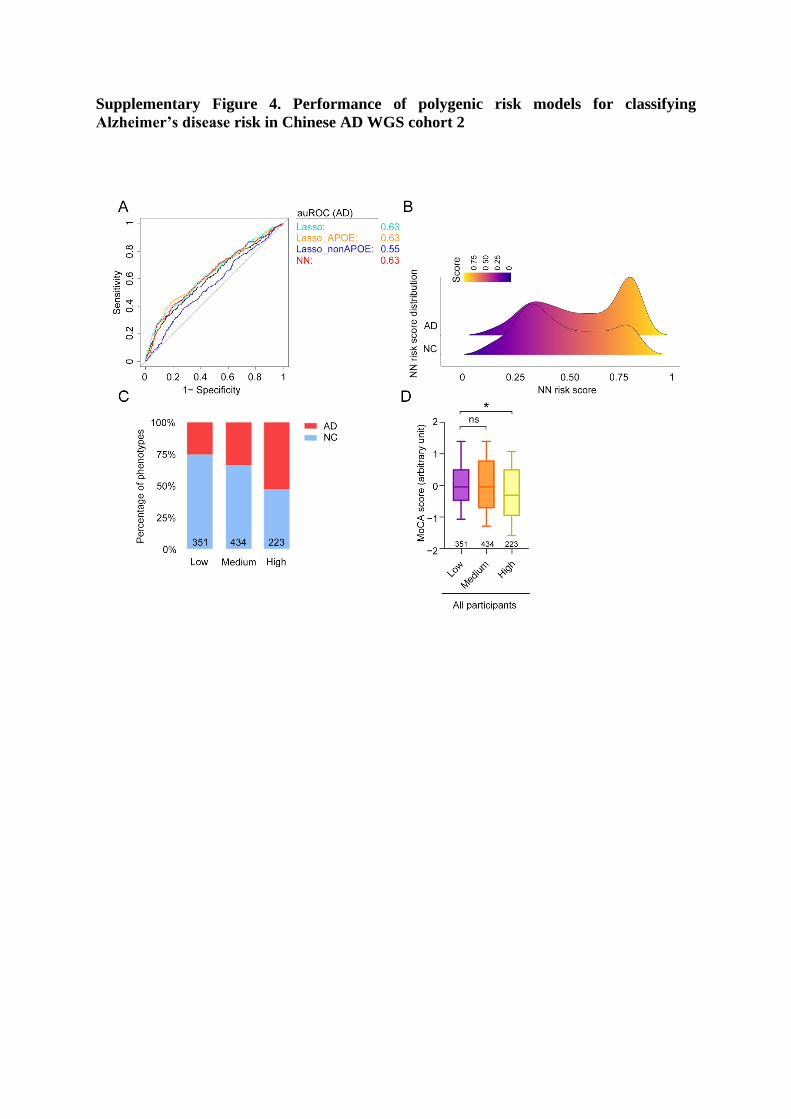
Supplementary Figure 4. Performance of polygenic risk models for classifying
Alzheimer’s disease risk in Chinese AD WGS cohort 2

Supplementary Figure 5. Performance of different polygenic score models in the Chinese
AD WGS cohorts
Comparing the values of auROCs of 2 Chinese AD cohorts by different models. The y-axis
shows the mean auROC, with error bars represents the 95% CI. Bootstrap two-tailed test. ***P
< 0.001, **P < 0.01.

Supplementary Figure 6. Associations between polygenic scores and brain region
volumes
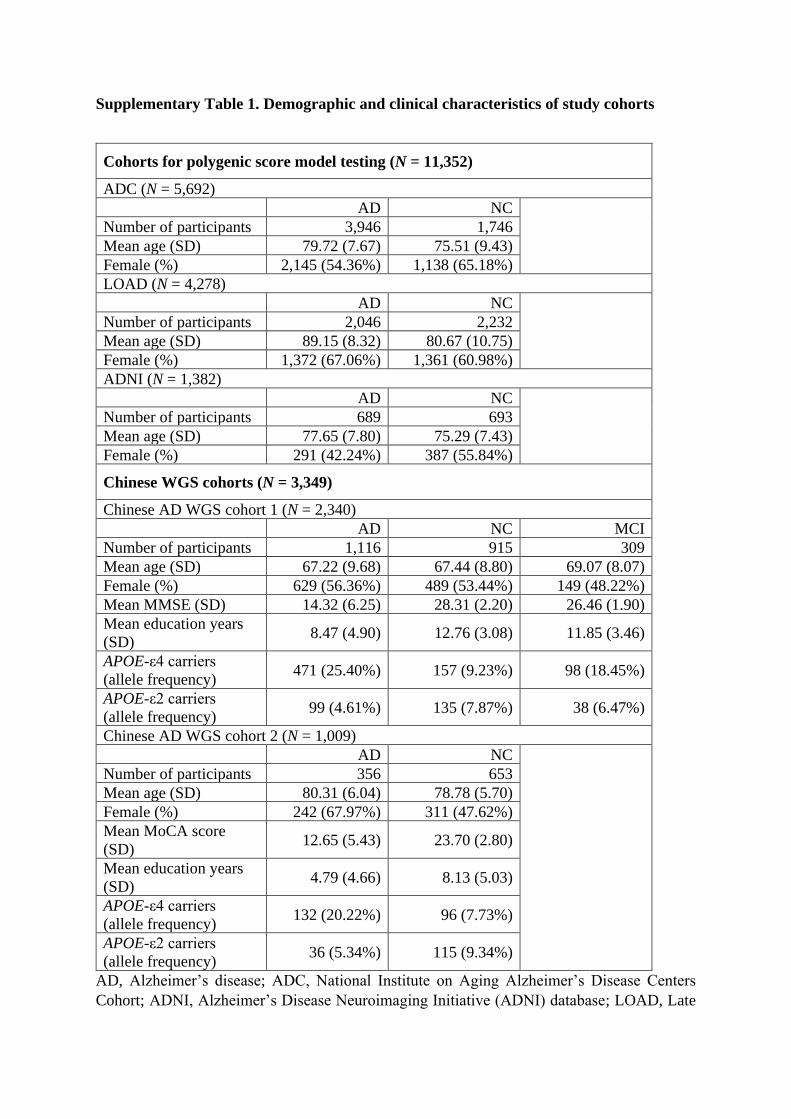
Supplementary Table 1. Demographic and clinical characteristics of study cohorts
Cohorts for polygenic score model testing (N = 11,352)
ADC (N = 5,692)
AD NC
Number of participants 3,946 1,746
Mean age (SD) 79.72 (7.67) 75.51 (9.43)
Female (%) 2,145 (54.36%) 1,138 (65.18%)
LOAD (N = 4,278)
AD NC
Number of participants 2,046 2,232
Mean age (SD) 89.15 (8.32) 80.67 (10.75)
Female (%) 1,372 (67.06%) 1,361 (60.98%)
ADNI (N = 1,382)
AD NC
Number of participants 689 693
Mean age (SD) 77.65 (7.80) 75.29 (7.43)
Female (%) 291 (42.24%) 387 (55.84%)
Chinese WGS cohorts (N = 3,349)
Chinese AD WGS cohort 1 (N = 2,340)
AD NC MCI
Number of participants 1,116 915 309
Mean age (SD) 67.22 (9.68) 67.44 (8.80) 69.07 (8.07)
Female (%) 629 (56.36%) 489 (53.44%) 149 (48.22%)
Mean MMSE (SD) 14.32 (6.25) 28.31 (2.20) 26.46 (1.90)
Mean education years
(SD) 8.47 (4.90) 12.76 (3.08) 11.85 (3.46)
APOE-ε4 carriers
(allele frequency) 471 (25.40%) 157 (9.23%) 98 (18.45%)
APOE-ε2 carriers
(allele frequency) 99 (4.61%) 135 (7.87%) 38 (6.47%)
Chinese AD WGS cohort 2 (N = 1,009)
AD NC
Number of participants 356 653
Mean age (SD) 80.31 (6.04) 78.78 (5.70)
Female (%) 242 (67.97%) 311 (47.62%)
Mean MoCA score
(SD) 12.65 (5.43) 23.70 (2.80)
Mean education years
(SD) 4.79 (4.66) 8.13 (5.03)
APOE-ε4 carriers
(allele frequency) 132 (20.22%) 96 (7.73%)
APOE-ε2 carriers
(allele frequency) 36 (5.34%) 115 (9.34%)
AD, Alzheimer’s disease; ADC, National Institute on Aging Alzheimer’s Disease Centers
Cohort; ADNI, Alzheimer’s Disease Neuroimaging Initiative (ADNI) database; LOAD, Late

Onset Alzheimer’s Disease (LOAD) Family Study; MCI, mild cognitive impairment; MMSE,
Mini-Mental State Examination; MoCA, Montreal Cognitive Assessment; NC, normal control;
SD, standard deviation; WGS, whole-genome sequencing.

Supplementary Table 2. Performance of the polygenic score models in the European-
descent population AD cohorts
p-value
cutoff Cohort
auROC (95% CI)
wPRS wPRS2 Lasso NN
P<1E−08
ADC 0.6708
(0.657-0.6849)
0.6503
(0.635-0.6648)
0.7892
(0.7761-0.8016)
0.8152
(0.8029-0.8266)
LOAD 0.6462
(0.6294-0.6621)
0.6312
(0.6132-0.6481)
0.7496
(0.7342-0.7645)
0.7888
(0.7741-0.8024)
ADNI 0.6572
(0.6268-0.6863)
0.6407
(0.612-0.6702)
0.679
(0.6504-0.7067)
0.6801
(0.6529-0.7087)
P<1E−06
ADC 0.6648
(0.6499-0.6794)
0.6435
(0.6286-0.6591)
0.8157
(0.8036-0.8280)
0.827
(0.8156-0.8382)
LOAD 0.6411
(0.6237-0.6581)
0.6255
(0.6084-0.6419)
0.7764
(0.7618-0.7909)
0.8055
(0.7922-0.8196)
ADNI 0.6528
(0.6236-0.6807)
0.6379
(0.608-0.668)
0.6515
(0.6218-0.6816)
0.6827
(0.6545-0.7091)
P<1E−04
ADC 0.6411
(0.6264-0.6555)
0.636
(0.6205-0.6511)
0.8072
(0.7951-0.8192)
0.8437
(0.8323-0.8547)
LOAD 0.6283
(0.6113-0.6456)
0.6173
(0.5999-0.634)
0.7814
(0.7663-0.7961)
0.8202
(0.807-0.8326)
ADNI 0.6228
(0.5942-0.6529)
0.617
(0.5868-0.6475)
0.6893
(0.6609-0.7179)
0.6891
(0.6594-0.7181)
Classification accuracy was measured as area under the receiver operating characteristic curve
(auROC); AD, Alzheimer’s disease; ADC, National Institute on Aging Alzheimer’s Disease
Centers Cohort; ADNI, Alzheimer’s Disease Neuroimaging Initiative (ADNI) database; CI,
confidence interval; LOAD, Late Onset Alzheimer’s Disease (LOAD) Family Study; MCI,
mild cognitive impairment; NN, neural network; wPRS, weight polygenic risk score.

Supplementary Table 3. Performance of polygenic score models in the European-descent
population AD cohorts
p-value cutoff Cohort P-value for testing the difference in auROC
NN vs. wPRS NN vs. wPRS2 NN vs. Lasso
P<1E−08
ADC < 2.20E−16 < 2.20E−16 1.42E−13
LOAD < 2.20E−16 < 2.20E−16 1.85E−08
ADNI 4.46E−02 3.61E−03 4.67E−01
P<1E−06
ADC < 2.20E−16 < 2.20E−16 3.29E−02
LOAD < 2.20E−16 < 2.20E−16 3.66E−05
ADNI 1.55E−02 1.17E−03 1.55E−02
P<1E−04
ADC < 2.20E−16 < 2.20E−16 1.12E−05
LOAD < 2.20E−16 < 2.20E−16 1.55E−11
ADNI 4.90E−06 1.36E−06 5.08E−01
Classification accuracy was measured as area under the receiver operating characteristic curve
(auROC); AD, Alzheimer’s disease; ADC, National Institute on Aging Alzheimer’s Disease
Centers Cohort; ADNI, Alzheimer’s Disease Neuroimaging Initiative (ADNI) database; CI,
confidence interval; LOAD, Late Onset Alzheimer’s Disease (LOAD) Family Study; MCI,
mild cognitive impairment; NN, neural network; wPRS, weight polygenic risk score. Bootstrap
one-tailed test.

Supplementary Table 4. Sources of the variants for the replication analysis
Ethnicity Index Sample
size PMID First author DOI Year
European
descent Number of variants retrieved: 183
1 788,989 N/A Céline Bellenguez 10.1101/2020.10.01.20200659 20207
2 472,868 N/A Jeremy
Schwartzentruber 10.1101/2020.01.22.20018424 20208
3 1,126,563 N/A Douglas P.
Wightman 10.1101/2020.11.20.20235275 20209
4 455,258 30617256 Iris E. Jansen 10.1038/s41588-018-0311-9 201910
5 94,437 30820047 Brian W. Kunkle 10.1038/s41588-019-0358-2 201911
6 25,580 29777097 Riccardo E. Marioni 10.1038/s41398-018-0150-6 201812
African-
American Number of variants retrieved: 14
7 8,006 33074286 Brian W. Kunkle 10.1001/jamaneurol.2020.3536 202013
Asian Number of variants retrieved: 13
8 11,506 33188687 Longfei Jia 10.1093/brain/awaa364 202014
Mixed Number of variants retrieved: 6 9 59,556 28183528 Gyungah R. Jun 10.1016/j.jalz.2016.12.012 201715
N/A, not applicable.
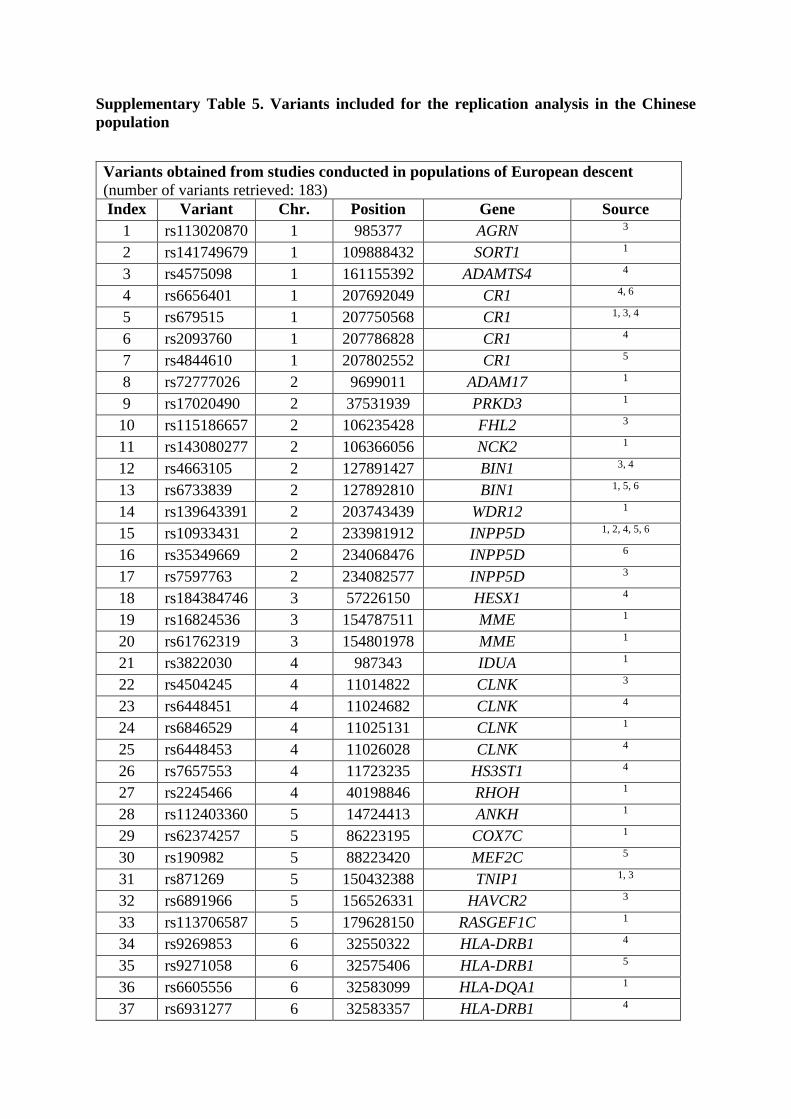
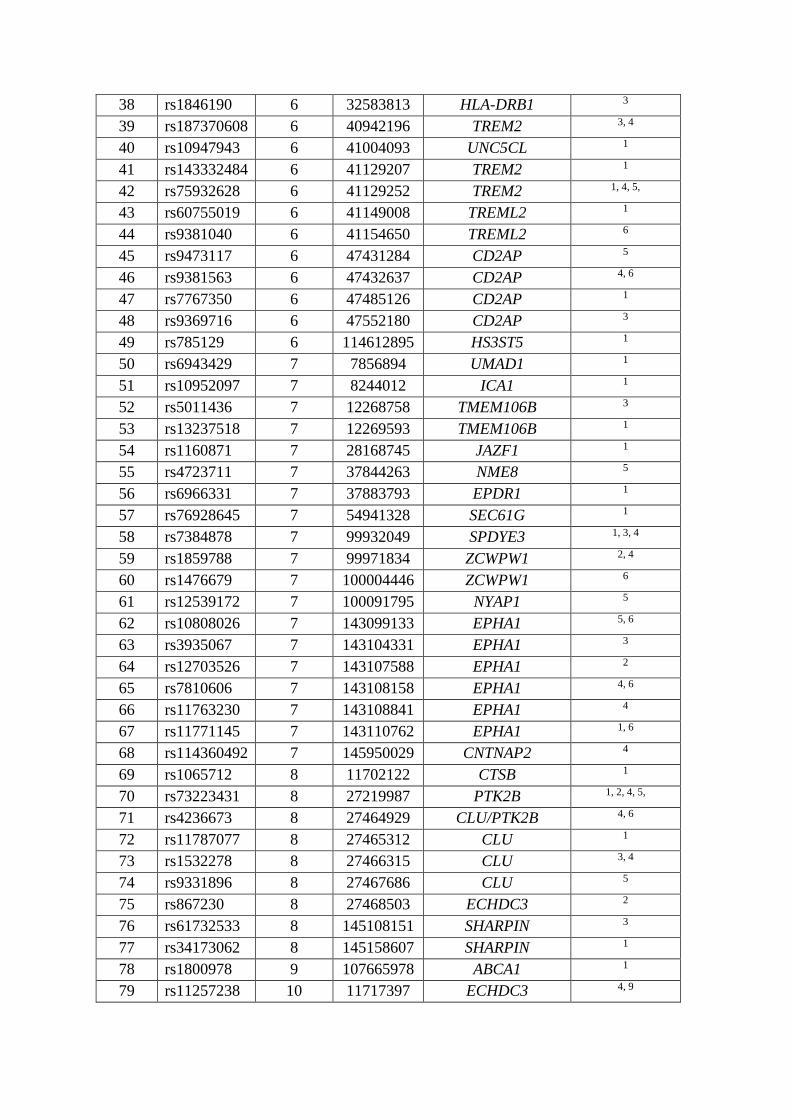
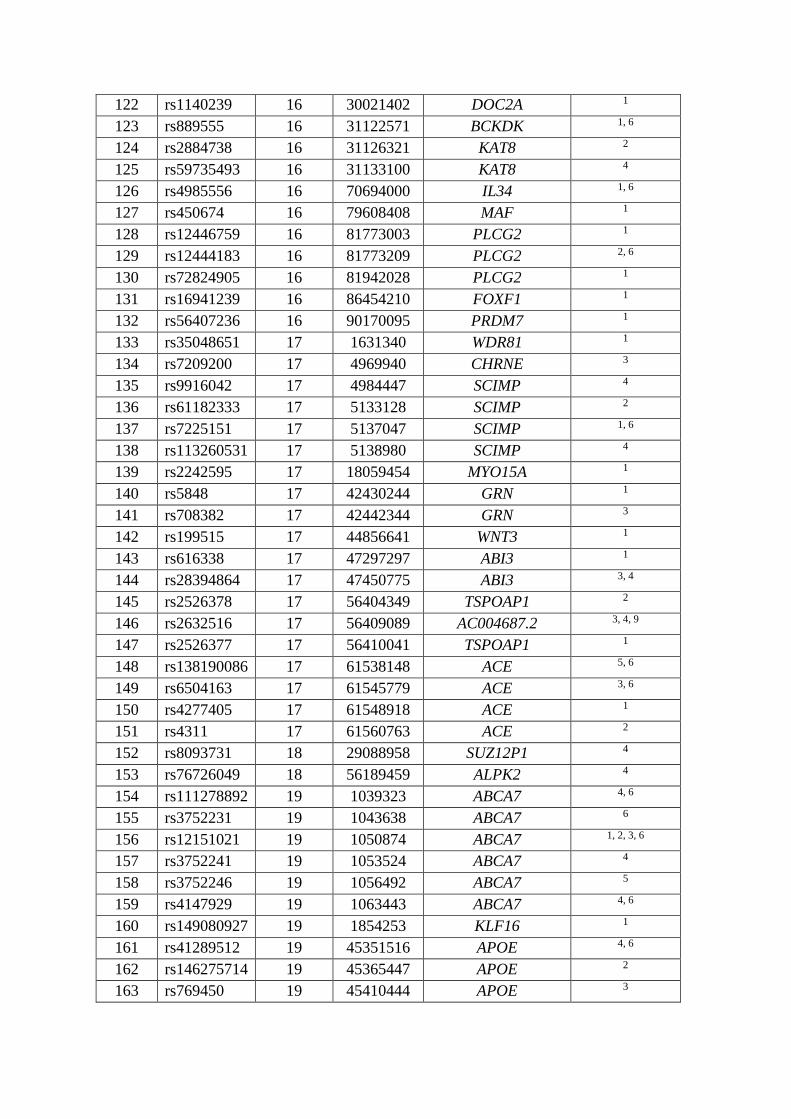
Supplementary Table 5. Variants included for the replication analysis in the Chinese
population
Variants obtained from studies conducted in populations of European descent
(number of variants retrieved: 183)
Index Variant Chr. Position Gene Source
1 rs113020870 1 985377 AGRN 3
2 rs141749679 1 109888432 SORT1 1
3 rs4575098 1 161155392 ADAMTS4 4
4 rs6656401 1 207692049 CR1 4, 6
5 rs679515 1 207750568 CR1 1, 3, 4
6 rs2093760 1 207786828 CR1 4
7 rs4844610 1 207802552 CR1 5
8 rs72777026 2 9699011 ADAM17 1
9 rs17020490 2 37531939 PRKD3 1
10 rs115186657 2 106235428 FHL2 3
11 rs143080277 2 106366056 NCK2 1
12 rs4663105 2 127891427 BIN1 3, 4
13 rs6733839 2 127892810 BIN1 1, 5, 6
14 rs139643391 2 203743439 WDR12 1
15 rs10933431 2 233981912 INPP5D 1, 2, 4, 5, 6
16 rs35349669 2 234068476 INPP5D 6
17 rs7597763 2 234082577 INPP5D 3
18 rs184384746 3 57226150 HESX1 4
19 rs16824536 3 154787511 MME 1
20 rs61762319 3 154801978 MME 1
21 rs3822030 4 987343 IDUA 1
22 rs4504245 4 11014822 CLNK 3
23 rs6448451 4 11024682 CLNK 4
24 rs6846529 4 11025131 CLNK 1
25 rs6448453 4 11026028 CLNK 4
26 rs7657553 4 11723235 HS3ST1 4
27 rs2245466 4 40198846 RHOH 1
28 rs112403360 5 14724413 ANKH 1
29 rs62374257 5 86223195 COX7C 1
30 rs190982 5 88223420 MEF2C 5
31 rs871269 5 150432388 TNIP1 1, 3
32 rs6891966 5 156526331 HAVCR2 3
33 rs113706587 5 179628150 RASGEF1C 1
34 rs9269853 6 32550322 HLA-DRB1 4
35 rs9271058 6 32575406 HLA-DRB1 5
36 rs6605556 6 32583099 HLA-DQA1 1
37 rs6931277 6 32583357 HLA-DRB1 4
38 rs1846190 6 32583813 HLA-DRB1 3
39 rs187370608 6 40942196 TREM2 3, 4
40 rs10947943 6 41004093 UNC5CL 1
41 rs143332484 6 41129207 TREM2 1
42 rs75932628 6 41129252 TREM2 1, 4, 5,
43 rs60755019 6 41149008 TREML2 1
44 rs9381040 6 41154650 TREML2 6
45 rs9473117 6 47431284 CD2AP 5
46 rs9381563 6 47432637 CD2AP 4, 6
47 rs7767350 6 47485126 CD2AP 1
48 rs9369716 6 47552180 CD2AP 3
49 rs785129 6 114612895 HS3ST5 1
50 rs6943429 7 7856894 UMAD1 1
51 rs10952097 7 8244012 ICA1 1
52 rs5011436 7 12268758 TMEM106B 3
53 rs13237518 7 12269593 TMEM106B 1
54 rs1160871 7 28168745 JAZF1 1
55 rs4723711 7 37844263 NME8 5
56 rs6966331 7 37883793 EPDR1 1
57 rs76928645 7 54941328 SEC61G 1
58 rs7384878 7 99932049 SPDYE3 1, 3, 4
59 rs1859788 7 99971834 ZCWPW1 2, 4
60 rs1476679 7 100004446 ZCWPW1 6
61 rs12539172 7 100091795 NYAP1 5
62 rs10808026 7 143099133 EPHA1 5, 6
63 rs3935067 7 143104331 EPHA1 3
64 rs12703526 7 143107588 EPHA1 2
65 rs7810606 7 143108158 EPHA1 4, 6
66 rs11763230 7 143108841 EPHA1 4
67 rs11771145 7 143110762 EPHA1 1, 6
68 rs114360492 7 145950029 CNTNAP2 4
69 rs1065712 8 11702122 CTSB 1
70 rs73223431 8 27219987 PTK2B 1, 2, 4, 5,
71 rs4236673 8 27464929 CLU/PTK2B 4, 6
72 rs11787077 8 27465312 CLU 1
73 rs1532278 8 27466315 CLU 3, 4
74 rs9331896 8 27467686 CLU 5
75 rs867230 8 27468503 ECHDC3 2
76 rs61732533 8 145108151 SHARPIN 3
77 rs34173062 8 145158607 SHARPIN 1
78 rs1800978 9 107665978 ABCA1 1
79 rs11257238 10 11717397 ECHDC3 4, 9

80 rs7912495 10 11718713 USP6NL 1, 3
81 rs7920721 10 11720308 ECHDC3 2, 5, 6, 9
82 rs11257242 10 11721119 ECHDC3 4, 9
83 rs1171814 10 61645833 CCDC6 2
84 rs7902657 10 61738152 CCDC6 3
85 rs7068231 10 61784928 ANK3 1
86 rs6586028 10 82253984 TSPAN14 1
87 rs1878036 10 82280137 TSPAN14 2
88 rs6584063 10 98026407 BLNK 1
89 rs7908662 10 124172912 PLEKHA1 1
90 rs3740688 11 47380340 MADD 3, 5, 6
91 rs10437655 11 47391948 SPI1 1, 2
92 rs12292911 11 47449072 SPI1 6
93 rs7933202 11 59936926 MS4A2 5
94 rs7935829 11 59942815 MS4A6A 4
95 rs2081545 11 59958380 MS4A6A 4
96 rs1582763 11 60021948 MS4A4A 1, 3, 4, 6
97 rs72924626 11 60095740 MS4A6E 2
98 rs867611 11 85776544 PICALM 4
99 rs561655 11 85800279 PICALM 3
100 rs3844143 11 85850243 PICALM 4
101 rs10792832 11 85867875 PICALM 2, 4, 6
102 rs3851179 11 85868640 PICALM 1, 5
103 rs74685827 11 121353077 SORL1 1
104 rs11218343 11 121435587 SORL1 1, 2, 3, 4, 5, 6
105 rs6489896 12 113719788 TPCN1 1
106 rs7146179 14 53298853 FERMT2 3
107 rs17125924 14 53391680 FERMT2 1, 2, 5, 6
108 rs7401792 14 92931261 SLC24A4 1
109 rs12881735 14 92932828 SLC24A4 5, 6
110 rs12590654 14 92938855 SLC24A4 1, 2, 3, 4, 6
111 rs7157106 14 106228095 IGH gene cluster 1
112 rs10131280 14 107121607 IGH gene cluster 1
113 rs12592778 15 50992311 SLC24A4 2
114 rs8025980 15 50994011 SPPL2A 1
115 rs59685680 15 51001534 SPPL2A 6
116 rs442495 15 59022615 ADAM10 2, 4
117 rs593742 15 59045774 ADAM10 6
118 rs602602 15 59057023 MINDY2 1, 3
119 rs117618017 15 63569902 APH1B 1, 2, 3, 4
120 rs3848143 15 64423506 SNX1 1
121 rs12592898 15 79229199 CTSH 1
122 rs1140239 16 30021402 DOC2A 1
123 rs889555 16 31122571 BCKDK 1, 6
124 rs2884738 16 31126321 KAT8 2
125 rs59735493 16 31133100 KAT8 4
126 rs4985556 16 70694000 IL34 1, 6
127 rs450674 16 79608408 MAF 1
128 rs12446759 16 81773003 PLCG2 1
129 rs12444183 16 81773209 PLCG2 2, 6
130 rs72824905 16 81942028 PLCG2 1
131 rs16941239 16 86454210 FOXF1 1
132 rs56407236 16 90170095 PRDM7 1
133 rs35048651 17 1631340 WDR81 1
134 rs7209200 17 4969940 CHRNE 3
135 rs9916042 17 4984447 SCIMP 4
136 rs61182333 17 5133128 SCIMP 2
137 rs7225151 17 5137047 SCIMP 1, 6
138 rs113260531 17 5138980 SCIMP 4
139 rs2242595 17 18059454 MYO15A 1
140 rs5848 17 42430244 GRN 1
141 rs708382 17 42442344 GRN 3
142 rs199515 17 44856641 WNT3 1
143 rs616338 17 47297297 ABI3 1
144 rs28394864 17 47450775 ABI3 3, 4
145 rs2526378 17 56404349 TSPOAP1 2
146 rs2632516 17 56409089 AC004687.2 3, 4, 9
147 rs2526377 17 56410041 TSPOAP1 1
148 rs138190086 17 61538148 ACE 5, 6
149 rs6504163 17 61545779 ACE 3, 6
150 rs4277405 17 61548918 ACE 1
151 rs4311 17 61560763 ACE 2
152 rs8093731 18 29088958 SUZ12P1 4
153 rs76726049 18 56189459 ALPK2 4
154 rs111278892 19 1039323 ABCA7 4, 6
155 rs3752231 19 1043638 ABCA7 6
156 rs12151021 19 1050874 ABCA7 1, 2, 3, 6
157 rs3752241 19 1053524 ABCA7 4
158 rs3752246 19 1056492 ABCA7 5
159 rs4147929 19 1063443 ABCA7 4, 6
160 rs149080927 19 1854253 KLF16 1
161 rs41289512 19 45351516 APOE 4, 6
162 rs146275714 19 45365447 APOE 2
163 rs769450 19 45410444 APOE 3

164 rs429358 19 45411941 APOE 2, 5
165 rs75627662 19 45413576 APOE 4
166 rs76320948 19 46241841 AC074212.3 4
167 rs2452170 19 49213504 NTN5 3
168 rs9304690 19 50453317 SIGLEC11 1
169 rs3865444 19 51727962 CD33 2, 4
170 rs12459419 19 51728477 CD33 6
171 rs1354106 19 51737991 CD33 3
172 rs587709 19 54771451 LILRB2 1
173 rs1761461 19 54825174 KIR3DL2 3
174 rs1358782 20 393978 RBCK1 1
175 rs6069736 20 54983075 CASS4 6
176 rs6069737 20 54995699 CASS4 3
177 rs6024870 20 54997568 CASS4 5
178 rs6014724 20 54998544 CASS4 1, 2, 4
179 rs6742 20 62374441 SLC2A4RG 1
180 rs2154481 21 27473875 APP 1
181 rs2154482 21 27520931 APP 3
182 rs4817090 21 27534261 ADAMTS1 2
183 rs2830489 21 28148191 ADAMTS1 1, 2
Variants obtained from studies conducted in African-American populations
(number of variants retrieved: 14)
Index Variant Chr. Position Gene Source
184 rs115684722 1 232376163 SIPAIL2 7
185 rs168193 3 5302077 EDEM1 7
186 rs2633682 3 104409208 ALCAM 7
187 rs184179037 5 37483940 WDR70 7
188 rs145848414 5 174014114 NSG2-MSX2 7
189 rs569584007 11 43166842 API5 7
190 rs115816806 11 76541840 ACER3 7
191 rs75739461 12 18471546 PIK3C2G 7
192 rs9516245 13 94159800 GPC6 7
193 rs570487962 15 97992685 ARRDC4-IGF1R 7
194 rs79537509 16 8288401 RBFOX1 7
195 rs115550680 19 1050420 ABCA7 7
196 rs157591 19 45423934 APOE 7
197 rs3745495 19 50524332 VRK3 7
Variants obtained from studies conducted in Asian populations
(number of variants retrieved: 13)
Index Variant Chr. Position Gene Source
198 rs6859823 5 105554384 CTC-278L1.1 8
199 rs3777215 5 95122000 RHOBTB3, GLRX 8
200 rs234434 14 97821020 CTD-2506J14.1 8

201 rs11668861 19 45380970 NECTIN2 8
202 rs6859 19 45382034 NECTIN2 8
203 rs3852860 19 45382966 NECTIN2 8
204 rs71352238 19 45394336 TOMM40 8
205 rs157580 19 45395266 TOMM40 8
206 rs2075650 19 45395619 TOMM40 8
207 rs157582 19 45396219 TOMM40 8
208 rs439401 19 45414451 APOE 8
209 rs4420638 19 45422946 APOC1 8
210 rs2255835 21 19491664 CHODL 8
Variants obtained from studies conducted in mixed populations
(number of variants retrieved: 6)
Index Variant Chr. Position Gene Source
211 rs11168036 5 139707439 PFDN1/HBEGF 9
212 rs4150233 5 139714837 PFDN1/HBEGF 9
213 rs2011704 10 11718331 USP6NL/ECHDC3 9
214 rs11257240 10 11719074 USP6NL/ECHDC3 9
215 rs12358692 10 11721102 USP6NL/ECHDC3 9
216 rs9749589 19 3405592 NFIC 9
Chr., chromosome. Sources correspond to the index numbers in Supplementary Table 2.
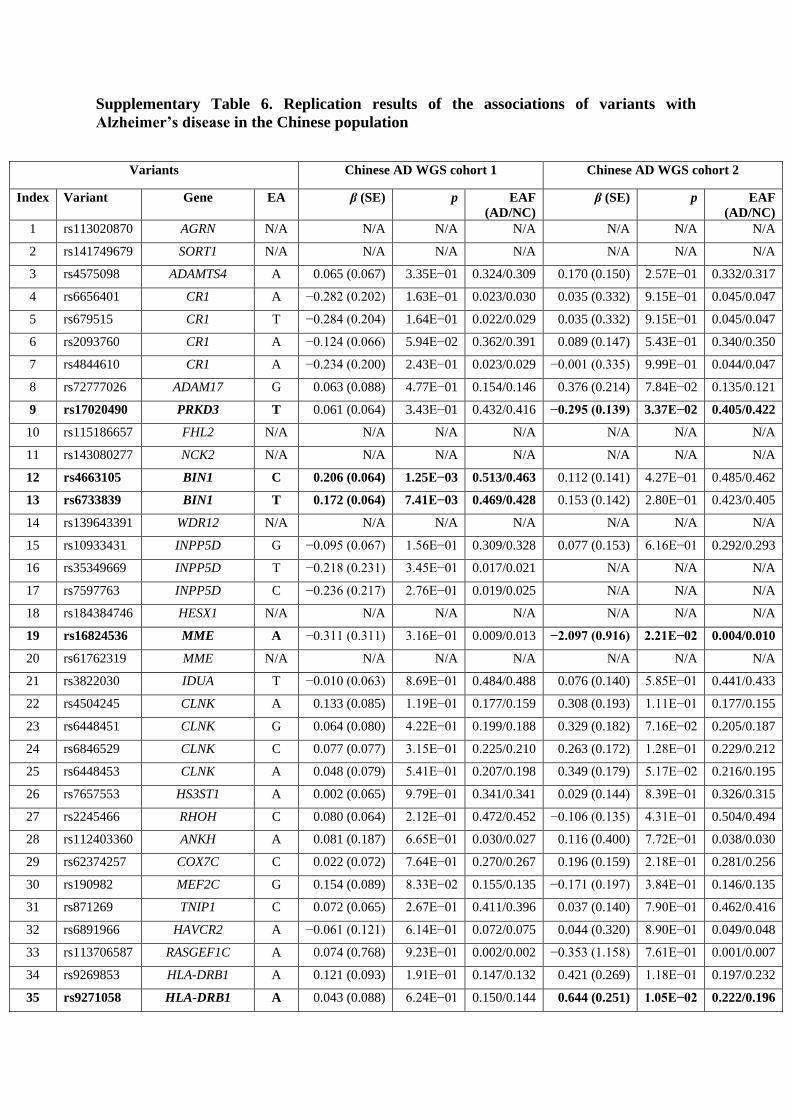
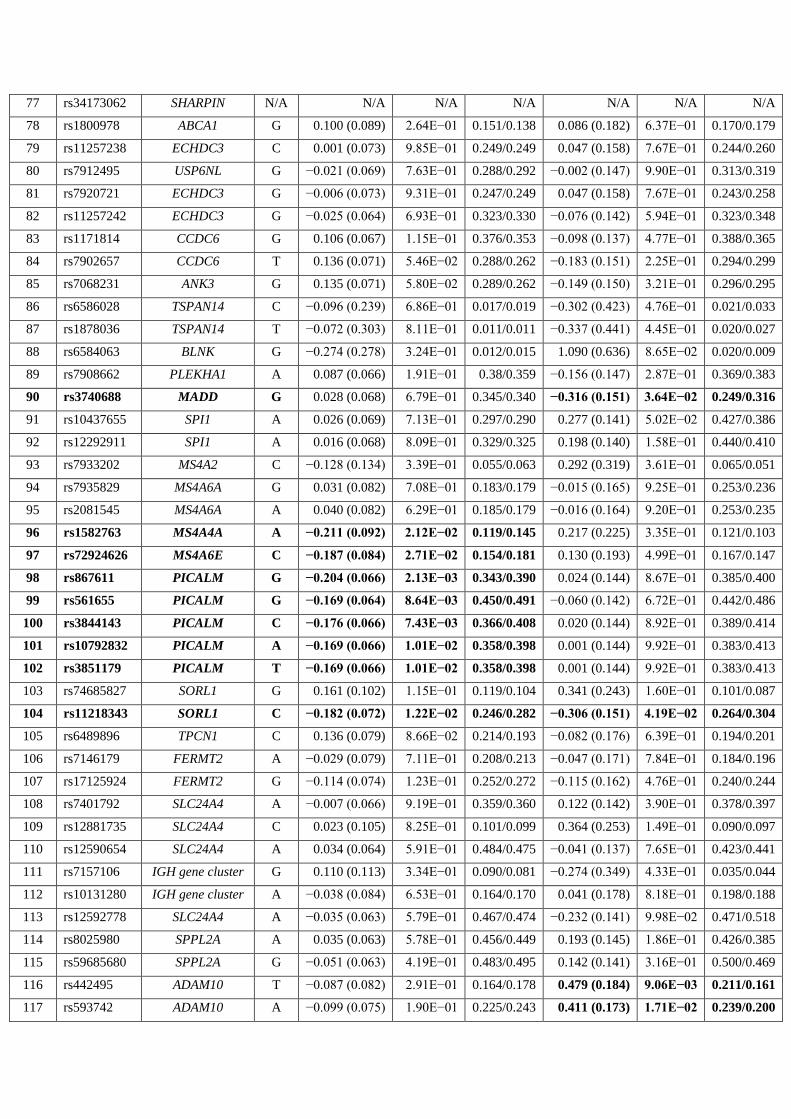
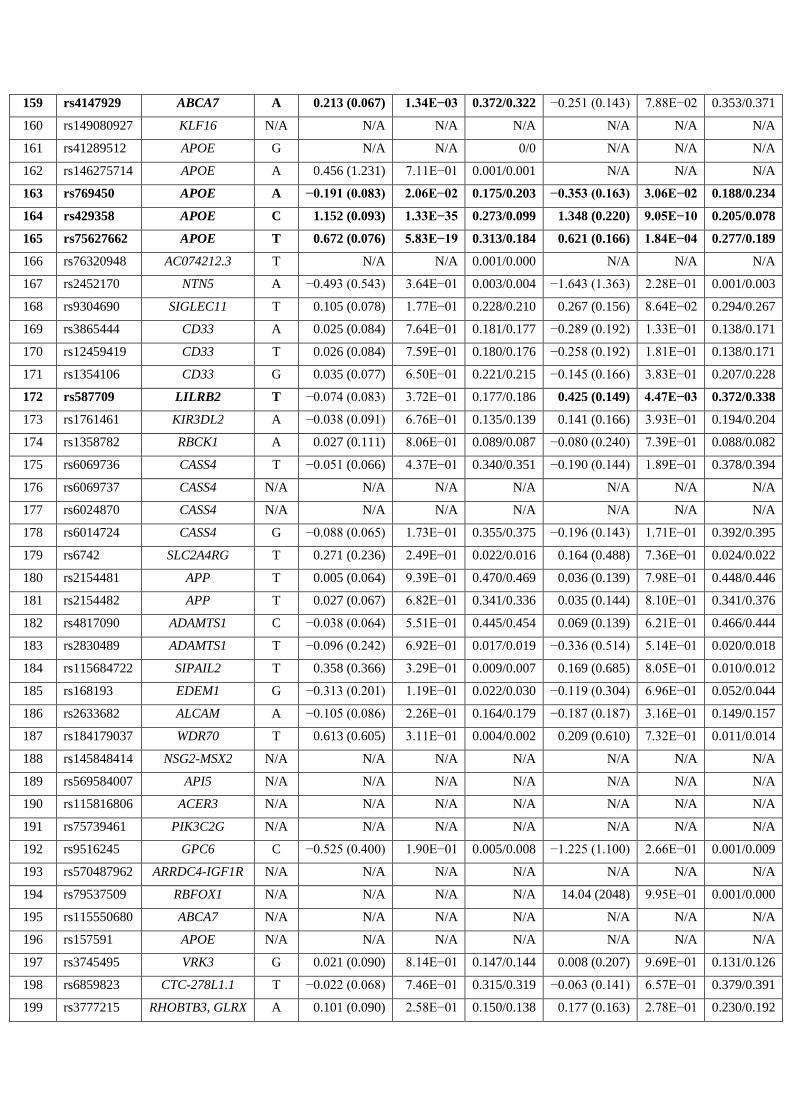
Supplementary Table 6. Replication results of the associations of variants with
Alzheimer’s disease in the Chinese population
Variants Chinese AD WGS cohort 1 Chinese AD WGS cohort 2
Index Variant Gene EA β (SE) p EAF
(AD/NC)
β (SE) p EAF
(AD/NC)
1 rs113020870 AGRN N/A N/A N/A N/A N/A N/A N/A
2 rs141749679 SORT1 N/A N/A N/A N/A N/A N/A N/A
3 rs4575098 ADAMTS4 A 0.065 (0.067) 3.35E−01 0.324/0.309 0.170 (0.150) 2.57E−01 0.332/0.317
4 rs6656401 CR1 A −0.282 (0.202) 1.63E−01 0.023/0.030 0.035 (0.332) 9.15E−01 0.045/0.047
5 rs679515 CR1 T −0.284 (0.204) 1.64E−01 0.022/0.029 0.035 (0.332) 9.15E−01 0.045/0.047
6 rs2093760 CR1 A −0.124 (0.066) 5.94E−02 0.362/0.391 0.089 (0.147) 5.43E−01 0.340/0.350
7 rs4844610 CR1 A −0.234 (0.200) 2.43E−01 0.023/0.029 −0.001 (0.335) 9.99E−01 0.044/0.047
8 rs72777026 ADAM17 G 0.063 (0.088) 4.77E−01 0.154/0.146 0.376 (0.214) 7.84E−02 0.135/0.121
9 rs17020490 PRKD3 T 0.061 (0.064) 3.43E−01 0.432/0.416 −0.295 (0.139) 3.37E−02 0.405/0.422
10 rs115186657 FHL2 N/A N/A N/A N/A N/A N/A N/A
11 rs143080277 NCK2 N/A N/A N/A N/A N/A N/A N/A
12 rs4663105 BIN1 C 0.206 (0.064) 1.25E−03 0.513/0.463 0.112 (0.141) 4.27E−01 0.485/0.462
13 rs6733839 BIN1 T 0.172 (0.064) 7.41E−03 0.469/0.428 0.153 (0.142) 2.80E−01 0.423/0.405
14 rs139643391 WDR12 N/A N/A N/A N/A N/A N/A N/A
15 rs10933431 INPP5D G −0.095 (0.067) 1.56E−01 0.309/0.328 0.077 (0.153) 6.16E−01 0.292/0.293
16 rs35349669 INPP5D T −0.218 (0.231) 3.45E−01 0.017/0.021 N/A N/A N/A
17 rs7597763 INPP5D C −0.236 (0.217) 2.76E−01 0.019/0.025 N/A N/A N/A
18 rs184384746 HESX1 N/A N/A N/A N/A N/A N/A N/A
19 rs16824536 MME A −0.311 (0.311) 3.16E−01 0.009/0.013 −2.097 (0.916) 2.21E−02 0.004/0.010
20 rs61762319 MME N/A N/A N/A N/A N/A N/A N/A
21 rs3822030 IDUA T −0.010 (0.063) 8.69E−01 0.484/0.488 0.076 (0.140) 5.85E−01 0.441/0.433
22 rs4504245 CLNK A 0.133 (0.085) 1.19E−01 0.177/0.159 0.308 (0.193) 1.11E−01 0.177/0.155
23 rs6448451 CLNK G 0.064 (0.080) 4.22E−01 0.199/0.188 0.329 (0.182) 7.16E−02 0.205/0.187
24 rs6846529 CLNK C 0.077 (0.077) 3.15E−01 0.225/0.210 0.263 (0.172) 1.28E−01 0.229/0.212
25 rs6448453 CLNK A 0.048 (0.079) 5.41E−01 0.207/0.198 0.349 (0.179) 5.17E−02 0.216/0.195
26 rs7657553 HS3ST1 A 0.002 (0.065) 9.79E−01 0.341/0.341 0.029 (0.144) 8.39E−01 0.326/0.315
27 rs2245466 RHOH C 0.080 (0.064) 2.12E−01 0.472/0.452 −0.106 (0.135) 4.31E−01 0.504/0.494
28 rs112403360 ANKH A 0.081 (0.187) 6.65E−01 0.030/0.027 0.116 (0.400) 7.72E−01 0.038/0.030
29 rs62374257 COX7C C 0.022 (0.072) 7.64E−01 0.270/0.267 0.196 (0.159) 2.18E−01 0.281/0.256
30 rs190982 MEF2C G 0.154 (0.089) 8.33E−02 0.155/0.135 −0.171 (0.197) 3.84E−01 0.146/0.135
31 rs871269 TNIP1 C 0.072 (0.065) 2.67E−01 0.411/0.396 0.037 (0.140) 7.90E−01 0.462/0.416
32 rs6891966 HAVCR2 A −0.061 (0.121) 6.14E−01 0.072/0.075 0.044 (0.320) 8.90E−01 0.049/0.048
33 rs113706587 RASGEF1C A 0.074 (0.768) 9.23E−01 0.002/0.002 −0.353 (1.158) 7.61E−01 0.001/0.007
34 rs9269853 HLA-DRB1 A 0.121 (0.093) 1.91E−01 0.147/0.132 0.421 (0.269) 1.18E−01 0.197/0.232
35 rs9271058 HLA-DRB1 A 0.043 (0.088) 6.24E−01 0.150/0.144 0.644 (0.251) 1.05E−02 0.222/0.196

36 rs6605556 HLA-DQA1 G −0.145 (0.093) 1.18E−01 0.116/0.132 −0.464 (0.265) 7.96E−02 0.081/0.119
37 rs6931277 HLA-DRB1 T −0.145 (0.095) 1.27E−01 0.114/0.130 −0.287 (0.261) 2.73E−01 0.091/0.118
38 rs1846190 HLA-DRB1 A −0.025 (0.072) 7.23E−01 0.253/0.255 −0.111 (0.156) 4.78E−01 0.221/0.256
39 rs187370608 TREM2 N/A N/A N/A N/A N/A N/A N/A
40 rs10947943 UNC5CL A 0.083 (0.102) 4.14E−01 0.112/0.104 0.172 (0.219) 4.34E−01 0.119/0.114
41 rs143332484 TREM2 N/A N/A N/A N/A N/A N/A N/A
42 rs75932628 TREM2 N/A N/A N/A N/A N/A N/A N/A
43 rs60755019 TREML2 G 1.324 (0.786) 9.22E−02 0.004/0.001 0.370 (0.920) 6.88E−01 0.007/0.005
44 rs9381040 TREML2 T 0.164 (0.068) 1.57E−02 0.349/0.314 0.318 (0.150) 3.39E−02 0.379/0.361
45 rs9473117 CD2AP C 0.096 (0.098) 3.27E−01 0.130/0.120 0.171 (0.200) 3.95E−01 0.143/0.142
46 rs9381563 CD2AP C 0.132 (0.085) 1.19E−01 0.192/0.173 0.063 (0.174) 7.17E−01 0.218/0.210
47 rs7767350 CD2AP T 0.085 (0.096) 3.77E−01 0.131/0.122 0.135 (0.199) 4.96E−01 0.146/0.145
48 rs9369716 CD2AP T 0.093 (0.096) 3.36E−01 0.133/0.122 0.142 (0.199) 4.75E−01 0.146/0.145
49 rs785129 HS3ST5 C −0.095 (0.069) 1.69E−01 0.320/0.340 0.038 (0.137) 7.82E−01 0.389/0.388
50 rs6943429 UMAD1 T 0.008 (0.064) 9.05E−01 0.414/0.410 −0.027 (0.140) 8.49E−01 0.482/0.470
51 rs10952097 ICA1 T 0.088 (0.109) 4.19E−01 0.097/0.089 −0.014 (0.217) 9.49E−01 0.125/0.136
52 rs5011436 TMEM106B A 0.068 (0.064) 2.89E−01 0.335/0.318 −0.218 (0.140) 1.20E−01 0.355/0.364
53 rs13237518 TMEM106B C 0.083 (0.066) 2.08E−01 0.338/0.319 −0.216 (0.144) 1.33E−01 0.358/0.365
54 rs1160871 JAZF1 N/A N/A N/A N/A N/A N/A N/A
55 rs4723711 NME8 T −0.015 (0.075) 8.43E−01 0.235/0.238 0.069 (0.176) 6.96E−01 0.192/0.188
56 rs6966331 EPDR1 C −0.040 (0.063) 5.30E−01 0.469/0.478 0.106 (0.133) 4.24E−01 0.514/0.492
57 rs76928645 SEC61G T −0.177 (1.426) 9.01E−01 0/0.001 N/A N/A N/A
58 rs7384878 SPDYE3 T 0.071 (0.065) 2.72E−01 0.418/0.401 0.146 (0.142) 3.06E−01 0.360/0.335
59 rs1859788 ZCWPW1 G 0.084 (0.064) 1.93E−01 0.431/0.410 0.191 (0.143) 1.83E−01 0.371/0.341
60 rs1476679 ZCWPW1 C −0.052 (0.068) 4.46E−01 0.309/0.320 −0.042 (0.144) 7.69E−01 0.351/0.353
61 rs12539172 NYAP1 T −0.05 (0.068) 4.62E−01 0.306/0.317 −0.038 (0.145) 7.90E−01 0.350/0.352
62 rs10808026 EPHA1 A −0.023 (0.094) 8.07E−01 0.132/0.134 0.304 (0.208) 1.44E−01 0.138/0.126
63 rs3935067 EPHA1 C 0.126 (0.198) 5.24E−01 0.027/0.024 0.400 (0.418) 3.39E−01 0.037/0.027
64 rs12703526 EPHA1 T 0.039 (0.090) 6.63E−01 0.150/0.145 −0.263 (0.192) 1.71E−01 0.146/0.166
65 rs7810606 EPHA1 C 0.026 (0.090) 7.76E−01 0.148/0.145 −0.263 (0.192) 1.71E−01 0.146/0.165
66 rs11763230 EPHA1 T 0.018 (0.093) 8.49E−01 0.143/0.142 0.356 (0.209) 8.77E−02 0.139/0.126
67 rs11771145 EPHA1 G 0.038 (0.063) 5.41E−01 0.464/0.454 −0.062 (0.133) 6.40E−01 0.483/0.479
68 rs114360492 CNTNAP2 N/A N/A N/A N/A N/A N/A N/A
69 rs1065712 CTSB N/A N/A N/A N/A N/A N/A N/A
70 rs73223431 PTK2B T 0.056 (0.070) 4.26E−01 0.280/0.268 0.199 (0.145) 1.70E−01 0.320/0.287
71 rs4236673 CLU/PTK2B A −0.117 (0.083) 1.56E−01 0.176/0.192 −0.262 (0.161) 1.03E−01 0.236/0.250
72 rs11787077 CLU T −0.131 (0.080) 1.03E−01 0.186/0.206 −0.262 (0.161) 1.03E−01 0.236/0.253
73 rs1532278 CLU T −0.136 (0.080) 9.01E−02 0.185/0.206 −0.263 (0.159) 9.74E−02 0.237/0.254
74 rs9331896 CLU C −0.117 (0.080) 1.46E−01 0.186/0.203 −0.248 (0.161) 1.23E−01 0.239/0.255
75 rs867230 ECHDC3 C −0.129 (0.080) 1.06E−01 0.188/0.208 −0.188 (0.162) 2.46E−01 0.242/0.252
76 rs61732533 SHARPIN A −2.840 (1.038) 6.20E−03 0.000/0.008 N/A N/A N/A
77 rs34173062 SHARPIN N/A N/A N/A N/A N/A N/A N/A
78 rs1800978 ABCA1 G 0.100 (0.089) 2.64E−01 0.151/0.138 0.086 (0.182) 6.37E−01 0.170/0.179
79 rs11257238 ECHDC3 C 0.001 (0.073) 9.85E−01 0.249/0.249 0.047 (0.158) 7.67E−01 0.244/0.260
80 rs7912495 USP6NL G −0.021 (0.069) 7.63E−01 0.288/0.292 −0.002 (0.147) 9.90E−01 0.313/0.319
81 rs7920721 ECHDC3 G −0.006 (0.073) 9.31E−01 0.247/0.249 0.047 (0.158) 7.67E−01 0.243/0.258
82 rs11257242 ECHDC3 G −0.025 (0.064) 6.93E−01 0.323/0.330 −0.076 (0.142) 5.94E−01 0.323/0.348
83 rs1171814 CCDC6 G 0.106 (0.067) 1.15E−01 0.376/0.353 −0.098 (0.137) 4.77E−01 0.388/0.365
84 rs7902657 CCDC6 T 0.136 (0.071) 5.46E−02 0.288/0.262 −0.183 (0.151) 2.25E−01 0.294/0.299
85 rs7068231 ANK3 G 0.135 (0.071) 5.80E−02 0.289/0.262 −0.149 (0.150) 3.21E−01 0.296/0.295
86 rs6586028 TSPAN14 C −0.096 (0.239) 6.86E−01 0.017/0.019 −0.302 (0.423) 4.76E−01 0.021/0.033
87 rs1878036 TSPAN14 T −0.072 (0.303) 8.11E−01 0.011/0.011 −0.337 (0.441) 4.45E−01 0.020/0.027
88 rs6584063 BLNK G −0.274 (0.278) 3.24E−01 0.012/0.015 1.090 (0.636) 8.65E−02 0.020/0.009
89 rs7908662 PLEKHA1 A 0.087 (0.066) 1.91E−01 0.38/0.359 −0.156 (0.147) 2.87E−01 0.369/0.383
90 rs3740688 MADD G 0.028 (0.068) 6.79E−01 0.345/0.340 −0.316 (0.151) 3.64E−02 0.249/0.316
91 rs10437655 SPI1 A 0.026 (0.069) 7.13E−01 0.297/0.290 0.277 (0.141) 5.02E−02 0.427/0.386
92 rs12292911 SPI1 A 0.016 (0.068) 8.09E−01 0.329/0.325 0.198 (0.140) 1.58E−01 0.440/0.410
93 rs7933202 MS4A2 C −0.128 (0.134) 3.39E−01 0.055/0.063 0.292 (0.319) 3.61E−01 0.065/0.051
94 rs7935829 MS4A6A G 0.031 (0.082) 7.08E−01 0.183/0.179 −0.015 (0.165) 9.25E−01 0.253/0.236
95 rs2081545 MS4A6A A 0.040 (0.082) 6.29E−01 0.185/0.179 −0.016 (0.164) 9.20E−01 0.253/0.235
96 rs1582763 MS4A4A A −0.211 (0.092) 2.12E−02 0.119/0.145 0.217 (0.225) 3.35E−01 0.121/0.103
97 rs72924626 MS4A6E C −0.187 (0.084) 2.71E−02 0.154/0.181 0.130 (0.193) 4.99E−01 0.167/0.147
98 rs867611 PICALM G −0.204 (0.066) 2.13E−03 0.343/0.390 0.024 (0.144) 8.67E−01 0.385/0.400
99 rs561655 PICALM G −0.169 (0.064) 8.64E−03 0.450/0.491 −0.060 (0.142) 6.72E−01 0.442/0.486
100 rs3844143 PICALM C −0.176 (0.066) 7.43E−03 0.366/0.408 0.020 (0.144) 8.92E−01 0.389/0.414
101 rs10792832 PICALM A −0.169 (0.066) 1.01E−02 0.358/0.398 0.001 (0.144) 9.92E−01 0.383/0.413
102 rs3851179 PICALM T −0.169 (0.066) 1.01E−02 0.358/0.398 0.001 (0.144) 9.92E−01 0.383/0.413
103 rs74685827 SORL1 G 0.161 (0.102) 1.15E−01 0.119/0.104 0.341 (0.243) 1.60E−01 0.101/0.087
104 rs11218343 SORL1 C −0.182 (0.072) 1.22E−02 0.246/0.282 −0.306 (0.151) 4.19E−02 0.264/0.304
105 rs6489896 TPCN1 C 0.136 (0.079) 8.66E−02 0.214/0.193 −0.082 (0.176) 6.39E−01 0.194/0.201
106 rs7146179 FERMT2 A −0.029 (0.079) 7.11E−01 0.208/0.213 −0.047 (0.171) 7.84E−01 0.184/0.196
107 rs17125924 FERMT2 G −0.114 (0.074) 1.23E−01 0.252/0.272 −0.115 (0.162) 4.76E−01 0.240/0.244
108 rs7401792 SLC24A4 A −0.007 (0.066) 9.19E−01 0.359/0.360 0.122 (0.142) 3.90E−01 0.378/0.397
109 rs12881735 SLC24A4 C 0.023 (0.105) 8.25E−01 0.101/0.099 0.364 (0.253) 1.49E−01 0.090/0.097
110 rs12590654 SLC24A4 A 0.034 (0.064) 5.91E−01 0.484/0.475 −0.041 (0.137) 7.65E−01 0.423/0.441
111 rs7157106 IGH gene cluster G 0.110 (0.113) 3.34E−01 0.090/0.081 −0.274 (0.349) 4.33E−01 0.035/0.044
112 rs10131280 IGH gene cluster A −0.038 (0.084) 6.53E−01 0.164/0.170 0.041 (0.178) 8.18E−01 0.198/0.188
113 rs12592778 SLC24A4 A −0.035 (0.063) 5.79E−01 0.467/0.474 −0.232 (0.141) 9.98E−02 0.471/0.518
114 rs8025980 SPPL2A A 0.035 (0.063) 5.78E−01 0.456/0.449 0.193 (0.145) 1.86E−01 0.426/0.385
115 rs59685680 SPPL2A G −0.051 (0.063) 4.19E−01 0.483/0.495 0.142 (0.141) 3.16E−01 0.500/0.469
116 rs442495 ADAM10 T −0.087 (0.082) 2.91E−01 0.164/0.178 0.479 (0.184) 9.06E−03 0.211/0.161
117 rs593742 ADAM10 A −0.099 (0.075) 1.90E−01 0.225/0.243 0.411 (0.173) 1.71E−02 0.239/0.200

118 rs602602 MINDY2 T −0.101 (0.072) 1.60E−01 0.250/0.271 0.454 (0.167) 6.44E−03 0.273/0.217
119 rs117618017 APH1B N/A N/A N/A N/A N/A N/A N/A
120 rs3848143 SNX1 G 0.122 (0.079) 1.23E−01 0.203/0.183 0.046 (0.175) 7.94E−01 0.164/0.181
121 rs12592898 CTSH A −0.200 (0.149) 1.80E−01 0.044/0.052 0.123 (0.280) 6.61E−01 0.067/0.070
122 rs1140239 DOC2A T 0.116 (0.065) 7.43E−02 0.411/0.383 −0.121 (0.138) 3.84E−01 0.441/0.445
123 rs889555 BCKDK T 0.073 (0.123) 5.52E−01 0.075/0.071 0.075 (0.208) 7.19E−01 0.132/0.126
124 rs2884738 KAT8 A 0.074 (0.123) 5.47E−01 0.075/0.071 0.076 (0.208) 7.13E−01 0.132/0.125
125 rs59735493 KAT8 A 0.083 (0.123) 5.00E−01 0.075/0.070 0.111 (0.210) 5.97E−01 0.132/0.124
126 rs4985556 IL34 A 0.184 (0.131) 1.58E−01 0.069/0.057 0.213 (0.253) 4.00E−01 0.093/0.074
127 rs450674 MAF C −0.179 (0.158) 2.58E−01 0.037/0.044 −0.555 (0.353) 1.15E−01 0.032/0.046
128 rs12446759 PLCG2 G −0.130 (0.078) 9.46E−02 0.185/0.205 −0.021 (0.161) 8.95E−01 0.218/0.231
129 rs12444183 PLCG2 A −0.087 (0.077) 2.58E−01 0.200/0.214 −0.098 (0.155) 5.28E−01 0.235/0.257
130 rs72824905 PLCG2 N/A N/A N/A N/A N/A N/A N/A
131 rs16941239 FOXF1 A −0.089 (0.090) 3.24E−01 0.133/0.145 −0.063 (0.204) 7.56E−01 0.125/0.126
132 rs56407236 PRDM7 A 0.111 (0.196) 5.71E−01 0.029/0.025 0.701 (0.479) 1.44E−01 0.027/0.021
133 rs35048651 WDR81 N/A N/A N/A N/A N/A N/A N/A
134 rs7209200 CHRNE T 0.010 (0.077) 8.93E−01 0.226/0.224 0.055 (0.161) 7.32E−01 0.244/0.228
135 rs9916042 SCIMP A −0.005 (0.074) 9.49E−01 0.246/0.246 0.012 (0.157) 9.40E−01 0.256/0.247
136 rs61182333 SCIMP T −0.058 (0.110) 5.95E−01 0.093/0.099 0.977 (0.317) 2.09E−03 0.081/0.053
137 rs7225151 SCIMP A 0.126 (0.141) 3.75E−01 0.056/0.051 0.794 (0.417) 5.72E−02 0.038/0.026
138 rs113260531 SCIMP A 0.114 (0.141) 4.18E−01 0.056/0.052 0.794 (0.417) 5.72E−02 0.038/0.026
139 rs2242595 MYO15A G −0.005 (0.064) 9.43E−01 0.476/0.478 −0.148 (0.139) 2.86E−01 0.482/0.487
140 rs5848 GRN T −0.030 (0.067) 6.58E−01 0.332/0.338 0.213 (0.149) 1.53E−01 0.420/0.383
141 rs708382 GRN C −0.097 (0.064) 1.33E−01 0.427/0.450 0.087 (0.142) 5.39E−01 0.492/0.456
142 rs199515 WNT3 G N/A N/A 0.000/0.001 3.593 (4.438) 4.18E−01 0.001/0.001
143 rs616338 ABI3 T N/A N/A 0.000/0.000 N/A N/A N/A
144 rs28394864 ABI3 A 0.026 (0.066) 6.94E−01 0.369/0.364 −0.041 (0.131) 7.55E−01 0.444/0.450
145 rs2526378 TSPOAP1 G −0.105 (0.064) 9.83E−02 0.464/0.490 −0.020 (0.138) 8.83E−01 0.485/0.485
146 rs2632516 AC004687.2 C −0.101 (0.064) 1.15E−01 0.464/0.489 0.006 (0.139) 9.65E−01 0.478/0.476
147 rs2526377 TSPOAP1 G −0.110 (0.064) 8.35E−02 0.456/0.483 0.018 (0.137) 8.97E−01 0.479/0.474
148 rs138190086 ACE A −0.125 (0.325) 7.02E−01 0.009/0.010 0.638 (0.872) 4.65E−01 0.010/0.008
149 rs6504163 ACE C −0.056 (0.067) 4.03E−01 0.367/0.380 0.087 (0.147) 5.53E−01 0.364/0.353
150 rs4277405 ACE C −0.061 (0.066) 3.54E−01 0.337/0.353 −0.013 (0.150) 9.28E−01 0.334/0.339
151 rs4311 ACE T −0.031 (0.070) 6.56E−01 0.319/0.327 0.034 (0.149) 8.19E−01 0.323/0.323
152 rs8093731 SUZ12P1 T −0.056 (0.184) 7.60E−01 0.028/0.031 0.484 (0.416) 2.45E−01 0.024/0.021
153 rs76726049 ALPK2 N/A N/A N/A N/A N/A N/A N/A
154 rs111278892 ABCA7 G −2.188 (1.074) 4.17E−02 0.000/0.004 N/A N/A 0.000/0.002
155 rs3752231 ABCA7 T 0.204 (0.064) 1.52E−03 0.449/0.400 −0.299 (0.145) 3.97E−02 0.406/0.436
156 rs12151021 ABCA7 G −0.189 (0.064) 3.34E−03 0.478/0.524 0.219 (0.139) 1.16E−01 0.466/0.473
157 rs3752241 ABCA7 G −0.077 (0.082) 3.49E−01 0.172/0.184 −0.015 (0.169) 9.32E−01 0.225/0.201
158 rs3752246 ABCA7 G 0.208 (0.067) 1.82E−03 0.375/0.326 −0.234 (0.143) 1.03E−01 0.351/0.372
159 rs4147929 ABCA7 A 0.213 (0.067) 1.34E−03 0.372/0.322 −0.251 (0.143) 7.88E−02 0.353/0.371
160 rs149080927 KLF16 N/A N/A N/A N/A N/A N/A N/A
161 rs41289512 APOE G N/A N/A 0/0 N/A N/A N/A
162 rs146275714 APOE A 0.456 (1.231) 7.11E−01 0.001/0.001 N/A N/A N/A
163 rs769450 APOE A −0.191 (0.083) 2.06E−02 0.175/0.203 −0.353 (0.163) 3.06E−02 0.188/0.234
164 rs429358 APOE C 1.152 (0.093) 1.33E−35 0.273/0.099 1.348 (0.220) 9.05E−10 0.205/0.078
165 rs75627662 APOE T 0.672 (0.076) 5.83E−19 0.313/0.184 0.621 (0.166) 1.84E−04 0.277/0.189
166 rs76320948 AC074212.3 T N/A N/A 0.001/0.000 N/A N/A N/A
167 rs2452170 NTN5 A −0.493 (0.543) 3.64E−01 0.003/0.004 −1.643 (1.363) 2.28E−01 0.001/0.003
168 rs9304690 SIGLEC11 T 0.105 (0.078) 1.77E−01 0.228/0.210 0.267 (0.156) 8.64E−02 0.294/0.267
169 rs3865444 CD33 A 0.025 (0.084) 7.64E−01 0.181/0.177 −0.289 (0.192) 1.33E−01 0.138/0.171
170 rs12459419 CD33 T 0.026 (0.084) 7.59E−01 0.180/0.176 −0.258 (0.192) 1.81E−01 0.138/0.171
171 rs1354106 CD33 G 0.035 (0.077) 6.50E−01 0.221/0.215 −0.145 (0.166) 3.83E−01 0.207/0.228
172 rs587709 LILRB2 T −0.074 (0.083) 3.72E−01 0.177/0.186 0.425 (0.149) 4.47E−03 0.372/0.338
173 rs1761461 KIR3DL2 A −0.038 (0.091) 6.76E−01 0.135/0.139 0.141 (0.166) 3.93E−01 0.194/0.204
174 rs1358782 RBCK1 A 0.027 (0.111) 8.06E−01 0.089/0.087 −0.080 (0.240) 7.39E−01 0.088/0.082
175 rs6069736 CASS4 T −0.051 (0.066) 4.37E−01 0.340/0.351 −0.190 (0.144) 1.89E−01 0.378/0.394
176 rs6069737 CASS4 N/A N/A N/A N/A N/A N/A N/A
177 rs6024870 CASS4 N/A N/A N/A N/A N/A N/A N/A
178 rs6014724 CASS4 G −0.088 (0.065) 1.73E−01 0.355/0.375 −0.196 (0.143) 1.71E−01 0.392/0.395
179 rs6742 SLC2A4RG T 0.271 (0.236) 2.49E−01 0.022/0.016 0.164 (0.488) 7.36E−01 0.024/0.022
180 rs2154481 APP T 0.005 (0.064) 9.39E−01 0.470/0.469 0.036 (0.139) 7.98E−01 0.448/0.446
181 rs2154482 APP T 0.027 (0.067) 6.82E−01 0.341/0.336 0.035 (0.144) 8.10E−01 0.341/0.376
182 rs4817090 ADAMTS1 C −0.038 (0.064) 5.51E−01 0.445/0.454 0.069 (0.139) 6.21E−01 0.466/0.444
183 rs2830489 ADAMTS1 T −0.096 (0.242) 6.92E−01 0.017/0.019 −0.336 (0.514) 5.14E−01 0.020/0.018
184 rs115684722 SIPAIL2 T 0.358 (0.366) 3.29E−01 0.009/0.007 0.169 (0.685) 8.05E−01 0.010/0.012
185 rs168193 EDEM1 G −0.313 (0.201) 1.19E−01 0.022/0.030 −0.119 (0.304) 6.96E−01 0.052/0.044
186 rs2633682 ALCAM A −0.105 (0.086) 2.26E−01 0.164/0.179 −0.187 (0.187) 3.16E−01 0.149/0.157
187 rs184179037 WDR70 T 0.613 (0.605) 3.11E−01 0.004/0.002 0.209 (0.610) 7.32E−01 0.011/0.014
188 rs145848414 NSG2-MSX2 N/A N/A N/A N/A N/A N/A N/A
189 rs569584007 API5 N/A N/A N/A N/A N/A N/A N/A
190 rs115816806 ACER3 N/A N/A N/A N/A N/A N/A N/A
191 rs75739461 PIK3C2G N/A N/A N/A N/A N/A N/A N/A
192 rs9516245 GPC6 C −0.525 (0.400) 1.90E−01 0.005/0.008 −1.225 (1.100) 2.66E−01 0.001/0.009
193 rs570487962 ARRDC4-IGF1R N/A N/A N/A N/A N/A N/A N/A
194 rs79537509 RBFOX1 N/A N/A N/A N/A 14.04 (2048) 9.95E−01 0.001/0.000
195 rs115550680 ABCA7 N/A N/A N/A N/A N/A N/A N/A
196 rs157591 APOE N/A N/A N/A N/A N/A N/A N/A
197 rs3745495 VRK3 G 0.021 (0.090) 8.14E−01 0.147/0.144 0.008 (0.207) 9.69E−01 0.131/0.126
198 rs6859823 CTC-278L1.1 T −0.022 (0.068) 7.46E−01 0.315/0.319 −0.063 (0.141) 6.57E−01 0.379/0.391
199 rs3777215 RHOBTB3, GLRX A 0.101 (0.090) 2.58E−01 0.150/0.138 0.177 (0.163) 2.78E−01 0.230/0.192

200 rs234434 CTD-2506J14.1 G −0.036 (0.071) 6.12E−01 0.261/0.268 0.120 (0.164) 4.66E−01 0.251/0.227
201 rs11668861 NECTIN2 G 0.562 (0.073) 1.86E−14 0.326/0.215 0.365 (0.157) 2.01E−02 0.305/0.227
202 rs6859 NECTIN2 A 0.437 (0.068) 1.12E−10 0.405/0.306 0.539 (0.146) 2.28E−04 0.417/0.301
203 rs3852860 NECTIN2 C 0.557 (0.072) 1.46E−14 0.339/0.226 0.312 (0.153) 4.06E−02 0.310/0.233
204 rs71352238 TOMM40 C 1.041 (0.094) 1.50E−28 0.244/0.097 1.067 (0.218) 1.02E−06 0.185/0.082
205 rs157580 TOMM40 A 0.371 (0.064) 5.08E−09 0.537/0.442 0.170 (0.135) 2.07E−01 0.500/0.456
206 rs2075650 TOMM40 G 1.055 (0.094) 5.94E−29 0.243/0.096 1.021 (0.216) 2.38E−06 0.184/0.083
207 rs157582 TOMM40 T 0.717 (0.076) 3.46E−21 0.324/0.185 0.537 (0.165) 1.11E−03 0.289/0.202
208 rs439401 APOE C 0.468 (0.065) 6.85E−13 0.529/0.414 0.221 (0.136) 1.04E−01 0.506/0.454
209 rs4420638 APOC1 G 1.065 (0.088) 1.07E−33 0.286/0.116 1.133 (0.197) 8.83E−09 0.226/0.102
210 rs2255835 CHODL C −0.010 (0.069) 8.90E−01 0.295/0.298 −0.088 (0.153) 5.65E−01 0.274/0.293
211 rs11168036 PFDN1/HBEGF T 0.060 (0.065) 3.53E−01 0.415/0.401 0.119 (0.141) 3.97E−01 0.445/0.454
212 rs4150233 PFDN1/HBEGF C 0.048 (0.062) 4.39E−01 0.408/0.396 0.061 (0.142) 6.65E−01 0.448/0.458
213 rs2011704 USP6NL/ECHDC
3
C −0.007 (0.073) 9.27E−01 0.248/0.249 0.039 (0.158) 8.04E−01 0.243/0.260
214 rs11257240 USP6NL/ECHDC
3
G −0.007 (0.073) 9.26E−01 0.248/0.249 0.039 (0.158) 8.04E−01 0.243/0.262
215 rs12358692 USP6NL/ECHDC
3
T −0.025 (0.064) 6.93E−01 0.323/0.330 −0.065 (0.142) 6.46E−01 0.324/0.348
216 rs9749589 NFIC A 0.499 (0.551) 3.65E−01 0.004/0.003 1.066 (1.354) 4.31E−01 0.003/0.002
AD, Alzheimer’s disease; β, effect size; EA, effect allele; EAF, effect allele frequency; N/A,
not applicable; NC, normal control; SE, standard error; WGS, whole-genome sequencing.
Variants significantly associated with AD (p < 0.05) are displayed in bold text
.

Supplementary Table 7. Variants significantly associated with Alzheimer’s disease in
the Chinese population
Variants Chinese AD WGS cohort 1 Chinese AD WGS cohort 2
Index Variant Gene EA β (SE) p EAF
(AD/NC)
β (SE) p EAF
(AD/NC)
Populations of European descent
9 rs17020490 PRKD3 T 0.061 (0.064) 3.43E−01 0.432/0.416 −0.295 (0.139) 3.37E−02 0.405/0.422
12 rs4663105 BIN1 C 0.206 (0.064) 1.25E−03 0.513/0.463 0.112 (0.141) 4.27E−01 0.485/0.462
13 rs6733839 BIN1 T 0.172 (0.064) 7.41E−03 0.469/0.428 0.153 (0.142) 2.80E−01 0.423/0.405
19 rs16824536 MME A −0.311 (0.311) 3.16E−01 0.009/0.013 −2.097 (0.916) 2.21E−02 0.004/0.010
35 rs9271058 HLA-DRB1 A 0.043 (0.088) 6.24E−01 0.150/0.144 0.644 (0.251) 1.05E−02 0.222/0.196
44 rs9381040 TREML2 T 0.164 (0.068) 1.57E−02 0.349/0.314 0.318 (0.150) 3.39E−02 0.379/0.361
76 rs61732533 SHARPIN A −2.840 (1.038) 6.20E−03 0.000/0.008 N/A N/A N/A
90 rs3740688 MADD G 0.028 (0.068) 6.79E−01 0.345/0.340 −0.316 (0.151) 3.64E−02 0.249/0.316
96 rs1582763 MS4A4A A −0.211 (0.092) 2.12E−02 0.119/0.145 0.217 (0.225) 3.35E−01 0.121/0.103
97 rs72924626 MS4A6E C −0.187 (0.084) 2.71E−02 0.154/0.181 0.130 (0.193) 4.99E−01 0.167/0.147
98 rs867611 PICALM G −0.204 (0.066) 2.13E−03 0.343/0.390 0.024 (0.144) 8.67E−01 0.385/0.400
99 rs561655 PICALM G −0.169 (0.064) 8.64E−03 0.450/0.491 −0.060 (0.142) 6.72E−01 0.442/0.486
100 rs3844143 PICALM C −0.176 (0.066) 7.43E−03 0.366/0.408 0.020 (0.144) 8.92E−01 0.389/0.414
101 rs10792832 PICALM A −0.169 (0.066) 1.01E−02 0.358/0.398 0.001 (0.144) 9.92E−01 0.383/0.413
102 rs3851179 PICALM T −0.169 (0.066) 1.01E−02 0.358/0.398 0.001 (0.144) 9.92E−01 0.383/0.413
104 rs11218343 SORL1 C −0.182 (0.072) 1.22E−02 0.246/0.282 −0.306 (0.151) 4.19E−02 0.264/0.304
116 rs442495 ADAM10 T −0.087 (0.082) 2.91E−01 0.164/0.178 0.479 (0.184) 9.06E−03 0.211/0.161
117 rs593742 ADAM10 A −0.099 (0.075) 1.90E−01 0.225/0.243 0.411 (0.173) 1.71E−02 0.239/0.200
118 rs602602 MINDY2 T −0.101 (0.072) 1.60E−01 0.250/0.271 0.454 (0.167) 6.44E−03 0.273/0.217
136 rs61182333 SCIMP T −0.058 (0.110) 5.95E−01 0.093/0.099 0.977 (0.317) 2.09E−03 0.081/0.053
154 rs111278892 ABCA7 G −2.188 (1.074) 4.17E−02 0.000/0.004 N/A N/A 0/0.002
155 rs3752231 ABCA7 T 0.204 (0.064) 1.52E−03 0.449/0.400 −0.299 (0.145) 3.97E−02 0.406/0.436
156 rs12151021 ABCA7 G −0.189 (0.064) 3.34E−03 0.478/0.524 0.219 (0.139) 1.16E−01 0.466/0.473
158 rs3752246 ABCA7 G 0.208 (0.067) 1.82E−03 0.375/0.326 −0.234 (0.143) 1.03E−01 0.351/0.372
159 rs4147929 ABCA7 A 0.213 (0.067) 1.34E−03 0.372/0.322 −0.251 (0.143) 7.88E−02 0.353/0.371
163 rs769450 APOE A −0.191 (0.083) 2.06E−02 0.175/0.203 −0.353 (0.163) 3.06E−02 0.188/0.234
164 rs429358 APOE C 1.152 (0.093) 1.33E−35 0.273/0.099 1.348 (0.220) 9.05E−10 0.205/0.078
165 rs75627662 APOE T 0.672 (0.076) 5.83E−19 0.313/0.184 0.621 (0.166) 1.84E−04 0.277/0.189
172 rs587709 LILRB2 T −0.074 (0.083) 3.72E−01 0.177/0.186 0.425 (0.149) 4.47E−03 0.372/0.338
Asian populations
201 rs11668861 NECTIN2 G 0.562 (0.073) 1.86E−14 0.326/0.215 0.365 (0.157) 2.01E−02 0.305/0.227
202 rs6859 NECTIN2 A 0.437 (0.068) 1.12E−10 0.405/0.306 0.539 (0.146) 2.28E−04 0.417/0.301
203 rs3852860 NECTIN2 C 0.557 (0.072) 1.46E−14 0.339/0.226 0.312 (0.153) 4.06E−02 0.310/0.233
204 rs71352238 TOMM40 C 1.041 (0.094) 1.50E−28 0.244/0.097 1.067 (0.218) 1.02E−06 0.185/0.082

205 rs157580 TOMM40 A 0.371 (0.064) 5.08E−09 0.537/0.442 0.170 (0.135) 2.07E−01 0.500/0.456
206 rs2075650 TOMM40 G 1.055 (0.094) 5.94E−29 0.243/0.096 1.021 (0.216) 2.38E−06 0.184/0.083
207 rs157582 TOMM40 T 0.717 (0.076) 3.46E−21 0.324/0.185 0.537 (0.165) 1.11E−03 0.289/0.202
208 rs439401 APOE C 0.468 (0.065) 6.85E−13 0.529/0.414 0.221 (0.136) 1.04E−01 0.506/0.454
209 rs4420638 APOC1 G 1.065 (0.088) 1.07E−33 0.286/0.116 1.133 (0.197) 8.83E−09 0.226/0.102
AD, Alzheimer’s disease; β, effect size; EA, effect allele; EAF, effect allele frequency; N/A,
not applicable; NC, normal control; SE, standard error; WGS, whole-genome sequencing.

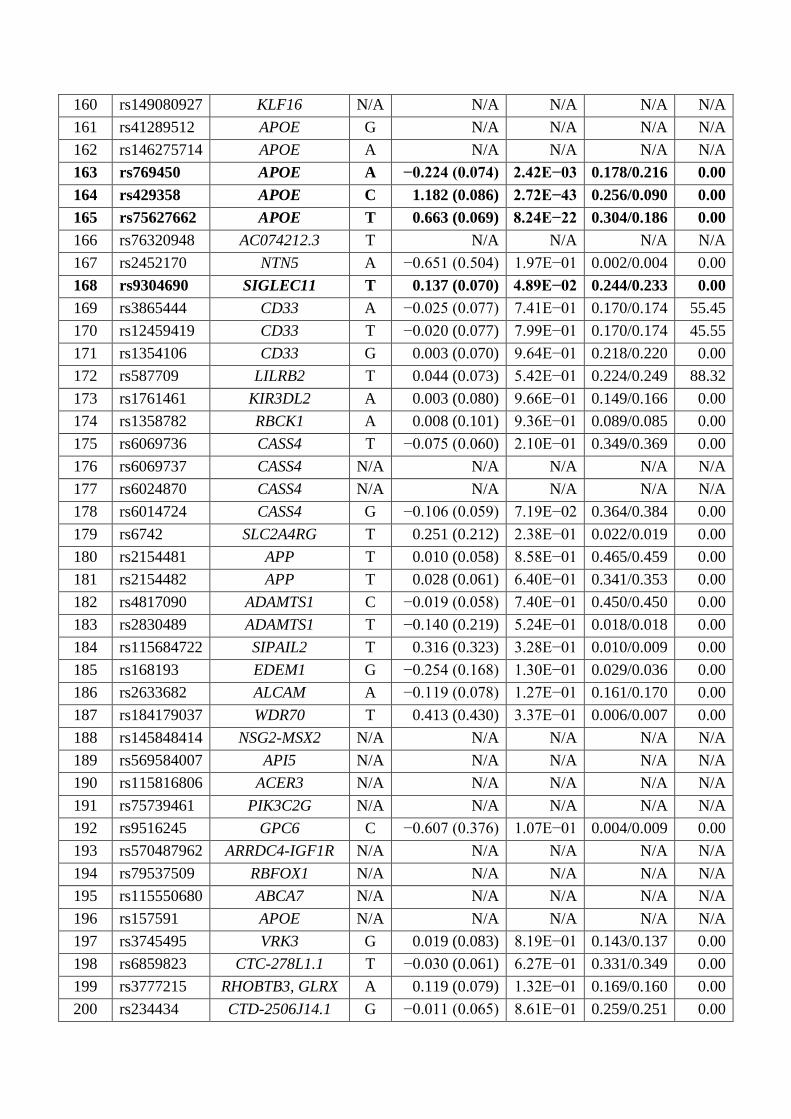
Supplementary Table 8. Meta-analysis results of the effects of variants on Alzheimer’s
disease in the Chinese population
Index Variant Gene EA β (SE) Meta-p EAF
(AD/NC)
I2
1 rs113020870 AGRN N/A N/A N/A N/A N/A
2 rs141749679 SORT1 N/A N/A N/A N/A N/A
3 rs4575098 ADAMTS4 A 0.082 (0.061) 1.78E−01 0.325/0.313 0.00
4 rs6656401 CR1 A −0.196 (0.173) 2.55E−01 0.028/0.037 0.00
5 rs679515 CR1 T −0.197 (0.174) 2.58E−01 0.028/0.036 0.00
6 rs2093760 CR1 A −0.088 (0.06) 1.43E−01 0.356/0.374 42.77
7 rs4844610 CR1 A −0.173 (0.172) 3.14E−01 0.028/0.036 0.00
8 rs72777026 ADAM17 G 0.108 (0.081) 1.83E−01 0.149/0.136 45.35
9 rs17020490 PRKD3 T −0.001 (0.058) 9.83E−01 0.425/0.419 81.52
10 rs115186657 FHL2 N/A N/A N/A N/A N/A
11 rs143080277 NCK2 N/A N/A N/A N/A N/A
12 rs4663105 BIN1 C 0.190 (0.058) 1.12E−03 0.506/0.463 0.00
13 rs6733839 BIN1 T 0.169 (0.058) 3.82E−03 0.458/0.418 0.00
14 rs139643391 WDR12 N/A N/A N/A N/A N/A
15 rs10933431 INPP5D G −0.068 (0.061) 2.72E−01 0.305/0.318 5.35
16 rs35349669 INPP5D T N/A N/A N/A N/A
17 rs7597763 INPP5D C N/A N/A N/A N/A
18 rs184384746 HESX1 N/A N/A N/A N/A N/A
19 rs16824536 MME A −0.496 (0.294) 9.24E−02 0.008/0.011 70.66
20 rs61762319 MME N/A N/A N/A N/A N/A
21 rs3822030 IDUA T 0.004 (0.057) 9.38E−01 0.474/0.465 0.00
22 rs4504245 CLNK A 0.161 (0.078) 3.80E−02 0.177/0.157 0.00
23 rs6448451 CLNK G 0.107 (0.073) 1.44E−01 0.200/0.188 43.72
24 rs6846529 CLNK C 0.108 (0.070) 1.24E−01 0.226/0.211 0.00
25 rs6448453 CLNK A 0.097 (0.072) 1.79E−01 0.209/0.196 57.75
26 rs7657553 HS3ST1 A 0.007 (0.059) 9.12E−01 0.338/0.330 0.00
27 rs2245466 RHOH C 0.046 (0.058) 4.28E−01 0.48/0.469 35.48
28 rs112403360 ANKH A 0.087 (0.169) 6.06E−01 0.032/0.028 0.00
29 rs62374257 COX7C C 0.052 (0.066) 4.31E−01 0.272/0.262 0.00
30 rs190982 MEF2C G 0.099 (0.081) 2.23E−01 0.153/0.135 55.76
31 rs871269 TNIP1 C 0.066 (0.059) 2.64E−01 0.423/0.404 0.00
32 rs6891966 HAVCR2 A −0.048 (0.113) 6.72E−01 0.066/0.064 0.00
33 rs113706587 RASGEF1C A −0.056 (0.640) 9.30E−01 0.002/0.004 0.00
34 rs9269853 HLA-DRB1 A 0.153 (0.088) 8.17E−02 0.159/0.174 9.99
35 rs9271058 HLA-DRB1 A 0.109 (0.083) 1.90E−01 0.167/0.165 80.41
36 rs6605556 HLA-DQA1 G −0.18 (0.088) 4.03E−02 0.107/0.127 22.49

37 rs6931277 HLA-DRB1 T −0.162 (0.089) 7.02E−02 0.109/0.125 0.00
38 rs1846190 HLA-DRB1 A −0.040 (0.065) 5.40E−01 0.245/0.255 0.00
39 rs187370608 TREM2 N/A N/A N/A N/A N/A
40 rs10947943 UNC5CL A 0.099 (0.092) 2.85E−01 0.114/0.108 0.00
41 rs143332484 TREM2 N/A N/A N/A N/A N/A
42 rs75932628 TREM2 N/A N/A N/A N/A N/A
43 rs60755019 TREML2 G 0.921 (0.598) 1.23E−01 0.005/0.003 0.00
44 rs9381040 TREML2 T 0.190 (0.062) 2.13E−03 0.356/0.333 0.00
45 rs9473117 CD2AP C 0.111 (0.088) 2.09E−01 0.133/0.129 0.00
46 rs9381563 CD2AP C 0.119 (0.076) 1.20E−01 0.198/0.188 0.00
47 rs7767350 CD2AP T 0.094 (0.086) 2.75E−01 0.135/0.131 0.00
48 rs9369716 CD2AP T 0.102 (0.086) 2.37E−01 0.136/0.132 0.00
49 rs785129 HS3ST5 C −0.068 (0.062) 2.69E−01 0.337/0.360 0.00
50 rs6943429 UMAD1 T 0.002 (0.058) 9.73E−01 0.430/0.435 0.00
51 rs10952097 ICA1 T 0.067 (0.097) 4.89E−01 0.104/0.109 0.00
52 rs5011436 TMEM106B A 0.019 (0.058) 7.50E−01 0.340/0.337 71.03
53 rs13237518 TMEM106B C 0.031 (0.060) 6.04E−01 0.343/0.338 71.93
54 rs1160871 JAZF1 N/A N/A N/A N/A N/A
55 rs4723711 NME8 T −0.002 (0.069) 9.76E−01 0.225/0.218 0.00
56 rs6966331 EPDR1 C −0.013 (0.057) 8.16E−01 0.480/0.484 0.00
57 rs76928645 SEC61G T N/A N/A N/A N/A
58 rs7384878 SPDYE3 T 0.084 (0.059) 1.55E−01 0.404/0.373 0.00
59 rs1859788 ZCWPW1 G 0.102 (0.058) 8.12E−02 0.416/0.381 0.00
60 rs1476679 ZCWPW1 C −0.050 (0.061) 4.14E−01 0.319/0.334 0.00
61 rs12539172 NYAP1 T −0.048 (0.062) 4.37E−01 0.316/0.331 0.00
62 rs10808026 EPHA1 A 0.032 (0.086) 7.05E−01 0.133/0.131 51.28
63 rs3935067 EPHA1 C 0.176 (0.179) 3.25E−01 0.030/0.025 0.00
64 rs12703526 EPHA1 T −0.015 (0.081) 8.50E−01 0.149/0.154 50.70
65 rs7810606 EPHA1 C −0.026 (0.081) 7.49E−01 0.148/0.153 46.16
66 rs11763230 EPHA1 T 0.074 (0.085) 3.85E−01 0.142/0.135 54.19
67 rs11771145 EPHA1 G 0.020 (0.057) 7.30E−01 0.469/0.464 0.00
68 rs114360492 CNTNAP2 N/A N/A N/A N/A N/A
69 rs1065712 CTSB N/A N/A N/A N/A N/A
70 rs73223431 PTK2B T 0.083 (0.063) 1.88E−01 0.290/0.276 0.00
71 rs4236673 CLU/PTK2B A −0.147 (0.074) 4.56E−02 0.190/0.216 0.00
72 rs11787077 CLU T −0.157 (0.072) 2.85E−02 0.198/0.225 0.00
73 rs1532278 CLU T −0.162 (0.071) 2.37E−02 0.197/0.226 0.00
74 rs9331896 CLU C −0.143 (0.072) 4.60E−02 0.198/0.225 0.00
75 rs867230 ECHDC3 C −0.141 (0.072) 5.00E−02 0.201/0.226 0.00
76 rs61732533 SHARPIN A N/A N/A N/A N/A
77 rs34173062 SHARPIN N/A N/A N/A N/A N/A

78 rs1800978 ABCA1 G 0.097 (0.080) 2.24E−01 0.156/0.155 0.00
79 rs11257238 ECHDC3 C 0.009 (0.066) 8.91E−01 0.248/0.253 0.00
80 rs7912495 USP6NL G −0.018 (0.062) 7.78E−01 0.294/0.304 0.00
81 rs7920721 ECHDC3 G 0.003 (0.066) 9.60E−01 0.246/0.253 0.00
82 rs11257242 ECHDC3 G −0.034 (0.058) 5.65E−01 0.323/0.337 0.00
83 rs1171814 CCDC6 G 0.067 (0.060) 2.68E−01 0.379/0.358 44.11
84 rs7902657 CCDC6 T 0.078 (0.064) 2.23E−01 0.289/0.277 72.64
85 rs7068231 ANK3 G 0.083 (0.064) 1.96E−01 0.29/0.276 65.85
86 rs6586028 TSPAN14 C −0.146 (0.208) 4.83E−01 0.018/0.025 0.00
87 rs1878036 TSPAN14 T −0.157 (0.250) 5.30E−01 0.013/0.018 0.00
88 rs6584063 BLNK G −0.055 (0.255) 8.28E−01 0.014/0.013 74.10
89 rs7908662 PLEKHA1 A 0.046 (0.060) 4.43E−01 0.377/0.369 56.03
90 rs3740688 MADD G −0.030 (0.062) 6.28E−01 0.322/0.330 76.82
91 rs10437655 SPI1 A 0.074 (0.062) 2.29E−01 0.328/0.330 60.89
92 rs12292911 SPI1 A 0.051 (0.061) 4.07E−01 0.356/0.360 26.87
93 rs7933202 MS4A2 C −0.065 (0.124) 5.99E−01 0.057/0.058 32.13
94 rs7935829 MS4A6A G 0.022 (0.073) 7.66E−01 0.200/0.202 0.00
95 rs2081545 MS4A6A A 0.029 (0.073) 6.95E−01 0.201/0.202 0.00
96 rs1582763 MS4A4A A −0.150 (0.085) 7.88E−02 0.120/0.127 67.74
97 rs72924626 MS4A6E C −0.137 (0.077) 7.63E−02 0.157/0.167 55.91
98 rs867611 PICALM G −0.164 (0.060) 6.14E−03 0.353/0.394 51.73
99 rs561655 PICALM G −0.151 (0.058) 9.85E−03 0.448/0.489 0.00
100 rs3844143 PICALM C −0.142 (0.060) 1.80E−02 0.372/0.410 34.68
101 rs10792832 PICALM A −0.139 (0.060) 2.01E−02 0.364/0.404 13.18
102 rs3851179 PICALM T −0.139 (0.060) 2.01E−02 0.364/0.404 13.18
103 rs74685827 SORL1 G 0.188 (0.094) 4.57E−02 0.115/0.097 0.00
104 rs11218343 SORL1 C −0.205 (0.065) 1.61E−03 0.251/0.291 0.00
105 rs6489896 TPCN1 C 0.099 (0.072) 1.68E−01 0.209/0.196 21.69
106 rs7146179 FERMT2 A −0.032 (0.072) 6.54E−01 0.202/0.206 0.00
107 rs17125924 FERMT2 G −0.114 (0.067) 8.98E−02 0.249/0.260 0.00
108 rs7401792 SLC24A4 A 0.016 (0.060) 7.90E−01 0.363/0.375 0.00
109 rs12881735 SLC24A4 C 0.073 (0.097) 4.51E−01 0.098/0.098 35.47
110 rs12590654 SLC24A4 A 0.021 (0.058) 7.23E−01 0.469/0.461 0.00
111 rs7157106 IGH gene cluster G 0.074 (0.108) 4.94E−01 0.076/0.066 8.74
112 rs10131280 IGH gene cluster A −0.024 (0.076) 7.56E−01 0.173/0.178 0.00
113 rs12592778 SLC24A4 A −0.068 (0.058) 2.39E−01 0.468/0.493 38.55
114 rs8025980 SPPL2A A 0.060 (0.058) 2.98E−01 0.449/0.422 0.00
115 rs59685680 SPPL2A G −0.019 (0.058) 7.43E−01 0.487/0.484 35.97
116 rs442495 ADAM10 T 0.007 (0.075) 9.28E−01 0.175/0.171 87.33
117 rs593742 ADAM10 A −0.018 (0.069) 7.90E−01 0.228/0.225 86.33
118 rs602602 MINDY2 T −0.014 (0.066) 8.32E−01 0.255/0.248 89.26

119 rs117618017 APH1B N/A N/A N/A N/A N/A
120 rs3848143 SNX1 G 0.109 (0.072) 1.30E−01 0.194/0.182 0.00
121 rs12592898 CTSH A −0.129 (0.132) 3.28E−01 0.05/0.060 3.57
122 rs1140239 DOC2A T 0.073 (0.059) 2.15E−01 0.418/0.408 58.57
123 rs889555 BCKDK T 0.074 (0.106) 4.87E−01 0.089/0.094 0.00
124 rs2884738 KAT8 A 0.075 (0.106) 4.82E−01 0.089/0.093 0.00
125 rs59735493 KAT8 A 0.090 (0.106) 3.96E−01 0.089/0.093 0.00
126 rs4985556 IL34 A 0.190 (0.116) 1.02E−01 0.075/0.064 0.00
127 rs450674 MAF C −0.242 (0.144) 9.37E−02 0.036/0.045 0.00
128 rs12446759 PLCG2 G −0.109 (0.070) 1.20E−01 0.193/0.216 0.00
129 rs12444183 PLCG2 A −0.089 (0.069) 1.96E−01 0.209/0.232 0.00
130 rs72824905 PLCG2 N/A N/A N/A N/A N/A
131 rs16941239 FOXF1 A −0.085 (0.082) 3.03E−01 0.131/0.137 0.00
132 rs56407236 PRDM7 A 0.196 (0.181) 2.81E−01 0.028/0.023 23.05
133 rs35048651 WDR81 N/A N/A N/A N/A N/A
134 rs7209200 CHRNE T 0.018 (0.069) 7.91E−01 0.230/0.226 0.00
135 rs9916042 SCIMP A −0.002 (0.067) 9.77E−01 0.248/0.246 0.00
136 rs61182333 SCIMP T 0.053 (0.104) 6.08E−01 0.090/0.080 89.49
137 rs7225151 SCIMP A 0.195 (0.134) 1.45E−01 0.052/0.041 56.58
138 rs113260531 SCIMP A 0.184 (0.134) 1.69E−01 0.052/0.041 58.09
139 rs2242595 MYO15A G −0.030 (0.058) 6.06E−01 0.478/0.482 0.00
140 rs5848 GRN T 0.011 (0.061) 8.59E−01 0.353/0.357 54.80
141 rs708382 GRN C −0.066 (0.058) 2.58E−01 0.442/0.452 28.34
142 rs199515 WNT3 G N/A N/A 0/0.001 N/A
143 rs616338 ABI3 T N/A N/A N/A N/A
144 rs28394864 ABI3 A 0.012 (0.059) 8.33E−01 0.387/0.400 0.00
145 rs2526378 TSPOAP1 G −0.090 (0.058) 1.21E−01 0.469/0.488 0.00
146 rs2632516 AC004687.2 C −0.082 (0.058) 1.57E−01 0.467/0.483 0.00
147 rs2526377 TSPOAP1 G −0.087 (0.058) 1.33E−01 0.461/0.479 0.00
148 rs138190086 ACE A −0.032 (0.305) 9.16E−01 0.009/0.010 0.00
149 rs6504163 ACE C −0.031 (0.061) 6.06E−01 0.366/0.369 0.00
150 rs4277405 ACE C −0.053 (0.060) 3.78E−01 0.337/0.347 0.00
151 rs4311 ACE T −0.019 (0.063) 7.61E−01 0.32/0.326 0.00
152 rs8093731 SUZ12P1 T 0.032 (0.168) 8.48E−01 0.027/0.027 29.04
153 rs76726049 ALPK2 N/A N/A N/A N/A N/A
154 rs111278892 ABCA7 G N/A N/A 0/0.003 N/A
155 rs3752231 ABCA7 T 0.122 (0.059) 3.72E−02 0.439/0.415 90.07
156 rs12151021 ABCA7 G −0.118 (0.058) 4.30E−02 0.475/0.503 85.93
157 rs3752241 ABCA7 G −0.065 (0.074) 3.77E−01 0.185/0.191 0.00
158 rs3752246 ABCA7 G 0.128 (0.061) 3.43E−02 0.369/0.345 87.24
159 rs4147929 ABCA7 A 0.129 (0.061) 3.28E−02 0.368/0.343 88.42
160 rs149080927 KLF16 N/A N/A N/A N/A N/A
161 rs41289512 APOE G N/A N/A N/A N/A
162 rs146275714 APOE A N/A N/A N/A N/A
163 rs769450 APOE A −0.224 (0.074) 2.42E−03 0.178/0.216 0.00
164 rs429358 APOE C 1.182 (0.086) 2.72E−43 0.256/0.090 0.00
165 rs75627662 APOE T 0.663 (0.069) 8.24E−22 0.304/0.186 0.00
166 rs76320948 AC074212.3 T N/A N/A N/A N/A
167 rs2452170 NTN5 A −0.651 (0.504) 1.97E−01 0.002/0.004 0.00
168 rs9304690 SIGLEC11 T 0.137 (0.070) 4.89E−02 0.244/0.233 0.00
169 rs3865444 CD33 A −0.025 (0.077) 7.41E−01 0.170/0.174 55.45
170 rs12459419 CD33 T −0.020 (0.077) 7.99E−01 0.170/0.174 45.55
171 rs1354106 CD33 G 0.003 (0.070) 9.64E−01 0.218/0.220 0.00
172 rs587709 LILRB2 T 0.044 (0.073) 5.42E−01 0.224/0.249 88.32
173 rs1761461 KIR3DL2 A 0.003 (0.080) 9.66E−01 0.149/0.166 0.00
174 rs1358782 RBCK1 A 0.008 (0.101) 9.36E−01 0.089/0.085 0.00
175 rs6069736 CASS4 T −0.075 (0.060) 2.10E−01 0.349/0.369 0.00
176 rs6069737 CASS4 N/A N/A N/A N/A N/A
177 rs6024870 CASS4 N/A N/A N/A N/A N/A
178 rs6014724 CASS4 G −0.106 (0.059) 7.19E−02 0.364/0.384 0.00
179 rs6742 SLC2A4RG T 0.251 (0.212) 2.38E−01 0.022/0.019 0.00
180 rs2154481 APP T 0.010 (0.058) 8.58E−01 0.465/0.459 0.00
181 rs2154482 APP T 0.028 (0.061) 6.40E−01 0.341/0.353 0.00
182 rs4817090 ADAMTS1 C −0.019 (0.058) 7.40E−01 0.450/0.450 0.00
183 rs2830489 ADAMTS1 T −0.140 (0.219) 5.24E−01 0.018/0.018 0.00
184 rs115684722 SIPAIL2 T 0.316 (0.323) 3.28E−01 0.010/0.009 0.00
185 rs168193 EDEM1 G −0.254 (0.168) 1.30E−01 0.029/0.036 0.00
186 rs2633682 ALCAM A −0.119 (0.078) 1.27E−01 0.161/0.170 0.00
187 rs184179037 WDR70 T 0.413 (0.430) 3.37E−01 0.006/0.007 0.00
188 rs145848414 NSG2-MSX2 N/A N/A N/A N/A N/A
189 rs569584007 API5 N/A N/A N/A N/A N/A
190 rs115816806 ACER3 N/A N/A N/A N/A N/A
191 rs75739461 PIK3C2G N/A N/A N/A N/A N/A
192 rs9516245 GPC6 C −0.607 (0.376) 1.07E−01 0.004/0.009 0.00
193 rs570487962 ARRDC4-IGF1R N/A N/A N/A N/A N/A
194 rs79537509 RBFOX1 N/A N/A N/A N/A N/A
195 rs115550680 ABCA7 N/A N/A N/A N/A N/A
196 rs157591 APOE N/A N/A N/A N/A N/A
197 rs3745495 VRK3 G 0.019 (0.083) 8.19E−01 0.143/0.137 0.00
198 rs6859823 CTC-278L1.1 T −0.030 (0.061) 6.27E−01 0.331/0.349 0.00
199 rs3777215 RHOBTB3, GLRX A 0.119 (0.079) 1.32E−01 0.169/0.160 0.00
200 rs234434 CTD-2506J14.1 G −0.011 (0.065) 8.61E−01 0.259/0.251 0.00

201 rs11668861 NECTIN2 G 0.527 (0.066) 1.71E−15 0.321/0.220 22.76
202 rs6859 NECTIN2 A 0.455 (0.062) 1.53E−13 0.408/0.304 0.00
203 rs3852860 NECTIN2 C 0.513 (0.065) 3.60E−15 0.332/0.229 52.36
204 rs71352238 TOMM40 C 1.045 (0.086) 9.66E−34 0.230/0.091 0.00
205 rs157580 TOMM40 A 0.334 (0.058) 7.58E−09 0.528/0.448 44.75
206 rs2075650 TOMM40 G 1.050 (0.086) 4.11E−34 0.229/0.090 0.00
207 rs157582 TOMM40 T 0.685 (0.069) 3.07E−23 0.315/0.192 0.00
208 rs439401 APOE C 0.422 (0.059) 6.16E−13 0.523/0.431 62.76
209 rs4420638 APOC1 G 1.076 (0.080) 6.41E−41 0.272/0.110 0.00
210 rs2255835 CHODL C −0.023 (0.063) 7.12E−01 0.290/0.296 0.00
211 rs11168036 PFDN1/HBEGF T 0.070 (0.059) 2.33E−01 0.422/0.423 0.00
212 rs4150233 PFDN1/HBEGF C 0.050 (0.057) 3.78E−01 0.418/0.422 0.00
213 rs2011704 USP6NL/ECHDC3 C 0.001 (0.066) 9.87E−01 0.247/0.254 0.00
214 rs11257240 USP6NL/ECHDC3 G 0.001 (0.066) 9.87E−01 0.247/0.254 0.00
215 rs12358692 USP6NL/ECHDC3 T −0.032 (0.058) 5.86E−01 0.323/0.337 0.00
216 rs9749589 NFIC A 0.580 (0.510) 2.56E−01 0.004/0.003 0.00
AD, Alzheimer’s disease; β, effect size; EA, effect allele; EAF, effect allele frequency; N/A,
not applicable; NC, normal control; SE, standard error; WGS, whole-genome sequencing. The
meta-analysis was conducted using a fixed-effects model. Variants significantly associated
with AD (p < 0.05) are displayed in bold text.

Supplementary Table 9. Variants used to construct polygenic score models
Variants Chinese AD WGS cohort 1 Chinese AD WGS cohort 2
Index Variant Gene EA β (SE) p EAF
(AD/NC)
β (SE) p EAF
(AD/NC)
Non-APOE AD genetic risk (n = 25)
12 rs4663105 BIN1 C 0.206 (0.064) 1.25E−03 0.513/0.463 0.112 (0.141) 4.27E−01 0.485/0.462
13 rs6733839 BIN1 T 0.172 (0.064) 7.41E−03 0.469/0.428 0.153 (0.142) 2.80E−01 0.423/0.405
19 rs16824536 MME A −0.311 (0.311) 3.16E−01 0.009/0.013 −2.097 (0.916) 2.21E−02 0.004/0.010
22 rs4504245 CLNK A 0.133 (0.085) 1.19E−01 0.177/0.159 0.308 (0.193) 1.11E−01 0.177/0.155
35 rs9271058 HLA-DRB1 A 0.043 (0.088) 6.24E−01 0.150/0.144 0.644 (0.251) 1.05E−02 0.222/0.196
36 rs6605556 HLA-DQA1 G −0.145 (0.093) 1.18E−01 0.116/0.132 −0.464 (0.265) 7.96E−02 0.081/0.119
44 rs9381040 TREML2 T 0.164 (0.068) 1.57E−02 0.349/0.314 0.318 (0.150) 3.39E−02 0.379/0.361
71 rs4236673 CLU/PTK2B A −0.117 (0.083) 1.56E−01 0.176/0.192 −0.262 (0.161) 1.03E−01 0.236/0.250
72 rs11787077 CLU T −0.131 (0.080) 1.03E−01 0.186/0.206 −0.262 (0.161) 1.03E−01 0.236/0.253
73 rs1532278 CLU T −0.136 (0.080) 9.01E−02 0.185/0.206 −0.263 (0.159) 9.74E−02 0.237/0.254
74 rs9331896 CLU C −0.117 (0.080) 1.46E−01 0.186/0.203 −0.248 (0.161) 1.23E−01 0.239/0.255
76 rs61732533 SHARPIN A −2.840 (1.038) 6.20E−03 0.000/0.008 N/A N/A N/A
98 rs867611 PICALM G −0.204 (0.066) 2.13E−03 0.343/0.390 0.024 (0.144) 8.67E−01 0.385/0.400
99 rs561655 PICALM G −0.169 (0.064) 8.64E−03 0.450/0.491 −0.060 (0.142) 6.72E−01 0.442/0.486
100 rs3844143 PICALM C −0.176 (0.066) 7.43E−03 0.366/0.408 0.020 (0.144) 8.92E−01 0.389/0.414
101 rs10792832 PICALM A −0.169 (0.066) 1.01E−02 0.358/0.398 0.001 (0.144) 9.92E−01 0.383/0.413
102 rs3851179 PICALM T −0.169 (0.066) 1.01E−02 0.358/0.398 0.001 (0.144) 9.92E−01 0.383/0.413
103 rs74685827 SORL1 G 0.161 (0.102) 1.15E−01 0.119/0.104 0.341 (0.243) 1.60E−01 0.101/0.087
104 rs11218343 SORL1 C −0.182 (0.072) 1.22E−02 0.246/0.282 −0.306 (0.151) 4.19E−02 0.264/0.304
154 rs111278892 ABCA7 G −2.188 (1.074) 4.17E−02 0.000/0.004 N/A N/A 0.000/0.002
155 rs3752231 ABCA7 T 0.204 (0.064) 1.52E−03 0.449/0.400 −0.299 (0.145) 3.97E−02 0.406/0.436
156 rs12151021 ABCA7 G −0.189 (0.064) 3.34E−03 0.478/0.524 0.219 (0.139) 1.16E−01 0.466/0.473
158 rs3752246 ABCA7 G 0.208 (0.067) 1.82E−03 0.375/0.326 −0.234 (0.143) 1.03E−01 0.351/0.372
159 rs4147929 ABCA7 A 0.213 (0.067) 1.34E−03 0.372/0.322 −0.251 (0.143) 7.88E−02 0.353/0.371
168 rs9304690 SIGLEC11 T 0.105 (0.078) 1.77E−01 0.228/0.210 0.267 (0.156) 8.64E−02 0.294/0.267
APOE AD genetic risk (n = 12)
163 rs769450 APOE A −0.191 (0.083) 2.06E−02 0.175/0.203 −0.353 (0.163) 3.06E−02 0.188/0.234
164 rs429358 APOE C 1.152 (0.093) 1.33E−35 0.273/0.099 1.348 (0.220) 9.05E−10 0.205/0.078
165 rs75627662 APOE T 0.672 (0.076) 5.83E−19 0.313/0.184 0.621 (0.166) 1.84E−04 0.277/0.189
201 rs11668861 NECTIN2 G 0.562 (0.073) 1.86E−14 0.326/0.215 0.365 (0.157) 2.01E−02 0.305/0.227
202 rs6859 NECTIN2 A 0.437 (0.068) 1.12E−10 0.405/0.306 0.539 (0.146) 2.28E−04 0.417/0.301
203 rs3852860 NECTIN2 C 0.557 (0.072) 1.46E−14 0.339/0.226 0.312 (0.153) 4.06E−02 0.310/0.233
204 rs71352238 TOMM40 C 1.041 (0.094) 1.50E−28 0.244/0.097 1.067 (0.218) 1.02E−06 0.185/0.082
205 rs157580 TOMM40 A 0.371 (0.064) 5.08E−09 0.537/0.442 0.170 (0.135) 2.07E−01 0.500/0.456
206 rs2075650 TOMM40 G 1.055 (0.094) 5.94E−29 0.243/0.096 1.021 (0.216) 2.38E−06 0.184/0.083
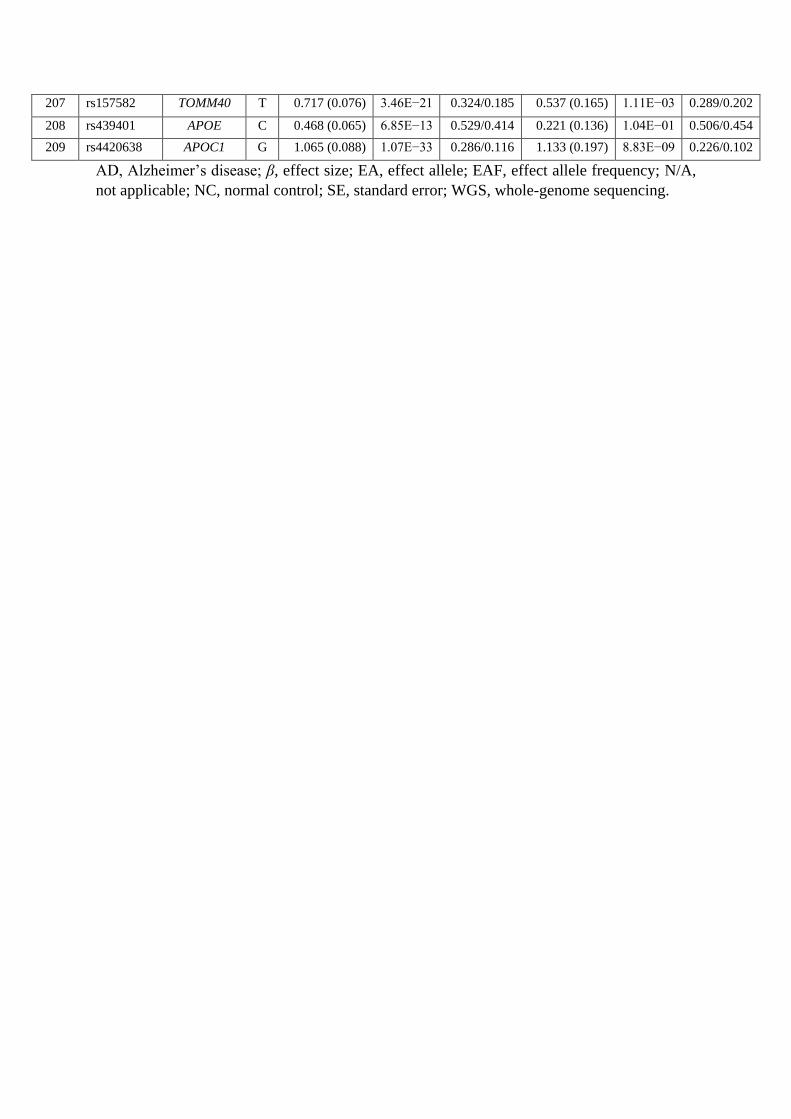
207 rs157582 TOMM40 T 0.717 (0.076) 3.46E−21 0.324/0.185 0.537 (0.165) 1.11E−03 0.289/0.202
208 rs439401 APOE C 0.468 (0.065) 6.85E−13 0.529/0.414 0.221 (0.136) 1.04E−01 0.506/0.454
209 rs4420638 APOC1 G 1.065 (0.088) 1.07E−33 0.286/0.116 1.133 (0.197) 8.83E−09 0.226/0.102
AD, Alzheimer’s disease; β, effect size; EA, effect allele; EAF, effect allele frequency; N/A,
not applicable; NC, normal control; SE, standard error; WGS, whole-genome sequencing.

Supplementary Table 10. Performance of the polygenic score models in the Chinese WGS
cohorts
Chinese AD WGS cohort 1 Chinese AD WGS cohort 2
Models AD vs. NC
(1,116 AD, 915 NC)
MCI vs. NC
(309 MCI, 915 NC)
AD vs. NC
(356 AD, 653 NC)
Lasso regression model
Lasso 0.7069
(0.6840-0.7298)
0.5963
(0.5574-0.6327)
0.6348
(0.5997-0.6700)
Lasso_APOE 0.6528
(0.6297-0.6761)
0.5777
(0.5406-0.6158)
0.6323
(0.5959-0.6697)
Lasso_nonAPOE 0.6114
(0.5874-0.6354)
0.5412
(0.5050-0.5786)
0.5539
(0.5187-0.5904)
Neural network model
NN 0.7718
(0.7507-0.7923)
0.6241
(0.5867-0.6614)
0.6299
(0.5924-0.6656)
Classification accuracy was measured as area under the receiver operating characteristic curve
(auROC). AD, Alzheimer’s disease; MCI, mild cognitive impairment; NC, normal control; NN,
neural network; WGS, whole-genome sequencing; wPRS, weight polygenic risk score.

Supplementary Table 11. Test of the polygenic score models performance in the Chinese
WGS cohorts
Chinese AD WGS cohort 1 Chinese AD WGS cohort 2
Models
AD vs. NC
(1,116 AD, 915
NC)
MCI vs. NC
(309 MCI, 915
NC)
AD vs. NC
(356 AD, 653 NC)
NN vs. Lasso
(P-value) < 2.20E−16 6.24E−03 6.39E−01
Testing for classification accuracy was measured as area under the receiver operating
characteristic curve (auROC); AD, Alzheimer’s disease; MCI, mild cognitive impairment; NC,
normal control; NN, neural network; wPRS, weight polygenic risk score. Bootstrap two-tailed
test

Supplementary Table 12. Individual disease risk stratification based on polygenic scores
and their associations with phenotypes
Chinese AD WGS cohort 1 Chinese AD WGS cohort 2
AD MCI NC AD NC
Low risk (n) 155 101 443 90 261
Medium risk (n) 466 120 357 148 287
High risk (n) 495 88 115 118 105
Dataset Phenotype Group β SE p-value
Chinese AD WGS
cohort 1
AD vs. NC High vs. Low 2.525 0.141 <2E−16
High vs. Medium 1.191 0.126 <2E−16
Medium vs. Low 1.320 0.117 <2E−16
MCI vs. NC High vs. Low 1.263 0.184 6.16E−12
High vs. Medium 0.819 0.179 5.06E−06
Medium vs. Low 0.384 0.153 1.25E−02
Chinese AD WGS
cohort 2
AD vs. NC High vs. Low 1.322 0.272 1.13E−06
High vs. Medium 0.982 0.258 1.44E−04
Medium vs. Low 0.384 0.238 0.107
AD, Alzheimer’s disease; β, effect size; MCI, mild cognitive impairment; NC, normal control;
SE, standard error; WGS, whole-genome sequencing.

Supplementary Table 13. Association between polygenic scores and cognitive
performance
Dataset Group β SE p-value
Chinese AD WGS
cohort 1
All participants −1.768 0.082 <2E−16
Non-AD participants −0.298 0.082 3.10E−04
APOE-ε3 carriers −2.145 0.128 <2E−16
APOE-ε4 carriers −1.753 0.335 2.18E−07
Chinese AD WGS
cohort 2
All participants −0.287 0.107 7.38E−03
Non-AD participants 0.171 0.135 0.206
APOE-ε3 carriers −0.071 0.166 0.668
APOE-ε4 carriers 0.116 0.452 0.798
AD, Alzheimer’s disease; β, effect size; SE, standard error; WGS, whole-genome sequencing.
Significant associations (p < 0.05) are displayed in bold text.

Supplementary Table 14. Associations between polygenic scores and the plasma ATN
biomarker panel
Group Biomarker NN PRS_Full
All β SE t p-value β SE t p-value
Aβ42 −3.614 0.957 −3.776 1.96E−04 −1.261 0.334 −3.780 1.93E−04
Aβ40 21.945 16.767 1.309 1.92E−01 7.139 6.030 1.184 2.37E−01
Aβ42/Aβ40 −0.016 0.004 −3.628 3.42E−04 −0.005 0.002 −3.250 1.30E−03
tau −0.051 0.276 −0.185 8.53E−01 0.076 0.097 0.777 4.38E−01
p-tau181 1.536 0.355 4.322 2.20E−05 0.618 0.141 4.379 1.72E−05
NfL 5.388 2.167 2.487 1.35E−02 1.587 0.739 2.148 3.26E−02
PRS_APOE PRS_nonAPOE
β SE t p-value β SE t p-value
Aβ42 −1.664 0.354 −4.708 4.01E−06 0.030 0.588 0.051 9.59E−01
Aβ40 5.355 7.355 0.728 4.67E−01 11.423 9.584 1.192 2.34E−01
Aβ42/Aβ40 −0.007 0.002 −3.897 1.23E−04 0.000 0.003 0.012 9.91E−01
tau 0.022 0.106 0.211 8.33E−01 0.203 0.150 1.352 1.78E−01
p-tau181 0.657 0.168 3.901 1.22E−04 0.465 0.253 1.839 6.71E−02
NfL 1.704 0.914 1.864 6.34E−02 0.854 1.168 0.731 4.65E−01
Group Biomarker NN PRS_Full
NC β SE t p-value β SE t p-value
Aβ42 −3.936 1.276 −3.086 2.55E−03 −1.524 0.526 −2.894 4.55E−03
Aβ40 24.432 22.467 1.087 2.79E−01 10.729 8.618 1.245 2.16E−01
Aβ42/Aβ40 −0.023 0.007 −3.145 2.12E−03 −0.009 0.003 −3.022 3.09E−03
tau −0.454 0.384 −1.183 2.39E−01 −0.113 0.179 −0.633 5.28E−01
p-tau181 0.629 0.278 2.265 2.55E−02 0.309 0.190 1.625 1.07E−01
NfL 4.749 2.229 2.130 3.53E−02 1.110 0.811 1.368 1.74E−01
PRS_APOE PRS_nonAPOE
β SE t p-value β SE t p-value
Aβ42 −2.229 0.493 −4.520 1.52E−05 0.336 0.879 0.383 7.03E−01
Aβ40 2.541 8.667 0.293 7.70E−01 30.349 12.515 2.425 1.69E−02
Aβ42/Aβ40 −0.011 0.003 −3.533 5.94E−04 −0.004 0.006 −0.782 4.36E−01
tau −0.160 0.177 −0.901 3.70E−01 0.105 0.245 0.428 6.69E−01
p-tau181 0.293 0.222 1.324 1.88E−01 0.275 0.228 1.205 2.31E−01
NfL 0.697 0.850 0.820 4.14E−01 1.724 1.223 1.409 1.61E−01
Group Biomarker NN PRS_Full
AD β SE t p-value β SE t p-value
Aβ42 −2.457 1.475 −1.665 9.80E−02 −0.910 0.486 −1.872 6.32E−02
Aβ40 9.025 22.723 0.397 6.92E−01 −1.704 8.015 −0.213 8.32E−01
Aβ42/Aβ40 −0.006 0.004 −1.460 1.46E−01 −0.002 0.002 −1.408 1.61E−01
tau 0.306 0.386 0.791 4.30E−01 0.162 0.121 1.331 1.85E−01
p-tau181 0.711 0.708 1.005 3.17E−01 0.132 0.227 0.579 5.63E−01
NfL 0.953 3.698 0.258 7.97E−01 0.002 1.044 0.002 9.99E−01
PRS_APOE PRS_nonAPOE
β SE t p-value β SE t p-value
Aβ42 −1.181 0.519 −2.276 2.43E−02 0.031 0.774 0.040 9.68E−01
Aβ40 3.290 9.693 0.339 7.35E−01 −13.761 15.093 −0.912 3.63E−01
Aβ42/Aβ40 −0.003 0.002 −1.718 8.79E−02 0.002 0.002 0.702 4.84E−01
tau 0.089 0.151 0.590 5.56E−01 0.274 0.191 1.432 1.54E−01
p-tau181 0.190 0.268 0.710 4.79E−01 0.000 0.506 0.000 1.00E+00
NfL 0.741 1.284 0.577 5.65E−01 −2.297 1.821 −1.261 2.09E−01
Aβ, amyloid-beta; AD, Alzheimer’s disease; β, effect size; NC, normal control; NfL,
neurofilament light polypeptide; NN, neural network; PRS, polygenic risk score; SE, standard
error. Bold underlined text indicates p < 0.05; underlined text indicates p < 0.10.
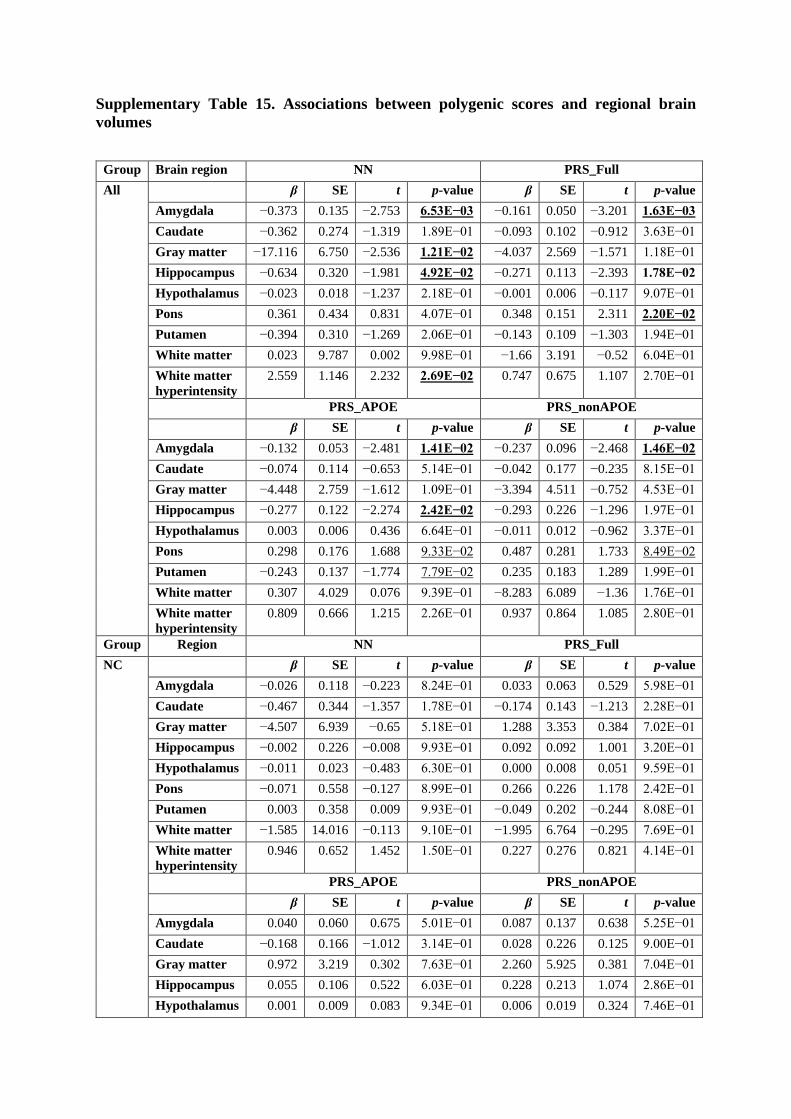
Supplementary Table 15. Associations between polygenic scores and regional brain
volumes
Group Brain region NN PRS_Full
All β SE t p-value β SE t p-value
Amygdala −0.373 0.135 −2.753 6.53E−03 −0.161 0.050 −3.201 1.63E−03
Caudate −0.362 0.274 −1.319 1.89E−01 −0.093 0.102 −0.912 3.63E−01
Gray matter −17.116 6.750 −2.536 1.21E−02 −4.037 2.569 −1.571 1.18E−01
Hippocampus −0.634 0.320 −1.981 4.92E−02 −0.271 0.113 −2.393 1.78E−02
Hypothalamus −0.023 0.018 −1.237 2.18E−01 −0.001 0.006 −0.117 9.07E−01
Pons 0.361 0.434 0.831 4.07E−01 0.348 0.151 2.311 2.20E−02
Putamen −0.394 0.310 −1.269 2.06E−01 −0.143 0.109 −1.303 1.94E−01
White matter 0.023 9.787 0.002 9.98E−01 −1.66 3.191 −0.52 6.04E−01
White matter
hyperintensity
2.559 1.146 2.232 2.69E−02 0.747 0.675 1.107 2.70E−01
PRS_APOE PRS_nonAPOE
β SE t p-value β SE t p-value
Amygdala −0.132 0.053 −2.481 1.41E−02 −0.237 0.096 −2.468 1.46E−02
Caudate −0.074 0.114 −0.653 5.14E−01 −0.042 0.177 −0.235 8.15E−01
Gray matter −4.448 2.759 −1.612 1.09E−01 −3.394 4.511 −0.752 4.53E−01
Hippocampus −0.277 0.122 −2.274 2.42E−02 −0.293 0.226 −1.296 1.97E−01
Hypothalamus 0.003 0.006 0.436 6.64E−01 −0.011 0.012 −0.962 3.37E−01
Pons 0.298 0.176 1.688 9.33E−02 0.487 0.281 1.733 8.49E−02
Putamen −0.243 0.137 −1.774 7.79E−02 0.235 0.183 1.289 1.99E−01
White matter 0.307 4.029 0.076 9.39E−01 −8.283 6.089 −1.36 1.76E−01
White matter
hyperintensity
0.809 0.666 1.215 2.26E−01 0.937 0.864 1.085 2.80E−01
Group Region NN PRS_Full
NC β SE t p-value β SE t p-value
Amygdala −0.026 0.118 −0.223 8.24E−01 0.033 0.063 0.529 5.98E−01
Caudate −0.467 0.344 −1.357 1.78E−01 −0.174 0.143 −1.213 2.28E−01
Gray matter −4.507 6.939 −0.65 5.18E−01 1.288 3.353 0.384 7.02E−01
Hippocampus −0.002 0.226 −0.008 9.93E−01 0.092 0.092 1.001 3.20E−01
Hypothalamus −0.011 0.023 −0.483 6.30E−01 0.000 0.008 0.051 9.59E−01
Pons −0.071 0.558 −0.127 8.99E−01 0.266 0.226 1.178 2.42E−01
Putamen 0.003 0.358 0.009 9.93E−01 −0.049 0.202 −0.244 8.08E−01
White matter −1.585 14.016 −0.113 9.10E−01 −1.995 6.764 −0.295 7.69E−01
White matter
hyperintensity
0.946 0.652 1.452 1.50E−01 0.227 0.276 0.821 4.14E−01
PRS_APOE PRS_nonAPOE
β SE t p-value β SE t p-value
Amygdala 0.040 0.060 0.675 5.01E−01 0.087 0.137 0.638 5.25E−01
Caudate −0.168 0.166 −1.012 3.14E−01 0.028 0.226 0.125 9.00E−01
Gray matter 0.972 3.219 0.302 7.63E−01 2.260 5.925 0.381 7.04E−01
Hippocampus 0.055 0.106 0.522 6.03E−01 0.228 0.213 1.074 2.86E−01
Hypothalamus 0.001 0.009 0.083 9.34E−01 0.006 0.019 0.324 7.46E−01

Pons 0.131 0.261 0.500 6.18E−01 0.778 0.418 1.860 6.61E−02
Putamen −0.163 0.272 −0.6 5.50E−01 0.462 0.234 1.977 5.10E−02
White matter 1.475 8.261 0.178 8.59E−01 −13.225 8.292 −1.595 1.14E−01
White matter
hyperintensity
0.233 0.311 0.750 4.55E−01 −0.026 0.574 −0.046 9.64E−01
Group Region NN PRS_Full
AD β SE t p-value β SE t p-value
Amygdala −0.27 0.339 −0.796 4.29E−01 −0.096 0.117 −0.815 4.18E−01
Caudate −0.403 0.553 −0.73 4.68E−01 −0.1 0.167 −0.598 5.52E−01
Gray matter −22.958 13.366 −1.718 9.04E−02 −2.554 3.767 −0.678 5.00E−01
Hippocampus 0.213 0.476 0.449 6.55E−01 −0.112 0.122 −0.914 3.64E−01
Hypothalamus 0.000 0.029 −0.006 9.96E−01 0.008 0.009 0.927 3.57E−01
Pons 1.683 0.803 2.097 3.97E−02 0.631 0.245 2.579 1.21E−02
Putamen −0.44 0.777 −0.566 5.73E−01 −0.015 0.194 −0.077 9.39E−01
White matter 24.228 15.221 1.592 1.16E−01 5.036 3.795 1.327 1.89E−01
White matter
hyperintensity
−0.17 3.799 −0.045 9.64E−01 0.307 0.929 0.331 7.42E−01
PRS_APOE PRS_nonAPOE
β SE t p-value β SE t p-value
Amygdala 0.009 0.106 0.085 9.33E−01 −0.381 0.185 −2.062 4.31E−02
Caudate −0.055 0.195 −0.283 7.78E−01 −0.209 0.345 −0.606 5.46E−01
Gray matter −2.061 5.388 −0.382 7.03E−01 −4.721 6.714 −0.703 4.84E−01
Hippocampus −0.004 0.158 −0.026 9.79E−01 −0.371 0.228 −1.626 1.09E−01
Hypothalamus 0.013 0.009 1.462 1.48E−01 −0.004 0.014 −0.267 7.90E−01
Pons 0.761 0.276 2.756 7.52E−03 0.314 0.358 0.878 3.83E−01
Putamen −0.033 0.237 −0.139 8.90E−01 0.115 0.403 0.284 7.77E−01
White matter 7.957 4.945 1.609 1.12E−01 −2.487 6.679 −0.372 7.11E−01
White matter
hyperintensity
0.446 0.925 0.482 6.32E−01 −0.363 1.787 −0.203 8.40E−01
AD, Alzheimer’s disease; β, effect size; NC, normal control; NN, neural network; PRS,
polygenic risk score; SE, standard error. Bold underlined text indicates p < 0.05; underlined
text indicates p < 0.10.

Supplementary Table 16. Plasma proteins significantly associated with neural network
model risk score in normal controls
Protein Uniprot_ID β SE t p-value FDR
MMP-1 P03956 2033.208 750.694 2.708 8.80E−03 0.677
VEGFA P15692 642.467 267.060 2.406 1.92E−02 0.706
CCL19 Q99731 609.755 109.720 5.557 6.65E−07 0.001
VEGFA P15692 324.745 133.149 2.439 1.78E−02 0.706
PGF P49763 95.135 39.392 2.415 1.88E−02 0.706
WFDC2 Q14508 44.616 16.481 2.707 8.86E−03 0.677
MIF P14174 44.494 22.039 2.019 4.80E−02 0.728
PGF P49763 43.780 20.917 2.093 4.06E−02 0.709
TNFRSF9 Q07011 41.782 17.534 2.383 2.04E−02 0.706
VWC2 Q2TAL6 36.690 17.242 2.128 3.75E−02 0.709
GM-CSF-R-alpha P15509 35.085 17.406 2.016 4.83E−02 0.728
CST3 P01034 31.845 15.863 2.008 4.92E−02 0.728
TNF-R1 P19438 31.034 11.214 2.767 7.51E−03 0.677
SYND1 P18827 27.210 8.760 3.106 2.91E−03 0.438
VEGFR-2 P35968 26.336 12.157 2.166 3.43E−02 0.709
TNFRSF19 Q9NS68 21.594 10.049 2.149 3.58E−02 0.709
IL-18BP O95998 18.224 8.782 2.075 4.23E−02 0.721
TNF-R2 P20333 17.334 7.564 2.292 2.55E−02 0.709
U-PAR Q03405 12.966 6.280 2.065 4.33E−02 0.728
EDA2R Q9HAV5 10.523 4.643 2.266 2.71E−02 0.709
EPHB4 P54760 10.175 3.884 2.620 1.11E−02 0.700
TFF3 Q07654 9.059 3.855 2.350 2.21E−02 0.709
TNFRSF14 Q92956 8.622 2.615 3.296 1.65E−03 0.438
CLEC14A Q86T13 7.568 3.538 2.139 3.66E−02 0.709
ANXA1 P04083 7.133 3.552 2.008 4.92E−02 0.728
NOS3 P29474 6.630 2.111 3.141 2.63E−03 0.438
NPPC P23582 5.689 2.712 2.097 4.03E−02 0.709
GZMB P10144 5.670 2.787 2.035 4.64E−02 0.728
SIT1 Q9Y3P8 5.512 2.601 2.119 3.83E−02 0.709
CAPG P40121 4.568 2.060 2.217 3.05E−02 0.709
PARK7 Q99497 4.398 1.821 2.415 1.89E−02 0.706
CSTB P04080 4.386 1.787 2.454 1.71E−02 0.706
CDSN Q15517 4.353 2.083 2.089 4.10E−02 0.709
LTBR P36941 4.325 1.425 3.035 3.55E−03 0.471
ITM2A O43736 4.188 1.516 2.763 7.63E−03 0.677
LAIR1 Q6GTX8 4.083 1.550 2.634 1.07E−02 0.700
CLEC1A Q8NC01 3.883 1.677 2.316 2.41E−02 0.709
FUT3/FUT5 Q11128,P21217 3.464 1.632 2.123 3.79E−02 0.709
UBAC1 Q9BSL1 3.446 1.639 2.102 3.98E−02 0.709
hK11 Q9UBX7 2.987 1.400 2.134 3.70E−02 0.709
SRP14 P37108 2.463 1.080 2.281 2.62E−02 0.709
PSMD9 O00233 2.276 0.776 2.931 4.80E−03 0.573
CLEC6A Q6EIG7 2.061 0.764 2.699 9.07E−03 0.677
AARSD1 Q9BTE6 1.974 0.962 2.052 4.46E−02 0.728
FCRLB Q6BAA4 1.877 0.923 2.034 4.65E−02 0.728
FGR P09769 1.874 0.762 2.460 1.69E−02 0.706
ESAM Q96AP7 1.780 0.840 2.119 3.83E−02 0.709
PRDX1 Q06830 1.661 0.672 2.471 1.64E−02 0.706
NINJ1 Q92982 1.406 0.453 3.101 2.93E−03 0.438
PI3 P19957 1.366 0.631 2.165 3.43E−02 0.709
PTK7 Q13308 1.306 0.472 2.765 7.59E−03 0.677
IL12RB1 P42701 1.260 0.563 2.237 2.91E−02 0.709
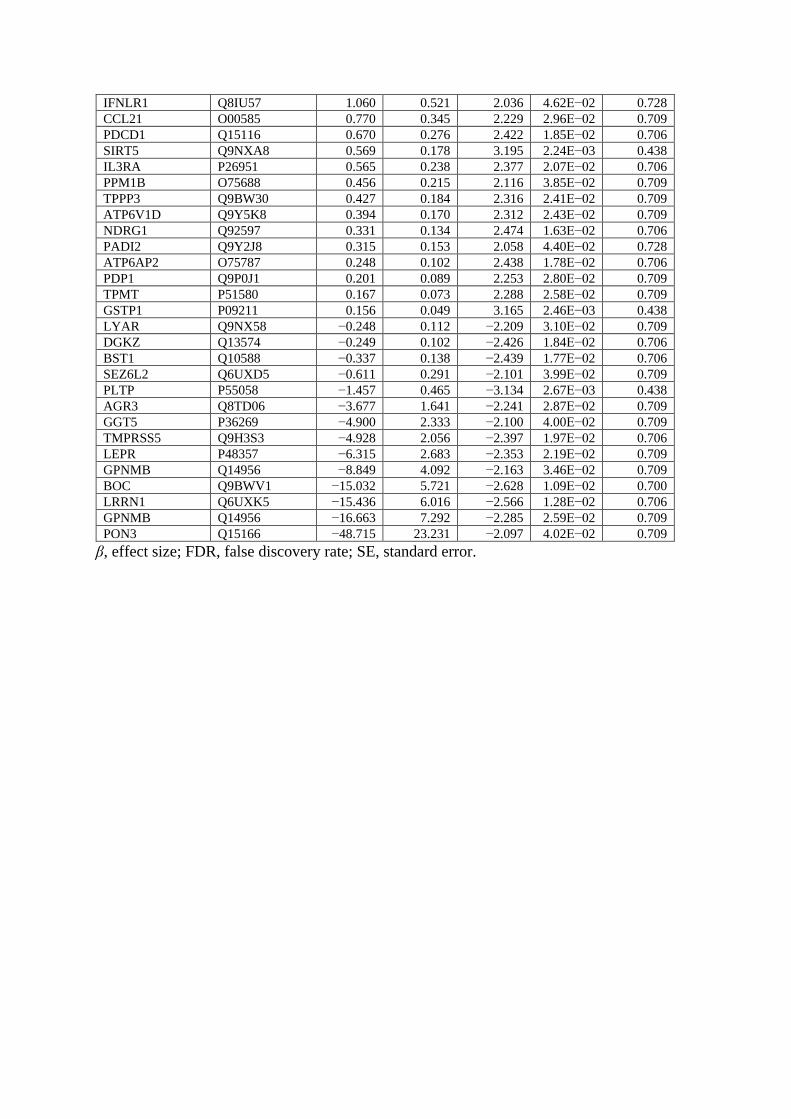
IFNLR1 Q8IU57 1.060 0.521 2.036 4.62E−02 0.728
CCL21 O00585 0.770 0.345 2.229 2.96E−02 0.709
PDCD1 Q15116 0.670 0.276 2.422 1.85E−02 0.706
SIRT5 Q9NXA8 0.569 0.178 3.195 2.24E−03 0.438
IL3RA P26951 0.565 0.238 2.377 2.07E−02 0.706
PPM1B O75688 0.456 0.215 2.116 3.85E−02 0.709
TPPP3 Q9BW30 0.427 0.184 2.316 2.41E−02 0.709
ATP6V1D Q9Y5K8 0.394 0.170 2.312 2.43E−02 0.709
NDRG1 Q92597 0.331 0.134 2.474 1.63E−02 0.706
PADI2 Q9Y2J8 0.315 0.153 2.058 4.40E−02 0.728
ATP6AP2 O75787 0.248 0.102 2.438 1.78E−02 0.706
PDP1 Q9P0J1 0.201 0.089 2.253 2.80E−02 0.709
TPMT P51580 0.167 0.073 2.288 2.58E−02 0.709
GSTP1 P09211 0.156 0.049 3.165 2.46E−03 0.438
LYAR Q9NX58 −0.248 0.112 −2.209 3.10E−02 0.709
DGKZ Q13574 −0.249 0.102 −2.426 1.84E−02 0.706
BST1 Q10588 −0.337 0.138 −2.439 1.77E−02 0.706
SEZ6L2 Q6UXD5 −0.611 0.291 −2.101 3.99E−02 0.709
PLTP P55058 −1.457 0.465 −3.134 2.67E−03 0.438
AGR3 Q8TD06 −3.677 1.641 −2.241 2.87E−02 0.709
GGT5 P36269 −4.900 2.333 −2.100 4.00E−02 0.709
TMPRSS5 Q9H3S3 −4.928 2.056 −2.397 1.97E−02 0.706
LEPR P48357 −6.315 2.683 −2.353 2.19E−02 0.709
GPNMB Q14956 −8.849 4.092 −2.163 3.46E−02 0.709
BOC Q9BWV1 −15.032 5.721 −2.628 1.09E−02 0.700
LRRN1 Q6UXK5 −15.436 6.016 −2.566 1.28E−02 0.706
GPNMB Q14956 −16.663 7.292 −2.285 2.59E−02 0.709
PON3 Q15166 −48.715 23.231 −2.097 4.02E−02 0.709
β, effect size; FDR, false discovery rate; SE, standard error.

Supplementary Table 17. Gene Ontology analysis of plasma proteins associated with
polygenic scores in normal controls (i.e., positively associated with polygenic risk)
Category Term Gene
count
p-value FDR
GOTERM_BP_ALL Cell surface receptor signaling pathway 34 2.20E−11 5.60E−08
GOTERM_BP_ALL Cytokine-mediated signaling pathway 16 1.40E−09 1.30E−06
GOTERM_BP_ALL Cellular response to tumor necrosis factor 12 1.50E−09 1.30E−06
GOTERM_BP_ALL Immune system process 30 2.70E−09 1.60E−06
GOTERM_BP_ALL Response to tumor necrosis factor 12 3.40E−09 1.60E−06
GOTERM_BP_ALL Response to cytokine 18 3.80E−09 1.60E−06
GOTERM_BP_ALL Cellular response to cytokine stimulus 17 4.70E−09 1.70E−06
GOTERM_BP_ALL Regulation of response to external stimulus 17 6.30E−09 2.00E−06
GOTERM_BP_ALL Defense response 23 1.30E−08 3.50E−06
GOTERM_BP_ALL Cellular response to chemical stimulus 30 1.40E−08 3.50E−06
GOTERM_BP_ALL Cellular response to organic substance 27 2.30E−08 4.70E−06
GOTERM_BP_ALL Regulation of response to stress 21 2.30E−08 4.70E−06
GOTERM_BP_ALL Tumor necrosis factor-mediated signaling pathway 9 4.80E−08 9.10E−06
GOTERM_BP_ALL Response to organic substance 30 6.10E−08 1.10E−05
GOTERM_BP_ALL Immune response 22 1.00E−07 1.70E−05
GOTERM_BP_ALL Response to stress 34 1.10E−07 1.70E−05
GOTERM_BP_ALL Response to external stimulus 25 1.70E−07 2.50E−05
GOTERM_BP_ALL Regulation of I-kappaB kinase/NF-kappaB signaling 10 2.40E−07 3.30E−05
GOTERM_BP_ALL Protein phosphorylation 23 4.50E−07 5.70E−05
GOTERM_BP_ALL I-kappaB kinase/NF-kappaB signaling 10 4.60E−07 5.70E−05
GOTERM_BP_ALL Regulation of programmed cell death 20 5.60E−07 6.70E−05
GOTERM_BP_ALL Response to reactive oxygen species 9 1.10E−06 1.30E−04
GOTERM_BP_ALL Regulation of cell death 20 1.50E−06 1.60E−04
GOTERM_BP_ALL Protein metabolic process 40 1.50E−06 1.60E−04
GOTERM_BP_ALL Response to chemical 34 1.80E−06 1.60E−04
GOTERM_BP_ALL Response to external biotic stimulus 15 1.80E−06 1.60E−04
GOTERM_BP_ALL Response to other organism 15 1.80E−06 1.60E−04
GOTERM_BP_ALL Programmed cell death 22 2.00E−06 1.70E−04
GOTERM_BP_ALL MAPK cascade 15 2.10E−06 1.80E−04
GOTERM_BP_ALL Signal transduction 41 2.20E−06 1.90E−04
GOTERM_BP_ALL Regulation of apoptotic process 19 2.30E−06 1.90E−04
GOTERM_BP_ALL Response to lipid 15 2.70E−06 2.10E−04
GOTERM_BP_ALL Apoptotic process 21 3.30E−06 2.30E−04
GOTERM_BP_ALL Response to biotic stimulus 15 3.30E−06 2.30E−04
GOTERM_BP_ALL Cellular protein metabolic process 37 3.30E−06 2.30E−04
GOTERM_BP_ALL Signal transduction by protein phosphorylation 15 3.50E−06 2.40E−04
GOTERM_BP_ALL Regulation of response to stimulus 31 4.30E−06 2.90E−04
GOTERM_BP_ALL Response to oxygen-containing compound 19 4.50E−06 2.90E−04
GOTERM_BP_ALL Cell death 22 4.80E−06 3.10E−04
GOTERM_BP_ALL Cell migration 17 5.20E−06 3.30E−04
GOTERM_BP_ALL Positive regulation of phosphorus metabolic process 16 5.60E−06 3.30E−04
GOTERM_BP_ALL Positive regulation of phosphate metabolic process 16 5.60E−06 3.30E−04
GOTERM_BP_ALL Peptidyl-tyrosine phosphorylation 10 5.70E−06 3.30E−04
GOTERM_BP_ALL Peptidyl-tyrosine modification 10 6.00E−06 3.40E−04
GOTERM_BP_ALL Regulation of MAPK cascade 13 6.90E−06 3.80E−04
GOTERM_BP_ALL Regulation of immune system process 18 8.40E−06 4.50E−04
GOTERM_BP_ALL Regulation of cytokine production 12 8.70E−06 4.60E−04
GOTERM_BP_ALL Apoptotic signaling pathway 12 9.60E−06 4.90E−04
GOTERM_BP_ALL Regulation of stress-activated MAPK cascade 8 9.60E−06 4.90E−04
GOTERM_BP_ALL Regulation of cell proliferation 19 9.90E−06 4.90E−04
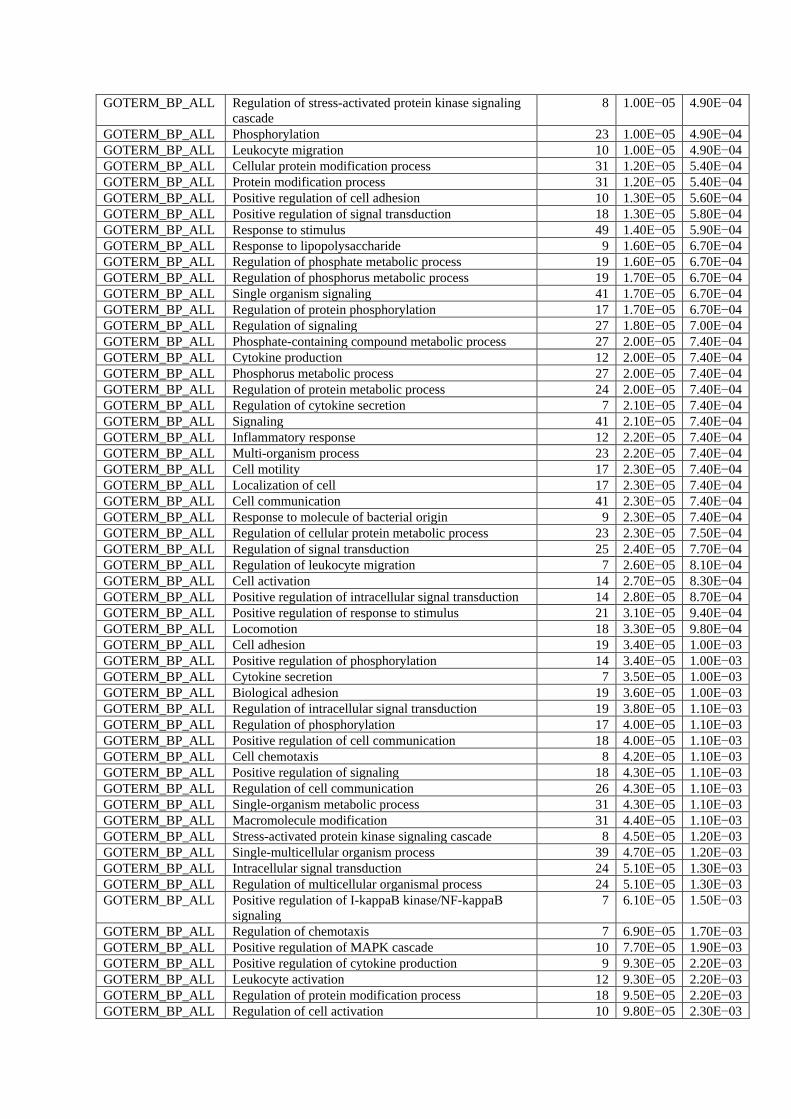
GOTERM_BP_ALL Regulation of stress-activated protein kinase signaling
cascade
8 1.00E−05 4.90E−04
GOTERM_BP_ALL Phosphorylation 23 1.00E−05 4.90E−04
GOTERM_BP_ALL Leukocyte migration 10 1.00E−05 4.90E−04
GOTERM_BP_ALL Cellular protein modification process 31 1.20E−05 5.40E−04
GOTERM_BP_ALL Protein modification process 31 1.20E−05 5.40E−04
GOTERM_BP_ALL Positive regulation of cell adhesion 10 1.30E−05 5.60E−04
GOTERM_BP_ALL Positive regulation of signal transduction 18 1.30E−05 5.80E−04
GOTERM_BP_ALL Response to stimulus 49 1.40E−05 5.90E−04
GOTERM_BP_ALL Response to lipopolysaccharide 9 1.60E−05 6.70E−04
GOTERM_BP_ALL Regulation of phosphate metabolic process 19 1.60E−05 6.70E−04
GOTERM_BP_ALL Regulation of phosphorus metabolic process 19 1.70E−05 6.70E−04
GOTERM_BP_ALL Single organism signaling 41 1.70E−05 6.70E−04
GOTERM_BP_ALL Regulation of protein phosphorylation 17 1.70E−05 6.70E−04
GOTERM_BP_ALL Regulation of signaling 27 1.80E−05 7.00E−04
GOTERM_BP_ALL Phosphate-containing compound metabolic process 27 2.00E−05 7.40E−04
GOTERM_BP_ALL Cytokine production 12 2.00E−05 7.40E−04
GOTERM_BP_ALL Phosphorus metabolic process 27 2.00E−05 7.40E−04
GOTERM_BP_ALL Regulation of protein metabolic process 24 2.00E−05 7.40E−04
GOTERM_BP_ALL Regulation of cytokine secretion 7 2.10E−05 7.40E−04
GOTERM_BP_ALL Signaling 41 2.10E−05 7.40E−04
GOTERM_BP_ALL Inflammatory response 12 2.20E−05 7.40E−04
GOTERM_BP_ALL Multi-organism process 23 2.20E−05 7.40E−04
GOTERM_BP_ALL Cell motility 17 2.30E−05 7.40E−04
GOTERM_BP_ALL Localization of cell 17 2.30E−05 7.40E−04
GOTERM_BP_ALL Cell communication 41 2.30E−05 7.40E−04
GOTERM_BP_ALL Response to molecule of bacterial origin 9 2.30E−05 7.40E−04
GOTERM_BP_ALL Regulation of cellular protein metabolic process 23 2.30E−05 7.50E−04
GOTERM_BP_ALL Regulation of signal transduction 25 2.40E−05 7.70E−04
GOTERM_BP_ALL Regulation of leukocyte migration 7 2.60E−05 8.10E−04
GOTERM_BP_ALL Cell activation 14 2.70E−05 8.30E−04
GOTERM_BP_ALL Positive regulation of intracellular signal transduction 14 2.80E−05 8.70E−04
GOTERM_BP_ALL Positive regulation of response to stimulus 21 3.10E−05 9.40E−04
GOTERM_BP_ALL Locomotion 18 3.30E−05 9.80E−04
GOTERM_BP_ALL Cell adhesion 19 3.40E−05 1.00E−03
GOTERM_BP_ALL Positive regulation of phosphorylation 14 3.40E−05 1.00E−03
GOTERM_BP_ALL Cytokine secretion 7 3.50E−05 1.00E−03
GOTERM_BP_ALL Biological adhesion 19 3.60E−05 1.00E−03
GOTERM_BP_ALL Regulation of intracellular signal transduction 19 3.80E−05 1.10E−03
GOTERM_BP_ALL Regulation of phosphorylation 17 4.00E−05 1.10E−03
GOTERM_BP_ALL Positive regulation of cell communication 18 4.00E−05 1.10E−03
GOTERM_BP_ALL Cell chemotaxis 8 4.20E−05 1.10E−03
GOTERM_BP_ALL Positive regulation of signaling 18 4.30E−05 1.10E−03
GOTERM_BP_ALL Regulation of cell communication 26 4.30E−05 1.10E−03
GOTERM_BP_ALL Single-organism metabolic process 31 4.30E−05 1.10E−03
GOTERM_BP_ALL Macromolecule modification 31 4.40E−05 1.10E−03
GOTERM_BP_ALL Stress-activated protein kinase signaling cascade 8 4.50E−05 1.20E−03
GOTERM_BP_ALL Single-multicellular organism process 39 4.70E−05 1.20E−03
GOTERM_BP_ALL Intracellular signal transduction 24 5.10E−05 1.30E−03
GOTERM_BP_ALL Regulation of multicellular organismal process 24 5.10E−05 1.30E−03
GOTERM_BP_ALL Positive regulation of I-kappaB kinase/NF-kappaB
signaling
7 6.10E−05 1.50E−03
GOTERM_BP_ALL Regulation of chemotaxis 7 6.90E−05 1.70E−03
GOTERM_BP_ALL Positive regulation of MAPK cascade 10 7.70E−05 1.90E−03
GOTERM_BP_ALL Positive regulation of cytokine production 9 9.30E−05 2.20E−03
GOTERM_BP_ALL Leukocyte activation 12 9.30E−05 2.20E−03
GOTERM_BP_ALL Regulation of protein modification process 18 9.50E−05 2.20E−03
GOTERM_BP_ALL Regulation of cell activation 10 9.80E−05 2.30E−03
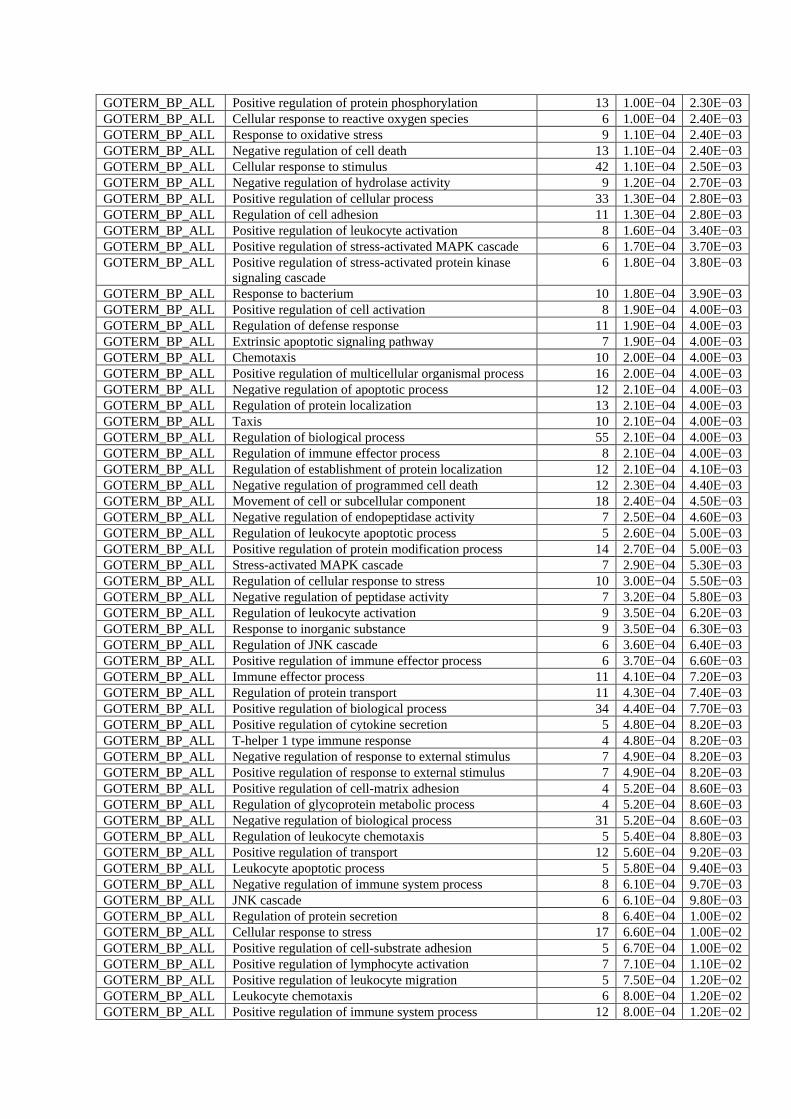
GOTERM_BP_ALL Positive regulation of protein phosphorylation 13 1.00E−04 2.30E−03
GOTERM_BP_ALL Cellular response to reactive oxygen species 6 1.00E−04 2.40E−03
GOTERM_BP_ALL Response to oxidative stress 9 1.10E−04 2.40E−03
GOTERM_BP_ALL Negative regulation of cell death 13 1.10E−04 2.40E−03
GOTERM_BP_ALL Cellular response to stimulus 42 1.10E−04 2.50E−03
GOTERM_BP_ALL Negative regulation of hydrolase activity 9 1.20E−04 2.70E−03
GOTERM_BP_ALL Positive regulation of cellular process 33 1.30E−04 2.80E−03
GOTERM_BP_ALL Regulation of cell adhesion 11 1.30E−04 2.80E−03
GOTERM_BP_ALL Positive regulation of leukocyte activation 8 1.60E−04 3.40E−03
GOTERM_BP_ALL Positive regulation of stress-activated MAPK cascade 6 1.70E−04 3.70E−03
GOTERM_BP_ALL Positive regulation of stress-activated protein kinase
signaling cascade
6 1.80E−04 3.80E−03
GOTERM_BP_ALL Response to bacterium 10 1.80E−04 3.90E−03
GOTERM_BP_ALL Positive regulation of cell activation 8 1.90E−04 4.00E−03
GOTERM_BP_ALL Regulation of defense response 11 1.90E−04 4.00E−03
GOTERM_BP_ALL Extrinsic apoptotic signaling pathway 7 1.90E−04 4.00E−03
GOTERM_BP_ALL Chemotaxis 10 2.00E−04 4.00E−03
GOTERM_BP_ALL Positive regulation of multicellular organismal process 16 2.00E−04 4.00E−03
GOTERM_BP_ALL Negative regulation of apoptotic process 12 2.10E−04 4.00E−03
GOTERM_BP_ALL Regulation of protein localization 13 2.10E−04 4.00E−03
GOTERM_BP_ALL Taxis 10 2.10E−04 4.00E−03
GOTERM_BP_ALL Regulation of biological process 55 2.10E−04 4.00E−03
GOTERM_BP_ALL Regulation of immune effector process 8 2.10E−04 4.00E−03
GOTERM_BP_ALL Regulation of establishment of protein localization 12 2.10E−04 4.10E−03
GOTERM_BP_ALL Negative regulation of programmed cell death 12 2.30E−04 4.40E−03
GOTERM_BP_ALL Movement of cell or subcellular component 18 2.40E−04 4.50E−03
GOTERM_BP_ALL Negative regulation of endopeptidase activity 7 2.50E−04 4.60E−03
GOTERM_BP_ALL Regulation of leukocyte apoptotic process 5 2.60E−04 5.00E−03
GOTERM_BP_ALL Positive regulation of protein modification process 14 2.70E−04 5.00E−03
GOTERM_BP_ALL Stress-activated MAPK cascade 7 2.90E−04 5.30E−03
GOTERM_BP_ALL Regulation of cellular response to stress 10 3.00E−04 5.50E−03
GOTERM_BP_ALL Negative regulation of peptidase activity 7 3.20E−04 5.80E−03
GOTERM_BP_ALL Regulation of leukocyte activation 9 3.50E−04 6.20E−03
GOTERM_BP_ALL Response to inorganic substance 9 3.50E−04 6.30E−03
GOTERM_BP_ALL Regulation of JNK cascade 6 3.60E−04 6.40E−03
GOTERM_BP_ALL Positive regulation of immune effector process 6 3.70E−04 6.60E−03
GOTERM_BP_ALL Immune effector process 11 4.10E−04 7.20E−03
GOTERM_BP_ALL Regulation of protein transport 11 4.30E−04 7.40E−03
GOTERM_BP_ALL Positive regulation of biological process 34 4.40E−04 7.70E−03
GOTERM_BP_ALL Positive regulation of cytokine secretion 5 4.80E−04 8.20E−03
GOTERM_BP_ALL T-helper 1 type immune response 4 4.80E−04 8.20E−03
GOTERM_BP_ALL Negative regulation of response to external stimulus 7 4.90E−04 8.20E−03
GOTERM_BP_ALL Positive regulation of response to external stimulus 7 4.90E−04 8.20E−03
GOTERM_BP_ALL Positive regulation of cell-matrix adhesion 4 5.20E−04 8.60E−03
GOTERM_BP_ALL Regulation of glycoprotein metabolic process 4 5.20E−04 8.60E−03
GOTERM_BP_ALL Negative regulation of biological process 31 5.20E−04 8.60E−03
GOTERM_BP_ALL Regulation of leukocyte chemotaxis 5 5.40E−04 8.80E−03
GOTERM_BP_ALL Positive regulation of transport 12 5.60E−04 9.20E−03
GOTERM_BP_ALL Leukocyte apoptotic process 5 5.80E−04 9.40E−03
GOTERM_BP_ALL Negative regulation of immune system process 8 6.10E−04 9.70E−03
GOTERM_BP_ALL JNK cascade 6 6.10E−04 9.80E−03
GOTERM_BP_ALL Regulation of protein secretion 8 6.40E−04 1.00E−02
GOTERM_BP_ALL Cellular response to stress 17 6.60E−04 1.00E−02
GOTERM_BP_ALL Positive regulation of cell-substrate adhesion 5 6.70E−04 1.00E−02
GOTERM_BP_ALL Positive regulation of lymphocyte activation 7 7.10E−04 1.10E−02
GOTERM_BP_ALL Positive regulation of leukocyte migration 5 7.50E−04 1.20E−02
GOTERM_BP_ALL Leukocyte chemotaxis 6 8.00E−04 1.20E−02
GOTERM_BP_ALL Positive regulation of immune system process 12 8.00E−04 1.20E−02

GOTERM_BP_ALL Regulation of lymphocyte activation 8 8.50E−04 1.30E−02
GOTERM_BP_ALL Regulation of T-cell activation 7 8.80E−04 1.30E−02
GOTERM_BP_ALL Single-organism developmental process 34 9.00E−04 1.30E−02
GOTERM_BP_ALL Response to toxic substance 6 9.60E−04 1.40E−02
GOTERM_BP_ALL Regulation of cell migration 10 9.80E−04 1.40E−02
GOTERM_BP_ALL Innate immune response 11 1.00E−03 1.50E−02
GOTERM_BP_ALL Multicellular organismal process 40 1.00E−03 1.50E−02
GOTERM_BP_ALL Positive regulation of JNK cascade 5 1.00E−03 1.50E−02
GOTERM_BP_ALL Negative regulation of catalytic activity 11 1.10E−03 1.50E−02
GOTERM_BP_ALL Regulation of leukocyte proliferation 6 1.10E−03 1.60E−02
GOTERM_BP_ALL Positive regulation of chemotaxis 5 1.10E−03 1.60E−02
GOTERM_BP_ALL Regulation of leukocyte cell–cell adhesion 7 1.10E−03 1.60E−02
GOTERM_BP_ALL Positive regulation of T-cell activation 6 1.10E−03 1.60E−02
GOTERM_BP_ALL Cell–cell adhesion 13 1.10E−03 1.60E−02
GOTERM_BP_ALL Positive chemotaxis 4 1.10E−03 1.60E−02
GOTERM_BP_ALL Negative regulation of proteolysis 7 1.20E−03 1.70E−02
GOTERM_BP_ALL Regulation of cellular process 52 1.20E−03 1.70E−02
GOTERM_BP_ALL Positive regulation of protein secretion 6 1.20E−03 1.70E−02
GOTERM_BP_ALL Response to hydrogen peroxide 5 1.20E−03 1.70E−02
GOTERM_BP_ALL Superoxide metabolic process 4 1.30E−03 1.70E−02
GOTERM_BP_ALL Positive regulation of lipid metabolic process 5 1.30E−03 1.70E−02
GOTERM_BP_ALL Peptidyl-amino acid modification 13 1.30E−03 1.80E−02
GOTERM_BP_ALL Regulation of localization 20 1.30E−03 1.80E−02
GOTERM_BP_ALL Positive regulation of leukocyte cell-cell adhesion 6 1.30E−03 1.80E−02
GOTERM_BP_ALL Positive regulation of secretion by cell 7 1.40E−03 1.80E−02
GOTERM_BP_ALL Positive regulation of T-helper 1 type immune response 3 1.40E−03 1.90E−02
GOTERM_BP_ALL Negative regulation of response to stimulus 14 1.50E−03 1.90E−02
GOTERM_BP_ALL Developmental process 34 1.50E−03 2.00E−02
GOTERM_BP_ALL Removal of superoxide radicals 3 1.60E−03 2.10E−02
GOTERM_BP_ALL Regulation of cell motility 10 1.60E−03 2.10E−02
GOTERM_BP_ALL Cellular response to oxidative stress 6 1.60E−03 2.10E−02
GOTERM_BP_ALL Biological regulation 55 1.70E−03 2.10E−02
GOTERM_BP_ALL Positive regulation of organelle organization 9 1.70E−03 2.20E−02
GOTERM_BP_ALL Epithelium development 12 1.80E−03 2.30E−02
GOTERM_BP_ALL Protein secretion 8 1.80E−03 2.30E−02
GOTERM_BP_ALL Carbohydrate derivative biosynthetic process 10 1.90E−03 2.40E−02
GOTERM_BP_ALL Cellular response to oxygen-containing compound 11 2.00E−03 2.50E−02
GOTERM_BP_ALL Cellular response to oxygen radical 3 2.00E−03 2.50E−02
GOTERM_BP_ALL Cellular response to superoxide 3 2.00E−03 2.50E−02
GOTERM_BP_ALL Positive regulation of cellular protein metabolic
process
14 2.00E−03 2.50E−02
GOTERM_BP_ALL Anatomical structure development 33 2.10E−03 2.50E−02
GOTERM_BP_ALL Negative regulation of cellular process 28 2.10E−03 2.50E−02
GOTERM_BP_ALL Positive regulation of secretion 7 2.10E−03 2.50E−02
GOTERM_BP_ALL Regulation of locomotion 10 2.20E−03 2.60E−02
GOTERM_BP_ALL ERK1 and ERK2 cascade 6 2.20E−03 2.60E−02
GOTERM_BP_ALL Regulation of transport 16 2.20E−03 2.60E−02
GOTERM_BP_ALL Sprouting angiogenesis 4 2.30E−03 2.70E−02
GOTERM_BP_ALL Regulation of secretion by cell 9 2.40E−03 2.80E−02
GOTERM_BP_ALL Positive regulation of cell-cell adhesion 6 2.40E−03 2.80E−02
GOTERM_BP_ALL Regulation of ERK1 and ERK2 cascade 6 2.40E−03 2.80E−02
GOTERM_BP_ALL Regulation of alpha-beta T-cell activation 4 2.50E−03 2.90E−02
GOTERM_BP_ALL Positive regulation of T-helper cell differentiation 3 2.50E−03 2.90E−02
GOTERM_BP_ALL Regulation of endopeptidase activity 7 2.70E−03 3.10E−02
GOTERM_BP_ALL Lymphocyte activation 9 2.70E−03 3.10E−02
GOTERM_BP_ALL Response to superoxide 3 2.80E−03 3.20E−02
GOTERM_BP_ALL Positive regulation of cellular metabolic process 21 2.80E−03 3.20E−02
GOTERM_BP_ALL Cellular response to lipid 8 2.90E−03 3.20E−02

GOTERM_BP_ALL Regulation of cellular component movement 10 2.90E−03 3.20E−02
GOTERM_BP_ALL Regulation of apoptotic signaling pathway 7 3.00E−03 3.30E−02
GOTERM_BP_ALL Myeloid leukocyte migration 5 3.00E−03 3.30E−02
GOTERM_BP_ALL Regulation of T-helper 1 type immune response 3 3.00E−03 3.40E−02
GOTERM_BP_ALL Multicellular organism development 30 3.10E−03 3.40E−02
GOTERM_BP_ALL Cell proliferation 16 3.10E−03 3.40E−02
GOTERM_BP_ALL Cellular response to hydrogen peroxide 4 3.10E−03 3.40E−02
GOTERM_BP_ALL Regulation of cell–cell adhesion 7 3.20E−03 3.50E−02
GOTERM_BP_ALL Extrinsic apoptotic signaling pathway via death domain
receptors
4 3.20E−03 3.50E−02
GOTERM_BP_ALL Lymphocyte migration 4 3.40E−03 3.60E−02
GOTERM_BP_ALL Positive regulation of protein metabolic process 14 3.50E−03 3.70E−02
GOTERM_BP_ALL T-cell costimulation 4 3.50E−03 3.70E−02
GOTERM_BP_ALL Positive regulation of cell migration 7 3.60E−03 3.80E−02
GOTERM_BP_ALL Lymphocyte costimulation 4 3.60E−03 3.80E−02
GOTERM_BP_ALL Positive regulation of leukocyte chemotaxis 4 3.60E−03 3.80E−02
GOTERM_BP_ALL Regulation of peptidase activity 7 3.60E−03 3.80E−02
GOTERM_BP_ALL Response to oxygen radical 3 3.60E−03 3.80E−02
GOTERM_BP_ALL Regulation of hydrolase activity 13 3.70E−03 3.80E−02
GOTERM_BP_ALL Glycoprotein metabolic process 7 3.80E−03 3.90E−02
GOTERM_BP_ALL Regulation of secretion 9 3.90E−03 4.00E−02
GOTERM_BP_ALL Intrinsic apoptotic signaling pathway 6 3.90E−03 4.00E−02
GOTERM_BP_ALL Positive regulation of positive chemotaxis 3 3.90E−03 4.00E−02
GOTERM_BP_ALL Leukocyte proliferation 6 4.00E−03 4.10E−02
GOTERM_BP_ALL Cellular oxidant detoxification 4 4.00E−03 4.10E−02
GOTERM_BP_ALL Positive regulation of cellular component organization 12 4.20E−03 4.30E−02
GOTERM_BP_ALL Positive regulation of cell motility 7 4.20E−03 4.30E−02
GOTERM_BP_ALL Regulation of positive chemotaxis 3 4.20E−03 4.30E−02
GOTERM_BP_ALL Positive regulation of CD4-positive, alpha-beta T-cell
differentiation
3 4.20E−03 4.30E−02
GOTERM_BP_ALL Cellular detoxification 4 4.30E−03 4.30E−02
GOTERM_BP_ALL Positive regulation of ERK1 and ERK2 cascade 5 4.40E−03 4.40E−02
GOTERM_BP_ALL Regulation of lipid metabolic process 6 4.40E−03 4.40E−02
GOTERM_BP_ALL Regulation of cell-substrate adhesion 5 4.60E−03 4.50E−02
GOTERM_BP_ALL Regulation of proteolysis 9 4.80E−03 4.70E−02
GOTERM_BP_ALL Positive regulation of cellular component movement 7 4.80E−03 4.70E−02
GOTERM_BP_ALL Adaptive immune response 7 4.80E−03 4.70E−02
GOTERM_BP_ALL Detoxification 4 4.80E−03 4.70E−02
GOTERM_BP_ALL Tissue development 15 4.80E−03 4.70E−02
GOTERM_BP_ALL Regulation of T-helper cell differentiation 3 4.90E−03 4.70E−02
GOTERM_BP_ALL Regulation of cgmp metabolic process 3 4.90E−03 4.70E−02
GOTERM_BP_ALL Positive regulation of locomotion 7 4.90E−03 4.70E−02
GOTERM_BP_ALL Regulation of cell-matrix adhesion 4 5.10E−03 4.90E−02
GOTERM_CC_ALL Extracellular region part 41 1.10E-12 2.50E-10
GOTERM_CC_ALL Extracellular region 44 2.30E-12 2.50E-10
GOTERM_CC_ALL Extracellular exosome 32 5.40E-10 2.40E−08
GOTERM_CC_ALL Extracellular vesicle 32 6.10E-10 2.40E−08
GOTERM_CC_ALL Extracellular organelle 32 6.20E-10 2.40E−08
GOTERM_CC_ALL Membrane-bounded vesicle 36 6.50E-10 2.40E−08
GOTERM_CC_ALL Vesicle 36 1.90E−09 6.10E−08
GOTERM_CC_ALL Extracellular space 18 6.60E−06 1.80E−04
GOTERM_CC_ALL Plasma membrane part 24 1.60E−05 3.80E−04
GOTERM_CC_ALL Plasma membrane 35 2.30E−05 4.80E−04
GOTERM_CC_ALL External side of plasma membrane 8 2.40E−05 4.80E−04
GOTERM_CC_ALL Cell periphery 35 3.80E−05 7.00E−04
GOTERM_CC_ALL Integral component of plasma membrane 17 1.30E−04 2.10E−03
GOTERM_CC_ALL Side of membrane 9 1.60E−04 2.50E−03

GOTERM_CC_ALL Intrinsic component of plasma membrane 17 2.00E−04 2.90E−03
GOTERM_CC_ALL Cell surface 11 3.10E−04 4.30E−03
GOTERM_CC_ALL Extracellular matrix 9 5.10E−04 6.60E−03
GOTERM_CC_ALL Anchoring junction 10 8.00E−04 9.80E−03
GOTERM_CC_ALL Proteinaceous extracellular matrix 7 1.70E−03 1.90E−02
GOTERM_CC_ALL Adherens junction 9 2.90E−03 3.10E−02
Category Term Gene
count
p-value FDR
GOTERM_MF_ALL Tumor necrosis factor-activated receptor activity 7 2.20E-10 3.40E−08
GOTERM_MF_ALL Death receptor activity 7 2.20E-10 3.40E−08
GOTERM_MF_ALL Signal transducer activity 18 1.20E−04 9.00E−03
GOTERM_MF_ALL Signaling receptor activity 16 1.20E−04 9.00E−03
GOTERM_MF_ALL Molecular transducer activity 17 2.30E−04 1.20E−02
GOTERM_MF_ALL Receptor activity 17 2.30E−04 1.20E−02
GOTERM_MF_ALL Cytokine binding 5 3.80E−04 1.70E−02
GOTERM_MF_ALL Transmembrane signaling receptor activity 14 6.80E−04 2.60E−02
GOTERM_MF_ALL Transmembrane receptor activity 14 9.90E−04 3.30E−02
Category Term Gene
count
p-value FDR
KEGG_PATHWAY Cytokine–cytokine receptor interaction 13 1.70E−09 1.30E−07
FDR, false discovery rate.

Supplementary Table 18. Gene Ontology analysis of plasma proteins associated with
polygenic scores in normal controls (i.e., negatively associated with polygenic risk)
Category Term Gene count p-value FDR
GOTERM_BP_ALL Cell activation 4 1.90E−02 1.00E+00
GOTERM_BP_ALL Small molecule
biosynthetic process 3 3.90E−02 1.00E+00
GOTERM_BP_ALL Regulation of tissue
remodeling 2 4.40E−02 1.00E+00
GOTERM_CC_ALL Plasma membrane 8 2.80E−02 1.00E+00
GOTERM_CC_ALL Cell periphery 8 3.10E−02 1.00E+00
FDR, false discovery rate.

Supplementary Table 19. Summary of protein–protein interaction network analysis for
plasma proteins associated with polygenic scores
Statistic Value
Number of nodes 19
(14 + 5 interactors)
Number of edges 113
Average node degree 11.9
Average local clustering coefficient 0.844
Expected number of edges 22
Protein–protein interaction
enrichment p-value
<1.0E−16

Supplementary Table 20. Plasma proteins associated with individual modules in the
neural network model
Index Protein_name UniprotID OlinkID β SE t-value p-value Module Cluster
1 GCNT1 Q02742 OID01349 −160.25 33.21 -4.83 1.11E−05 4 1
2 ECE1 P42892 OID05132 −15.26 3.32 −4.60 2.54E−05 2 1
3 AARSD1 Q9BTE6 OID05202 −59.50 14.01 −4.25 8.39E−05 4 1
4 KRT19 P08727 OID00967 77.45 19.22 4.03 1.74E−04 2 1
5 IL15 P40933 OID05169 33.55 8.97 3.74 4.38E−04 4 1
6 UNC5C O95185 OID00292 −1020.97 289.30 −3.53 8.41E−04 3 1
7 CRADD P78560 OID05129 −337.67 95.87 −3.52 8.69E−04 4 1
8 BST1 Q10588 OID01436 23.87 6.84 3.49 9.56E−04 3 1
9 USO1 O60763 OID05443 −116.60 35.80 −3.26 1.93E−03 4 1
10 VASH1 Q7L8A9 OID01073 −17.78 5.50 −3.23 2.06E−03 4 1
11 LAMP3 Q9UQV4 OID01015 −402.07 124.47 −3.23 2.09E−03 4 1
12 SPRY2 O43597 OID00998 −275.43 85.65 −3.22 2.18E−03 4 1
13 SRPK2 P78362 OID00994 −57.95 18.02 −3.22 2.18E−03 4 1
14 EIF4G1 Q04637 OID00976 −768.16 242.52 −3.17 2.51E−03 4 1
15 LGMN Q99538 OID01460 −62.77 19.83 −3.16 2.53E−03 4 1
16 CNTN4 Q8IWV2 OID01476 278.35 88.85 3.13 2.77E−03 5 1
17 ICA1 Q05084 OID01003 −75.12 24.22 −3.10 3.04E−03 5 1
18 NUB1 Q9Y5A7 OID01092 −114.23 39.39 −2.90 5.36E−03 4 1
19 HAGH Q16775 OID00322 −310.39 109.41 −2.84 6.33E−03 4 1
20 CRX O43186 OID01315 158.55 56.53 2.80 6.91E−03 2 1
21 DNAJB1 P25685 OID01342 −861.51 307.18 −2.80 6.91E−03 4 1
22 PRDX5 P30044 OID00955 −363.08 129.87 −2.80 7.12E−03 4 1
23 IL3RA P26951 OID05211 −12.30 4.40 −2.79 7.14E−03 4 1
24 LSP1 P33241 OID05440 −161.82 59.11 −2.74 8.33E−03 4 1
25 CASP2 P42575 OID05437 −27.01 9.91 −2.73 8.59E−03 4 1
26 NFKBIE O00221 OID01310 −89.95 33.12 −2.72 8.76E−03 5 1
27 LGALS7 P47929 OID01344 −29.91 11.01 −2.72 8.76E−03 2 1
28 5'-NT P21589 OID00708 −16980.87 6264.00 −2.71 8.93E−03 5 1
29 CCT5 P48643 OID05436 −6.46 2.41 −2.68 9.62E−03 4 1
30 DAPP1 Q9UN19 OID01011 −2250.82 839.12 −2.68 9.63E−03 5 1
31 MIF P14174 OID01453 −974.70 364.03 −2.68 9.76E−03 4 1
32 HSP90B1 P14625 OID05159 8.73 3.30 2.64 1.07E−02 4 1
33 AIMP1 Q12904 OID05448 −121.93 46.39 −2.63 1.11E−02 4 1
34 NFATC1 O95644 OID01325 −109.37 42.09 −2.60 1.19E−02 5 1
35 EDA2R Q9HAV5 OID00370 −606.17 234.43 −2.59 1.23E−02 1 1
36 DRG2 P55039 OID05463 −15.84 6.17 −2.57 1.29E−02 4 1
37 PRDX1 Q06830 OID00952 −24.71 9.62 −2.57 1.30E−02 4 1
38 TR-AP P13686 OID00606 135.52 53.81 2.52 1.47E−02 2 1
39 PTPN6 P29350 OID01446 −19.47 7.75 −2.51 1.49E−02 4 1
40 FGF-5 P12034 OID00509 −11.14 4.45 −2.50 1.53E−02 4 1
41 SCAMP3 O14828 OID00668 −1480.72 592.37 −2.50 1.54E−02 5 1
42 AMIGO2 Q86SJ2 OID01365 −211.54 88.56 −2.39 2.03E−02 5 1
43 IL-18R1 Q13478 OID00517 −5805.20 2504.28 −2.32 2.41E−02 1 1
44 TGM2 P21980 OID00462 −5031.06 2196.58 −2.29 2.58E−02 2 1
45 CD38 P28907 OID00308 −398.30 174.15 −2.29 2.60E−02 4 1
46 PRKRA O75569 OID01068 −22.34 9.90 −2.26 2.81E−02 4 1
47 STXBP3 O00186 OID01106 −7.12 3.16 −2.25 2.82E−02 4 1
48 ADAM 22 Q9P0K1 OID00317 213.73 95.70 2.23 2.95E−02 2 1
49 KLRD1 Q13241 OID00995 −3313.70 1484.47 −2.23 2.97E−02 5 1
50 IL-12B P29460 OID00523 −1754.96 787.98 −2.23 3.00E−02 5 1
51 ARHGEF12 Q9NZN5 OID01390 −423.42 190.31 −2.22 3.01E−02 4 1
52 XCL1 P47992 OID00433 −658.44 296.56 −2.22 3.05E−02 5 1
53 PEBP1 P30086 OID01483 −81.20 36.65 −2.22 3.09E−02 4 1
54 HTRA2 O43464 OID01402 −25.59 11.55 −2.22 3.09E−02 5 1
55 RASSF2 P50749 OID01094 −10.01 4.53 −2.21 3.11E−02 4 1
56 CA1 P00915 OID01223 −1867.31 851.31 −2.19 3.24E−02 4 1
57 ZBTB16 Q05516 OID01350 −197.63 90.26 −2.19 3.27E−02 5 1
58 PLXNB2 O15031 OID01218 −20.61 9.45 −2.18 3.34E−02 2 1
59 STX6 O43752 OID01318 −142.48 66.16 −2.15 3.56E−02 5 1
60 GFR-alpha-1 P56159 OID00333 −2865.28 1331.29 −2.15 3.57E−02 3 1
61 IL17F Q96PD4 OID05407 18.96 8.89 2.13 3.75E−02 5 1
62 TIMP1 P01033 OID01224 −126.70 60.11 −2.11 3.95E−02 2 1
63 SPINK1 P00995 OID01415 221.54 106.85 2.07 4.28E−02 5 1
64 TNFSF14 O43557 OID00506 −166.30 80.26 −2.07 4.29E−02 4 1
65 ENO2 P09104 OID01138 −154.61 75.17 −2.06 4.45E−02 4 1
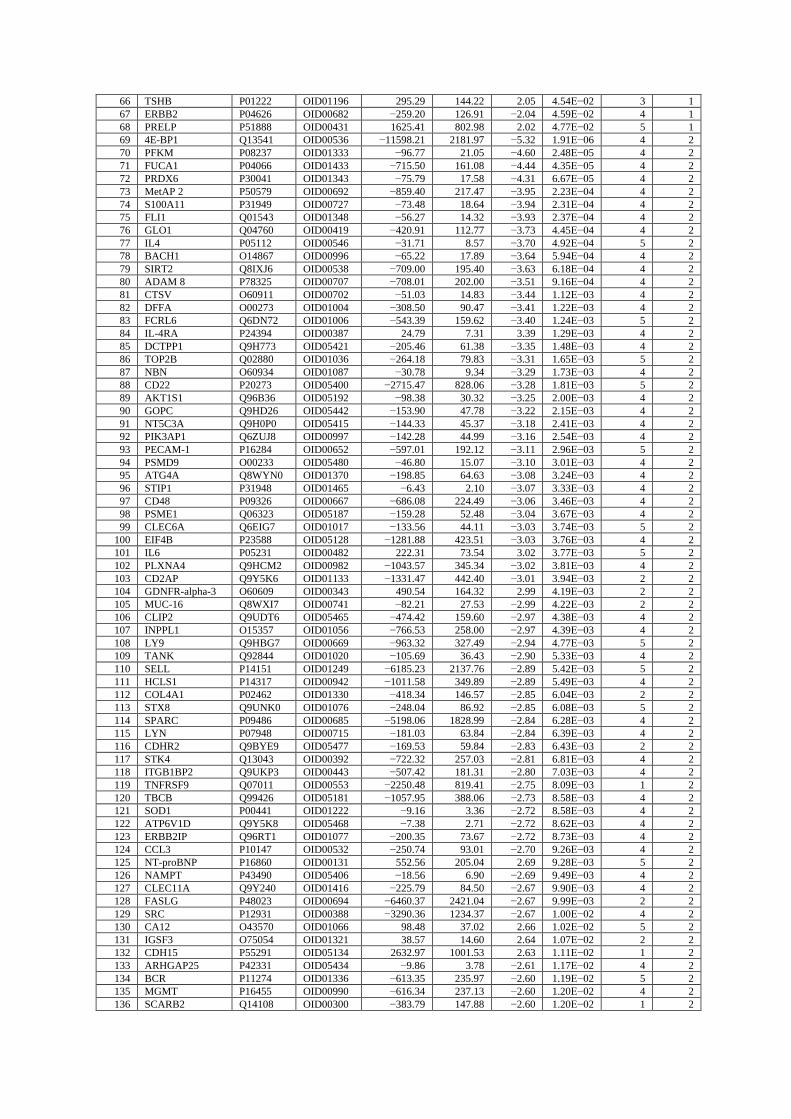
66 TSHB P01222 OID01196 295.29 144.22 2.05 4.54E−02 3 1
67 ERBB2 P04626 OID00682 −259.20 126.91 −2.04 4.59E−02 4 1
68 PRELP P51888 OID00431 1625.41 802.98 2.02 4.77E−02 5 1
69 4E-BP1 Q13541 OID00536 −11598.21 2181.97 −5.32 1.91E−06 4 2
70 PFKM P08237 OID01333 −96.77 21.05 −4.60 2.48E−05 4 2
71 FUCA1 P04066 OID01433 −715.50 161.08 −4.44 4.35E−05 4 2
72 PRDX6 P30041 OID01343 −75.79 17.58 −4.31 6.67E−05 4 2
73 MetAP 2 P50579 OID00692 −859.40 217.47 −3.95 2.23E−04 4 2
74 S100A11 P31949 OID00727 −73.48 18.64 −3.94 2.31E−04 4 2
75 FLI1 Q01543 OID01348 −56.27 14.32 −3.93 2.37E−04 4 2
76 GLO1 Q04760 OID00419 −420.91 112.77 −3.73 4.45E−04 4 2
77 IL4 P05112 OID00546 −31.71 8.57 −3.70 4.92E−04 5 2
78 BACH1 O14867 OID00996 −65.22 17.89 −3.64 5.94E−04 4 2
79 SIRT2 Q8IXJ6 OID00538 −709.00 195.40 −3.63 6.18E−04 4 2
80 ADAM 8 P78325 OID00707 −708.01 202.00 −3.51 9.16E−04 4 2
81 CTSV O60911 OID00702 −51.03 14.83 −3.44 1.12E−03 4 2
82 DFFA O00273 OID01004 −308.50 90.47 −3.41 1.22E−03 4 2
83 FCRL6 Q6DN72 OID01006 −543.39 159.62 −3.40 1.24E−03 5 2
84 IL-4RA P24394 OID00387 24.79 7.31 3.39 1.29E−03 4 2
85 DCTPP1 Q9H773 OID05421 −205.46 61.38 −3.35 1.48E−03 4 2
86 TOP2B Q02880 OID01036 −264.18 79.83 −3.31 1.65E−03 5 2
87 NBN O60934 OID01087 −30.78 9.34 −3.29 1.73E−03 4 2
88 CD22 P20273 OID05400 −2715.47 828.06 −3.28 1.81E−03 5 2
89 AKT1S1 Q96B36 OID05192 −98.38 30.32 −3.25 2.00E−03 4 2
90 GOPC Q9HD26 OID05442 −153.90 47.78 −3.22 2.15E−03 4 2
91 NT5C3A Q9H0P0 OID05415 −144.33 45.37 −3.18 2.41E−03 4 2
92 PIK3AP1 Q6ZUJ8 OID00997 −142.28 44.99 −3.16 2.54E−03 4 2
93 PECAM-1 P16284 OID00652 −597.01 192.12 −3.11 2.96E−03 5 2
94 PSMD9 O00233 OID05480 −46.80 15.07 −3.10 3.01E−03 4 2
95 ATG4A Q8WYN0 OID01370 −198.85 64.63 −3.08 3.24E−03 4 2
96 STIP1 P31948 OID01465 −6.43 2.10 −3.07 3.33E−03 4 2
97 CD48 P09326 OID00667 −686.08 224.49 −3.06 3.46E−03 4 2
98 PSME1 Q06323 OID05187 −159.28 52.48 −3.04 3.67E−03 4 2
99 CLEC6A Q6EIG7 OID01017 −133.56 44.11 −3.03 3.74E−03 5 2
100 EIF4B P23588 OID05128 −1281.88 423.51 −3.03 3.76E−03 4 2
101 IL6 P05231 OID00482 222.31 73.54 3.02 3.77E−03 5 2
102 PLXNA4 Q9HCM2 OID00982 −1043.57 345.34 −3.02 3.81E−03 4 2
103 CD2AP Q9Y5K6 OID01133 −1331.47 442.40 −3.01 3.94E−03 2 2
104 GDNFR-alpha-3 O60609 OID00343 490.54 164.32 2.99 4.19E−03 2 2
105 MUC-16 Q8WXI7 OID00741 −82.21 27.53 −2.99 4.22E−03 2 2
106 CLIP2 Q9UDT6 OID05465 −474.42 159.60 −2.97 4.38E−03 4 2
107 INPPL1 O15357 OID01056 −766.53 258.00 −2.97 4.39E−03 4 2
108 LY9 Q9HBG7 OID00669 −963.32 327.49 −2.94 4.77E−03 5 2
109 TANK Q92844 OID01020 −105.69 36.43 −2.90 5.33E−03 4 2
110 SELL P14151 OID01249 −6185.23 2137.76 −2.89 5.42E−03 5 2
111 HCLS1 P14317 OID00942 −1011.58 349.89 −2.89 5.49E−03 4 2
112 COL4A1 P02462 OID01330 −418.34 146.57 −2.85 6.04E−03 2 2
113 STX8 Q9UNK0 OID01076 −248.04 86.92 −2.85 6.08E−03 5 2
114 SPARC P09486 OID00685 −5198.06 1828.99 −2.84 6.28E−03 4 2
115 LYN P07948 OID00715 −181.03 63.84 −2.84 6.39E−03 4 2
116 CDHR2 Q9BYE9 OID05477 −169.53 59.84 −2.83 6.43E−03 2 2
117 STK4 Q13043 OID00392 −722.32 257.03 −2.81 6.81E−03 4 2
118 ITGB1BP2 Q9UKP3 OID00443 −507.42 181.31 −2.80 7.03E−03 4 2
119 TNFRSF9 Q07011 OID00553 −2250.48 819.41 −2.75 8.09E−03 1 2
120 TBCB Q99426 OID05181 −1057.95 388.06 −2.73 8.58E−03 4 2
121 SOD1 P00441 OID01222 −9.16 3.36 −2.72 8.58E−03 4 2
122 ATP6V1D Q9Y5K8 OID05468 −7.38 2.71 −2.72 8.62E−03 4 2
123 ERBB2IP Q96RT1 OID01077 −200.35 73.67 −2.72 8.73E−03 4 2
124 CCL3 P10147 OID00532 −250.74 93.01 −2.70 9.26E−03 4 2
125 NT-proBNP P16860 OID00131 552.56 205.04 2.69 9.28E−03 5 2
126 NAMPT P43490 OID05406 −18.56 6.90 −2.69 9.49E−03 4 2
127 CLEC11A Q9Y240 OID01416 −225.79 84.50 −2.67 9.90E−03 4 2
128 FASLG P48023 OID00694 −6460.37 2421.04 −2.67 9.99E−03 2 2
129 SRC P12931 OID00388 −3290.36 1234.37 −2.67 1.00E−02 4 2
130 CA12 O43570 OID01066 98.48 37.02 2.66 1.02E−02 5 2
131 IGSF3 O75054 OID01321 38.57 14.60 2.64 1.07E−02 2 2
132 CDH15 P55291 OID05134 2632.97 1001.53 2.63 1.11E−02 1 2
133 ARHGAP25 P42331 OID05434 −9.86 3.78 −2.61 1.17E−02 4 2
134 BCR P11274 OID01336 −613.35 235.97 −2.60 1.19E−02 5 2
135 MGMT P16455 OID00990 −616.34 237.13 −2.60 1.20E−02 4 2
136 SCARB2 Q14108 OID00300 −383.79 147.88 −2.60 1.20E−02 1 2

137 RASA1 P20936 OID01078 −11.37 4.47 −2.54 1.38E−02 1 2
138 LAP3 P28838 OID05469 −55.47 21.82 −2.54 1.39E−02 5 2
139 SERPINA9 Q86WD7 OID01100 −332.40 131.35 −2.53 1.43E−02 1 2
140 GLB1 P16278 OID00937 −62.56 24.85 −2.52 1.48E−02 5 2
141 DIABLO Q9NR28 OID01145 −57.36 22.86 −2.51 1.51E−02 2 2
142 SIT1 Q9Y3P8 OID01013 −218.91 87.36 −2.51 1.52E−02 5 2
143 PARK7 Q99497 OID01423 −76.33 30.48 −2.50 1.53E−02 4 2
144 ARG1 P05089 OID01199 −8.13 3.28 −2.48 1.63E−02 4 2
145 TNFRSF10A O00220 OID01309 −193.78 78.27 −2.48 1.64E−02 1 2
146 VIM P08670 OID00717 −193.89 78.99 −2.45 1.73E−02 5 2
147 ADA P00813 OID00560 −367.88 150.02 −2.45 1.73E−02 4 2
148 LRRN1 Q6UXK5 OID01362 −349.64 143.60 −2.43 1.81E−02 4 2
149 FCGR2A P12318 OID01244 −88.23 36.26 −2.43 1.82E−02 2 2
150 TXLNA P40222 OID00655 −789.44 326.63 −2.42 1.90E−02 4 2
151 CDNF Q49AH0 OID01359 −14.35 5.99 −2.40 1.99E−02 4 2
152 IFN-gamma-R1 P15260 OID00670 −788.26 329.05 −2.40 2.00E−02 5 2
153 CGA P01215 OID01450 1173.96 490.87 2.39 2.02E−02 3 2
154 CLEC7A Q9BXN2 OID01016 −285.55 119.68 −2.39 2.05E−02 3 2
155 BCAN Q96GW7 OID00325 −284.37 119.82 −2.37 2.11E−02 4 2
156 EDAR Q9UNE0 OID00946 −128.58 54.30 −2.37 2.14E−02 5 2
157 ITGB2 P05107 OID00565 −331.19 140.01 −2.37 2.15E−02 4 2
158 LCN2 P80188 OID01278 −11.68 4.98 −2.35 2.26E−02 5 2
159 ANGPT2 O15123 OID01132 62.62 26.70 2.34 2.27E−02 4 2
160 YES1 P07947 OID01070 −931.28 403.61 −2.31 2.48E−02 4 2
161 AGR2 O95994 OID01045 150.78 65.58 2.30 2.53E−02 2 2
162 SULT2A1 Q06520 OID01351 −18.63 8.11 −2.30 2.54E−02 4 2
163 IL-15RA Q13261 OID00514 −22.36 9.75 −2.29 2.56E−02 4 2
164 LAT O43561 OID00371 −3219.46 1409.19 −2.28 2.61E−02 4 2
165 AXIN1 O15169 OID00487 −838.55 367.37 −2.28 2.63E−02 5 2
166 PRTFDC1 Q9NRG1 OID05176 −307.40 134.72 −2.28 2.64E−02 4 2
167 SOD2 P04179 OID00413 −1714.09 754.07 −2.27 2.69E−02 4 2
168 HSP 27 P04792 OID00465 −9795.90 4321.72 −2.27 2.73E−02 2 2
169 SHPS-1 P78324 OID00628 −185.83 82.50 −2.25 2.82E−02 5 2
170 IFN-gamma P01579 OID05547 −4495.03 1997.02 −2.25 2.83E−02 1 2
171 BAG6 P46379 OID01197 −88.40 39.26 −2.25 2.84E−02 2 2
172 ICAM1 P05362 OID01230 −1145.19 516.30 −2.22 3.06E−02 5 2
173 CDC27 P30260 OID05450 −17.35 7.86 −2.21 3.14E−02 4 2
174 EFNA4 P52798 OID00299 −128.60 58.32 −2.21 3.16E−02 1 2
175 PTPRM P28827 OID05486 −92.78 42.12 −2.20 3.18E−02 4 2
176 PLA2G7 Q13093 OID01283 −51.41 23.41 −2.20 3.23E−02 5 2
177 uPA P00749 OID00481 −23994.82 10934.22 −2.19 3.24E−02 5 2
178 ACTN4 O43707 OID05481 −4.67 2.13 −2.19 3.28E−02 4 2
179 ICAM4 Q14773 OID05479 662.19 302.91 2.19 3.31E−02 1 2
180 SERPINA12 Q8IW75 OID00422 163.28 75.40 2.17 3.46E−02 1 2
181 IRF9 Q00978 OID00945 −38.07 17.59 −2.16 3.48E−02 4 2
182 SIGLEC10 Q96LC7 OID01375 −128.90 59.92 −2.15 3.58E−02 5 2
183 TNFRSF6B O95407 OID00663 −575.10 267.52 −2.15 3.60E−02 1 2
184 PDGF subunit A P04085 OID00648 −292.00 136.89 −2.13 3.73E−02 4 2
185 S100P P25815 OID01131 −6.94 3.27 −2.13 3.80E−02 4 2
186 GFER P55789 OID05423 −85.22 40.15 -2.12 3.83E−02 4 2
187 MCP-4 Q99616 OID00504 −119210.06 56363.51 −2.12 3.89E−02 2 2
188 TGF-alpha P01135 OID00687 −19.70 9.33 −2.11 3.93E−02 4 2
189 EPHA10 Q5JZY3 OID05184 42.37 20.14 2.10 3.99E−02 3 2
190 BLVRB P30043 OID01424 −3.89 1.85 −2.10 4.00E−02 4 2
191 TNF P01375 OID05548 −236.16 113.35 −2.08 4.18E−02 3 2
192 LRP1 Q07954 OID01030 −58.10 27.92 −2.08 4.21E−02 3 2
193 EREG O14944 OID05151 −11.53 5.55 −2.08 4.23E−02 4 2
194 GZMA P12544 OID00339 −828.14 399.53 −2.07 4.28E−02 4 2
195 FAS P25445 OID00615 −737.72 356.25 −2.07 4.30E−02 1 2
196 SERPINB8 P50452 OID01141 27.83 13.46 2.07 4.34E−02 3 2
197 AFP P02771 OID05441 −519.35 251.78 −2.06 4.39E−02 2 2
198 QDPR P09417 OID01162 −216.87 106.32 −2.04 4.62E−02 4 2
199 CASP-3 P42574 OID00630 −1149.27 563.97 −2.04 4.63E−02 4 2
200 SIRT5 Q9NXA8 OID01057 −17.71 8.72 −2.03 4.71E−02 1 2
201 CCL15 Q16663 OID00629 7062.59 3478.32 2.03 4.71E−02 5 2
202 CR2 P20023 OID01258 −514.36 253.39 −2.03 4.71E−02 4 2
203 RPS6KB1 P23443 OID05150 −25.58 12.61 −2.03 4.74E−02 5 2
204 STX16 O14662 OID01312 −132.31 65.50 −2.02 4.82E−02 5 2
205 CNTNAP2 Q9UHC6 OID00943 −70.77 35.07 −2.02 4.85E−02 5 2
206 PSG1 P11464 OID05186 405.67 201.40 2.01 4.89E−02 1 2
207 ITGB6 P18564 OID01026 −47.53 23.66 −2.01 4.94E−02 4 2

208 RP2 O75695 OID05424 −37.22 9.43 −3.95 2.27E−04 4 3
209 PLXNB3 Q9ULL4 OID00306 −820.06 248.82 −3.30 1.71E−03 5 3
210 GZMH P20718 OID00686 −327.16 105.91 −3.09 3.15E−03 4 3
211 GZMB P10144 OID00743 −138.88 47.44 −2.93 4.96E−03 4 3
212 GP6 Q9HCN6 OID05026 −48.42 16.63 −2.91 5.16E−03 4 3
213 NCF2 P19878 OID01102 −289.86 101.16 −2.87 5.89E−03 4 3
214 CD27 P26842 OID00703 2047.49 717.40 2.85 6.07E−03 2 3
215 GDF−8 O14793 OID00328 678.66 239.45 2.83 6.38E−03 1 3
216 STAMBP O95630 OID00558 −939.72 334.46 −2.81 6.82E−03 4 3
217 BOC Q9BWV1 OID00386 178.84 65.37 2.74 8.32E−03 1 3
218 FUS P35637 OID05453 −32.12 11.78 −2.73 8.56E−03 4 3
219 WWP2 O00308 OID05219 −371.85 137.86 −2.70 9.26E−03 5 3
220 NID1 P14543 OID01250 −98.78 37.32 −2.65 1.05E−02 2 3
221 TCL1A P56279 OID00720 −2429.00 932.64 −2.60 1.18E−02 1 3
222 TIMD4 Q96H15 OID01298 388.60 154.40 2.52 1.47E−02 3 3
223 ADM P35318 OID00381 724.70 288.01 2.52 1.48E−02 4 3
224 ARTN Q5T4W7 OID00526 −14.89 6.03 −2.47 1.66E−02 4 3
225 AZU1 P20160 OID00597 −53.47 23.04 −2.32 2.40E−02 4 3
226 CEACAM3 P40198 OID05164 −4.28 1.86 −2.30 2.54E−02 1 3
227 CXCL1 P09341 OID00496 −16001.80 7008.09 −2.28 2.62E−02 5 3
228 PMVK Q15126 OID05218 −513.51 226.06 −2.27 2.70E−02 4 3
229 HLA-E P13747 OID05493 −64.22 28.42 −2.26 2.78E−02 3 3
230 RGMB Q6NW40 OID00314 469.92 213.61 2.20 3.20E−02 2 3
231 ACE2 Q9BYF1 OID00457 −150.59 69.67 −2.16 3.50E−02 2 3
232 PVALB P20472 OID01113 −6024.34 2787.74 −2.16 3.51E−02 5 3
233 MAX P61244 OID01088 −17.18 7.95 −2.16 3.51E−02 4 3
234 ITGA6 P23229 OID00959 −21.03 9.75 −2.16 3.53E−02 4 3
235 IL-24 Q13007 OID00524 −42.17 19.57 −2.15 3.55E−02 4 3
236 CD69 Q07108 OID01467 −318.16 148.13 −2.15 3.61E−02 5 3
237 EDIL3 O43854 OID01064 24.88 11.73 2.12 3.85E−02 5 3
238 KIRREL2 Q6UWL6 OID05188 43.45 20.65 2.10 4.00E−02 1 3
239 IDUA P35475 OID00393 −945.16 453.28 −2.09 4.16E−02 5 3
240 SPINK4 O60575 OID05475 18.19 8.80 2.07 4.34E−02 2 3
241 KLK6 Q92876 OID00647 −106.12 52.04 −2.04 4.61E−02 1 3
242 KIF1BP Q96EK5 OID05213 −124.31 60.96 −2.04 4.63E−02 4 3
243 CA2 P00918 OID01477 −332.85 165.51 −2.01 4.92E−02 4 3
244 TRIM21 P19474 OID00964 −197.17 46.23 −4.27 7.92E−05 4 4
245 LYAR Q9NX58 OID01388 −17.61 4.20 −4.20 9.74E−05 1 4
246 CD5 P06127 OID00531 −342.74 84.56 −4.05 1.58E−04 4 4
247 FHIT P49789 OID05157 −21.40 5.35 −4.00 1.91E−04 4 4
248 CST6 Q15828 OID01437 284.65 75.30 3.78 3.88E−04 5 4
249 FOXO3 O43524 OID05455 −41.97 11.34 −3.70 4.96E−04 4 4
250 CSNK1D P48730 OID01035 −9.48 2.61 −3.63 6.29E−04 4 4
251 Alpha-2-MRAP P30533 OID00311 −4557.75 1338.60 −3.40 1.23E−03 4 4
252 LAIR-2 Q6ISS4 OID00373 3150.52 934.84 3.37 1.37E−03 5 4
253 SH2B3 Q9UQQ2 OID00983 −866.13 257.64 −3.36 1.41E−03 4 4
254 ANXA1 P04083 OID00745 −182.34 55.25 −3.30 1.70E−03 4 4
255 ARHGAP1 Q07960 OID01352 −83.74 26.04 −3.22 2.16E−03 4 4
256 ESM-1 Q9NQ30 OID00729 −7163.81 2238.94 −3.20 2.29E−03 4 4
257 TIGAR Q9NQ88 OID01041 −20.36 6.41 −3.17 2.46E−03 4 4
258 FOXO1 Q12778 OID01065 −129.11 41.56 −3.11 2.99E−03 4 4
259 HBQ1 P09105 OID05471 −69.61 22.52 −3.09 3.13E−03 4 4
260 UBAC1 Q9BSL1 OID05484 −71.77 23.35 −3.07 3.29E−03 4 4
261 MANF P55145 OID00374 −6285.32 2056.51 −3.06 3.43E−03 4 4
262 LAT2 Q9GZY6 OID01074 −469.51 155.25 −3.02 3.78E−03 4 4
263 VCAM1 P19320 OID01257 −541.27 179.13 −3.02 3.78E−03 5 4
264 HS6ST1 O60243 OID01320 −427.57 143.00 −2.99 4.14E−03 5 4
265 HEXIM1 O94992 OID00987 −707.22 236.61 −2.99 4.18E−03 4 4
266 CCL16 O15467 OID00654 1040.85 355.84 2.93 4.96E−03 2 4
267 FAM3C Q92520 OID01175 −1550.63 535.10 −2.90 5.39E−03 1 4
268 IRAK4 Q9NWZ3 OID00940 −320.41 110.64 −2.90 5.41E−03 4 4
269 CD200R1 Q8TD46 OID00376 −535.82 186.00 −2.88 5.61E−03 4 4
270 IL-18BP O95998 OID00640 −1280.22 445.05 −2.88 5.68E−03 1 4
271 BNP P16860 OID00455 193.12 68.42 2.82 6.59E−03 5 4
272 LACTB2 Q53H82 OID05470 −321.42 114.05 −2.82 6.70E−03 4 4
273 IL-17D Q8TAD2 OID00403 −66.35 23.70 −2.80 7.01E−03 2 4
274 RETN Q9HD89 OID00603 −1181.71 427.90 −2.76 7.76E−03 2 4
275 CBL P22681 OID01340 −390.70 141.62 −2.76 7.82E−03 5 4
276 ARSB P15848 OID01337 −39.67 14.42 −2.75 7.99E−03 4 4
277 Beta-NGF P01138 OID00335 −8.88 3.25 −2.73 8.36E−03 4 4
278 TDGF1 P13385 OID05131 8.86 3.27 2.71 8.96E−03 4 4

279 DRAXIN Q8NBI3 OID00341 −357.76 133.51 −2.68 9.66E−03 1 4
280 LILRB2 Q8N423 OID01296 −84.52 31.77 −2.66 1.02E−02 2 4
281 GDNF P39905 OID00475 −93.33 35.43 −2.63 1.09E−02 4 4
282 CCL4 P13236 OID00498 −957.43 365.06 −2.62 1.12E−02 4 4
283 LAIR1 Q6GTX8 OID01488 −178.70 69.57 −2.57 1.30E−02 1 4
284 VEGFR-3 P35916 OID00740 −491.70 193.56 −2.54 1.39E−02 4 4
285 PRKAB1 Q9Y478 OID01046 −28.01 11.12 −2.52 1.47E−02 4 4
286 GALNT7 Q86SF2 OID05487 −440.15 175.33 −2.51 1.50E−02 3 4
287 Dkk-4 Q9UBT3 OID00369 −320.89 129.86 −2.47 1.65E−02 3 4
288 PPP1R9B Q96SB3 OID00936 −309.24 126.28 −2.45 1.75E−02 4 4
289 SORCS2 Q96PQ0 OID01377 −127.53 52.27 −2.44 1.79E−02 1 4
290 FCRLB Q6BAA4 OID00744 −52.49 21.80 −2.41 1.94E−02 4 4
291 IGLC2 P0DOY2 OID01240 −2035.29 848.24 −2.40 1.98E−02 3 4
292 CDKN1A P38936 OID00709 −940.96 392.54 −2.40 2.00E−02 5 4
293 CLEC4C Q8WTT0 OID00949 −375.15 157.71 −2.38 2.09E−02 5 4
294 DCTN1 Q14203 OID00958 −647.15 272.39 −2.38 2.10E−02 4 4
295 ANGPTL4 Q9BY76 OID01413 53.65 22.62 2.37 2.13E−02 2 4
296 TLT-2 Q5T2D2 OID00588 −434.40 183.71 −2.36 2.15E−02 5 4
297 IRAK1 P51617 OID00950 −79.10 33.67 −2.35 2.24E−02 4 4
298 CD160 O95971 OID00721 −386.18 166.44 −2.32 2.41E−02 5 4
299 CLEC1B Q9P126 OID00318 −56118.32 24220.30 −2.32 2.42E−02 5 4
300 ICAM3 P32942 OID01267 −231.25 99.84 −2.32 2.42E−02 5 4
301 NAA10 P41227 OID05168 −173.06 74.73 −2.32 2.43E−02 4 4
302 CTSF Q9UBX1 OID01400 −59.54 25.84 −2.30 2.50E−02 5 4
303 CD63 P08962 OID05222 −970.49 422.72 −2.30 2.55E−02 4 4
304 CARHSP1 Q9Y2V2 OID05198 −12.77 5.66 −2.26 2.81E−02 4 4
305 GCG P01275 OID01329 77.10 34.35 2.24 2.87E−02 4 4
306 HMBS P08397 OID05464 −115.62 51.86 −2.23 2.99E−02 4 4
307 TR P02786 OID00593 −2233.37 1003.01 −2.23 3.00E−02 5 4
308 SMPD1 P17405 OID00309 −772.78 348.71 −2.22 3.08E−02 5 4
309 DCN P07585 OID00444 413.43 186.97 2.21 3.11E−02 3 4
310 TFF3 Q07654 OID00573 −400.86 181.71 −2.21 3.15E−02 1 4
311 AIFM1 O95831 OID01048 −151.53 68.86 −2.20 3.20E−02 5 4
312 THPO P40225 OID00452 169.31 77.42 2.19 3.29E−02 5 4
313 SERPINA7 P05543 OID01232 −588.22 269.46 −2.18 3.32E−02 5 4
314 CRISP2 P16562 OID01338 −1509.54 695.91 −2.17 3.43E−02 2 4
315 WFDC2 Q14508 OID00732 −2478.47 1144.44 −2.17 3.47E−02 3 4
316 EPHB6 O15197 OID00313 −369.82 171.23 −2.16 3.51E−02 1 4
317 SEMA7A O75326 OID01461 −181.26 84.83 −2.14 3.71E−02 5 4
318 CES1 P23141 OID01263 −379.40 179.29 −2.12 3.88E−02 1 4
319 NEMO Q9Y6K9 OID00467 −659.64 312.26 −2.11 3.91E−02 4 4
320 IL-5R-alpha Q01344 OID00354 −398.66 190.11 −2.10 4.05E−02 4 4
321 S100A4 P26447 OID00680 1024.42 489.00 2.09 4.08E−02 1 4
322 IFNGR2 P38484 OID05410 −1188.68 568.10 −2.09 4.10E−02 5 4
323 OMG P23515 OID01341 −171.10 82.01 −2.09 4.15E−02 4 4
324 PDGFC Q9NRA1 OID01044 −109.99 52.72 −2.09 4.16E−02 1 4
325 SKAP1 Q86WV1 OID01366 −679.39 326.04 −2.08 4.18E−02 4 4
326 ZBTB17 Q13105 OID01355 −26.78 12.88 −2.08 4.21E−02 4 4
327 GNLY P22749 OID01262 −14.23 6.88 −2.07 4.32E−02 4 4
328 RGMA Q96B86 OID00305 −14001.19 6783.91 −2.06 4.37E−02 4 4
329 SIGLEC6 O43699 OID01317 −648.50 314.30 −2.06 4.37E−02 4 4
330 CEACAM1 P13688 OID00659 −1390.02 674.66 −2.06 4.41E−02 4 4
331 YTHDF3 Q7Z739 OID05476 −20.37 9.99 −2.04 4.63E−02 4 4
332 EZR P15311 OID00296 −145.94 71.80 −2.03 4.69E−02 4 4
333 WAS P42768 OID01109 −34.20 16.88 −2.03 4.76E−02 2 4
334 TNFRSF4 P43489 OID00722 −188.34 93.06 −2.02 4.78E−02 1 4
335 IFNLR1 Q8IU57 OID01010 −41.78 20.65 −2.02 4.79E−02 1 4
336 METAP1D Q6UB28 OID01360 −559.19 278.56 −2.01 4.95E−02 5 4
Plasma proteins significantly associated with neural network risk scores are shown. β, effect
size; FDR, false discovery rate; SE, standard error.

Supplementary Table 21. Cell-type enrichment analysis of the plasma proteins in each
cluster
Cluster 1 Cluster 2
Tissue-specific
genes Fold change p-value
Tissue-specific
genes Fold change p-value
B cells 10 2.8407 0.0195 6 0.8338 0.8041
Dendritic cells 7 1.0749 0.9769 11 0.8263 0.8041
Endothelial cells 7 0.5681 0.9769 27 1.0720 0.5852
Eosinophils 4 0.5588 0.9769 23 1.5719 0.0489
Erythroblasts 2 0.5980 0.9769 18 2.6331 0.0003
Macrophages 5 0.6360 0.9769 20 1.2445 0.3372
Megakaryocytes 3 0.5063 0.9769 28 2.3116 0.0001
Monocytes 5 0.7222 0.9769 12 0.8479 0.8041
Neutrophils 7 1.2174 0.9769 15 1.2762 0.3372
Natural killer
cells 4 1.1555 0.9769 10 1.4132 0.3372
T cells 3 1.1363 0.9769 5 0.9265 0.8041 Cluster 3 Cluster 4
Tissue-specific
genes Fold change p-value
Tissue-specific
genes Fold change p-value
B cells 1 0.5366 0.9426 13 2.7295 0.0033
Dendritic cells 4 1.1602 0.9426 19 2.1564 0.0033
Endothelial cells 7 1.0731 0.9426 13 0.7799 0.8826
Eosinophils 3 0.7917 0.9426 18 1.8587 0.0183
Erythroblasts 1 0.5648 0.9426 4 0.8841 0.7466
Macrophages 3 0.7208 0.9426 14 1.3162 0.3013
Megakaryocytes 2 0.6375 0.9426 9 1.1226 0.5629
Monocytes 4 1.0913 0.9426 11 1.1744 0.5183
Neutrophils 4 1.3141 0.9426 8 1.0284 0.6417
Natural killer
cells 2 1.0913 0.9426 8 1.7082 0.1940
T cells 0 0.0000 1.0000 7 1.9597 0.1625
Cell types with significant enrichment of the identified plasma proteins (p < 0.05) are
displayed in bold text.

Supplementary Table 22. Plasma proteins in each cluster that are significantly enriched
in corresponding cell types
Cluster 1 Cluster 2 Cluster 4
Index B cells Erythroblasts Megakaryocytes B cells Dendritic
cells Eosinophils
1 CD27 CRADD PARK7 CD69 IRF9 AXIN1
2 IFNLR1 PARK7 ARHGAP1 LY9 GLB1 IRF9
3 FAM3C CCT5 QDPR SIT1 VIM BACH1
4 TNF GLO1 CCT5 ADA NFKBIE CBL
5 CD38 ARHGEF12 GLO1 BACH1 ZBTB17 ICAM3
6 IGLC2 EIF4G1 USO1 LAT2 PLAU TREML2
7 IL4R SOD1 ARHGEF12 HSP90B1 VCAM1 SIRPA
8 SERPINA9 PRKAB1 EIF4G1 TOP2B CDKN1A TNFSF14
9 TCL1A AKT1S1 SOD1 NFKBIE COCH ZBTB17
10 TNFRSF10A ATG4A CASP2 ZBTB17 DAPP1 NFATC1
11 BLVRB MAX NFATC1 ICAM1 ADAM8
12 FOXO3 TXLNA CD22 IL15 CLEC4C
13 HAGH CLIP2 FOXO1 IL15RA LRPAP1
14 HMBS MANF IL6 SEMA7A
15 METAP2 YES1 LAP3 TGFA
16 PSMD9 GOPC NUB1 WWP2
17 UBAC1 EIF4EBP1 TANK ARSB
18 EIF4EBP1 ENO2 ARSB HS6ST1
19 GP6 FOXO1
20 HEXIM1
21 ITGA6
22 LAT
23 NT5C3A
24 PLXNA4
25 PMVK
26 PRTFDC1
27 SH2B3
28 SRC

Supplementary Table 23. Summary of protein–protein interaction network analysis for
plasma proteins enriched in specific cell types
Statistic/cell type B cells Dendritic cells Eosinophils Erythroblasts Megakaryocytes
Number of nodes 22 19 18 18 28
Number of edges 64 50 20 41 58
Average node degree 5.82 5.26 2.22 4.56 4.14
Average local clustering
coefficient 0.646 0.665 0.369 0.678 0.558
Expected number of edges 23 21 6 19 40
Protein–protein interaction
enrichment p-value 1E−12 5.34E−08 5.1E−06 7.82E−06 0.00501

Supplementary Table 24. Transcript abundance of plasma proteins enriched in B cells
Gene symbol B cells Dendritic cells Endothelial cells Eosinophils Erythroblasts Macrophages
SERPINA9 30.0 0.0 0.0 0.0 0.0 0.0
IGLC2 9998.7 1.3 0.0 11.1 0.1 0.0
TCL1A 246.1 0.3 0.0 1.4 0.0 0.0
CD22 422.0 2.1 0.1 4.3 0.1 13.2
CD38 64.5 5.5 0.2 0.5 0.0 4.4
CD27 52.5 0.0 0.0 1.8 0.0 0.0
SIT1 22.6 0.4 0.0 1.7 0.1 2.0
IFNLR1 9.4 1.9 0.0 0.1 0.0 11.6
LY9 47.8 1.9 0.0 2.6 0.3 10.9
IL4R 163.4 84.4 28.9 94.0 8.3 21.4
FAM3C 46.5 15.9 31.8 0.9 7.2 13.6
CD69 297.3 8.5 1.6 45.4 35.4 0.0
ADA 29.8 2.4 13.8 0.6 5.8 11.5
TNF 12.8 11.8 0.0 0.7 0.4 1.7
LAT2 124.1 18.7 0.4 20.2 10.9 39.0
NFATC1 18.0 3.5 8.9 14.8 4.5 3.6
NFKBIE 37.7 26.7 14.2 19.4 2.9 37.6
FOXO1 28.2 39.8 30.6 4.4 6.1 2.7
HSP90B1 415.3 186.1 500.0 56.7 125.5 273.8
ZBTB17 34.0 34.1 13.3 25.5 11.9 15.8
TNFRSF10A 10.4 4.2 9.4 8.4 3.3 11.5
BACH1 64.4 25.4 10.3 83.0 38.5 38.3
TOP2B 103.4 72.5 62.4 67.6 57.1 34.6
Gene symbol Megakaryocytes Monocytes Neutrophils Natural killer
cells T cells
SERPINA9 0.0 0.0 0.0 0.0 0.0
IGLC2 0.0 0.7 27.5 0.4 5.8
TCL1A 0.0 0.3 0.5 0.4 0.0
CD22 0.4 0.7 0.3 0.2 0.1
CD38 0.0 2.8 7.1 24.9 3.9
CD27 0.0 0.1 0.3 0.4 60.8
SIT1 0.0 0.1 0.2 0.1 29.2
IFNLR1 0.0 0.0 0.0 0.1 0.4
LY9 0.1 0.8 0.1 24.5 43.4
IL4R 15.4 26.2 87.1 10.7 45.7
FAM3C 23.3 4.4 1.4 17.7 4.8
CD69 261.3 21.7 4.9 117.3 367.5
ADA 8.6 3.6 2.3 25.1 13.9
TNF 6.7 7.1 3.7 1.1 4.7
LAT2 69.4 115.4 64.5 76.3 1.6
NFATC1 10.9 2.7 1.9 5.9 8.0
NFKBIE 5.3 22.6 4.6 4.2 4.0
FOXO1 7.9 8.2 7.0 4.2 24.9
HSP90B1 370.2 124.6 118.3 165.7 120.8
ZBTB17 12.1 8.7 17.7 13.5 15.5
TNFRSF10A 2.4 3.3 4.7 0.7 13.8
BACH1 40.2 86.2 82.0 11.0 13.9
TOP2B 143.6 38.0 69.4 81.6 71.2
Transcript abundance is indicated as the FPKM values obtained from the RNA sequencing data.
FPKM, fragments per kilobase per million mapped fragments.

References
1. Jun, G. et al. Meta-analysis confirms CR1, CLU, and PICALM as Alzheimer disease
risk loci and reveals interactions with APOE genotypes. Arch. Neurol. (2010)
doi:10.1001/archneurol.2010.201.
2. Naj, A. C. et al. Common variants at MS4A4/MS4A6E, CD2AP, CD33 and EPHA1
are associated with late-onset Alzheimer’s disease. Nat. Genet. (2011)
doi:10.1038/ng.801.
3. Lee, J. H., Cheng, R., Graff-Radford, N., Foroud, T. & Mayeux, R. Analyses of the
national institute on aging late-onset Alzheimer’s disease family study: Implication of
additional loci. Arch. Neurol. (2008) doi:10.1001/archneur.65.11.1518.
4. Das, S. et al. Next-generation genotype imputation service and methods. Nat. Genet.
48, 1284–1287 (2016).
5. Taliun, D. et al. Sequencing of 53,831 diverse genomes from the NHLBI TOPMed
Program. Nature 590, 290–299 (2021).
6. Loh, P. R., Palamara, P. F. & Price, A. L. Fast and accurate long-range phasing in a
UK Biobank cohort. Nat. Genet. 48, 811–816 (2016).
7. Bellenguez, C. et al. Large meta-analysis of genome-wide association studies expands
knowledge of the genetic etiology of Alzheimer’s disease and highlights potential
translational opportunities. medRxiv 2020.10.01.20200659 (2020)
doi:10.1101/2020.10.01.20200659.
8. Schwartzentruber, J. et al. Genome-wide meta-analysis, fine-mapping, and integrative
prioritization identify new Alzheimer’s disease risk genes. medRxiv
2020.01.22.20018424 (2020) doi:10.1101/2020.01.22.20018424.
9. Wightman, D. P. et al. Largest GWAS (N=1,126,563) of Alzheimer’s Disease
Implicates Microglia and Immune Cells. medRxiv 2020.11.20.20235275 (2020)
doi:10.1101/2020.11.20.20235275.
10. Jansen, I. E. et al. Genome-wide meta-analysis identifies new loci and functional
pathways influencing Alzheimer’s disease risk. Nat. Genet. 51, 404–413 (2019).
11. Kunkle, B. W. et al. Genetic meta-analysis of diagnosed Alzheimer’s disease identifies
new risk loci and implicates Aβ, tau, immunity and lipid processing. Nat. Genet. 51,
414–430 (2019).
12. Marioni, R. E. et al. GWAS on family history of Alzheimer’s disease. Transl.
Psychiatry 8, 99 (2018).
13. Kunkle, B. W. et al. Novel Alzheimer Disease Risk Loci and Pathways in African
American Individuals Using the African Genome Resources Panel: A Meta-analysis.
JAMA Neurol. 78, 102–113 (2021).
14. Jia, L. et al. Prediction of Alzheimer’s disease using multi-variants from a Chinese
genome-wide association study. Brain 8, 99 (2020).
15. Jun, G. R. et al. Transethnic genome-wide scan identifies novel Alzheimer’s disease
loci. Alzheimer’s Dement. 13, 727–738 (2017).