deep proteome mapping of mouse kidney based on offgel prefractionation reveals remarkable protein...
TRANSCRIPT
Deep Proteome Mapping of Mouse Kidney Based on OFFGelPrefractionation Reveals Remarkable Protein Post- TranslationalModificationsSameh Magdeldin,*,†,‡ Keiko Yamamoto,† Yutaka Yoshida,† Bo Xu,† Ying Zhang,† Hidehiko Fujinaka,†
Eishin Yaoita,† John R. Yates, III,§ and Tadashi Yamamoto†
†Department of Structural Pathology, Institute of Nephrology, Graduate School of Medical and Dental Sciences, Niigata University,Niigata, Japan‡Department of Physiology, Faculty of Veterinary Medicine, Suez Canal University, Ismailia 41522, Egypt§Department of Chemical Physiology, The Scripps Research Institute, La Jolla, California 92037, United States
*S Supporting Information
ABSTRACT: Performing a comprehensive nonbiased proteome analysis is anextraordinary challenge due to sample complexity and wide dynamic range,especially in eukaryotic tissues. Thus, prefractionation steps conducted prior tomass spectrometric analysis are critically important to reduce complexbiological matrices and allow in-depth analysis. Here we demonstrated the useof OFFGel prefractionation to identify more low abundant and hydrophobicproteins than in a nonfractionated sample. Moreover, OFFGel prefractionationof a kidney protein sample was able to unveil protein functional relevance bydetecting PTMs, especially when prefractionation was augmented with atargeted enrichment strategy such as TiO2 phospho-enrichment. The OFFGel-TiO2 combination used in this study was comparable to other globalphosphoproteomics approaches (SCX-TiO2, ERLIC-TiO2, or HILIC-TiO2).The detailed mouse kidney proteome with the phosphopeptide enrichmentpresented here serves as a useful platform for a better understanding of howthe renal protein modification machinery works and, ultimately, will contribute to our understanding of pathological processes aswell as normal physiological renal functions.
KEYWORDS: OFFGel, kidney, proteomics, fractionation, phospho-enrichment
1. INTRODUCTION
Protein post-translational modifications (PTMs) control theactivity and function of proteins, which in turn regulate a diverseset of biological processes and cell signaling mechanisms.1,2
Modern analytical tools such as mass spectrometry have madethe detection of these chemical modifications possible throughthe accurate measurement of protein mass increases or loss andhave allowed large scale, comprehensive PTM screening in orderto gain deeper insight in the study of cell biology, as well asdisease treatment and prevention.So far, there are more than 300 known protein modifications,3
most notably phosphorylation, glycosylation, ubiquitination,methylation, and acetylation. These modifications covalentlybind in a transient manner to a small fraction of proteins,estimated to be less than 1% of total cellular proteins.3−5
Therefore, detection of the presence of modified peptides in asubstoichiometric ratio requires a high-resolution, sensitive, andaccurate mass spectrometer.3
In many cases, peptide mass measurements are insufficient todetermine the peptide modification. However, when thesemodified peptides are fragmented in a tandem mass
spectrometer, detection of mass increments of representingmodified amino acids is possible.3,6
PTMs participate in diverse cellular processes and signalingpathways in the kidney.7−12 Recent studies showed potentialprotein modification in the slit diaphragm, podocyte activities,ganglioside, and focal adhesion of the foot processes.8−11,13
These findings highlight the pivotal role of modified proteins notonly in glomerular ultrafiltration function but also in the renalhomeostatic regulatory process.In order to obtain a comprehensive view of the mouse kidney
proteome as well as possible modifications that might exist in thesample, the complex protein lysate from mouse kidneys wasprefractionated based on isoelectric focusing using the 3100OFFGel fractionator and subjected to analysis using 3 differentultra-high throughput liquid chromatography tandem massspectrometers (LC−MS/MS). The OFFGel-based proteomedata set generated in this study provides a deep, unbiased, normalkidney proteome analysis, encompassing PTMs (including
Received: November 13, 2013Published: February 5, 2014
Article
pubs.acs.org/jpr
© 2014 American Chemical Society 1636 dx.doi.org/10.1021/pr401122m | J. Proteome Res. 2014, 13, 1636−1646
Open Access on 02/05/2015
phosphopeptides), that is valuable for a better understanding ofprotein-associated renal physiological processes.
2. MATERIAL AND METHODS
2.1. Animals
Male 8-week old C57BL/6J mice were used in this study, whichwas approved by the animal committee at Niigata UniversitySchool of Medicine.
2.2. Preparation of Kidney Protein Lysate
The renal capsule was removed, and the right kidney was quicklyrinsed with cold PBS supplied with protease and phosphataseinhibitor cocktail (Roche, Mannheim, Germany) to removeblood and inhibit protease activity. Protein extracts wereobtained by placing dissected kidney tissues in the proteinOFFGel prefractionation buffer supplied by the manufacturer[containing urea, thiourea, DTT, glycerol, and buffer withampholytes pH (3−10)]. Complete ultra proteoases andphoSTOP (Roche) were added to the buffer. A Precellys 24tissue homogenizer was used for protein extraction by adding 2.8ceramic beads (zirconium oxide) to tubes and homogenizing at6500 rpm at 4 °C for 20 s. (Precellys, Bertin Technologies).
2.3. OFFGel Prefractionation of Kidney Protein Lysate
Isoelectric point-based OFFGel prefractionation for proteinextracts was carried out in 3 technical replicates as specified bythe manufacturer. Briefly, 2 mg of renal protein extracts wereused for OFFGel prefractionation using 3100 OFFGelfractionator (Agilent Technologies, Japan).14 Proteins wereseparated using IPG strips (pH 3−10, 13 cm, AgilentTechnologies, Japan) focused for 20 kV h with a maximumcurrent of 50 μA and maximum voltage set to 4500 V. Sampleswere shifted to hold step at a voltage (500 V), and current of 20μA was sustained for 40 h. During the focusing, oil was added tothe electrodes to prevent evaporation. After successfulfractionation, 12 liquid fractions were recovered, and only thefirst 3 sequential wells were pooled (low protein yield) prior to
in-solution digestion or filter-aided sample preparation(FASP).15
2.4. In-Solution Trypsin Digestion
Recovered fractionated proteins were precipitated with acetoneand assayed using the BCA method (Pierce, Rockford, IL).Acetone-precipitated proteins (∼50 μg) were denatured in 8 Murea, 500 mM Tris-HCl, pH 8.5, with protease and phosphataseinhibitor cocktails (Roche, Mannheim) followed by reductionwith 5mM tris(2-carboxyethyl)phosphine (TCEP) for 30min toconfirm fully reduced protein sample before digestion. Cysteineresidues were alkylated with 10 mM iodoacetamide for 20 min inthe dark. To maintain trypsin activity, samples were diluted to afinal concentration of 2 M urea in 100 mM Tris-HCl, pH 8.5,prior to digestion with trypsin. For endopeptidase digestion,modified trypsin (Promega, Madison, WI) was added at 50:1(protein:protease mass ratio) along with 1 mM CaCl2 andincubated overnight in a thermo-shaker at 600 rpm at 37 °C.Digested peptide solution was acidified using 90% formic acid toa final pH of 3 and enriched using a stage tip.16
2.5. Filter-Aided Sample Preparation (FASP)
Aliquots of fractionated proteins corresponding to 200 μg weresuspended in 8 M urea, 0.5 M Tris-HCl, pH 8.5, 5 mM TCEP,protease and phosphatase inhibitors, incubated for 30 min andspun in Vivacon 500 device (Sartorius Stedim biotech) suppliedwith a hydrosart nitrate filter membrane with a molecular weightcutoff (MWCO) value of 10 KDa (FASP reactor) at 14000g (4°C). Subsequently, the reduced protein sample on the FASPreactor was alkylated by addition of 2.2 μL of 0.5 Miodoacetamide in the dark. After brief centrifugation, theconcentrate was diluted twice with 100 μL of 2 M urea in 0.1M Tris-HCl, pH 8.0, and washed again. The resulting proteinconcentrate on the FASP reactor was subjected to on-membraneendoprotease digestion by addition of Lys-C (protein:proteasemass ratio, 25:1). The device was incubated in a wet chamberovernight. The use of Lys-C prior to trypsin digestioncompensates for the trypsin inefficiency at lysine sites andimproves digestion by eliminating the majority of missed
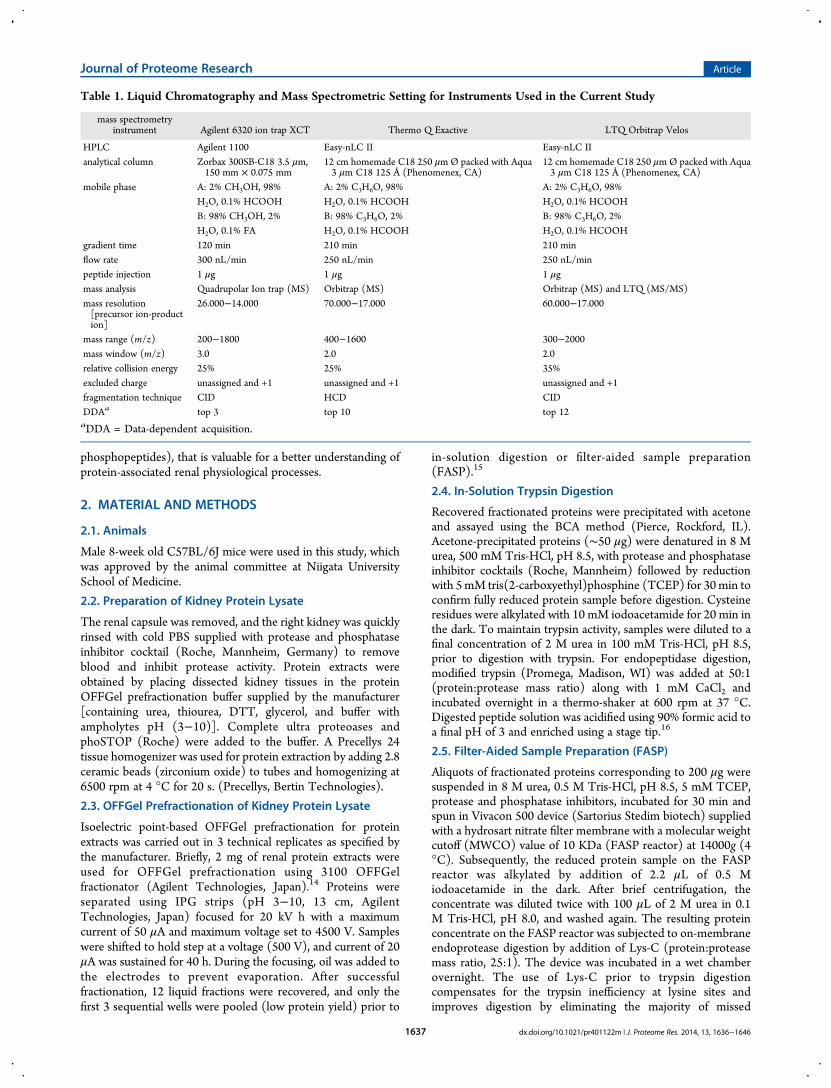
Table 1. Liquid Chromatography and Mass Spectrometric Setting for Instruments Used in the Current Study
mass spectrometryinstrument Agilent 6320 ion trap XCT Thermo Q Exactive LTQ Orbitrap Velos
HPLC Agilent 1100 Easy-nLC II Easy-nLC IIanalytical column Zorbax 300SB-C18 3.5 μm,
150 mm × 0.075 mm12 cm homemade C18 250 μmØ packed with Aqua3 μm C18 125 Å (Phenomenex, CA)
12 cm homemade C18 250 μmØ packed with Aqua3 μm C18 125 Å (Phenomenex, CA)
mobile phase A: 2% CH3OH, 98% A: 2% C3H6O, 98% A: 2% C3H6O, 98%H2O, 0.1% HCOOH H2O, 0.1% HCOOH H2O, 0.1% HCOOHB: 98% CH3OH, 2% B: 98% C3H6O, 2% B: 98% C3H6O, 2%H2O, 0.1% FA H2O, 0.1% HCOOH H2O, 0.1% HCOOH
gradient time 120 min 210 min 210 minflow rate 300 nL/min 250 nL/min 250 nL/minpeptide injection 1 μg 1 μg 1 μgmass analysis Quadrupolar Ion trap (MS) Orbitrap (MS) Orbitrap (MS) and LTQ (MS/MS)mass resolution[precursor ion-production]
26.000−14.000 70.000−17.000 60.000−17.000
mass range (m/z) 200−1800 400−1600 300−2000mass window (m/z) 3.0 2.0 2.0relative collision energy 25% 25% 35%excluded charge unassigned and +1 unassigned and +1 unassigned and +1fragmentation technique CID HCD CIDDDAa top 3 top 10 top 12aDDA = Data-dependent acquisition.
Journal of Proteome Research Article
dx.doi.org/10.1021/pr401122m | J. Proteome Res. 2014, 13, 1636−16461637
cleavage. Trypsin solution was added at a ratio (75:1,protein:protease mass ratio) with 100 mM CaCl2 and incubatedfor an additional 6 h. Recovery of peptides was achieved bycentrifugation of the reactor in a new collection tube at 14000gfor 30 min followed by washing the reactor with 0.1 M Tris-HCl,pH 8.0. Proteolytic activity was inhibited by acidifying thepeptide mixture to pH 3 using 90% formic acid.15
2.6. Phosphopeptide Enrichment and Cleanup
Peptide fractions purified from the OFFGel- FASP sample wereenriched using titanium dioxide (TiO2) phosphopeptide enrich-ment and Clean-up Kit (Pierce) following the manufacturerprotocol with some modifications.17 Briefly, spin tips wereconditioned with 30 μL of buffer A then B. Peptide fractions wereresuspended in 120 μL of buffer B, applied to the column, andcentrifuged at 1000g for 10 min (repeated twice to ensuremaximum binding). Following phosphopeptide binding, thecolumn was washed with 30 μL of buffer A then buffer B andcentrifuged at 3000g for 5 min. For the elution step, 75 μL ofelution buffers A and B were each used to recover thephosphopeptides at 1000g for 5 min. Eluted fractions wereacidified with ∼70 μL of 2.5% (v/v) TFA to a final pH 3.0.Finally, desalting and cleanup of the recovered phophopeptideswas done using stage tip before MS analysis.18
2.7. Nano-LC−MS/MS analysis
Analysis of purified peptides was performed using 3 differentmass spectrometers (Agilent 6320 ion trap XCT, Thermo Q-Exactive and LTQOrbitrap Velos). Chromatographic separationwas performed using a binary gradient with mobile phase eithermethanol or acetonitrile16 prior to introduction into the massspectrometer where dynamic exclusion settings used were asfollows: repeat count, 1; repeat duration, 30 s; exclusion list size,450; and exclusion duration 60 s. All raw data (Thermo.RAW orAgilent.D) are available in the Peptide Atlas repository at ftp://PASS00311:[email protected]/. Further LC−masssettings can be found in Table (1).
2.8. Data Analysis
Protein and peptide identifications were made using the AgilentSpectrum Mill workbench (for Agilent data, http://spectrummill.edu/, version 03.03.084), or the IntegratedProteomics Pipeline, IP2 (for Thermo data, http://integratedproteomics.com/, version 1.01). Peak lists weregenerated from raw data using Spectrum Mill (Agilent) orRawExtract (version 1.9.9).19 Tandem mass spectra weresearched against updated UniProtKB/TrEMBL (101.614protein sequence) and IPI (119.961 protein sequence) mousedatabase concatenated with reversed sequences. The spectralsearch space included all fully and half tryptic peptide candidateswithin a 50 ppm window, surrounding the peptide candidateprecursor mass. Carbamidomethylation (+57.02146) of cysteinewas considered a static modification, and 4 PTMs were selectedas variable modification: phosphorylation at S, T, and Y(+79.966), acetylation at K (+42.0106), ubiquitination at K(+114.04), or oxidation atM (+15.995). Peptide candidates werefiltered to 0.1% FDR and protein candidates to 1% FDR usingDTASelect19. Chromatographic peak areas and proteinphysicochemical properties were calculated using IP2. Phospho-motifs were analyzed by the De Novo Motif Finder of thePHOSIDAMus musculus database using a minimum score of 15and a minimum proportion of matching sites of 5%.20 GOannotation was illustrated using GOrilla;21 further GO settingscan be found in Supplement 2b of the Supporting Information.
2.9. Two Dimensional Electrophoresis and Immunoblotting
Two dimensional gel electrophoresis was conducted on 7 cmpolyacrylamide gel with settings described earlier, with somemodifications.8,22,23 Briefly, a protein sample was separated on12.5% SDS−PAGE gel, transferred onto a PVDFmembrane, andincubated with 1:2000 diluted monoclonal antiphosphotyrosineantibody P-Tyr-100 (Cell Signaling, Danvers,MA) overnight at 4°C, followed by the mouse IgG secondary antibody (dilution1:1000). Immunoreactive proteins were visualized by anenhanced chemiluminescence detection system (ECL Plus, GEHealthcare, Chalfont, St. Giles, U.K.).2.10. Statistical Analysis
Statistical analysis was performed using the two-sided student ttest. P < 0.05 was considered a statistically significant threshold.Normalized spectral abundance factor, protein, peptideexpression alteration (fold changes), log values, and confidencewere calculated based on spectral peak intensities generated fromthe mass spectrometric analysis after extracting confident proteinspectra with P < 0.01. Graph pad prism 5 and Microsoftspreadsheet formulas were used in statistical evaluation.
3. RESULTS AND DISCUSSIONA major challenge in proteomics is the identification of lowabundant proteins in highly complex samples with a widedynamic range. The ubiquitous presence of tryptic peptidesgenerated from abundant proteins results in oversampling ofthese peptides at the expense of less abundant ones. Here, wehave shown that using OFFGel prefractionation of kidneyproteins simplifies the complexity of protein mixtures, whichimproves the identification of low abundant proteins. OFFGelprefractionation was also compatible with other enrichmentstrategies to detect PTMs within a sample.3.1. OFFGel Prefractionation Provides a Practical Approachfor Reducing Sample Complexity in Tissues
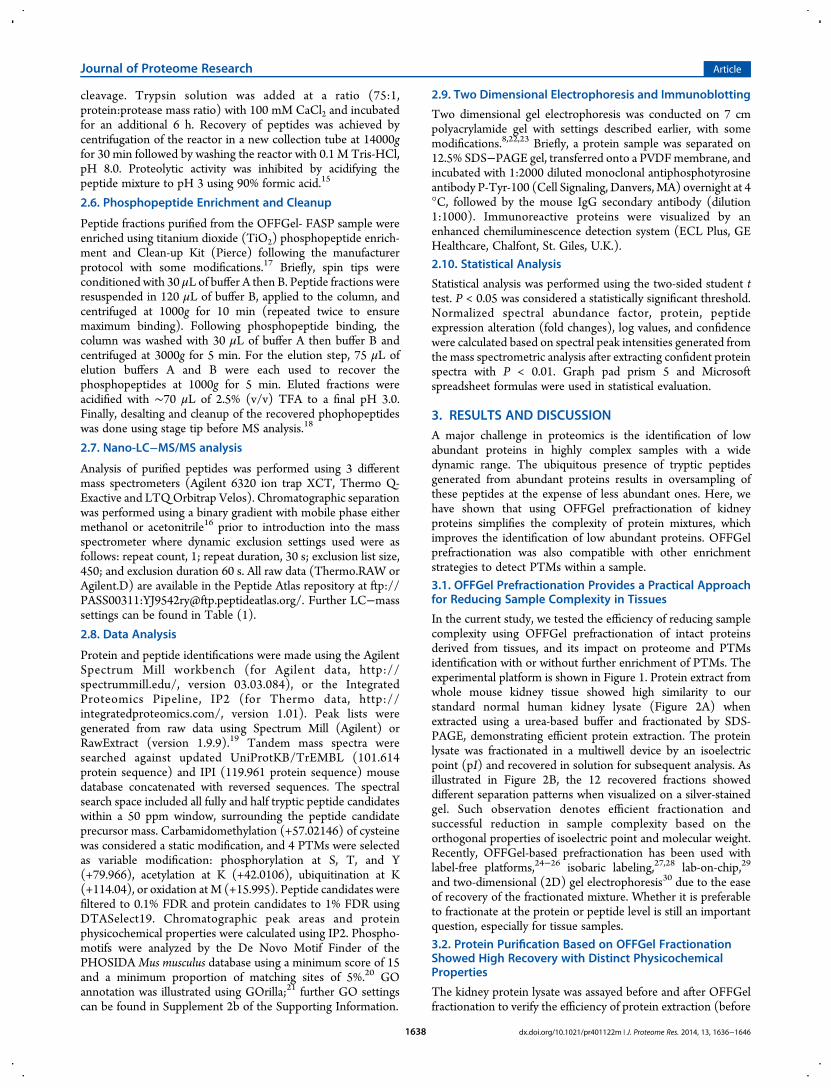
In the current study, we tested the efficiency of reducing samplecomplexity using OFFGel prefractionation of intact proteinsderived from tissues, and its impact on proteome and PTMsidentification with or without further enrichment of PTMs. Theexperimental platform is shown in Figure 1. Protein extract fromwhole mouse kidney tissue showed high similarity to ourstandard normal human kidney lysate (Figure 2A) whenextracted using a urea-based buffer and fractionated by SDS-PAGE, demonstrating efficient protein extraction. The proteinlysate was fractionated in a multiwell device by an isoelectricpoint (pI) and recovered in solution for subsequent analysis. Asillustrated in Figure 2B, the 12 recovered fractions showeddifferent separation patterns when visualized on a silver-stainedgel. Such observation denotes efficient fractionation andsuccessful reduction in sample complexity based on theorthogonal properties of isoelectric point and molecular weight.Recently, OFFGel-based prefractionation has been used withlabel-free platforms,24−26 isobaric labeling,27,28 lab-on-chip,29
and two-dimensional (2D) gel electrophoresis30 due to the easeof recovery of the fractionated mixture. Whether it is preferableto fractionate at the protein or peptide level is still an importantquestion, especially for tissue samples.
3.2. Protein Purification Based on OFFGel FractionationShowed High Recovery with Distinct PhysicochemicalProperties
The kidney protein lysate was assayed before and after OFFGelfractionation to verify the efficiency of protein extraction (before
Journal of Proteome Research Article
dx.doi.org/10.1021/pr401122m | J. Proteome Res. 2014, 13, 1636−16461638
fractionation) and protein clean up and recovery (afterfractionation). Using a modified BCA method, protein recoverywas shown to be approximately 81% of the starting material and atotal of 1.62 mg of protein was retrieved from all fractions, withthe lowest concentration in the first 3 compartments as measuredby a dot blot analysis (Figure 2C). Protein loss can occur duringacetone precipitation,31 which is necessary to remove
ampholytes and other impurities in the fractionated sample.Separating proteins based on the isoelectric point demonstratedthe feasibility of this technique to improve the spatial resolutionof the sample for subsequent mass spectrometry and PTMidentification (Figure 3). Protein migration exhibited a slight
deviation from predicted positions, particularly in the 6−9 pIrange, with more accurate localization at the lower and higher pIvalues. This behavior could be explained by modifications orproteolytic processing of proteins, which alter their predicted pI.Most proteins fall into the pI range on either side of neutrality.An additional explanation is that protein complexes may beinsufficiently denatured, causing the protein members of thecomplex to appear at unexpected pI’s.3.3. OFFGel Prefractionation Enables Construction of theComprehensive Core Mouse Proteome Database
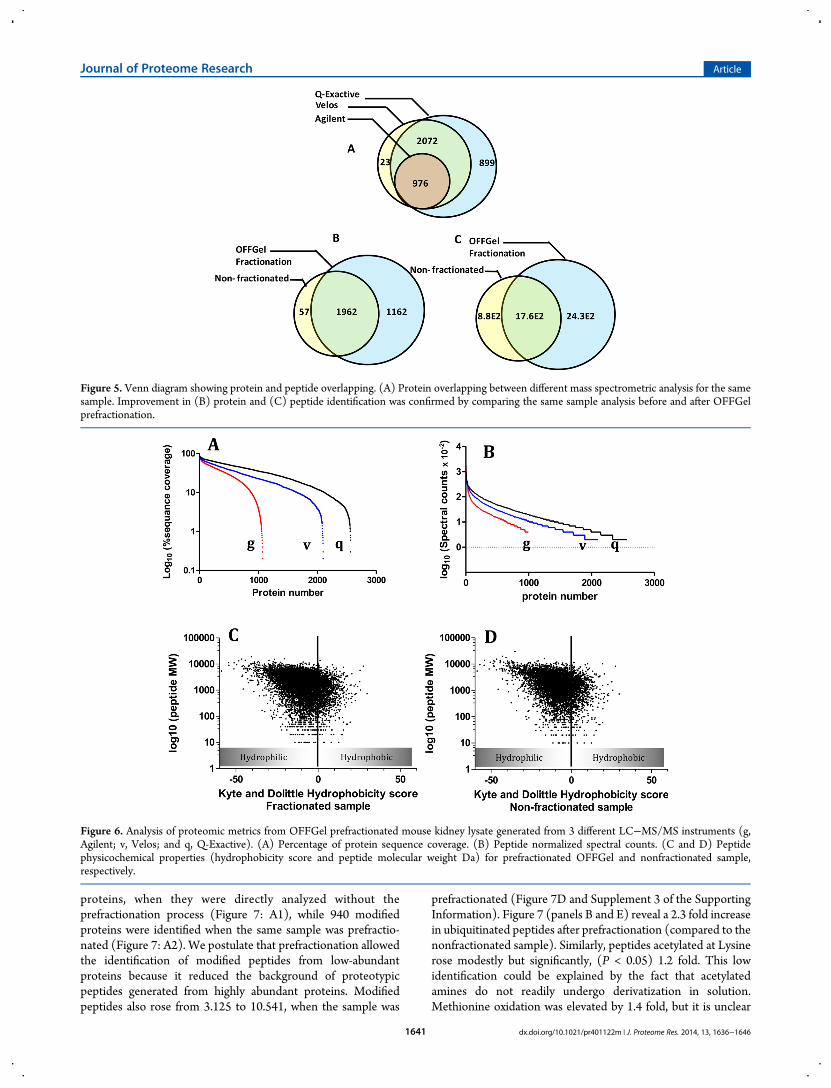
We searched the OFFGel prefractionated sample using differentsoftware platform environments to obtain the maximum numberof confident protein identifications of the mouse kidneyproteome. As shown in Figure 4, searching against IPI orUniprotKB/TrEMBL Mus musculus databases resulted in ahigher number of protein and peptide identifications in fractions4−9 than in peripheral compartments (1−3 and 10−12). Thisfinding was seen with data acquisition using the Q-Exactive andVelos Orbitrap but not the Agilent Q-TOF. HCD fragmentationusing a Q-Exactive mass spectrometer produced a higher numberof confident identifications for both sets of peptides comparedwith CID fragmentation (Figure 4, panels A−D). After mergingreplicates (showed 87% overlapping) and removing redundancy,the final mouse kidney proteome data set contained 3124proteins (FDR < 1%), corresponding to 52 × 103 peptides(Figures 4, panels E and F). The final list of proteins can be foundin Supplement 1 of the Supporting Information. The overlapbetween the proteins identified by three different massspectrometry platforms provides added confidence to theproteome. As illustrated in Figure 5A, all protein hits, but notpeptides, identified by the Agilent Q-TOF were also detected byboth the Q-Exactive and Velos Orbitrap. The Q-Exactive analysisidentified the same proteins as the Velos Orbitrap, except for 23proteins representing 0.6% of the final mouse kidney proteome.The utility of the OFFGel prefractionation technique wasobvious when we analyzed the same sample before and afterfractionation using the same LC−Mass Spec method environ-ment (p1 vs p2). Figure 5 (panels B and C) clearly concludedthat prefractionation improved uncovering of 1105 additional
Figure 1. Experimental workflow for generating comprehensive mousekidney proteome with possible post-translational modification (PTMs).OFFGel prefractionation was used to reduce sample complexity.Fractionated proteins were subjected to either in-solution digestion orFASP before nano LC−MS/MS analysis. Proteomes generated from 4different paths were used for evaluation: P1, proteome analysis ofnonfractionated, nonphospho- enriched sample; P2, fractionated,nonphospho-enriched sample; P3, fractionated, phospho-enrichmentsample, and P4, nonfractionated, phosphoenriched sample.
Figure 2. Protein extraction and prefractionation of mouse kidney. (A)Commassiee blue stained SDS-PAGE of mouse kidney lysate (MK) wascompared to a human standard kidney lysate (HK), precision plusprotein prestained standard was used (BioRad, Japan). (B) Silver-stained SDS-PAGE representing 12 OFFGel fractions. (C) Aftervolume adjustment, 1 μL from each fraction was plotted on the PVDFmembrane and stained with Commassiee blue stained.
Figure 3. Distribution of experimental protein isoelectric point (pI)focusing for each OFFGel fraction, showing an averaged stepwiseincrease in protein pI. First 3 fractions were pooled.
Journal of Proteome Research Article
dx.doi.org/10.1021/pr401122m | J. Proteome Res. 2014, 13, 1636−16461639
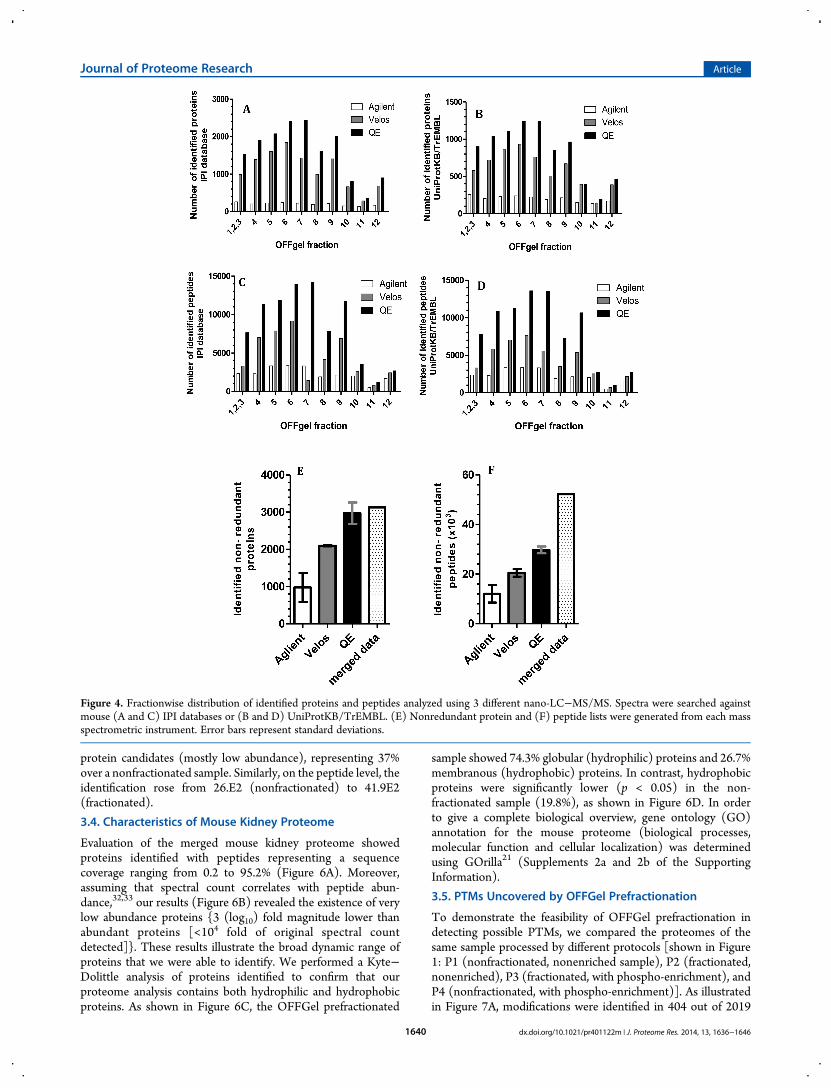
protein candidates (mostly low abundance), representing 37%over a nonfractionated sample. Similarly, on the peptide level, theidentification rose from 26.E2 (nonfractionated) to 41.9E2(fractionated).
3.4. Characteristics of Mouse Kidney Proteome
Evaluation of the merged mouse kidney proteome showedproteins identified with peptides representing a sequencecoverage ranging from 0.2 to 95.2% (Figure 6A). Moreover,assuming that spectral count correlates with peptide abun-dance,32,33 our results (Figure 6B) revealed the existence of verylow abundance proteins {3 (log10) fold magnitude lower thanabundant proteins [<104 fold of original spectral countdetected]}. These results illustrate the broad dynamic range ofproteins that we were able to identify. We performed a Kyte−Dolittle analysis of proteins identified to confirm that ourproteome analysis contains both hydrophilic and hydrophobicproteins. As shown in Figure 6C, the OFFGel prefractionated
sample showed 74.3% globular (hydrophilic) proteins and 26.7%membranous (hydrophobic) proteins. In contrast, hydrophobicproteins were significantly lower (p < 0.05) in the non-fractionated sample (19.8%), as shown in Figure 6D. In orderto give a complete biological overview, gene ontology (GO)annotation for the mouse proteome (biological processes,molecular function and cellular localization) was determinedusing GOrilla21 (Supplements 2a and 2b of the SupportingInformation).
3.5. PTMs Uncovered by OFFGel Prefractionation
To demonstrate the feasibility of OFFGel prefractionation indetecting possible PTMs, we compared the proteomes of thesame sample processed by different protocols [shown in Figure1: P1 (nonfractionated, nonenriched sample), P2 (fractionated,nonenriched), P3 (fractionated, with phospho-enrichment), andP4 (nonfractionated, with phospho-enrichment)]. As illustratedin Figure 7A, modifications were identified in 404 out of 2019
Figure 4. Fractionwise distribution of identified proteins and peptides analyzed using 3 different nano-LC−MS/MS. Spectra were searched againstmouse (A and C) IPI databases or (B and D) UniProtKB/TrEMBL. (E) Nonredundant protein and (F) peptide lists were generated from each massspectrometric instrument. Error bars represent standard deviations.
Journal of Proteome Research Article
dx.doi.org/10.1021/pr401122m | J. Proteome Res. 2014, 13, 1636−16461640
proteins, when they were directly analyzed without theprefractionation process (Figure 7: A1), while 940 modifiedproteins were identified when the same sample was prefractio-nated (Figure 7: A2). We postulate that prefractionation allowedthe identification of modified peptides from low-abundantproteins because it reduced the background of proteotypicpeptides generated from highly abundant proteins. Modifiedpeptides also rose from 3.125 to 10.541, when the sample was
prefractionated (Figure 7D and Supplement 3 of the SupportingInformation). Figure 7 (panels B and E) reveal a 2.3 fold increasein ubiquitinated peptides after prefractionation (compared to thenonfractionated sample). Similarly, peptides acetylated at Lysinerose modestly but significantly, (P < 0.05) 1.2 fold. This lowidentification could be explained by the fact that acetylatedamines do not readily undergo derivatization in solution.Methionine oxidation was elevated by 1.4 fold, but it is unclear
Figure 5. Venn diagram showing protein and peptide overlapping. (A) Protein overlapping between different mass spectrometric analysis for the samesample. Improvement in (B) protein and (C) peptide identification was confirmed by comparing the same sample analysis before and after OFFGelprefractionation.
Figure 6. Analysis of proteomic metrics from OFFGel prefractionated mouse kidney lysate generated from 3 different LC−MS/MS instruments (g,Agilent; v, Velos; and q, Q-Exactive). (A) Percentage of protein sequence coverage. (B) Peptide normalized spectral counts. (C and D) Peptidephysicochemical properties (hydrophobicity score and peptide molecular weight Da) for prefractionated OFFGel and nonfractionated sample,respectively.
Journal of Proteome Research Article
dx.doi.org/10.1021/pr401122m | J. Proteome Res. 2014, 13, 1636−16461641
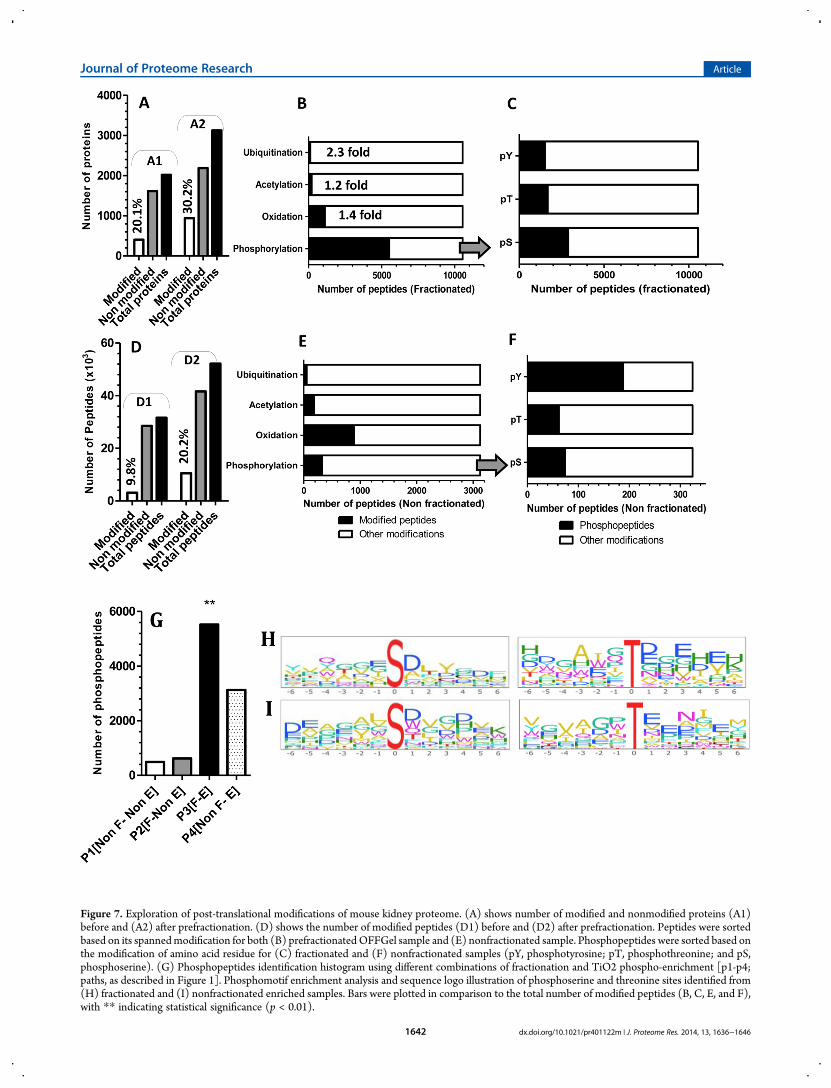
Figure 7. Exploration of post-translational modifications of mouse kidney proteome. (A) shows number of modified and nonmodified proteins (A1)before and (A2) after prefractionation. (D) shows the number of modified peptides (D1) before and (D2) after prefractionation. Peptides were sortedbased on its spannedmodification for both (B) prefractionated OFFGel sample and (E) nonfractionated sample. Phosphopeptides were sorted based onthe modification of amino acid residue for (C) fractionated and (F) nonfractionated samples (pY, phosphotyrosine; pT, phosphothreonine; and pS,phosphoserine). (G) Phosphopeptides identification histogram using different combinations of fractionation and TiO2 phospho-enrichment [p1-p4;paths, as described in Figure 1]. Phosphomotif enrichment analysis and sequence logo illustration of phosphoserine and threonine sites identified from(H) fractionated and (I) nonfractionated enriched samples. Bars were plotted in comparison to the total number of modified peptides (B, C, E, and F),with ** indicating statistical significance (p < 0.01).
Journal of Proteome Research Article
dx.doi.org/10.1021/pr401122m | J. Proteome Res. 2014, 13, 1636−16461642
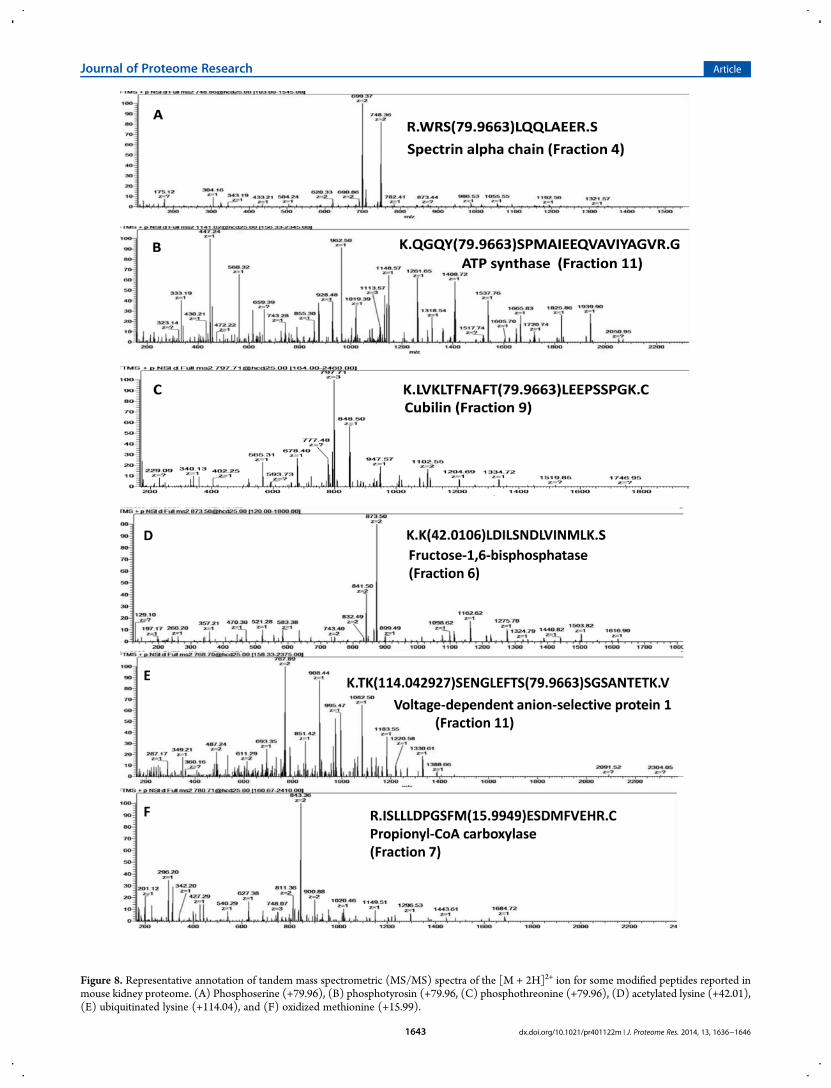
Figure 8. Representative annotation of tandem mass spectrometric (MS/MS) spectra of the [M + 2H]2+ ion for some modified peptides reported inmouse kidney proteome. (A) Phosphoserine (+79.96), (B) phosphotyrosin (+79.96, (C) phosphothreonine (+79.96), (D) acetylated lysine (+42.01),(E) ubiquitinated lysine (+114.04), and (F) oxidized methionine (+15.99).
Journal of Proteome Research Article
dx.doi.org/10.1021/pr401122m | J. Proteome Res. 2014, 13, 1636−16461643
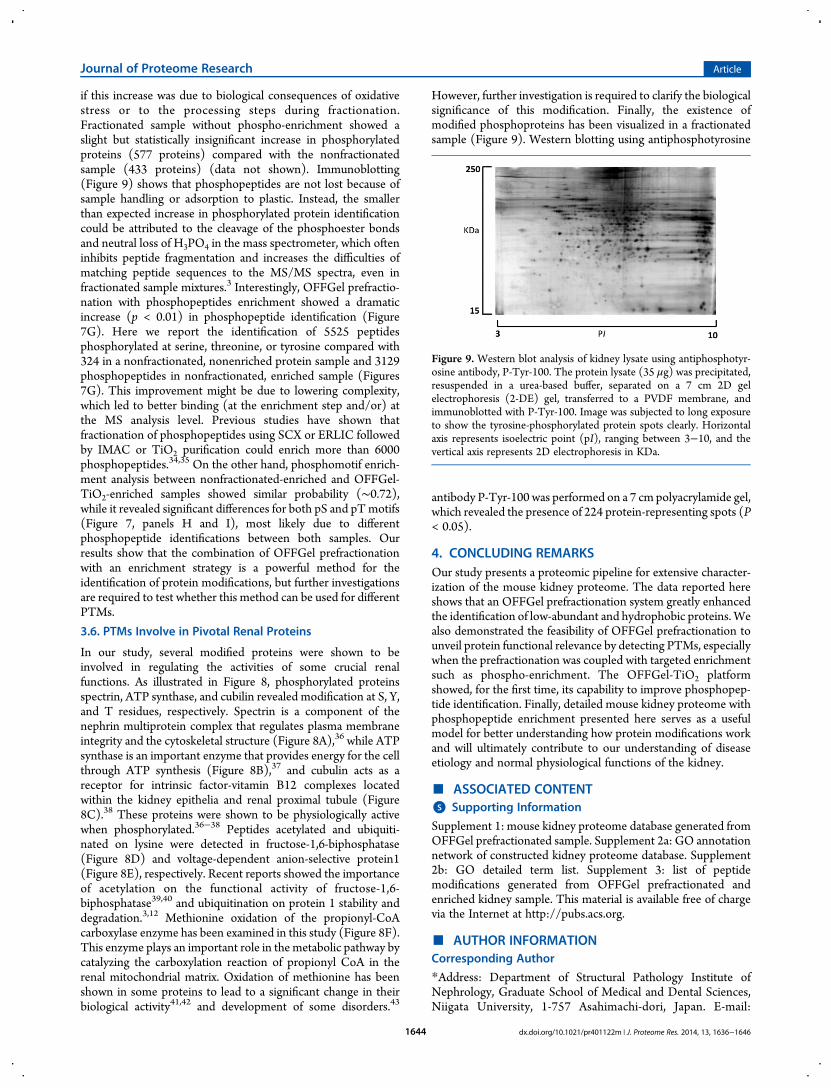
if this increase was due to biological consequences of oxidativestress or to the processing steps during fractionation.Fractionated sample without phospho-enrichment showed aslight but statistically insignificant increase in phosphorylatedproteins (577 proteins) compared with the nonfractionatedsample (433 proteins) (data not shown). Immunoblotting(Figure 9) shows that phosphopeptides are not lost because ofsample handling or adsorption to plastic. Instead, the smallerthan expected increase in phosphorylated protein identificationcould be attributed to the cleavage of the phosphoester bondsand neutral loss of H3PO4 in the mass spectrometer, which ofteninhibits peptide fragmentation and increases the difficulties ofmatching peptide sequences to the MS/MS spectra, even infractionated sample mixtures.3 Interestingly, OFFGel prefractio-nation with phosphopeptides enrichment showed a dramaticincrease (p < 0.01) in phosphopeptide identification (Figure7G). Here we report the identification of 5525 peptidesphosphorylated at serine, threonine, or tyrosine compared with324 in a nonfractionated, nonenriched protein sample and 3129phosphopeptides in nonfractionated, enriched sample (Figures7G). This improvement might be due to lowering complexity,which led to better binding (at the enrichment step and/or) atthe MS analysis level. Previous studies have shown thatfractionation of phosphopeptides using SCX or ERLIC followedby IMAC or TiO2 purification could enrich more than 6000phosphopeptides.34,35 On the other hand, phosphomotif enrich-ment analysis between nonfractionated-enriched and OFFGel-TiO2-enriched samples showed similar probability (∼0.72),while it revealed significant differences for both pS and pTmotifs(Figure 7, panels H and I), most likely due to differentphosphopeptide identifications between both samples. Ourresults show that the combination of OFFGel prefractionationwith an enrichment strategy is a powerful method for theidentification of protein modifications, but further investigationsare required to test whether this method can be used for differentPTMs.
3.6. PTMs Involve in Pivotal Renal Proteins
In our study, several modified proteins were shown to beinvolved in regulating the activities of some crucial renalfunctions. As illustrated in Figure 8, phosphorylated proteinsspectrin, ATP synthase, and cubilin revealed modification at S, Y,and T residues, respectively. Spectrin is a component of thenephrin multiprotein complex that regulates plasma membraneintegrity and the cytoskeletal structure (Figure 8A),36 while ATPsynthase is an important enzyme that provides energy for the cellthrough ATP synthesis (Figure 8B),37 and cubulin acts as areceptor for intrinsic factor-vitamin B12 complexes locatedwithin the kidney epithelia and renal proximal tubule (Figure8C).38 These proteins were shown to be physiologically activewhen phosphorylated.36−38 Peptides acetylated and ubiquiti-nated on lysine were detected in fructose-1,6-biphosphatase(Figure 8D) and voltage-dependent anion-selective protein1(Figure 8E), respectively. Recent reports showed the importanceof acetylation on the functional activity of fructose-1,6-biphosphatase39,40 and ubiquitination on protein 1 stability anddegradation.3,12 Methionine oxidation of the propionyl-CoAcarboxylase enzyme has been examined in this study (Figure 8F).This enzyme plays an important role in the metabolic pathway bycatalyzing the carboxylation reaction of propionyl CoA in therenal mitochondrial matrix. Oxidation of methionine has beenshown in some proteins to lead to a significant change in theirbiological activity41,42 and development of some disorders.43
However, further investigation is required to clarify the biologicalsignificance of this modification. Finally, the existence ofmodified phosphoproteins has been visualized in a fractionatedsample (Figure 9). Western blotting using antiphosphotyrosine
antibody P-Tyr-100 was performed on a 7 cm polyacrylamide gel,which revealed the presence of 224 protein-representing spots (P< 0.05).
4. CONCLUDING REMARKSOur study presents a proteomic pipeline for extensive character-ization of the mouse kidney proteome. The data reported hereshows that an OFFGel prefractionation system greatly enhancedthe identification of low-abundant and hydrophobic proteins. Wealso demonstrated the feasibility of OFFGel prefractionation tounveil protein functional relevance by detecting PTMs, especiallywhen the prefractionation was coupled with targeted enrichmentsuch as phospho-enrichment. The OFFGel-TiO2 platformshowed, for the first time, its capability to improve phosphopep-tide identification. Finally, detailed mouse kidney proteome withphosphopeptide enrichment presented here serves as a usefulmodel for better understanding how protein modifications workand will ultimately contribute to our understanding of diseaseetiology and normal physiological functions of the kidney.
■ ASSOCIATED CONTENT*S Supporting Information
Supplement 1: mouse kidney proteome database generated fromOFFGel prefractionated sample. Supplement 2a: GO annotationnetwork of constructed kidney proteome database. Supplement2b: GO detailed term list. Supplement 3: list of peptidemodifications generated from OFFGel prefractionated andenriched kidney sample. This material is available free of chargevia the Internet at http://pubs.acs.org.
■ AUTHOR INFORMATIONCorresponding Author
*Address: Department of Structural Pathology Institute ofNephrology, Graduate School of Medical and Dental Sciences,Niigata University, 1-757 Asahimachi-dori, Japan. E-mail:
Figure 9. Western blot analysis of kidney lysate using antiphosphotyr-osine antibody, P-Tyr-100. The protein lysate (35 μg) was precipitated,resuspended in a urea-based buffer, separated on a 7 cm 2D gelelectrophoresis (2-DE) gel, transferred to a PVDF membrane, andimmunoblotted with P-Tyr-100. Image was subjected to long exposureto show the tyrosine-phosphorylated protein spots clearly. Horizontalaxis represents isoelectric point (pI), ranging between 3−10, and thevertical axis represents 2D electrophoresis in KDa.
Journal of Proteome Research Article
dx.doi.org/10.1021/pr401122m | J. Proteome Res. 2014, 13, 1636−16461644
[email protected]; [email protected]. Tel: +81-25-227-2152. Fax: +81-25-227-0768.
Notes
The authors declare no competing financial interest.
■ ACKNOWLEDGMENTSThanks are due to Claire Delahunty, James Moresco, and JoleneK. Diedrich fromThe Scripps Research Institute (TSRI) for theirconceptual advice. This work was supported by JSPS (JapanSociety for Promotion of Science) Grant-in-Aid for scientificresearch (B) to S.M. (23790933), Grant-in-Aid for scientificresearch (B) to T.Y. (21390262), Grant-in-Aid for publication ofscientific research results (database) to T.Y. (228071), andStrategic young researcher overseas visits program for accelerat-ing brain circulation (S2302). Partial support was provided byNIH Grants P41 GM103533, R01 MH067880, and V19AI063603 to J.R.Y. The funding agencies had no role in studydesign, data collection and analysis, decision to publish, orpreparation of the manuscript.
■ REFERENCES(1) Mann, M.; Jensen, O. N. Proteomic analysis of post-translationalmodifications. Nat. Biotechnol. 2003, 21 (3), 255−261.(2) Prabakaran, S.; Lippens, G.; Steen, H.; Gunawardena, J. Post-translational modification: Nature’s escape from genetic imprisonmentand the basis for dynamic information encoding. Wiley Interdiscip. Rev.:Syst. Biol. Med. 2012, 4 (6), 565−583.(3)Witze, E. S.; Old, W.M.; Resing, K. A.; Ahn, N. G. Mapping proteinpost-translational modifications with mass spectrometry. Nat. Methods2007, 4 (10), 798−806.(4) Khoury, G. A.; Baliban, R. C.; Floudas, C. A. Proteome-wide post-translational modification statistics: Frequency analysis and curation ofthe Swiss-Prot database. Sci. Rep. 2011, 1, 15.(5) Silva, A.; Vitorino, R.; Domingues, M. R.; Spickett, C. M.;Domingues, P. Post-translational modifications and mass spectrometrydetection. Free Radical Biol. Med. 2013, 65, 925−941.(6) Walsh, C. T.; Garneau-Tsodikova, S.; Gatto, G. J., Jr. Proteinposttranslational modifications: The chemistry of proteome diversifica-tions. Angew. Chem., Int. Ed. 2005, 44 (45), 7342−7372.(7) Zha, D.; Chen, C.; Liang, W.; Chen, X.; Ma, T.; Yang, H.; Goor, H.;Ding, G. Nephrin phosphorylation regulates podocyte adhesion throughthe PINCH-1-ILK-alpha-parvin complex. BMB Rep. 2013, 46 (4), 230−235.(8) Zhang, Y.; Yoshida, Y.; Nameta, M.; Xu, B.; Taguchi, I.; Ikeda, T.;Fujinaka, H.; Magdeldin, S.; Tsukaguchi, H.; Harita, Y.; Yaoita, E.;Yamamoto, T. Glomerular proteins related to slit diaphragm and matrixadhesion in the foot processes are highly tyrosine phosphorylated in thenormal rat kidney.Nephrol., Dial., Transplant. 2010, 25 (6), 1785−1795.(9) Nicolaou, N.; Margadant, C.; Kevelam, S. H.; Lilien, M. R.;Oosterveld, M. J.; Kreft, M.; van Eerde, A. M.; Pfundt, R.; Terhal, P. A.;van der Zwaag, B.; Nikkels, P. G.; Sachs, N.; Goldschmeding, R.; Knoers,N. V.; Renkema, K. Y.; Sonnenberg, A. Gain of glycosylation in integrinalpha3 causes lung disease and nephrotic syndrome. J. Clin. Invest. 2012,122 (12), 4375−4387.(10) Chuang, P. Y.; Dai, Y.; Liu, R.; He, H.; Kretzler, M.; Jim, B.;Cohen, C. D.; He, J. C. Alteration of forkhead box O (foxo4) acetylationmediates apoptosis of podocytes in diabetes mellitus. PLoS One 2011, 6(8), e23566.(11) Reivinen, J.; Holthofer, H.; Miettinen, A. A cell-type specificganglioside of glomerular podocytes in rat kidney: An O-acetylatedGD3. Kidney Int. 1992, 42 (3), 624−31.(12) Togawa, A.; Yamamoto, T.; Suzuki, H.; Fukasawa, H.; Ohashi, N.;Fujigaki, Y.; Kitagawa, K.; Hattori, T.; Kitagawa, M.; Hishida, A.Ubiquitin-dependent degradation of Smad2 is increased in the glomeruliof rats with anti-thymocyte serum nephritis. Am. J. Pathol. 2003, 163 (4),1645−1652.
(13) Yan, K.; Khoshnoodi, J.; Ruotsalainen, V.; Tryggvason, K. N-linked glycosylation is critical for the plasma membrane localization ofnephrin. J. Am. Soc. Nephrol. 2002, 13 (5), 1385−1389.(14)Michel, P. E.; Reymond, F.; Arnaud, I. L.; Josserand, J.; Girault, H.H.; Rossier, J. S. Protein fractionation in a multicompartment deviceusing Off-Gel isoelectric focusing. Electrophoresis 2003, 24 (1−2), 3−11.(15) Wisniewski, J. R.; Zougman, A.; Nagaraj, N.; Mann, M. Universalsample preparation method for proteome analysis.Nat. Methods 2009, 6(5), 359−362.(16) Magdeldin, S.; Li, H.; Yoshida, Y.; Satokata, I.; Maeda, Y.;Yokoyama, M.; Enany, S.; Zhang, Y.; Xu, B.; Fujinaka, H.; Yaoita, E.;Yamamoto, T. Differential proteomic shotgun analysis elucidatesinvolvement of water channel aquaporin 8 in presence of alpha-amylasein the colon. J. Proteome Res. 2010, 9 (12), 6635−6646.(17) Larsen, M. R.; Thingholm, T. E.; Jensen, O. N.; Roepstorff, P.;Jorgensen, T. J. Highly selective enrichment of phosphorylated peptidesfrom peptide mixtures using titanium dioxide microcolumns. Mol. Cell.Proteomics 2005, 4 (7), 873−886.(18) Rappsilber, J.; Mann, M.; Ishihama, Y. Protocol for micro-purification, enrichment, pre-fractionation and storage of peptides forproteomics using StageTips. Nat. Protoc. 2007, 2 (8), 1896−1906.(19) McDonald, W. H.; Tabb, D. L.; Sadygov, R. G.; MacCoss, M. J.;Venable, J.; Graumann, J.; Johnson, J. R.; Cociorva, D.; Yates, J. R., 3rdMS1, MS2, and SQT-three unified, compact, and easily parsed fileformats for the storage of shotgun proteomic spectra and identifications.Rapid Commun. Mass Spectrom. 2004, 18 (18), 2162−2168.(20) Gnad, F.; Gunawardena, J.; Mann, M. PHOSIDA 2011: Theposttranslational modification database. Nucleic Acids Res. 2011, 39(database issue), D253−260.(21) Eden, E.; Navon, R.; Steinfeld, I.; Lipson, D.; Yakhini, Z. GOrilla:A tool for discovery and visualization of enriched GO terms in rankedgene lists. BMC Bioinf. 2009, 10, 48.(22) Enany, S.; Yoshida, Y.; Magdeldin, S.; Bo, X.; Zhang, Y.; Enany,M.; Yamamoto, T. Two dimensional electrophoresis of the exo-proteome produced from community acquired methicillin resistantStaphylococcus aureus belonging to clonal complex 80. Microbiol. Res.2013, 168 (8), 504−511.(23) Magdeldin, S.; Li, H.; Yoshida, Y.; Enany, S.; Zhang, Y.; Xu, B.;Fujinaka, H.; Yaoita, E.; Yamamoto, T. Comparison of two dimensionalelectrophoresis mouse colon proteomes before and after knocking outAquaporin 8. J. Proteomics 2010, 73 (10), 2031−2040.(24) Tobolkina, E.; Cortes-Salazar, F.; Momotenko, D.; Maillard, J.;Girault, H. H. Segmented field OFFGEL(R) electrophoresis. Electro-phoresis 2012, 33 (22), 3331−3338.(25) Krishnan, S.; Gaspari, M.; Della Corte, A.; Bianchi, P.; Crescente,M.; Cerletti, C.; Torella, D.; Indolfi, C.; de Gaetano, G.; Donati, M. B.;Rotilio, D.; Cuda, G. OFFgel-based multidimensional LC-MS/MSapproach to the cataloguing of the human platelet proteome for aninteractomic profile. Electrophoresis 2011, 32 (6−7), 686−695.(26) Barbhuiya, M. A.; Sahasrabuddhe, N. A.; Pinto, S. M.;Muthusamy, B.; Singh, T. D.; Nanjappa, V.; Keerthikumar, S.;Delanghe, B.; Harsha, H. C.; Chaerkady, R.; Jalaj, V.; Gupta, S.;Shrivastav, B. R.; Tiwari, P. K.; Pandey, A. Comprehensive proteomicanalysis of human bile. Proteomics 2011, 11 (23), 4443−4453.(27) Ho, J. H.; Lee, O. K.; Fu, Y. J.; Shih, H. T.; Tseng, C. Y.; Chung, C.C.; Han, C. L.; Chen, Y. J. An iTRAQ proteomic study reveals anassociation between diet-induced enhanced fatty acid metabolism andthe development of glucose intolerance in prediabetic mice. J. ProteomeRes. 2013, 12 (3), 1120−1133.(28) Abdallah, C.; Sergeant, K.; Guillier, C.; Dumas-Gaudot, E.;Leclercq, C. C.; Renaut, J. Optimization of iTRAQ labelling coupled toOFFGEL fractionation as a proteomic workflow to the analysis ofmicrosomal proteins of Medicago truncatula roots. Proteome Sci. 2012,10 (1), 37.(29) Garcıa-Otero, N.; Pena-Vazquez, E.; Barciela-Alonso, M. C.;Bermejo-Barrera, P.; Moreda-Pineiro, A. Two-dimensional isoelectricfocusing OFFGEL and microfluidic lab-on-chip electrophoresis forassessing dissolved proteins in seawater. Anal. Chem. 2013, 85 (12),5909−5916.
Journal of Proteome Research Article
dx.doi.org/10.1021/pr401122m | J. Proteome Res. 2014, 13, 1636−16461645
(30) Konecna, H.; Muller, L.; Dosoudilova, H.; Potesil, D.; Bursikova,J.; Sedo, O.; Marova, I.; Zdrahal, Z. Exploration of beer proteome usingOFFGEL prefractionation in combination with two-dimensional gelelectrophoresis with narrow pH range gradients. J. Agric. Food Chem.2012, 60 (10), 2418−2426.(31) Fic, E.; Kedracka-Krok, S.; Jankowska, U.; Pirog, A.; Dziedzicka-Wasylewska, M. Comparison of protein precipitation methods forvarious rat brain structures prior to proteomic analysis. Electrophoresis2010, 31 (21), 3573−3579.(32) Vogel, C.; Marcotte, E. M. Label-free protein quantitation usingweighted spectral counting. Methods Mol. Biol. 2012, 893, 321−341.(33) Sudhir, P. R.; Chen, C. H.; Pavana Kumari, M.; Wang, M. J.; Tsou,C. C.; Sung, T. Y.; Chen, J. Y. Label-free quantitative proteomics and N-glycoproteomics analysis of KRAS-activated human bronchial epithelialcells. Mol. Cell. Proteomics 2012, 11 (10), 901−915.(34) Zarei, M.; Sprenger, A.; Metzger, F.; Gretzmeier, C.; Dengjel, J.Comparison of ERLIC-TiO2, HILIC-TiO2, and SCX-TiO2 for globalphosphoproteomics approaches. J. Proteome Res. 2011, 10 (8), 3474−3483.(35) Olsen, J. V.; Blagoev, B.; Gnad, F.; Macek, B.; Kumar, C.;Mortensen, P.; Mann, M. Global, in vivo, and site-specific phosphor-ylation dynamics in signaling networks. Cell 2006, 127 (3), 635−648.(36) Lehtonen, S.; Ryan, J. J.; Kudlicka, K.; Iino, N.; Zhou, H.;Farquhar, M. G. Cell junction-associated proteins IQGAP1, MAGI-2,CASK, spectrins, and alpha-actinin are components of the nephrinmultiprotein complex. Proc Natl Acad Sci U.S.A. 2005, 102 (28), 9814−9819.(37) Jonckheere, A. I.; Smeitink, J. A.; Rodenburg, R. J. MitochondrialATP synthase: Architecture, function and pathology. J. Inherited Metab.Dis. 2012, 35 (2), 211−225.(38) Christensen, E. I.; Birn, H. Megalin and cubilin: Synergisticendocytic receptors in renal proximal tubule. Am. J. Physiol.: Renal, FluidElectrolyte Physiol. 2001, 280 (4), F562−F573.(39) Choudhary, C.; Kumar, C.; Gnad, F.; Nielsen, M. L.; Rehman, M.;Walther, T. C.; Olsen, J. V.; Mann, M. Lysine acetylation targets proteincomplexes and co-regulates major cellular functions. Science 2009, 325(5942), 834−840.(40) Lundby, A.; Lage, K.;Weinert, B. T.; Bekker-Jensen, D. B.; Secher,A.; Skovgaard, T.; Kelstrup, C. D.; Dmytriyev, A.; Choudhary, C.;Lundby, C.; Olsen, J. V. Proteomic analysis of lysine acetylation sites inrat tissues reveals organ specificity and subcellular patterns. Cell Rep.2012, 2 (2), 419−431.(41) Stadtman, E. R.; Moskovitz, J.; Levine, R. L. Oxidation ofmethionine residues of proteins: Biological consequences. Antioxid.Redox Signaling 2003, 5 (5), 577−582.(42) Vogt, W. Oxidation of methionyl residues in proteins: Tools,targets, and reversal. Free Radical Biol. Med. 1995, 18 (1), 93−105.(43) Berlett, B. S.; Stadtman, E. R. Protein oxidation in aging, disease,and oxidative stress. J. Biol. Chem. 1997, 272 (33), 20313−20316.
Journal of Proteome Research Article
dx.doi.org/10.1021/pr401122m | J. Proteome Res. 2014, 13, 1636−16461646