deepwater reservoirs requiring high rate/high-volume …€¦ · providers (baker, halliburton,...
TRANSCRIPT
Copyright 2003 AADE Technical Conference This paper was prepared for presentation at the AADE 2003 National Technology Conference “Practical Solutions for Drilling Challenges”, held at the Radisson Astrodome Houston, Texas, April 1 - 3, 2003 in Houston, Texas. This conference was hosted by the Houston Chapter of the American Association of Drilling Engineers. The information presented in this paper does not reflect any position, claim or endorsement made or implied by the American Association of Drilling Engineers, their officers or members. Questions concerning the content of this paper should be directed to the individuals listed as author/s of this work.
Abstract Deepwater reservoirs with increasing zone lengths and permeability continue to push FracPac design and equipment capabilities. The new well parameters require higher pump rates and proppant volumes to ensure proper stimulation of these high kH reservoir intervals. Also reservoirs with multiple intervals are being encountered in deepwater coupled with the desire to frac as single interval is another driver pushing current tool capabilities. As a result, some recent FracPacs have been performed at pump rates as high as 50 barrels per minute (bbl/min) on recent frac-pack jobs with proppant volumes surpassing 250,000 lbm. Future development may even require proppant volumes in excess of 1,000,000 lbm. In view of these potential requirements, questions are now being asked as to 1) can downhole completion hardware handle these higher rates and proppant volumes, and 2), will tool design changes be required. This paper will review current high-volume tool designs along with tool enhancements that have been made to reduce the erosive effects of the high fluid/proppant rates and proppant volumes. Qualification testing is shown that summarizes the results of surface testing of the downhole service equipment at rates of 50 and 60 bbl/min with proppant volumes up to 2,000,000 lbm. Introduction In 1988, Arco approached the major gravel pack service providers (Baker, Halliburton, Schlumberger/Dowell and Guiberson) to provide a solid, non-welded gravel-pack crossover design for qualification testing for possible use in high volume, higher-rate frac-pack completions planned in Alaska. This project led to some of the first industry testing of crossover exit-port design. The test required pumping a 10 lbm/gal gelled sand slurry containing 20/40 sand at 20 bbl/min for 1100 barrels through the crossover with full inspection at completion of the test. A 5.0-in. x 9-5/8 in. solid, non-welded crossover developed by one of the service providers was tested, and the test results showed that the design could
handle the requirements. Minimal erosion of .179 in. was noticed on the slot width. Bob Hanna and Dick Ellis with BP provided the next impetus. They pioneered the frac-pack application within BP, which resulted in its application in wells at Mississippi Canyon 109, Amberjack platform. These frac-packs were considered extreme at the time with rates of 12 to 15 bbl/min and proppant volumes of 15,000 to 30,000 lbm. As the frac-pack technique gained more acceptance, further tool testing and qualification was required as the limits on rate and proppant volume continued to be pushed. Testing at higher rates and proppant volumes has been ongoing to meet surface pumping capabilities. As a result of this testing and applying lessons learned, new tool systems have evolved rapidly in the last decade. Innovations have included a new larger-exit-area crossover design, a solid-steel crossover design to replace the earlier welded designs, improved metallurgy and material coatings, changes in positioning of the crossover during pumping to protect the external production casing from the erosive forces, and improved exit-sleeve design. It also led to the design of weight-down tools for positive positioning during the frac-pack. The latter was required to counter the ballooning and cooling forces exerted on the workstring during pack placement. Today, the weight-down system has been further refined with the use of multi-acting collets that maintain both a weight-down circulating and a squeeze position.1,2,3
Pumping design has a direct effect on tool ratings. On smaller tool sizes, these upper limits are fairly well defined. On the larger tool sizes, there still might be additional capability to increase rates and volumes. But it is likely that the existing concentric reciprocating tool designs dating from the 1970’s are approaching their limit. What is the upper rate and proppant limit and is there a need to continue to go at higher rates and larger proppant volumes? This is a question still to be
AADE-03-NTCE-18
Deepwater Reservoirs Requiring High Rate/High-Volume Frac Packing Continue to Stretch Downhole Tool Capabilities – Latest Tool Design and Qualification Testing Results Mike Mullen and Kevin Svatek, Mullen Engineering, Emile Sevadjian, Sanjay Vitthal, and Tommy Grigsby, Halliburton Energy Services, Inc.

2 MIKE MULLEN, KEVIN SVATEK, EMILE SEVADJIAN, SANJAY VITTHAL AND TOMMY GRIGSBY AADE-03-NTCE-18
answered. If history tells us anything then it is likely that the operator engineers along with the FracPac engineers will continue to push the limit. The capability to tie two frac vessels together only enhances the chance of further pushing the limit. Reservoir Drivers There are several reservoir conditions that are driving the requirement for higher rate frac-pack tools. Prolific deepwater zones are characterized by high deviations, high permeability, and long intervals. In deepwater, it is not uncommon to frac-pack zones with permeabilities in excess of 250,000 md ft. The permeability of these intervals can be on the range of 1 to 2 Darcies, interval lengths can range from 200 to 500 ft, and deviations greater than 50 degrees are fairly common. Consequently, these zones often exhibit high-fracture-fluid leak-off rates. It is important that the frac pack cover the entire zone in order to maximize the production rate and the long-term reliability of the completion. Such completions usually require a high-rate and large volumes of proppant placed across the interval. The degree of heterogeneity across the producing zone also can require high-rate frac-packing. In some cases, there may be two or more highly permeable zones that are separated by a shaly or silty zone of poorer quality. Since the shaly or silty sand may act as a barrier to fracture height growth, it is critical to be sure that the frac-pack covers the entire interval. A third driver for frac packing long intervals is economics. If it is possible to complete two (2) intervals that are close together with a single completion rather than a stacked completion, the cost, time, and the risk associated with the completion can be minimized. Some alternatives may be to use other completion types that require lower injection rates. These alternatives include screen-only completions, openhole gravel packs or high-rate water packs in order to complete these long high-permeability intervals. However, these completions typically exhibit higher skins than frac-packs. Furthermore, historical evidence in the Gulf of Mexico indicates that frac packs are currently the most reliable and provide the lowest skins of all completion types.4,5 Other alternatives may be to reduce the effective perforated interval, perform a stacked completion, or use more viscous fluids that will have lower leak-off. However, each of these approaches has disadvantages. Limiting the perforated interval may result in lost reserves. Stacking completions increases the cost of the completion, which is a major factor in deepwater wells, and the use of more viscous fluids may result in increased proppant pack damage and skin that could
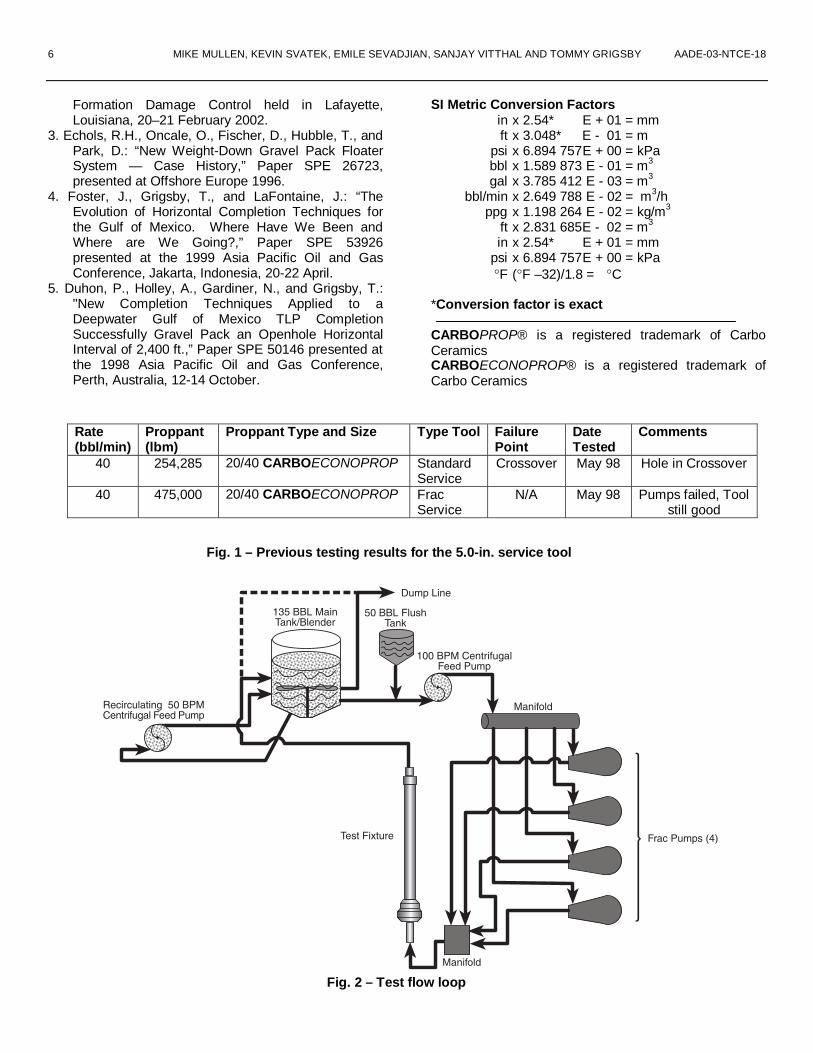
impact productivity. The use of higher-rate tools, therefore, helps to perform frac-pack operations at lower overall costs, shorter turnaround time, and with increased productivity than might be obtained from conventional tools. Challenge Deepwater completions have constantly challenged placement design. Pumping rates have slowly been increased to handle the longer intervals or to maximize sand placement. The Shell URSA A7 well pushed the record rate to 41.6 bbl/min. This well required a special rig up of twin 3-1/2-in. co-flex hoses to safely place the pack. The well, when brought on production, turned out to be the record producer for the GOM, producing at a rate of 50,150 BOE per day. This well was superseded by a 42 bbl/min placement and followed by 45 bbl/min placement. BP once again raised another challenge. Consulting engineer, Mike Mullen, stated that for the upcoming Aspen project, the anticipated frac-pack design would require a pump rate of 50 bbl/min with an anticipated proppant volume of 500,000 lbm. Fortunately, the planned casing size was 9-7/8 inch, which would allow the use of 5.0-in.-bore packers and service tools. The 50 bbl/min rate was not new and had been reached on a previous Shell Na Kika job in the GOM. The difference between the Na Kika job and the proposed test was the plan to stay at maximum rate, using the larger proppant volume throughout the test. Rating Frac service tools has been done through surface testing, actual job comparisons and modeling. With the variety of proppant types, pumping regimens, exit port designs, limiting flow areas, and the upper extension material and grade defining the ultimate tool pump and volume ratings, one can see by the number of variables that rating a service tool is not an easy task and has to take into consideration the packer assembly into which it is to be installed. The 5-in service tool (5.0-in.-ID packer bore) had a conservative rating of 40 bbl/min with a maximum proppant capacity of 300,000 lbm. carbolite with an internal protective sleeve, although the tool had been tested at a higher proppant volume as can be seen in Fig. 1. These test results were used as the baseline data for setting up the 50 bbl/min and 60 bbl/min test. Testing Test Setup - A complete frac flow test had to be performed to verify that the 5.0-in. service tool could handle the desired pump rate and proppant volume requested by BP for the Aspen project. Prior to testing, it was decided to push the tool design by increasing rate and volume if initial test results were positive. An existing
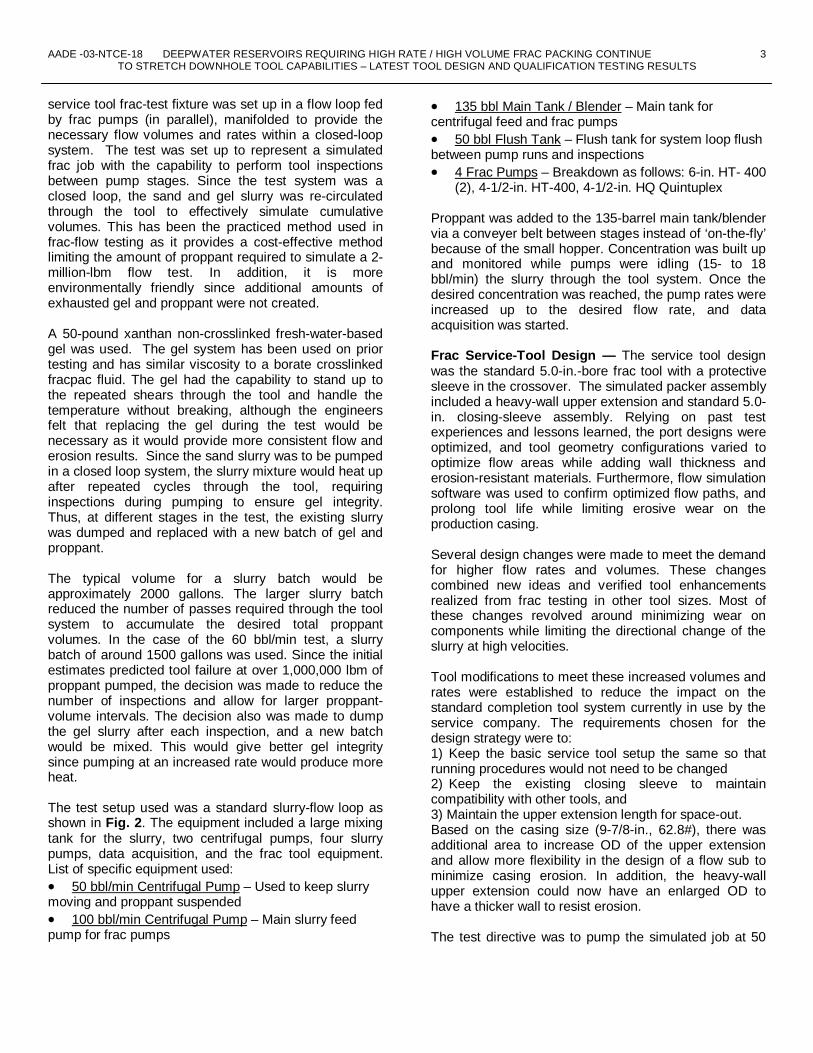
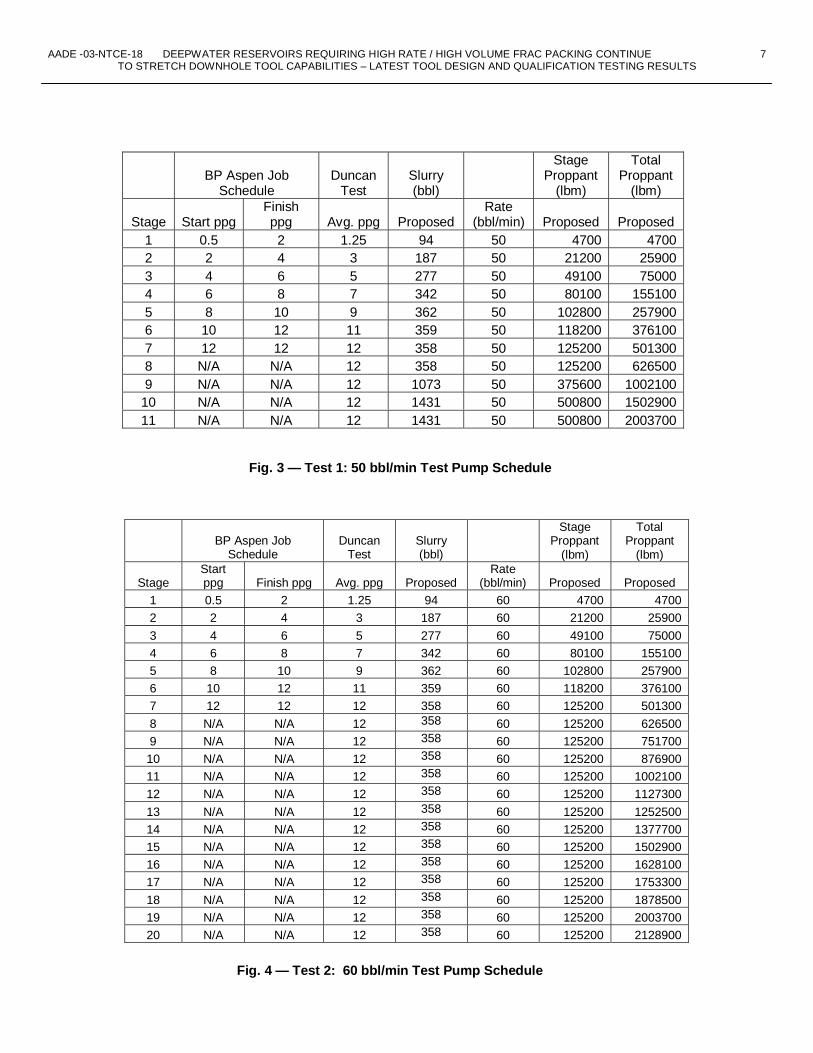
AADE -03-NTCE-18 DEEPWATER RESERVOIRS REQUIRING HIGH RATE / HIGH VOLUME FRAC PACKING CONTINUE 3 TO STRETCH DOWNHOLE TOOL CAPABILITIES – LATEST TOOL DESIGN AND QUALIFICATION TESTING RESULTS service tool frac-test fixture was set up in a flow loop fed by frac pumps (in parallel), manifolded to provide the necessary flow volumes and rates within a closed-loop system. The test was set up to represent a simulated frac job with the capability to perform tool inspections between pump stages. Since the test system was a closed loop, the sand and gel slurry was re-circulated through the tool to effectively simulate cumulative volumes. This has been the practiced method used in frac-flow testing as it provides a cost-effective method limiting the amount of proppant required to simulate a 2-million-lbm flow test. In addition, it is more environmentally friendly since additional amounts of exhausted gel and proppant were not created. A 50-pound xanthan non-crosslinked fresh-water-based gel was used. The gel system has been used on prior testing and has similar viscosity to a borate crosslinked fracpac fluid. The gel had the capability to stand up to the repeated shears through the tool and handle the temperature without breaking, although the engineers felt that replacing the gel during the test would be necessary as it would provide more consistent flow and erosion results. Since the sand slurry was to be pumped in a closed loop system, the slurry mixture would heat up after repeated cycles through the tool, requiring inspections during pumping to ensure gel integrity. Thus, at different stages in the test, the existing slurry was dumped and replaced with a new batch of gel and proppant. The typical volume for a slurry batch would be approximately 2000 gallons. The larger slurry batch reduced the number of passes required through the tool system to accumulate the desired total proppant volumes. In the case of the 60 bbl/min test, a slurry batch of around 1500 gallons was used. Since the initial estimates predicted tool failure at over 1,000,000 lbm of proppant pumped, the decision was made to reduce the number of inspections and allow for larger proppant-volume intervals. The decision also was made to dump the gel slurry after each inspection, and a new batch would be mixed. This would give better gel integrity since pumping at an increased rate would produce more heat. The test setup used was a standard slurry-flow loop as shown in Fig. 2. The equipment included a large mixing tank for the slurry, two centrifugal pumps, four slurry pumps, data acquisition, and the frac tool equipment. List of specific equipment used: • 50 bbl/min Centrifugal Pump – Used to keep slurry moving and proppant suspended • 100 bbl/min Centrifugal Pump – Main slurry feed pump for frac pumps
• 135 bbl Main Tank / Blender – Main tank for centrifugal feed and frac pumps • 50 bbl Flush Tank – Flush tank for system loop flush between pump runs and inspections • 4 Frac Pumps – Breakdown as follows: 6-in. HT- 400
(2), 4-1/2-in. HT-400, 4-1/2-in. HQ Quintuplex Proppant was added to the 135-barrel main tank/blender via a conveyer belt between stages instead of ‘on-the-fly’ because of the small hopper. Concentration was built up and monitored while pumps were idling (15- to 18 bbl/min) the slurry through the tool system. Once the desired concentration was reached, the pump rates were increased up to the desired flow rate, and data acquisition was started. Frac Service-Tool Design — The service tool design was the standard 5.0-in.-bore frac tool with a protective sleeve in the crossover. The simulated packer assembly included a heavy-wall upper extension and standard 5.0-in. closing-sleeve assembly. Relying on past test experiences and lessons learned, the port designs were optimized, and tool geometry configurations varied to optimize flow areas while adding wall thickness and erosion-resistant materials. Furthermore, flow simulation software was used to confirm optimized flow paths, and prolong tool life while limiting erosive wear on the production casing. Several design changes were made to meet the demand for higher flow rates and volumes. These changes combined new ideas and verified tool enhancements realized from frac testing in other tool sizes. Most of these changes revolved around minimizing wear on components while limiting the directional change of the slurry at high velocities. Tool modifications to meet these increased volumes and rates were established to reduce the impact on the standard completion tool system currently in use by the service company. The requirements chosen for the design strategy were to: 1) Keep the basic service tool setup the same so that running procedures would not need to be changed 2) Keep the existing closing sleeve to maintain compatibility with other tools, and 3) Maintain the upper extension length for space-out. Based on the casing size (9-7/8-in., 62.8#), there was additional area to increase OD of the upper extension and allow more flexibility in the design of a flow sub to minimize casing erosion. In addition, the heavy-wall upper extension could now have an enlarged OD to have a thicker wall to resist erosion. The test directive was to pump the simulated job at 50
4 MIKE MULLEN, KEVIN SVATEK, EMILE SEVADJIAN, SANJAY VITTHAL AND TOMMY GRIGSBY AADE-03-NTCE-18
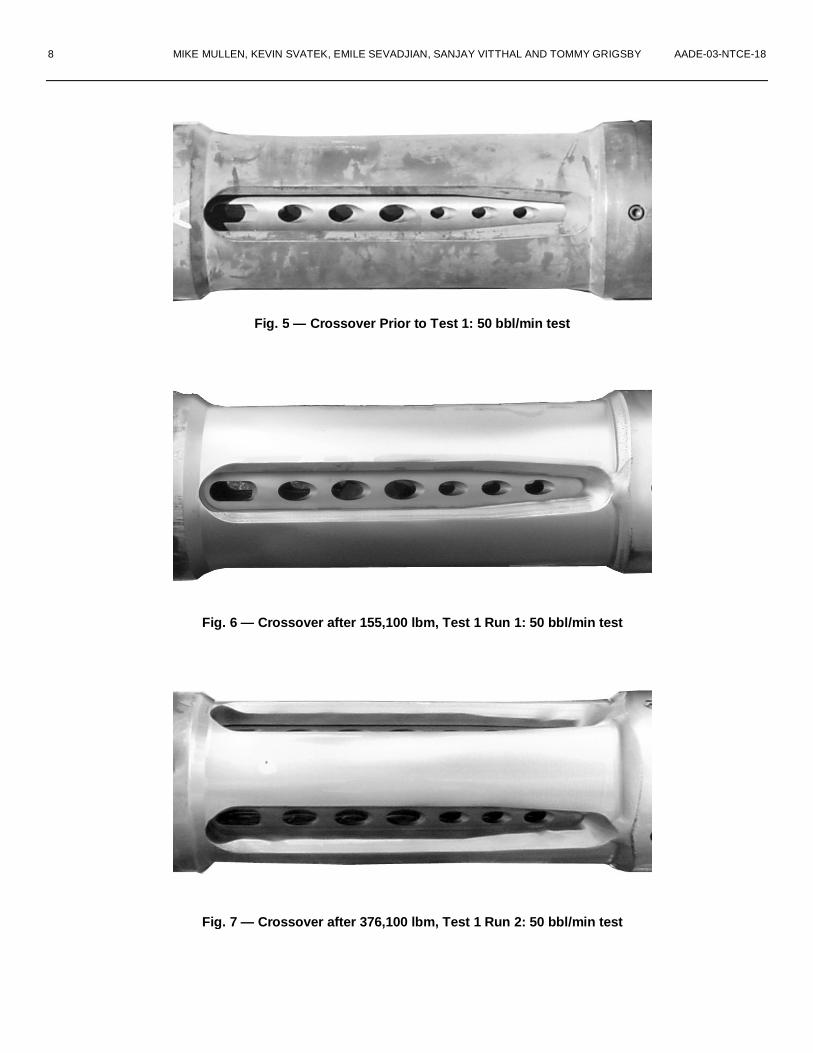
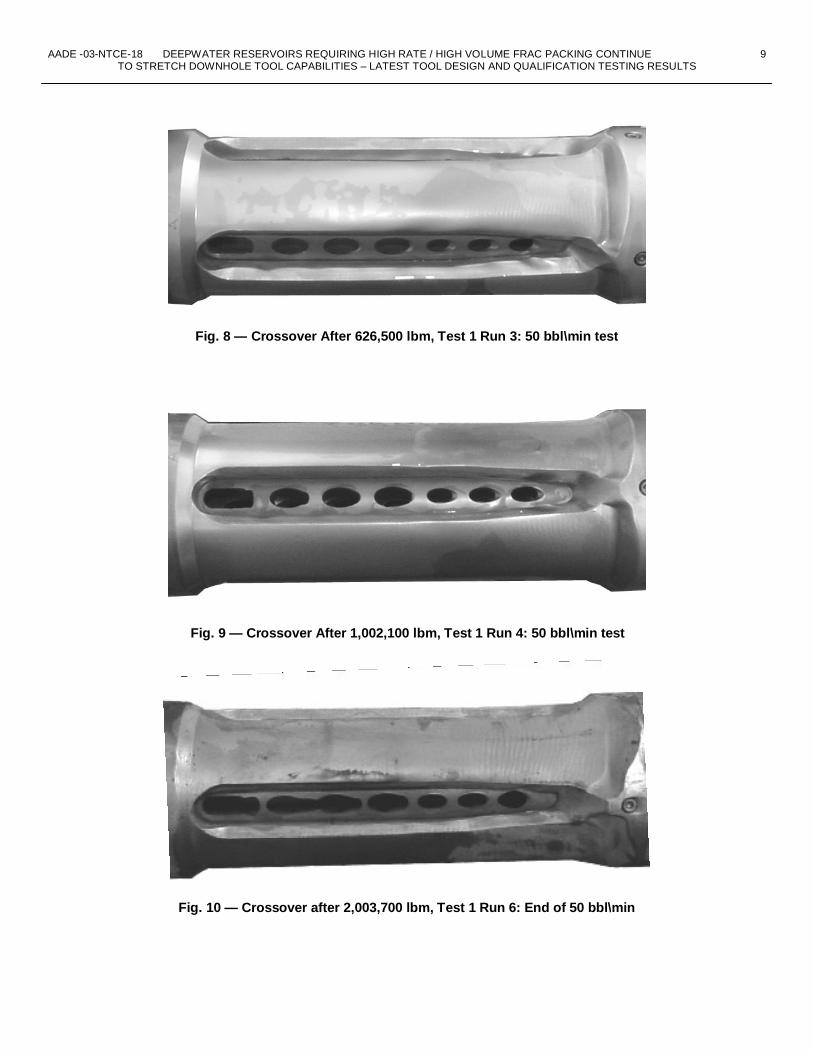
bbl/min until failure. A second backup test (Test 2) was planned to test to failure a newly developed flow sub designed to minimize erosion damage on the outer production casing at 50 bbl/min. After the successful conclusion of the 50 bbl/min test (Test 1), it was decided that Test 2, using the ported flow sub, would be increased to a flow rate of 60 bbl/min. Different customer material requirements specify both 13Cr and L-80 materials, as well as other alloys, for different well conditions. All gravel-pack components including the closing sleeve, ported flow sub, and upper extensions were constructed of 80,000 psi minimum yield material. Successful test results would provide equivalent ratings for the 5.0-in. service tool and accessory equipment for the 50 bbl/min pump rate and proppant volume, as well as meet the immediate requirements for the BP Aspen wells. Test parameters — The test parameters were derived based on the BP America completion requirements for upcoming Aspen wells. Initial targets were 500,000 lbm of 20/40 CARBOPROP® proppant to be pumped at a rate of 50 bbl/min. The pumping schedule was supplied by the service company, based on preliminary well analysis. The test pump schedule was taken from the proposed pumping schedule with average proppant concentrations being used instead of a scheduled concentration ramp due to using a stepped procedure in the testing setup. The proposed pumping schedules with target sand volumes for both the 50 bbl/min and 60 bbl/min flow tests are shown in Figs. 3 and 4. The BP Aspen well pump schedule had 7 stages to reach a volume of around 500,000 lbm. Since the plan was to test to failure, additional stages were added (for both tests) in the event that tool life allowed additional proppant volumes. Tool inspections based on observed tool erosion were performed between different pumping stages. At each tool inspection, the pumps and test fixture were flushed with clean fluid, and the test fixture was disassembled. Photos of each critical component were taken, and ultrasonic measurements of both the heavy-walled upper extension and the casing extension were also taken. Once the inspection was completed and the test fixture re-assembled, the pumps were brought back on line and the concentration taken up to the desired stage. At this point, the pumps were bumped up from idle (15 to18 bbl/min) to the desired pump rate. (Idle time through the tool system was not counted against total proppant volumes.) Test #1 Results: Closing Sleeve — 50 bbl/min The results below show the test run and concentration ramp along with the cumulative sand volume. Figs. 5 to
10 are photos showing the test results on the crossover during various stages of the test. Closing-sleeve photos are shown in Figs. 11 to 14. The upper extension photos are shown in Fig. 15, and casing extension photo is shown in Fig. 16. The testing results are detailed in Tables 1 and 2 below: Table 1
Test No. 1: 50 bbl/min
Concentration Cumulative Sand Volume
Pumped Test 1 Run 1 50 bbl/min conc.
ramp from 1.25 ppg to 7 ppg
155,100 lbm
Test 1 Run 2 50 bbl/min conc. ramp from 9 ppg to 11 ppg
376,100 lbm
Test 1 Run 3 50 bbl/min conc. of 12 ppg
626,500 lbm
Test 1 Run 4 50 bbl/min conc. of 12 ppg
1,002,100 lbm
Test 1 Run 5 50 bbl/min conc. of 12 ppg
1,502,900 lbm
Test 1 Run 6 50 bbl/min conc. of 12 ppg
2,003,700 lbm
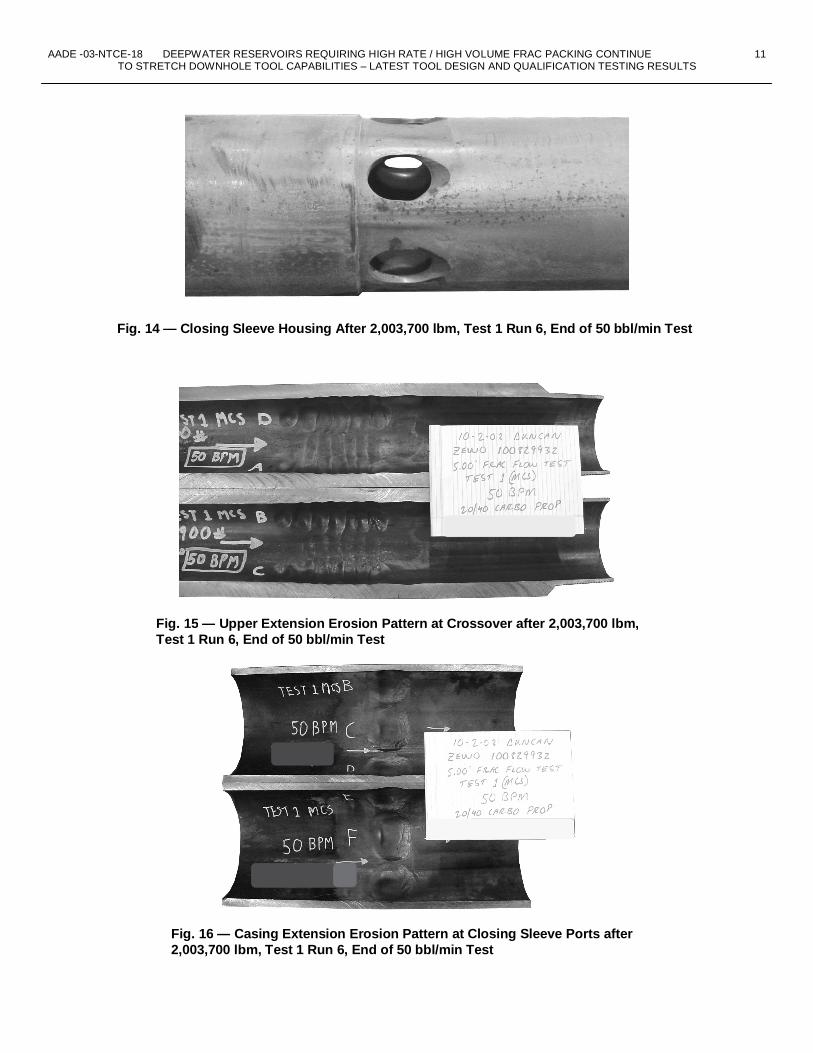
After pumping 2,003,700 lbm of proppant at 50 bbl/min, (Run 6), the average erosion for the upper extension was 35.72% of original wall thickness. The average erosion for the casing extension was 36.03% of original wall thickness. Test #2 Test Results: Flow Sub — 60 bbl/min Again, the results below show the test run and concentration ramp along with the cumulative sand volume. Crossover photos are shown in Figs. 17 and 18. The upper extension photo is shown in Fig. 19, and the casing extension photo is shown in Fig. 20. Table 2 Test No. 2 Concentration Cumulative Sand
Volume Pumped Test 2 Run 1 60 bbl/min conc.
ramp from 1.25 ppg to 9 ppg
no inspection
Test 2 Run 2 60 bbl/min conc. ramp from 9 ppg to 11 ppg
295,000 lbm
Test 2 Run 3 60 bbl/min conc. ramp from 11 ppg to 12 ppg
630,900 lbm
Test 2 Run 4 60 bbl/min conc. of 12 ppg
1,250,000 lbm
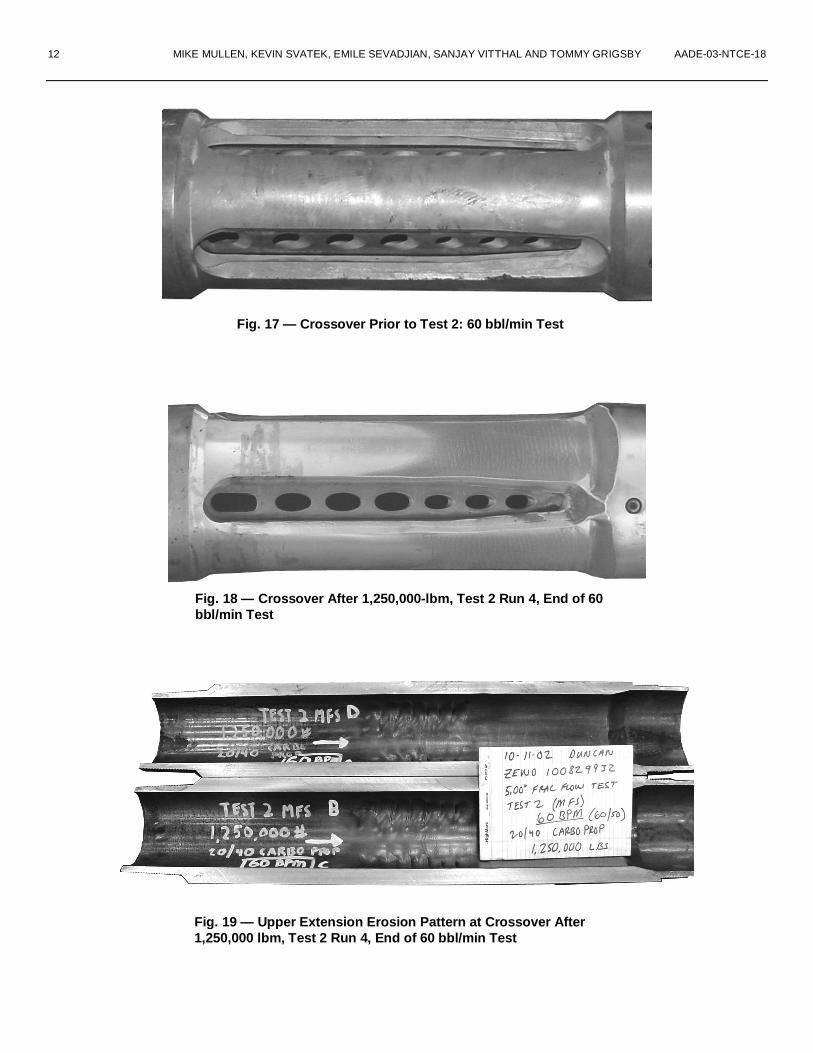
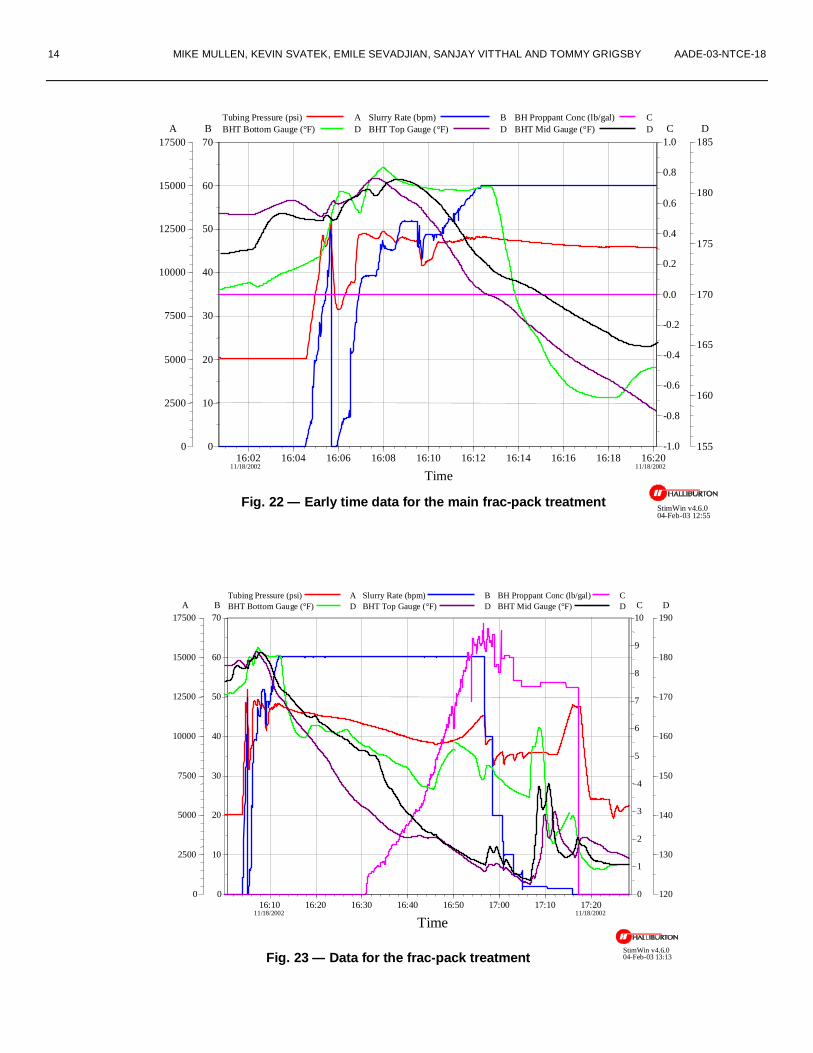
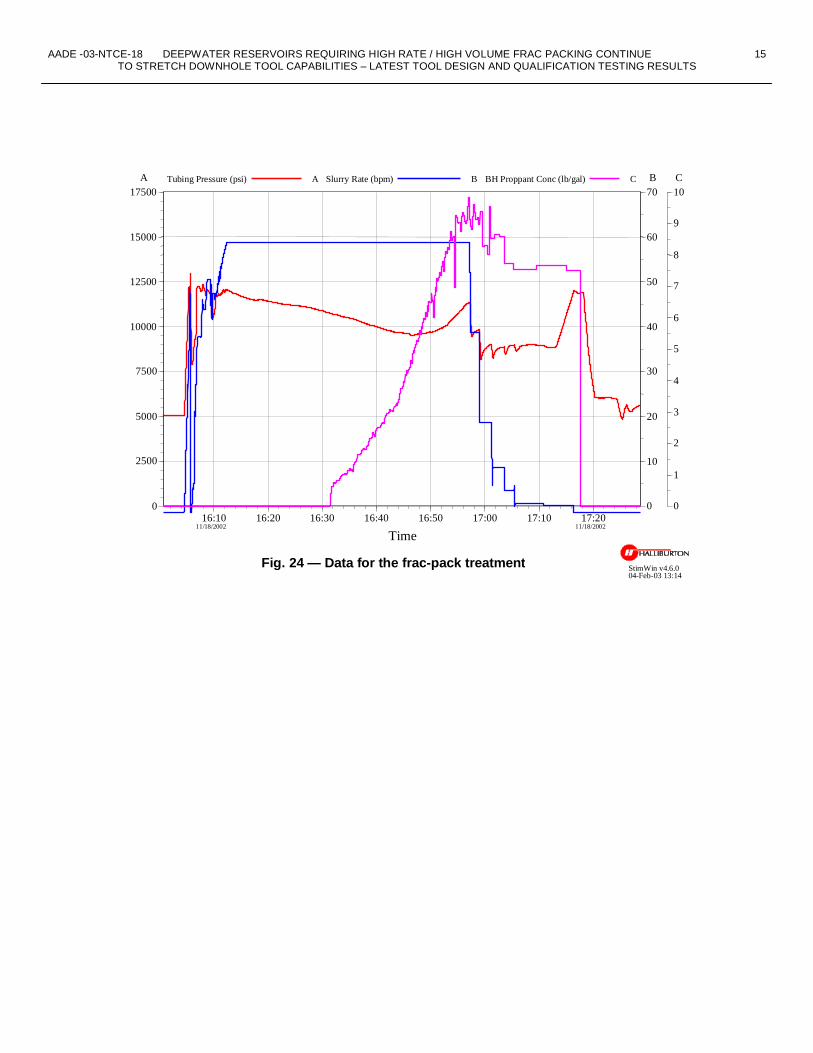
AADE -03-NTCE-18 DEEPWATER RESERVOIRS REQUIRING HIGH RATE / HIGH VOLUME FRAC PACKING CONTINUE 5 TO STRETCH DOWNHOLE TOOL CAPABILITIES – LATEST TOOL DESIGN AND QUALIFICATION TESTING RESULTS After pumping 1,250,000 lbs of proppant at 60 bbl/min, the average erosion for the upper extension was 21.95% of original wall thickness with the average erosion for the casing extension figuring to be only 2.61% of original wall thickness. Closing Sleeve Test Results. At the request of the BP America representative, a pressure test was performed on the closing sleeve to verify the capability to close and hold pressure after flowing 2,003,700 lbm of proppant slurry through the sleeve ID (results taken from Test 1). Their concern was the capability to prevent fluid loss through the sleeve after closing. The closing sleeve was shifted closed, and pressured up to 3230 psi. At the end of 30 minutes, the pressure had bled off to 2850 psi. Based on this test, it was determined that the 5.0-in. closing sleeve is capable of preventing fluid loss after pumping over 2,000,000 lbm of 20/40 proppant at 50 bbl/min. Case History The interval to be frac packed consisted of a zone with a measured length of 370 ft at a bottomhole deviation of 53o. The interval consisted of several clean high-permeability lobes that were separated by shaly to silty mudstone zones. The measured depth of the well was in excess of 19,000 ft, which added to the complexity of the design. Due to the high permeability and interval length of this zone, it was proposed that high injection rates would be needed to effectively cover the entire interval. A 30 lb/M-gallon borate crosslinked fluid was used in order to optimize leak-off and conductivity. The minifrac was performed at 50 bbl/min. Fig. 21 shows the minifrac for the treatment. The chart shows the results from the 3 temperature gauges that were run inside the washpipe as well as the bottomhole pressure. The trend of the three bottomhole gauges is of particular interest. The lowermost temperature gauge shows a very different trend as compared to the upper and middle gauges. The lowermost gauge essentially stays flat for approximately 5 to 7 minutes before showing a decline, whereas the other gauges show an immediate cool down. This could indicate that an effective frac across the lower and middle gauges had taken place but that the fracture had not grown to the position of the lowermost gauge. Finally, at around 18:06, the lowermost gauge started to cool down, which also coincided with a decline in the bottomhole pressure. This would indicate that the fracture had broken across a barrier and was now starting to grow downwards. This trend was further confirmed by the accelerated temperature decline seen in the upper and middle gauges and the early data from the main frac-pack treatment. Based on the analysis of the treatment, it was decided to pump the frac-pack at 60 bbl/min. Fig. 22 shows the early time data for the frac-pack. As in the
minifrac, the lowermost temperature gauge initially shows a flat profile while the other gauges show a cool down from the fracture. However after approximately 7 minutes of pumping at 60 bbl/min, the bottomhole temperature gauge showed a sharp decline indicating that the frac-pack had now grown to the bottommost gauge position. The data indicated that the high injection rates were instrumental in ensuring that the frac-pack was capable of covering the entire interval and that rates as high as 60 bbl/min may be necessary in the future for some of these deepwater zones. This treatment resulted in a total of 287,000 lbm of proppant being pumped of which 268,787 lbm were placed into the formation. The peak horsepower used was 16,292 hydraulic horsepower and achieved a rate of 60.1 bbl/min. The maximum treatment pressure was in excess of 12,300 psi, and the average treating pressure was 11,060 psi. Fig. 23 is a chart showing the entire treatment, and Fig. 24 shows tubing pressure, slurry rate and proppant concentration. Conclusions Fracpacking has constantly pushed design limits on service tools; and packer pressure differential rating; as well as upper extension, closing sleeve and external casing integrity with the continually increasing pump rates and proppant capacity. All current service tool sizes along with packers and accessory equipment have been tweaked and new equipment developed to meet the increasing job requirements. Upper limits have been reached on some tool sizes! New designs in proppant delivery system will be required if pump rates and proppant capacity continue to increase. Nomenclature GOM – Gulf of Mexico BOE – barrel of oil equivalent bbl/min – barrels per minute ppg – pounds per gallon Acknowledgements The authors express their appreciation to the management of Halliburton Energy Service for allowing publication of this paper and to their fellow industry colleagues who are constantly increasing the design envelope scope to deliver highly efficient well completions. References 1. Ross, C.: “New Tool Designs for High Rate Gravel-
Pack Operations,” Paper SPE 29276, presented at the SPE Asia Pacific Oil & Gas Conference, 20-22 March 1995, Kuala Lumpur, Malaysia.
2. Ross, C., and Roane, T.: “Weight Down System for Floaters,” Paper SPE 73774 presented at the SPE International Symposium and Exhibition on
6 MIKE MULLEN, KEVIN SVATEK, EMILE SEVADJIAN, SANJAY VITTHAL AND TOMMY GRIGSBY AADE-03-NTCE-18
Recirculating 50 BPMCentrifugal Feed Pump
135 BBL MainTank/Blender
50 BBL FlushTank
Dump Line
100 BPM CentrifugalFeed Pump
Frac Pumps (4)Test Fixture
Manifold
Manifold
Fig. 2 – Test flow loop
Fig. 1 – Previous testing results for the 5.0-in. service tool
Rate (bbl/min)
Proppant (lbm)
Proppant Type and Size Type Tool Failure Point
Date Tested
Comments
40 254,285 20/40 CARBOECONOPROP Standard Service
Crossover May 98 Hole in Crossover
40 475,000 20/40 CARBOECONOPROP Frac Service
N/A May 98 Pumps failed, Tool still good
Formation Damage Control held in Lafayette, Louisiana, 20–21 February 2002.
3. Echols, R.H., Oncale, O., Fischer, D., Hubble, T., and Park, D.: “New Weight-Down Gravel Pack Floater System — Case History,” Paper SPE 26723, presented at Offshore Europe 1996.
4. Foster, J., Grigsby, T., and LaFontaine, J.: “The Evolution of Horizontal Completion Techniques for the Gulf of Mexico. Where Have We Been and Where are We Going?,” Paper SPE 53926 presented at the 1999 Asia Pacific Oil and Gas Conference, Jakarta, Indonesia, 20-22 April.
5. Duhon, P., Holley, A., Gardiner, N., and Grigsby, T.: "New Completion Techniques Applied to a Deepwater Gulf of Mexico TLP Completion Successfully Gravel Pack an Openhole Horizontal Interval of 2,400 ft.,” Paper SPE 50146 presented at the 1998 Asia Pacific Oil and Gas Conference, Perth, Australia, 12-14 October.
SI Metric Conversion Factors in x 2.54* E + 01 = mm ft x 3.048* E - 01 = m psi x 6.894 757 E + 00 = kPa bbl x 1.589 873 E - 01 = m3 gal x 3.785 412 E - 03 = m3 bbl/min x 2.649 788 E - 02 = m3/h ppg x 1.198 264 E - 02 = kg/m3 ft x 2.831 685 E - 02 = m3 in x 2.54* E + 01 = mm psi x 6.894 757 E + 00 = kPa
°F (°F –32)/1.8 = °C *Conversion factor is exact CARBOPROP® is a registered trademark of Carbo Ceramics CARBOECONOPROP® is a registered trademark of Carbo Ceramics
AADE -03-NTCE-18 DEEPWATER RESERVOIRS REQUIRING HIGH RATE / HIGH VOLUME FRAC PACKING CONTINUE 7 TO STRETCH DOWNHOLE TOOL CAPABILITIES – LATEST TOOL DESIGN AND QUALIFICATION TESTING RESULTS
BP Aspen Job
Schedule Duncan
Test Slurry (bbl)
Stage Proppant
(lbm)
Total Proppant
(lbm)
Stage Start ppg Finish ppg Avg. ppg Proposed
Rate (bbl/min) Proposed Proposed
1 0.5 2 1.25 94 50 4700 4700 2 2 4 3 187 50 21200 25900 3 4 6 5 277 50 49100 75000 4 6 8 7 342 50 80100 155100 5 8 10 9 362 50 102800 257900 6 10 12 11 359 50 118200 376100 7 12 12 12 358 50 125200 501300 8 N/A N/A 12 358 50 125200 626500 9 N/A N/A 12 1073 50 375600 1002100
10 N/A N/A 12 1431 50 500800 1502900 11 N/A N/A 12 1431 50 500800 2003700
BP Aspen Job
Schedule Duncan
Test Slurry (bbl)
Stage Proppant
(lbm)
Total Proppant
(lbm)
Stage Start ppg Finish ppg Avg. ppg Proposed
Rate (bbl/min) Proposed Proposed
1 0.5 2 1.25 94 60 4700 4700
2 2 4 3 187 60 21200 25900
3 4 6 5 277 60 49100 75000
4 6 8 7 342 60 80100 155100
5 8 10 9 362 60 102800 257900
6 10 12 11 359 60 118200 376100
7 12 12 12 358 60 125200 501300
8 N/A N/A 12 358 60 125200 626500
9 N/A N/A 12 358 60 125200 751700
10 N/A N/A 12 358 60 125200 876900
11 N/A N/A 12 358 60 125200 1002100
12 N/A N/A 12 358 60 125200 1127300
13 N/A N/A 12 358 60 125200 1252500
14 N/A N/A 12 358 60 125200 1377700
15 N/A N/A 12 358 60 125200 1502900
16 N/A N/A 12 358 60 125200 1628100
17 N/A N/A 12 358 60 125200 1753300
18 N/A N/A 12 358 60 125200 1878500
19 N/A N/A 12 358 60 125200 2003700
20 N/A N/A 12 358 60 125200 2128900
Fig. 3 — Test 1: 50 bbl/min Test Pump Schedule
Fig. 4 — Test 2: 60 bbl/min Test Pump Schedule
8 MIKE MULLEN, KEVIN SVATEK, EMILE SEVADJIAN, SANJAY VITTHAL AND TOMMY GRIGSBY AADE-03-NTCE-18
Fig. 5 — Crossover Prior to Test 1: 50 bbl/min test
Fig. 7 — Crossover after 376,100 lbm, Test 1 Run 2: 50 bbl/min test
Fig. 6 — Crossover after 155,100 lbm, Test 1 Run 1: 50 bbl/min test
AADE -03-NTCE-18 DEEPWATER RESERVOIRS REQUIRING HIGH RATE / HIGH VOLUME FRAC PACKING CONTINUE 9 TO STRETCH DOWNHOLE TOOL CAPABILITIES – LATEST TOOL DESIGN AND QUALIFICATION TESTING RESULTS
Fig. 10 — Crossover after 2,003,700 lbm, Test 1 Run 6: End of 50 bbl\min
Fig. 9 — Crossover After 1,002,100 lbm, Test 1 Run 4: 50 bbl\min test
Fig. 8 — Crossover After 626,500 lbm, Test 1 Run 3: 50 bbl\min test
10 MIKE MULLEN, KEVIN SVATEK, EMILE SEVADJIAN, SANJAY VITTHAL AND TOMMY GRIGSBY AADE-03-NTCE-18
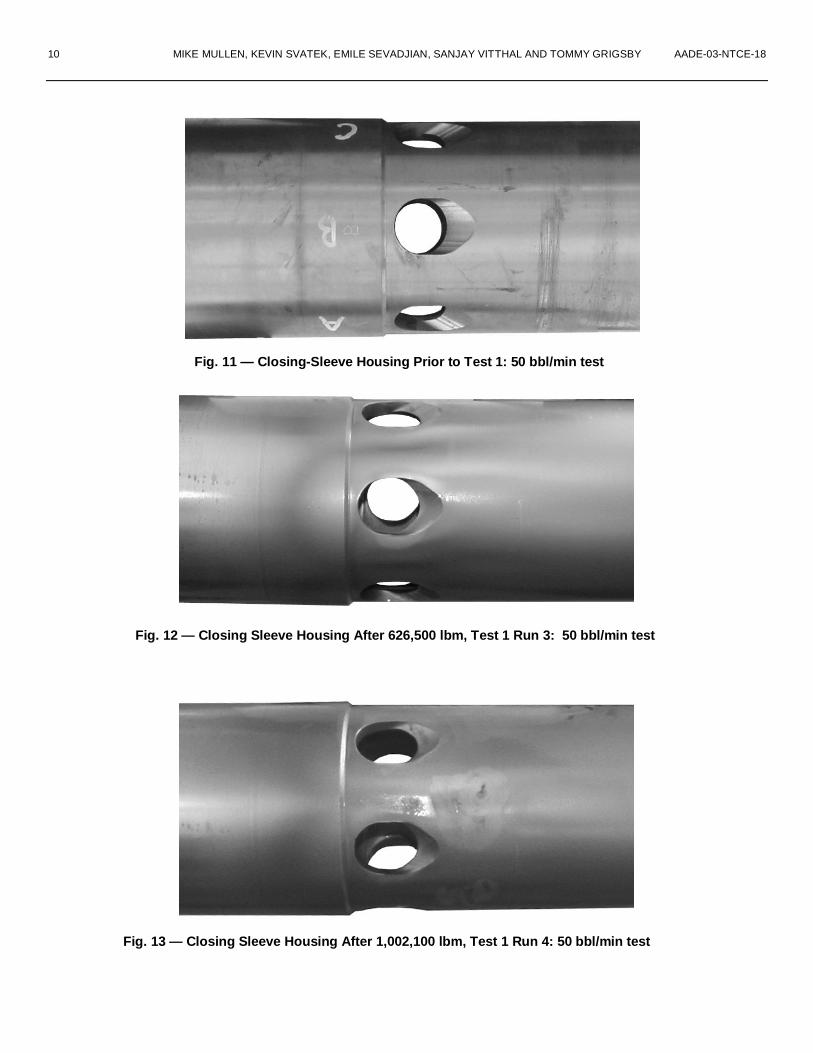
Fig. 12 — Closing Sleeve Housing After 626,500 lbm, Test 1 Run 3: 50 bbl/min test
Fig. 13 — Closing Sleeve Housing After 1,002,100 lbm, Test 1 Run 4: 50 bbl/min test
Fig. 11 — Closing-Sleeve Housing Prior to Test 1: 50 bbl/min test
AADE -03-NTCE-18 DEEPWATER RESERVOIRS REQUIRING HIGH RATE / HIGH VOLUME FRAC PACKING CONTINUE 11 TO STRETCH DOWNHOLE TOOL CAPABILITIES – LATEST TOOL DESIGN AND QUALIFICATION TESTING RESULTS
Fig. 14 — Closing Sleeve Housing After 2,003,700 lbm, Test 1 Run 6, End of 50 bbl/min Test
Fig. 15 — Upper Extension Erosion Pattern at Crossover after 2,003,700 lbm, Test 1 Run 6, End of 50 bbl/min Test
Fig. 16 — Casing Extension Erosion Pattern at Closing Sleeve Ports after 2,003,700 lbm, Test 1 Run 6, End of 50 bbl/min Test
12 MIKE MULLEN, KEVIN SVATEK, EMILE SEVADJIAN, SANJAY VITTHAL AND TOMMY GRIGSBY AADE-03-NTCE-18
Fig. 18 — Crossover After 1,250,000-lbm, Test 2 Run 4, End of 60 bbl/min Test
Fig. 19 — Upper Extension Erosion Pattern at Crossover After 1,250,000 lbm, Test 2 Run 4, End of 60 bbl/min Test
Fig. 17 — Crossover Prior to Test 2: 60 bbl/min Test

AADE -03-NTCE-18 DEEPWATER RESERVOIRS REQUIRING HIGH RATE / HIGH VOLUME FRAC PACKING CONTINUE 13 TO STRETCH DOWNHOLE TOOL CAPABILITIES – LATEST TOOL DESIGN AND QUALIFICATION TESTING RESULTS
Fig. 20 — Casing Extension Erosion Pattern at Flow Sub Ports (less than .020 in erosion) after 1,250,000 lbm, Test 2 Run 4, End of 60 bbl/minTest
11/17/2002 18:00 18:05 18:10 18:15 18:20 11/17/2002 18:25
Time
15000
15250
15500
15750
16000
16250
16500
16750
17000
17250
17500 A
0
10
20
30
40
50
60 B
110
120
130
140
150
160
170
180 C
Slurry Rate (bpm) BHP Top Gauge (psi) BHT Top Gauge (°F) BHT Mid Gauge (°F) BHT Bottom Gauge (°F)
B A C C C
StimWin v4.6.0 04-Feb-03 12:29 Fig. 21 — Minifrac data for treatment
14 MIKE MULLEN, KEVIN SVATEK, EMILE SEVADJIAN, SANJAY VITTHAL AND TOMMY GRIGSBY AADE-03-NTCE-18
11/18/2002 16:10 16:20 16:30 16:40 16:50 17:00 17:10 11/18/2002 17:20
Time
0
2500
5000
7500
10000
12500
15000
17500 A
0
10
20
30
40
50
60
70 B
0
1
2
3
4
5
6
7
8
9
10 C
120
130
140
150
160
170
180
190 D
Tubing Pressure (psi) Slurry Rate (bpm) BH Proppant Conc (lb/gal) BHT Bottom Gauge (°F) BHT Top Gauge (°F) BHT Mid Gauge (°F)
A B C D D D
StimWin v4.6.0 04-Feb-03 13:13 Fig. 23 — Data for the frac-pack treatment
11/18/2002 16:02 16:04 16:06 16:08 16:10 16:12 16:14 16:16 16:18 11/18/2002 16:20
Time
0
2500
5000
7500
10000
12500
15000
17500 A
0
10
20
30
40
50
60
70 B
-1.0
-0.8
-0.6
-0.4
-0.2
0.0
0.2
0.4
0.6
0.8
1.0 C
155
160
165
170
175
180
185 D
Tubing Pressure (psi) Slurry Rate (bpm) BH Proppant Conc (lb/gal) BHT Bottom Gauge (°F) BHT Top Gauge (°F) BHT Mid Gauge (°F)
A B C D D D
StimWin v4.6.0 04-Feb-03 12:55
Fig. 22 — Early time data for the main frac-pack treatment
AADE -03-NTCE-18 DEEPWATER RESERVOIRS REQUIRING HIGH RATE / HIGH VOLUME FRAC PACKING CONTINUE 15 TO STRETCH DOWNHOLE TOOL CAPABILITIES – LATEST TOOL DESIGN AND QUALIFICATION TESTING RESULTS
11/18/2002 16:10 16:20 16:30 16:40 16:50 17:00 17:10 11/18/2002 17:20
Time
0
2500
5000
7500
10000
12500
15000
17500 A
0
10
20
30
40
50
60
70 B
0
1
2
3
4
5
6
7
8
9
10 C Tubing Pressure (psi) Slurry Rate (bpm) BH Proppant Conc (lb/gal) A B C
StimWin v4.6.0 04-Feb-03 13:14
Fig. 24 — Data for the frac-pack treatment