default prediction around the world: international ...default prediction around the world:...
TRANSCRIPT

Default Prediction Around the World: International Evidence on the Role of Corporate Transparency and Market Frictions
Mark Maffett* University of Chicago Booth School of Business
Edward Owens
Simon School of Business, University of Rochester
Anand Srinivasan National University of Singapore
October, 2012
Abstract We document significant heterogeneity across countries in the ability to assess a firm’s likelihood of default using market- and accounting-based sources of default risk information. Surprisingly, for some countries, we find that a default prediction model based solely on public financial reporting information outperforms a model based solely on market variables. Our evidence suggests that variation in the predictive ability of market-based variables across countries is primarily attributable to the existence of capital market frictions, such as short sale constraints, which prevent the incorporation of information into prices, rather than the availability of information. Finally, we document that direct incorporation of accounting information into the default prediction model largely offsets the loss in overall predictive accuracy created by market frictions, especially in countries with high corporate transparency.
_______________________________
Financial support from the University of Chicago Booth School of Business and the University of Rochester Simon School of Business is gratefully acknowledged. We are grateful for comments received from Bill Beaver, Mike Minnis, Shiva Rajgopal, and workshop participants at Emory University. * Corresponding author. Tel.: +17737029656; [email protected].
1
1. Introduction
Over the last fifteen years, numerous episodes of global financial turmoil have created
periods of extreme economic contraction and waves of financial distress. In the wake of these
episodes, the incidence of corporate default around the world has been on the rise. The ability of
market participants, from institutions to individual investors, to assess a company’s likelihood of
default is of first order importance in an economy. Yet, while the factors that affect default
prediction have been studied extensively in U.S. capital markets (e.g., Altman 1968; Beaver
1966; Ohlson 1980; Shumway 2001; Chava and Jarrow 2004; Beaver et al. 2005), little is known
about how market and accounting-based predictors of financial distress perform across countries
and in particular how differences in countries’ information environments affect market
participants’ abilities to assess a company’s likelihood of default. In this paper, we investigate
these issues directly using a broad sample of global defaults to examine cross-country
differences in the predictive accuracy of a commonly used class of default prediction models.
Conceptually, there are compelling reasons to believe that the ability of market
participants to accurately assess default likelihood may vary across countries. For example, prior
U.S.-based research has found that the quality of the accounting inputs is critically important in
determining default model predictive accuracy (e.g. Beaver et al. 2005; Beaver et al. 2012). An
extensive literature has shown that, internationally, the availability of high quality accounting
information varies dramatically (e.g., Leuz et al. 2003; Lang et al. 2012). Further, other country-
level factors, such as the intensity of the information acquisition activities of intermediaries, may
affect the availability of non-accounting-based information (Bushman et al. 2004). A lack of
useful information clearly hampers the ability of market participants’ to predict default.
2
However, in equilibrium, the overall supply of information in a particular economy arises
endogenously in response to market participants’ demand for such information. Given the central
importance of default prediction, even in settings where the supply of information available
through some channels is lacking, it is possible that market demands encourage the acquisition of
information through alternative channels to offset these deficiencies. For example, a lack of high
quality public financial reporting information can be offset through greater private information
acquisition by intermediaries such as institutional investors (Maffett 2012). If such information is
efficiently incorporated into equity prices, similar amounts of default prediction-relevant
information may be available even in settings where some information channels are relatively
weak. Ex ante, it is not obvious how these disparate information channels interact to determine
the equilibrium level of information in a particular economy and how this interplay affects the
ability of market participants to assess default using accounting- and market-based sources of
default risk information.
We begin by examining how market- and accounting-based predictors of default
commonly employed in a U.S.-context perform internationally. To address this question, we
employ a dynamic multiperiod logit default prediction model that includes both market (relative
size, prior return and return volatility) and accounting (return-on-assets, leverage and cash flow-
to-total liabilities) inputs following the procedure suggested in Shumway (2001). While there is
no explicit theory identifying the optimal combination or weighting of market-based and
financial statement-based predictors of financial distress, it has become common practice to
employ a model that combines both classes of predictors (hereafter referred to as a "combined"
model) and allows the relative weightings to be determined empirically (e.g., Shumway 2001;
Chava and Jarrow 2004; Campbell et al. 2008).
3
In our first analysis, we estimate default prediction models both for our pooled global
sample and separately for each of the countries in our sample. Although we find that our set of
market and accounting-based predictors generally behave as expected (in terms of sign and
significance) for the vast majority of our sample, we document significant differences across
countries in model predictive accuracy.1 Specifically, although combined and accounting-only
models demonstrate significant variation, we find that the predictive accuracy of market-only
models differs most across countries. Surprisingly, our results show that for half of the countries
in our sample, a model that uses only accounting information outperforms a model that uses only
market-based variables. This result stands in stark contrast to prior research which has
overwhelmingly found that market-based default predictors are superior to accounting predictors,
as one would expect in an efficient capital market where accounting information is merely a
subset of the total information set reflected in stock price.
In our next set of analyses, we examine the drivers of the observed variation in model
predictive accuracy. Conceptually, two fundamental economic forces could be responsible for
the observed heterogeneity in default prediction: the availability of information about firms’
financial condition (i.e., corporate transparency) and market frictions that restrict the
incorporation of information about firms’ financial condition into prices.2 Bushman et al. (2004)
develop a framework that defines corporate transparency as a function of the numerous facets
within a country that collectively produce, gather, validate and disseminate firm-specific
1 Following prior research, we define predictive accuracy as the cumulative percentage of default observations that fall in the top three estimated default probability deciles, where deciles are constructed based on the estimated default probabilities of both default and non-default sample observations (e.g., Beaver et al. 2012). In robustness analyses we consider an alternate measure based on receiver operating characteristic curves. 2 Although there are also likely differences across countries in the formal legal institutions that surround the resolution of the default process (e.g., bankruptcy laws), in this study we focus on the occurrence of default, rather than on legal bankruptcy filing. We assume that the conditions that signal financial distress and entrance into a default state (i.e., the inability to pay outstanding debt claimants when due) are more general and likely to be determined by similar economic forces across countries. Nonetheless, we also explore a variety of means for controlling differences across countries in the legal origins and resolution mechanisms of the bankruptcy code.
4
information. An extensive prior literature documents how corporate transparency, determined at
both the country- and firm-level, can affect the extent to which a country’s capital markets reflect
information about firm fundamentals (e.g., La Porta et al. 1997; Leuz and Verrecchia 2000; Leuz
et al. 2003; Daske et al. 2008; Lang et al. 2012). Prior default research in a U.S. context supports
this notion by demonstrating that the quality of a firm’s financial reporting information is an
important determinant of the ability to assess a firm’s likelihood of default using market- and
accounting based predictors of financial distress (Beaver et al. 2012).
However, even if relevant and reliable data about firm fundamentals are available, this
information may not be fully reflected in prices if significant capital market frictions exist. An
extensive prior literature demonstrates how frictions can limit the informativeness of equity
prices (e.g., Miller 1977; Diamond and Verrecchia 1987). While numerous sources of capital
market friction exist, we focus on country-level constraints on short selling. Saffi and Sigurdsson
(2011) find that, internationally, stocks with greater short-sale constraints have less informative
prices. Moreover, short-sale constraints explicitly limit the ability of market participants to
incorporate negative information into stock prices, which is likely to be particularly relevant for
default prediction.3
We begin our investigation of the relative importance of these two potential sources of
variation by focusing on cross-country differences in the predictive accuracy of the market-only
model. This initial focus allows for a parsimonious investigation of the relative importance of
both information availability and market frictions, as the informativeness of market-based
sources of default risk information can, in principle, be affected by both forces. Empirically, we
measure country-level information availability following the institutional cluster categorizations
3 While good news may also be useful in predicting defaults, for firms on the verge of financial distress, bad news is likely to be more relevant for assessing the likelihood of an eventual default (Beaver et al. 2012).
5
in Leuz (2010), and constraints on short selling following the details in Bris et al. (2007). In a
country-level multivariate analysis, controlling for differences in the legal origin and resolution
mechanisms of the bankruptcy law, we find evidence that cross-country variation in the ability of
market variables to predict default is primarily attributable to market frictions, rather than the
availability of relevant information. This finding provides some insight into the seemingly
anomalous superior performance of accounting- over market-based sources of default risk
information we observe in some countries. In contrast to the market-only model, we find that
both market frictions and corporate transparency explain a significant portion of the variation in
the predictive accuracy of the combined model. Intuitively, this result is reassuring because the
combined prediction model directly includes financial reporting information, the informativeness
of which should be affected by the strength of the institutional infrastructure.
Given that we have relatively few country-level observations in our regression analysis,
we next seek to corroborate our initial findings through a series of non-parametric tests. In these
analyses, we estimate each prediction model separately across partitions based on country-level
short sale constraints and again across partitions based on country-level corporate transparency.
Overall, the results of these tests further support the conclusion that market frictions are the
primary driver of variation in the performance of the market-only model. These results also shed
some light on the economic importance of our main findings. Specifically, our non-parametric
analyses suggest that market-only model predictive accuracy is twenty-five percentage points
lower in countries with short-sales constraints than in those without short-sales constraints, and
ten percentage points lower in countries with low corporate transparency relative to those with
high corporate transparency.
6
Our non-parametric analysis also reveals that an accounting-only model exhibits little
variation across partitions based on market frictions. The fact that the accounting-only model
performs equally well in the presence of market frictions, leading to a larger relative contribution
of accounting information to combined model predictive accuracy, suggests that the direct
inclusion of accounting information into a combined default prediction model may help to
overcome the loss in predictive ability created by market frictions. To corroborate this inference,
we examine model performance across corporate transparency partitions within the market
friction subsample (i.e., those countries with short sale constraints). If accounting information
indeed helps to offset the loss in market-only model predictive accuracy created by market
frictions, we would expect to see that this ability of financial statement variables to overcome
market frictions is enhanced in settings with high corporate transparency. Consistent with this
prediction, in the presence of short sale constraints we find that the incremental predictive
accuracy gained from the addition of accounting variables to the model is larger when corporate
transparency is relatively high.
Our paper makes several contributions to the existing literature. Foremost, ours is the first
paper (of which we are aware) to document significant heterogeneity in the predictive accuracy
of default models across countries. Prior research on default prediction across countries is
virtually non-existent. We document that, while market- and accounting based sources of default
risk information behave as predicted in the vast majority of countries in our sample, there is
significant heterogeneity in the predictive accuracy of these commonly used default models
across countries, particularly with respect to the market-based predictors. Further, we identify
market frictions, such as short sale constraints, as the primary driver of these differences.
7
Second, we find that the direct inclusion of accounting information improves default
model predictive accuracy in the presence of market frictions, particularly where a strong
institutional infrastructure supports greater corporate transparency. Prior default prediction
literature does not clearly articulate why, other than model misspecification, public financial
reporting information should have any effect on default prediction incremental to market
information. We shed light on this issue by identifying market frictions as an explanation for the
incremental explanatory power of accounting-based sources of default risk information relative
to market-based sources. Moreover, our findings highlight that an important capital market
benefit of greater corporate transparency is improved default prediction ability in the presence of
significant market frictions.
Finally, our results shed light on the implications of short sale constraints. Consistent
with the theoretical arguments of Miller (1977) and Diamond and Verrecchia (1987), an
extensive empirical literature demonstrates that short sale constraints can inhibit the
incorporation negative information into prices. Our findings highlight a significant decrease in
default prediction accuracy as a novel consequence of the loss in informativeness created by
short sale constraints.
The remainder of the paper proceeds as follows: in Section 2, we discuss the related prior
literature and motivation for our study; in Section 3 we describe our research design; in Section 4
we provide a description of our data source and sample selection criteria; in Sections 5 and 6 we
present our empirical results; in Section 7 we conclude.
2. Background and motivation
Although there is an extensive literature examining default prediction in a U.S. context,
there is virtually no evidence on how the ability to assess default, or the relative importance of
8
market versus accounting-based sources of default risk information, varies across countries. Yet,
internationally, there are dramatic differences in the development and efficiency of capital
markets, the extent of corporate transparency and the legal procedures surrounding default, all of
which likely affect both the overall predictive accuracy of default models and the relative
importance of market- versus accounting-based predictive inputs. The goal of our paper is to
understand whether and how this institutional heterogeneity affects default prediction.
The vast majority of prior literature on default prediction has focused on model predictive
accuracy. Shumway (2001) demonstrates that a default prediction model that explicitly accounts
for time-varying covariates and allows a firm’s changing financial data to reveal its changing
health is superior to the single period static approach employed in prior research (e.g., Altman
1968; Ohlson 1980; Zmijewski 1984). Examining an extensive list of potential explanatory
variables, Shumway (2001) finds that a default model that includes a combination of market-
based variables (size, prior returns, and return volatility) and accounting ratios (return-on-assets
and leverage) has the best out of sample classification ability. Following Shumway (2001), it has
become common practice to assess a company’s likelihood of default using a multi-period logit
model including a combination of both market- and accounting based default risk measures. For
example, Campbell et al. (2008) follows the Shumway (2001) approach and estimates a dynamic
logit model using market and accounting information to examine the determinants of corporate
failure and the pricing of financially distressed stocks.
Prior U.S. based literature has also given some consideration to the relative importance of
accounting- and market-based sources of default risk information. This literature has generally
confirmed the presumption that, because stock prices draw information from a variety of sources
of which accounting is a subset, market-based predictors of default should outperform
9
accounting-based predictors. For example, Shumway (2001) shows that, using a hazard model
approach, approximately fifty percent of accounting ratios used in prior research are not
statistically related to bankruptcy. He also notes that a model that uses only market variables also
performs quite well, implicitly suggesting that accounting variables add relatively little
predictive ability over and above market-based variables. Chava and Jarrow (2004) use an
expanded bankruptcy sample within the U.S. to validate the superiority of hazard models over
static models and similarly show that accounting variables add little predictive power over and
above market-based variables in out-of-sample tests. 4 Further, Beaver et al. (2012) document
that the predictive ability of financial statement ratios has declined over time.
An important caveat is that the vast majority of the prior literature on default prediction
has been conducted on firms domiciled in the United States. Inferences from these studies may
have limited generalizability to an international setting given that the U.S. is, arguably, the
world’s most developed and efficient capital market. For example, relative to other countries,
U.S. capital markets have an extensive network of information intermediaries (e.g., analysts,
institutions and the news media), relatively few market frictions (e.g., high liquidity, broad
options markets, few short sale constraints) and high quality corporate financial reporting. It is
not necessarily clear from this line of prior research how accurately market participants would be
able to assess default in the absence of some (or all) of these attributes prevalent in U.S. capital
markets. For example, Beaver et al. (2012), allude to the importance of the underlying
4 Despite the relative dominance of market-based default prediction models over accounting-based models documented in prior literature, it is important to note that these findings do not imply that accounting variables are unimportant in default prediction. Specifically, as pointed out in Beaver et al. (2012), in an efficient market, market-based variables (i.e., prices) likely already incorporate accounting information, such that part of the predictive ability of market-based variables comes from their incorporation of accounting information.
10
information environment to accurate default prediction by demonstrating that the quality of a
firm’s financial reporting has a significant effect on default model predictive accuracy.
Given that deficiencies in one information channel increase the incentives of market
participants to acquire information from other sources, the development of a country’s
information environment is likely to affect not only the overall ability to assess firms’ default
likelihood, but also the relative importance of market- versus accounting-based sources of
default risk information. Given its U.S. focus, prior research has been unable to address these
issues, which are the focus of our study.
3. Research Design
3.1. Primary empirical specification
We follow current literature and estimate a dynamic default prediction model using a
hazard model framework. To implement this approach, Shumway (2001) recommends using a
multiperiod logit model, where each year a firm survives is included as a non-failure observation,
and default observations are included as a failure observation only in the year of failure. We
follow the multiperiod logit approach using six candidate explanatory variables (three accounting
variables plus three market variables) that are used in both Beaver et al. (2005) and Beaver et al.
(2012).5 Specifically, we estimate the following logistic regression with standard errors clustered
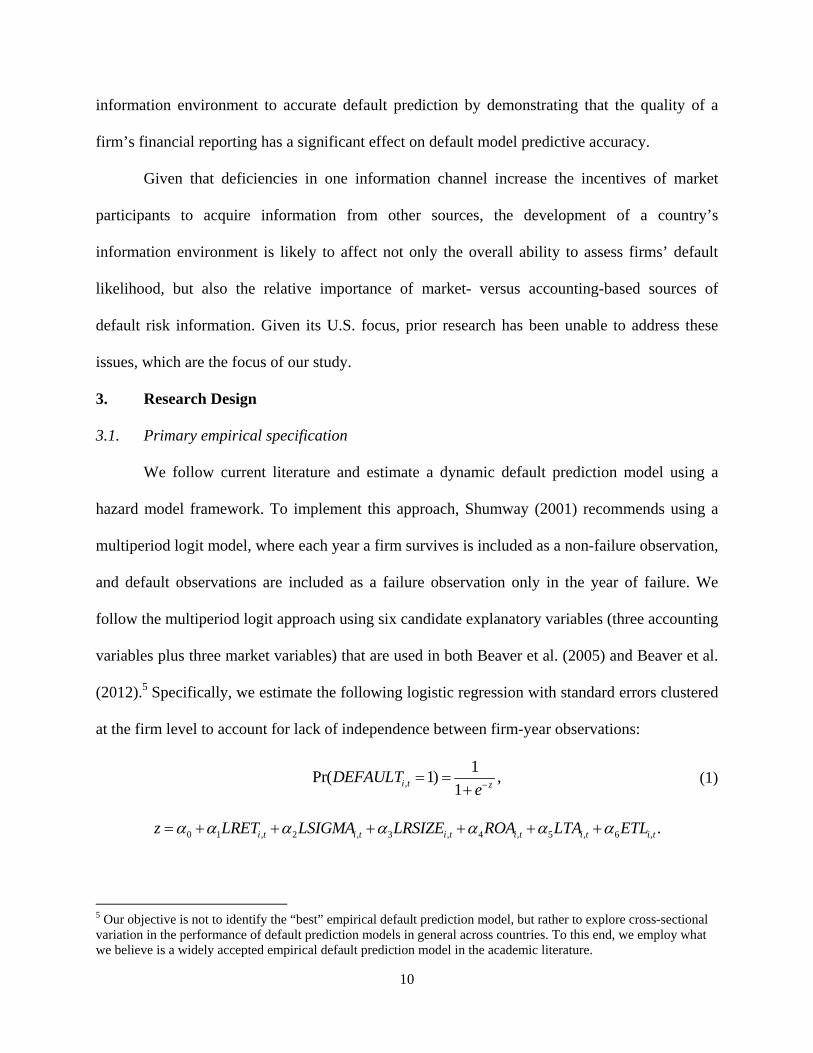
at the firm level to account for lack of independence between firm-year observations:
,
1Pr( 1) ,
1i t zDEFAULT
e
(1)
0 1 , 2 , 3 , 4 , 5 , 6 , .i t i t i t i t i t i tz LRET LSIGMA LRSIZE ROA LTA ETL
5 Our objective is not to identify the “best” empirical default prediction model, but rather to explore cross-sectional variation in the performance of default prediction models in general across countries. To this end, we employ what we believe is a widely accepted empirical default prediction model in the academic literature.
11
DEFAULT is an indicator variable that equals one if the firm-year predictive variables are
measured in the most recently available year immediately preceding a firm's default, and equals
zero otherwise. Note that under this dynamic methodology DEFAULT = 0 includes all firm-year
data for firms that never default, as well as all firm-year data for defaulted firms in years prior to
the year immediately preceding their default. We delete all firm-years of data for defaulted firms
after their default year.
ROA, LTA, and ETL are the accounting-based predictive variables, where ROA is a
measure of profitability (return-on-assets), LTA is a measure of leverage (total liabilities divided
by total assets), and ETL is a cash flow-to-total liabilities ratio (e.g., Beaver, 1966). LRET,
LSIGMA, and LRSIZE are the market-based predictive variables, where LRET is lagged
cumulative stock return, LSIGMA is lagged return volatility, and LRSIZE is the logarithm of a
firm's market capitalization relative to the aggregate sample market capitalization. We use
market data as of the end of the month following the month of financial statement data
availability. For example, if financial statement data are available 04/17/2004, we use market
data as of 05/31/2004. This allows the market time to incorporate the financial statement data, so
that the accounting data do not have an unfair advantage in the default prediction models. We
estimate three versions of Eq. (1) - a specification that omits ROA, LTA, and ETL (i.e., the
market-only model), a specification that omits LRET, LSIGMA, and LRSIZE (i.e., the accounting-
only model), and the full Eq. (1) specification (i.e., the combined model). All variables are
further defined in the Appendix.
3.2. Assessing predictive ability
In order to compare the market-only, accounting-only, and combined models with each
other as well as across countries, we must select an approach for assessing predictive ability.

12
Several methods are offered in extant literature. We adopt the approach followed in Beaver et. al
(2005) and Beaver et al. (2012) and measure a model's predictive ability as the fraction of sample
defaults with a predicted probability of default falling in the top three predicted probability of
default deciles for all sample firm-years.6 That is, after using a given model to estimate predicted
default probabilities for all sample firm-years, we rank the predicted default probabilities into
deciles and note the decile into which each sample observation falls. We then construct the
variable ACCURm (i.e, predictive accuracy of model m) as the cumulative percentage of sample
default observations that fall in the top three deciles when default probabilities are estimated
using model m. In particular, we refer to the predictive accuracy of a market-only model,
accounting-only model, and combined model as ACCURMO, ACCURAO, and ACCURC,
respectively. We examine differences both in ACCURm across sample partitions and in ACCUR
across different models within the same partition, and the statistical significance of these
differences using a Monte Carlo randomization methodology. In robustness tests we consider an
alternative measure of predictive accuracy based on receiver operating characteristic curves,
which we discuss in Section 6.
4. Data and sample selection
4.1. NUS Credit Research Initiative
The principle data source we use in this study is from the National University of
Singapore Risk Management Institute (RMI). In July 2009, RMI launched the Credit Research
Initiative (CRI) to promote research in the credit risk arena.7 The foundation of the CRI is a
database of over 53,000 listed firms in 46 countries across the Asian-Pacific, North American,
Western European and Latin American regions. The principle output of the CRI is daily firm-
6 Although we discuss in the text results only for the first three deciles, we present results for all ten deciles. 7 For more information on this initiative, refer to http://rmicri.org/home/.
13
level default probabilities. The proprietary database that underlies this output, compiled by a
RMI team of nearly thirty people, includes extensive panel data on firm stock price, financial
statement data, and events of defaults from 1990 to the present, categorized by default class. It is
this underlying proprietary database from which we draw our sample data.
The CRI research team collects default events from numerous sources, including
Bloomberg, Compustat, CRSP, Moody's, exchange web sites and media outlets. Because
definitions of credit default can vary across national jurisdictions and between data sources, CRI
continuously attempts to normalize to a common set of default definitions. In the version of the
dataset we use, default events recognized by CRI include "1) bankruptcy filing, receivership,
administration, liquidation, or any other legal impasse to the timely settlement of interest and/or
principal payments; 2) a missed or delayed payment of interest and/or principal, excluding
delayed payments made within a grace period; 3) debt restructuring/distressed exchange."
Delistings or "other exits" are not considered as defaults initially, but are reclassified as defaults
if a firm experiences a default within one year of the delisting. Technical defaults (i.e., covenant
violations) are not included in the definition of default. In addition to these general categories,
CRI separately examines cases that require special attention to determine whether a default event
has actually occurred.
4.2. Sample selection and descriptive statistics
We begin with all default observations in the CRI database, which gives us an initial
default sample of 12,771 default observations. However, the CRI default dataset provides a
separate observation for each instrument that is defaulted upon by a given occurrence of firm
default (e.g., if a firm has two loans outstanding at the time of bankruptcy filing, the bankruptcy
filing would generate two observations in the default dataset). Accordingly, we delete all such
14
"duplicate" observations, leaving 8,258 distinct firm-default observations. Because of the
structure of our empirical tests, in the case where a given firm has multiple defaults in the
database we retain only the first default occurrence for a given firm, which reduces our default
sample to 5,562 firm-level observations. We next delete banks and utilities, leaving 5,416
defaults.
Our analyses require both accounting data and market data. Our primary source for
accounting data is the CRI 'financial statements' dataset. Specifically, we require measures of
return on assets (ROA), cash flow to total liabilities (ETL), and leverage (LTA). The CRI
financial statement dataset initially contains 572,589 firm-year observations after deletion of
banks and utilities, with 84,082, 72,489, and 31,430 missing observations for ROA, ETL, and
LTA, respectively. We attempt to supplement the missing CRI financial statement data with
Worldscope data, where we merge the CRI data with Worldscope based on ISIN. After merging
in Worldscope-based ROA, ETL and LTA, there remain 83,482, 71,640, and 30,691 missing
observations, respectively. 8 After merging the financial statement data into the default sample,
the 5,416 defaults yield 31,703 firm-year observations (i.e., 5,416 default-year observations and
26,287 non-default-year observations). The remaining 533,422 firm-year observations in the
financial statements data set provide the pool of additional non-default-year observations (i.e., all
firm-year observations for firms that never defaulted), yielding a total sample of 565,125 firm-
year observations.
As discussed in section 3, we utilize three market-based measures in our prediction
models. For return (LRET) and return volatility (LSIGMA), our primary data source is the CRI
'pd' dataset, which contains data on closing monthly stock price. When missing (207,428 and
8 The fact that supplementation with data from Worldscope/Datastream adds very few additional observations to the sample suggests that the CRI data are fairly comprehensive.
15
208,975 missing observations out of our 565,125 observation sample for LRET and LSIGMA,
respectively), we supplement the data using Datastream. After merging in Datastream-based
LRET and LSIGMA, there remain 201,018 and 202,355 missing observations, respectively. For
the third market variable, LRSIZE, our primary data source is Datastream, because the use of
Datastream allows us to directly obtain market capitalization in a common currency (i.e., U.S.
dollars) across all sample observations, which obviates the need to engage in currency
conversion on the CRI price data.
We next delete all observations with missing values for any of our three financial
statement variables (ROA, ETL and LTA) or any of our three market variables (LRET, LSIGMA,
and LRSIZE), which leaves a sample of 323,858 firm-year observations. We likewise delete
observations where LSIGMA equals zero (i.e., firms with no price change over the prior twelve
months), as well as all observations from countries with no defaults in the dataset. These
deletions result in a final analysis sample of 321,947 firm-year observations comprised of 2,871
default-year observations and 319,076 non-default-year observations from fiscal years 1989
through 2012. The defaults that underlie the default-year observations span the years 1991
through 2012. Finally, we Winsorize the financial statement variables at the upper and lower
2.5%, and Winsorize LRET and LSIGMA at the upper 2.5% only, because these variables have
natural lower bounds.
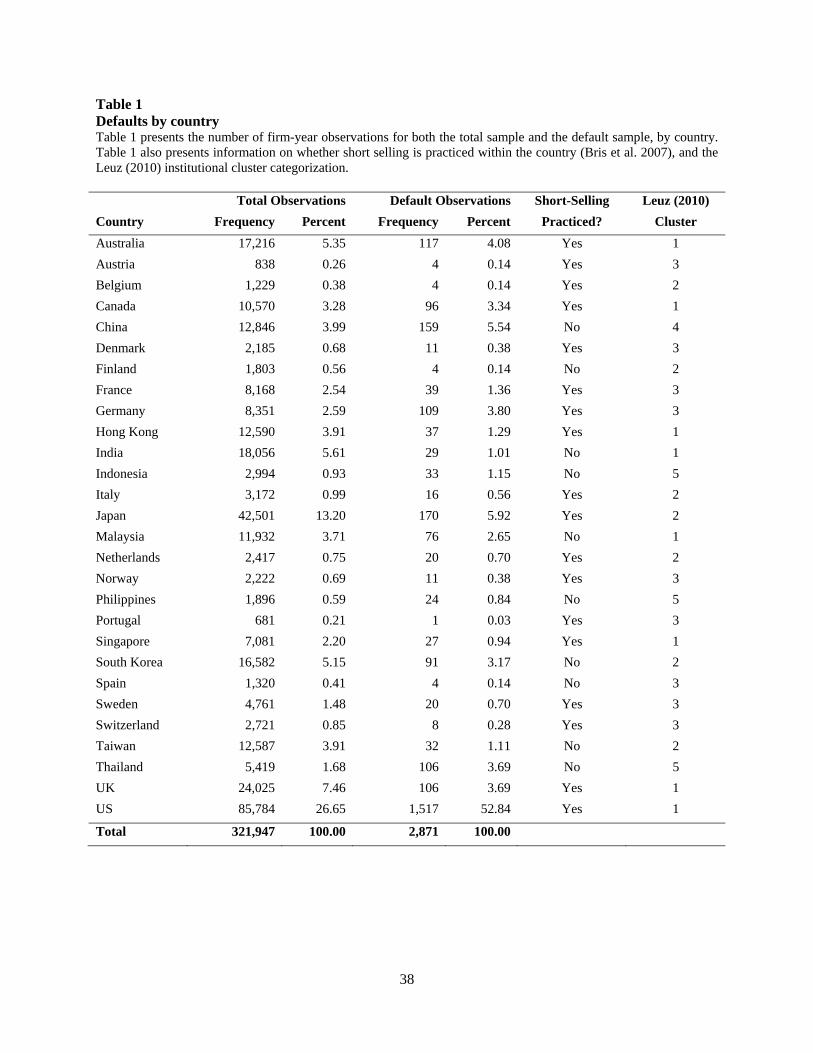
Table 1 presents the total number of sample observations and number of sample default
observations by country. Clearly, the United States is dominant in the overall CRI database, both
in total number of observations (26.65%) and in default observations (52.84%).9 With a few
exceptions, the United States is joined in the high informativeness group primarily by Eurozone
9 In untabulated robustness tests, we find that our key inferences are robust to exclusion of the United States from the analysis.
16
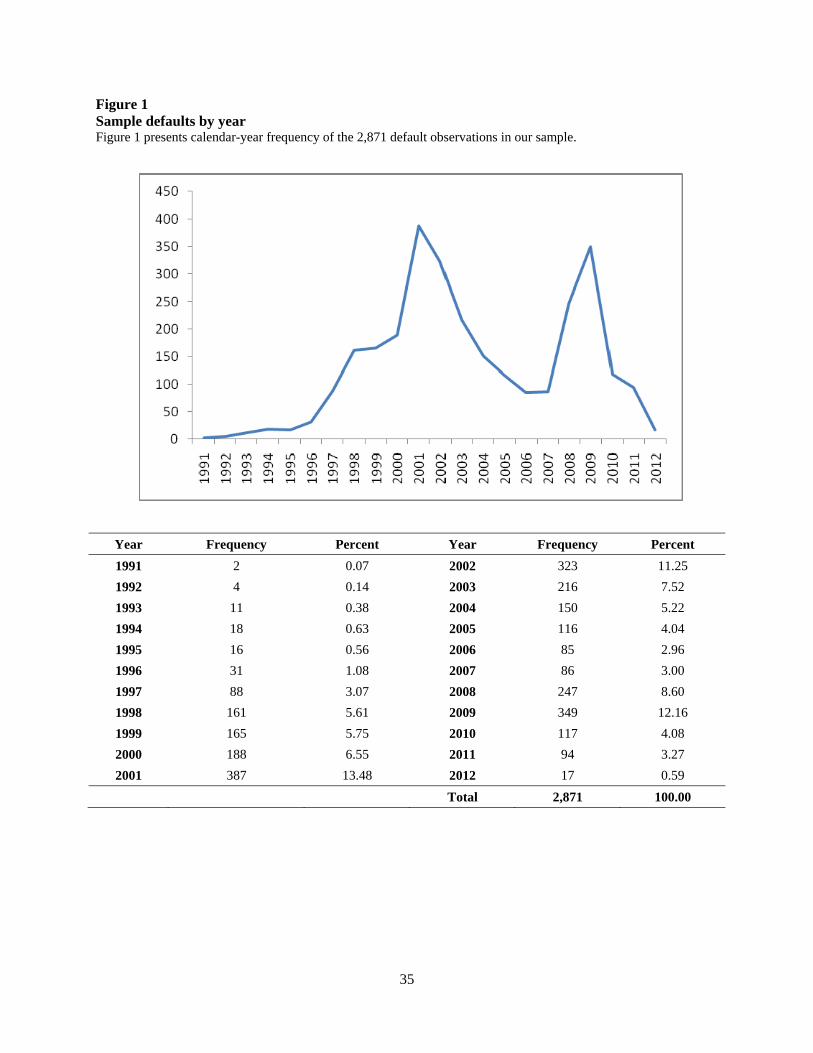
countries. Asia-Pacific nations are also well represented in the sample. Figure 1 presents our
sample default frequency by year. As expected, our sample exhibits a pronounced spike in
default frequency in the years surrounding 2000 and 2008, which roughly coincide with the
aftermath of the Asian financial crisis, the 2001 recession and the 2008 financial crisis.
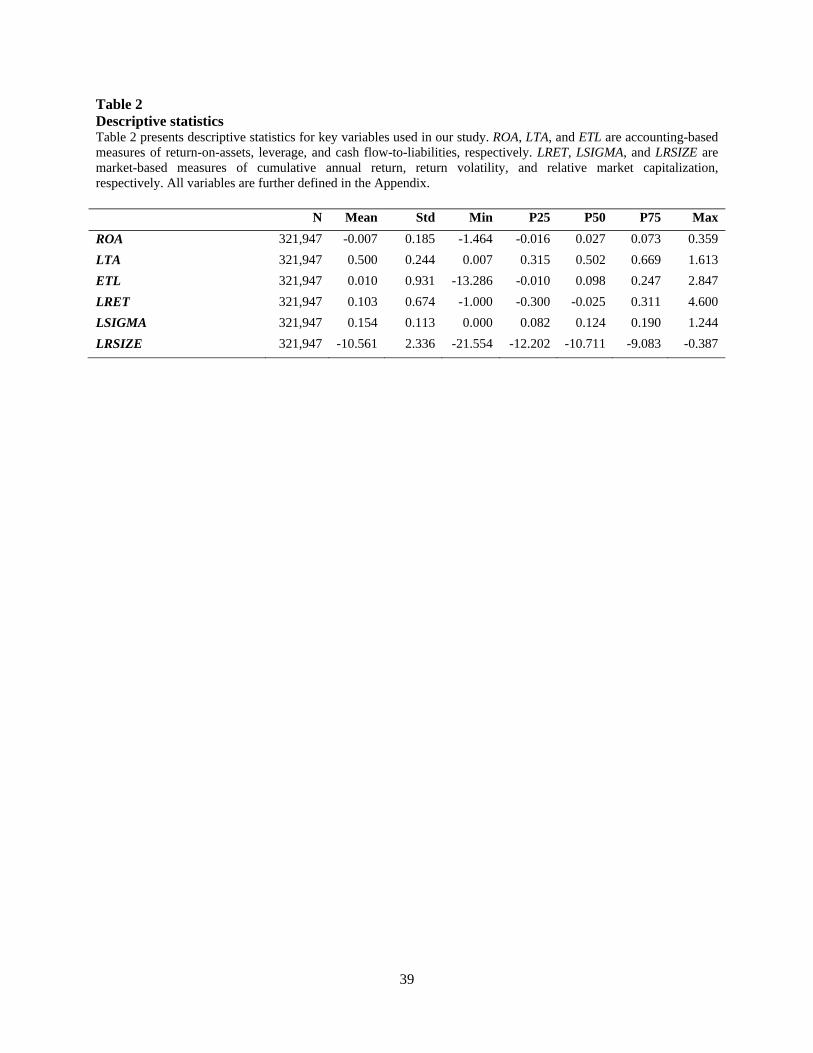
Table 2 presents aggregate sample descriptive statistics for the variables we use in our
default prediction models. Although we use a distinctly different sample and time period, the
overall distributional characteristics of our accounting and market-based predictor variables
appears to be generally similar to those reported in prior studies (e.g., Beaver et al. 2012).
5. International default model estimation
We begin our analysis by estimating default prediction models (i.e., Eq. 1) using our
global pooled sample, with results presented in Table 3. Basic relations revealed by the pooled
estimation reported in Panel A are generally consistent with prior literature that has estimated
similar models using U.S.-only data (e.g., Beaver et. al 2005; Beaver et. al 2012). Specifically,
firms that have higher lagged stock returns (LRET), a larger relative size (LRSIZE), a greater
return-on-assets (ROA) and a higher cash flow to liabilities ratio (ETL) (marginal significance)
are less likely to default, whereas firms with higher return volatility (LSIGMA) and greater
leverage (LTA) are more likely to default. The relatively weak statistical significance of ETL is
consistent with similar findings in Shumway (2001) and Beaver et al. (2005).
Panel B of Table 3 presents the number of default observations falling in each decile of
predicted default probability, where each decile is computed from the combined default and non-
default firm-year observations, and is ranked in descending order (i.e., decile 0 has the highest
predicted default probability). For example, in the combined model, 63.92% of the default-year
observations fall in the highest predicted default probability decile, whereas only 1.08% (i.e.,
17
100%-98.92%) of default firms appear in the lowest predicted default probability decile. As
described earlier, our key focus in terms of model predictive accuracy (ACCUR) is the
cumulative percentage of default firms in the highest three deciles (e.g., Beaver et al. 2005).
Looking at this statistic in Panel B reveals that the combined model predictive accuracy
(ACCURC) is 83.28%, which is similar in magnitude to the comparable statistic in Beaver et al.
(2005). The market-only model predictive accuracy (ACCURMO) is 76.25%, and the accounting-
only model predictive accuracy (ACCURAO) is 78.02%. The observation that ACCURMOis
slightly lower than ACCURAO is noteworthy, as prior studies conducted using U.S.-only data
have exclusively found that the market-only model outperforms the accounting-only model. This
initial finding provides an indication that default prediction models may perform differently in an
international setting.
Table 4 presents results from estimation of the three forms of Eq. (1) (i.e., MO, AO, and
C) by country, for each sample country with greater than ten default observations. Panel A
presents regression statistics by country for the market-only and accounting-only models, and
Panel B presents regression statistics for the combined model. Generally speaking, the relations
between the six predictor variables and default incidence are consistent in sign and significance
across the country-level estimations. For example, in the market-only model, two of the three
predictive variables never enter a country-level regression with a statistically significant sign that
is opposite to the predicted sign. The exception is LRSIZE, which has a statistically significant
negative coefficient in 9.1% of the sample countries. In the accounting-only model, not one of
the three predictive variables enters a country-level regression with a statistically significant sign
that is opposite to the predicted sign.
18
In Panel C of Table 4 we tabulate the predictive accuracy statistics from the estimations
of the default prediction models by country. In general, the mean accuracy statistics across
countries is generally consistent with results from our pooled estimation from Table 3. For
example, the mean predictive accuracy of the combined model across countries is in the mid
80% range (85.8%). Further, once again we find that, on average the accounting-only model
outperforms the market-only model (i.e., mean ACCURMOACCURAO of 5.18). We note wide
variation in the predictive accuracy of the market-only model across countries, ranging from
37.50% in the Philippines to 93.75% in Italy. Interestingly, the variation in combined model
accuracy is less pronounced, ranging from 62.50% in the Philippines to 100% in Norway and
Italy.10 This differential variation also is evident in looking at the respective coefficients of
variation, 0.19 and 0.11, respectively. Another noteworthy observation is that in eleven of the
twenty-two countries examined in Table 4, ACCURMOACCURAO is negative, i.e., accounting
variables outperform market variables in their ability to predict default. In the next section, we
examine potential drivers of the wide variation both in the market-only model predictive
accuracy and in the relative importance of accounting- versus market-based predictors.
6. Determinants of variation in model predictive accuracy
As shown in Panel C of Table 4, there is substantial variation in the predictive accuracy
of the market-only model across countries. Conceptually, two fundamental economic forces
could be responsible for this variation: corporate transparency and market frictions. We next
discuss these two forces and the empirical proxies we use to capture them in forthcoming
analyses. Then, we outline the empirical analyses we employ to examine the relative importance
10 We note that countries at the upper end of these ranges (i.e., Italy, Norway) have relatively few sample defaults, which could explain their high predictive accuracy. We conduct several procedures to ensure that our inferences are not attributable to the number of defaults in a particular country, which we discuss in subsequent sections along with the associated results.
19
of these forces in explaining variation in default model predictive accuracy around the world,
and present associated results.
6.1. Corporate transparency and market frictions
The first force that may explain variation in predictive accuracy of market-based
variables is the existence of differences across countries in the availability of information about
firms' economic condition, i.e., corporate transparency. In reality, corporate transparency reflects
the collective output of numerous components of a system that produces, gathers, and
disseminates information to market participants that are external to a firm (Bushman et al. 2004).
Although it is naturally challenging to come up with a single empirical proxy that captures all
such transparency dimensions, in our forthcoming analyses we rely on the institutional cluster
categorizations in Leuz (2010). Leuz (2010) (p. 246) categorizes countries into five institutional
clusters based on a broad set of institutional features that are fundamentally related to a country's
information environment (e.g., securities regulation, investor protection, enforcement
mechanisms), and shows that these clusters are correlated with the transparency of financial
reporting practices. We note that, although much of the discussion of Leuz (2010) is focused on
corporate reporting regulation, he points out that reporting regulation is a part of a country's
broader institutional framework, and is designed to fit with and reinforce other elements of the
institutional infrastructure. Accordingly, we believe that these clusters serve as a valid proxy not
only for financial reporting transparency, but also for a more general notion of country-level
corporate transparency.
The second potential explanatory force is the existence of differences across countries in
the extent of market frictions which prevent default risk information from being impounded into
market variables. The observation in Panel C of Table 4 that the accounting-only model often
20
outperforms the market-only model suggests that a lack of information about firm economics is
not the sole explanation for the observed heterogeneity in predictive accuracy, indicating that
market frictions may play an important role. We focus on short-sale constraints as our primary
measure of market frictions. Given that short-sale constraints are likely to specifically impede the
incorporation of bad news into prices, they represent a market friction that is particularly likely
to decrease the informativeness of prices with respect to assessing default risk. Using a sample of
firms from 26 countries, Saffi and Sigurdsson (2011) show that stocks with greater short-sale
constraints have less informative prices. Moreover, because short-sale constraints function as a
friction on the incorporation of information into prices, rather than serving as a proxy for the
availability of information in a particular setting, they are unlikely to directly affect firm
fundamental value or the extent to which financial reporting information reflects this underlying
value. We utilize the details in Bris et al. (2007) to categorize each of our sample countries as
allowing or prohibiting short selling.
6.2. Multivariate tests
As an initial test of the relative importance of corporate transparency and market frictions
in explaining variation in default model predictive accuracy, we estimate a country-level
multivariate analysis of the following form using OLS with twenty-two country-level
observations (i.e., the twenty-two countries for which we estimate country-level default
prediction models):
, 0 1 2
1
K
MO c c c k c ck
ACCUR TRANSP SHORT Control
(2)
where ACCUR is as previously defined. We also estimate Eq. (2) with ACCURC as the dependent
variable.
21
SHORTc is an indicator variable that equals one if there are short sale constraints in
country c and equals zero otherwise, following details in Bris et al. (2007). Again, SHORT serves
as our proxy for the existence of market frictions that may prevent market variables from fully
incorporating default risk information. TRANSPc is an indicator that equals one (zero) if country
c is has relatively strong corporate transparency (Leuz [2010] clusters 1 and 2), and equals zero
if country c has relatively weak corporate transparency (Leuz [2010] clusters 3, 4 or 5).11
In this study, we focus on occurrence of default, rather than specifically on legal
bankruptcy filing. We believe that, although there are differences across countries in the
institutions that surround the resolution of the default process, the conditions that signal the
entrance to the default state, i.e., inability to pay debts when due, are more general and are likely
to be determined by similar factors across countries.12 Nonetheless, Eq. (2) also includes a vector
of country-level institutional control variables related to the insolvency regime and legal origin
to ensure that our results are not affected by these institutional differences. Extant literature
provides evidence that bankruptcy use is affected by creditor rights, which are in turn largely
influenced by a country's insolvency regime (Claessens and Klapper 2005). Moreover, the law
and finance literature finds that insolvency practices are strongly correlated with legal origin
(Djankov et al. 2008). Accordingly, for one set of controls we define the following indicator
variables that equal one if foreclosure, liquidation, or reorganization, respectively, is the likely
outcome of a potential insolvency in country c and equal zero otherwise (Djankov et al. 2008):
FCLOSE, LIQUID, and REORG. The second set of controls relates to the legal origin of a
11 In the analyses that follow, inferences are not sensitive to the choice of including Leuz (2010) cluster 3 countries in the TRANSP = 0 versus TRANSP = 1 category. 12 Stated differently, whereas bankruptcy is a legal process that resolves default, the occurrence of default itself is an economic state that arises when a company cannot meet its payments when due. In other words, our dependent variable is more likely determined by firm economics than by country-level legal mechanisms.
22
country’s bankruptcy code, where we define the following indicator variables accordingly:
ENGLISH, FRENCH, GERMAN and NORDIC (Djankov et al. 2008).
Table 5 presents results from estimation of Eq. (2), where columns (1) through (3) use the
predictive accuracy of the market-only model as the dependent variable. Although the analysis
only includes twenty-two observations, we find strong evidence that variation in market-only
model predictive accuracy is driven by market frictions. Specifically, focusing on the full
specification in column (3), the coefficient on SHORT of 22.46 (t-statistic of 4.52) provides
evidence that the market-only model is more (less) accurate in countries where short-selling is
practiced (prohibited). The coefficient on TRANSP, while positive, is statistically insignificant,
suggesting that a country's corporate transparency is not a primary determinant of variation in the
ability of market variables to predict default, i.e., market frictions are the dominant force that
drives cross-country variation in the performance of market-based default prediction models.
Columns (4) through (6) present estimation of Eq. (2) where the dependent variable is the
predictive accuracy of the combined model, i.e., the model that includes both market-based and
accounting-based predictors. Here, we find evidence that predictive accuracy of the combined
model is associated with both market frictions and corporate transparency, although statistical
significance is marginal. Focusing on column (6) for discussion, the coefficient on TRANSP of
6.18 (t-statistic of 1.36) weakly suggests that the predictive accuracy of the combined model is
positively associated with corporate transparency. The coefficient of 5.40 on SHORT (t-statistic
of 1.29), although only marginally significant, has a similar economic magnitude as TRANSP.
Taken together, these results suggest that corporate transparency is more important in the
combined model, and that both forces contribute to predictive accuracy. This result is intuitive,
23
as the combined model includes not only market-based predictors, but also includes predictive
variables that are direct outputs of the corporate reporting system, i.e., financial statement ratios.
Across all specifications, the country-level institutional control variables related to legal
origin are insignificant. The control variables related to bankruptcy resolution mechanisms enter
with some significance depending on the specification, with REORG appearing to be particularly
relevant in the combined model. The interpretation of the positive coefficient on REORG is that
the predictive accuracy of combined default prediction models is greater in countries where
reorganization is the likely resolution of bankruptcy, relative to countries where foreclosure is
the likely resolution.
6.3. Non-parametric analyses
The multivariate analysis outlined above provides an initial indication that market
frictions (as proxied by short-selling constraints) are the dominant force in explaining variation
in the predictive ability of market-based variables. However, we hesitate to draw strong
conclusions based solely on a regression analysis with so few observations. In this section we
seek to corroborate our inferences by utilizing an alternative research design, where we estimate
default prediction models separately across market friction and corporate transparency partitions
using the full sample, and test the differences in model predictive accuracy across partitions
using non-parametric techniques (i.e., Monte Carlo permutation tests).
6.3.1. Market friction partitions
We begin by estimating the default prediction models separately for the SHORT = 0 and
SHORT = 1 sample partitions. Panel A of Table 6 presents associated coefficient estimates and
standard errors. In both market friction regimes, the basic relations between the predictive
variables and incidence of default are generally consistent with prior literature and our pooled
24
results in Table 3. Again, lagged stock return (LRET), relative size (LRSIZE), return-on-assets
(ROA) and the cash flow to liabilities ratio (ETL) are negatively associated with estimated default
probability, whereas return volatility (LSIGMA) and leverage (LTA) are positively associated
with estimated default probability. The R2 values suggest that the default prediction models have
a better fit in SHORT=1 regimes, which is consistent with our expectations. Panel B of Table 6
presents the number of default observations falling in each decile of predicted default probability
within each SHORT regime, where each decile is computed from the combined default and non-
default firm-year observations, and is ranked in descending order (i.e., decile 0 has the highest
predicted default probability).
Panel C of Table 6 summarizes the predictive accuracy metrics from each model in each
market friction regime, and reports significance tests of the difference in accuracy across regimes
based on Monte Carlo randomization testing. Consistent with our multivariate analysis in Table
5, we see that there is a large and highly significant differential in the predictive accuracy of the
market-only model across SHORT partitions, again providing evidence that market frictions are
an important determinant of the ability of market variables to predict default. Specifically, the
predictive accuracy of the market-only model is nearly twenty-five percentage points higher
where short-selling is practiced (81.24 versus 56.27). In contrast, the predictive accuracy of the
accounting-only model shows little difference across market friction regimes, consistent with the
notion that market frictions do not generally inhibit the direct informativeness of financial
statement information. Based on this finding, it is not surprising that the difference in combined
model predictive accuracy across market friction regimes is less severe than that for the market-
only model (i.e., 10.31 versus 24.97).
25
An alternative way of making this latter point can be seen through a cross-regime
comparison of the incremental predictive accuracy of the combined model over the market-only
model, i.e., ACCURCACCURMO, where this difference captures the increase in predictive
accuracy that comes from the addition of financial statement information to the market-based
predictors. Where short-selling is not practiced, the addition of accounting variables improves
predictive accuracy nearly twenty percentage points, compared to only five percentage points
where short-selling is practiced (the difference of 14.66 is highly statistically significant). These
observations suggest the additional inference that the direct use of accounting information in
default prediction helps overcome the effects of market frictions.
6.3.2. Corporate transparency partitions
We next estimate the default prediction models separately for the TRANSP = 0 and
TRANSP = 1 sample partitions. Panel A of Table 7 presents the number of default observations
falling in each decile of predicted default probability within each TRANSP regime (analogous to
the Table 6 Panel B presentation for SHORT regimes). Panel B of Table 7 summarizes the
predictive accuracy metrics from each model in each corporate transparency regime (analogous
to the Table 6 Panel C presentation for SHORT regimes). Here, we refocus on our attempt to
corroborate the Table 5 inference that market frictions are the primary determinant of variation in
market-only model predictive accuracy. Panel B of Table 7 reveals that there is a ten percentage
point difference in predictive accuracy of the market-only model across TRANSP regimes, which
seems to suggest that corporate transparency improves the predictive accuracy of the market-
only model. However, this ten percentage point difference is less than half the magnitude of the
twenty-five percentage point difference in the predictive accuracy of the market-only model
across market friction regimes, as observed in Table 6. Taken together, these results corroborate
26
the inference that market frictions are a more important determinant of market-only predictive
accuracy than is corporate transparency.
Interestingly, the difference in combined model predictive accuracy across transparency
regimes (10.83 percentage points) is almost identical to the difference in combined model
predictive accuracy across market friction regimes (10.31 percentage points, from Table 6). This
observation is likewise consistent with the general nature of the results from the Table 5
multivariate analysis. That is, in the combined model, the separate influences of market frictions
and corporate transparency on predictive accuracy seem to be of roughly equivalent magnitude.
6.3.3. Corporate transparency partitions within market friction subsamples
Recall from our Table 6 analysis that the addition of financial statement-based default
predictors to the market-only model increases predictive accuracy to a greater extent where
short-selling is prohibited, which suggests that the direct inclusion of accounting information in
default prediction can help to overcome the detrimental effects of market frictions. If this
inference is correct, we would then expect to see that, in the presence of frictions, the addition of
accounting information increases predictive accuracy to a greater extent when corporate
transparency (and therefore the quality of reported accounting information) is high. Stated
differently, we expect that the ability of financial statement variables to overcome market
frictions will be mitigated in settings with poor corporate transparency.
To test this dynamic, we estimate the default prediction models across a two-by-two
sample partition sort. That is, we estimate the models separately for the TRANSP = 0 and
TRANSP = 1 partitions within each of the SHORT = 0 and SHORT = 1 subsamples. If the direct
use of accounting information in default prediction indeed helps overcome market frictions, in
the presence of market frictions (i.e., in the SHORT = 0 subsample) we expect to see a larger
27
effect from the addition of accounting information when transparency is high (i.e., in the
TRANSP = 1 partition). Panel A of Table 8 presents the results of this test. The incremental
contribution of accounting information over-and-above market variables is 14.72 percentage
points where transparency is low, which reveals that the direct inclusion of accounting
information contributes to predictive accuracy even when corporate transparency is relatively
low. Notably, this incremental contribution increases to 26.29 percentage points where
transparency is high. As reported, this difference-in-differences of 11.57 is highly statistically
significant, and corroborates our inference that the direct inclusion of accounting information in
default prediction helps overcome the detrimental effects of market frictions on the ability of
market-variables to predict default.
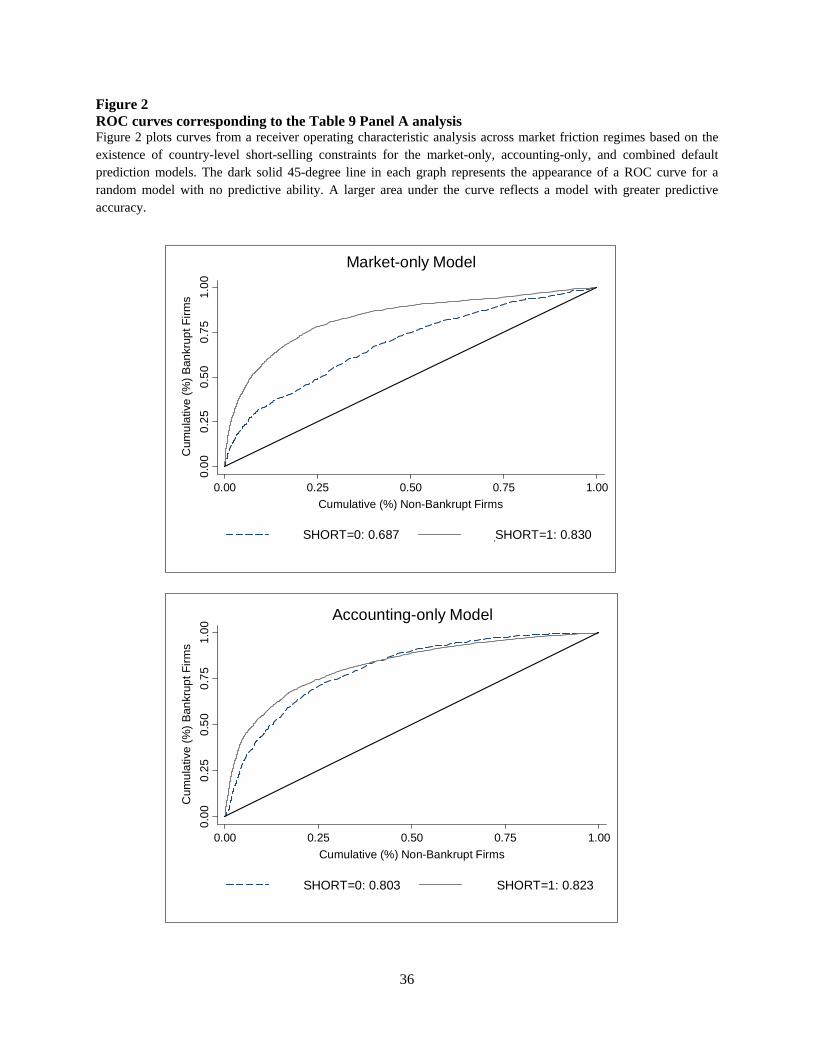
6.3.4. Robustness using receiver operating characteristic curves
To this point, we have measured the predictive accuracy of the default models we analyze
as the cumulative percentage of default observations in the top three estimated default
probability deciles across all sample observations (e.g., Beaver et al. 2012). In this section, we
consider whether our results are robust to an alternate measure of model predictive accuracy, the
area under the receiver operating characteristic (ROC) curve (e.g., Chava and Jarrow 2004).13 To
summarize, ROC curves are cumulative probability curves across the entire sample population
(ordered by estimated default probability) that simultaneously consider how a model performs in
terms of both Type I and Type II errors (i.e., how accurately the model classifies both default and
non-default observations), where the area under the curve is increasing in model accuracy. The
area under a ROC curve is generally expressed relative to the unit square area, where a value of
13 Moody's uses a similar tool called Cumulative Accuracy Profiles to assess model performance (Sobehart et al. 2001).
28
0.5 reflects a random model with no predictive ability, and a value of 1.0 indicates perfect
predictive ability.
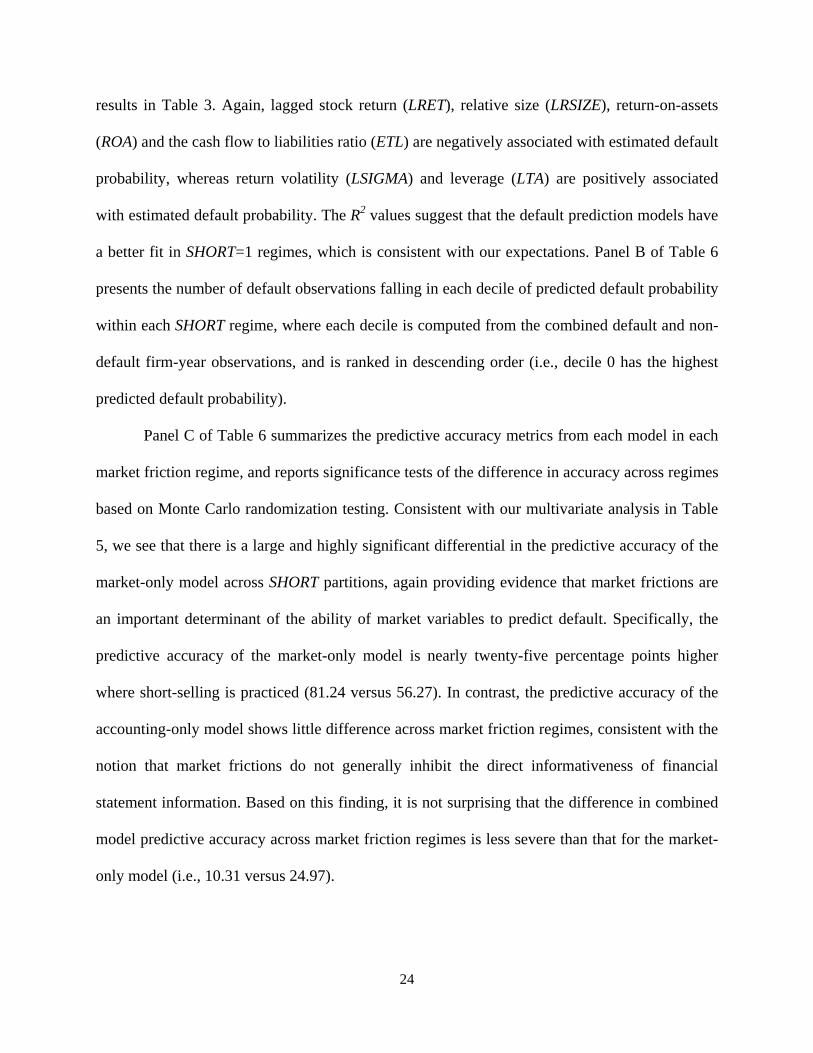
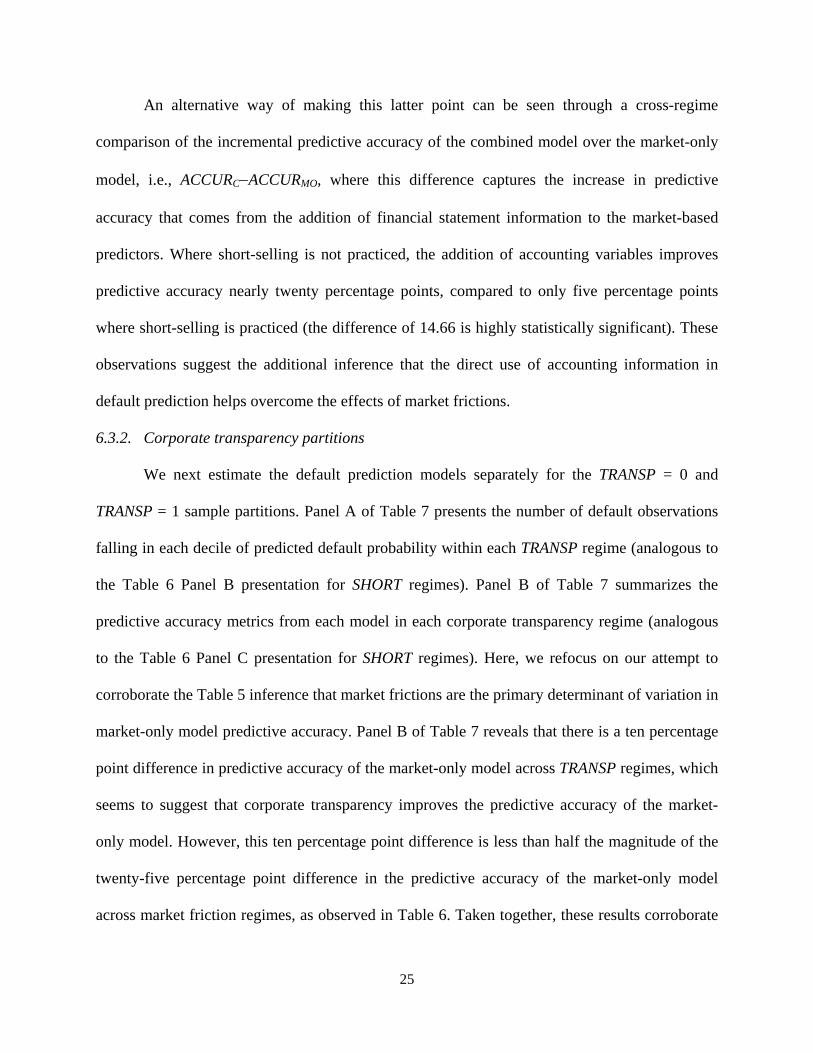
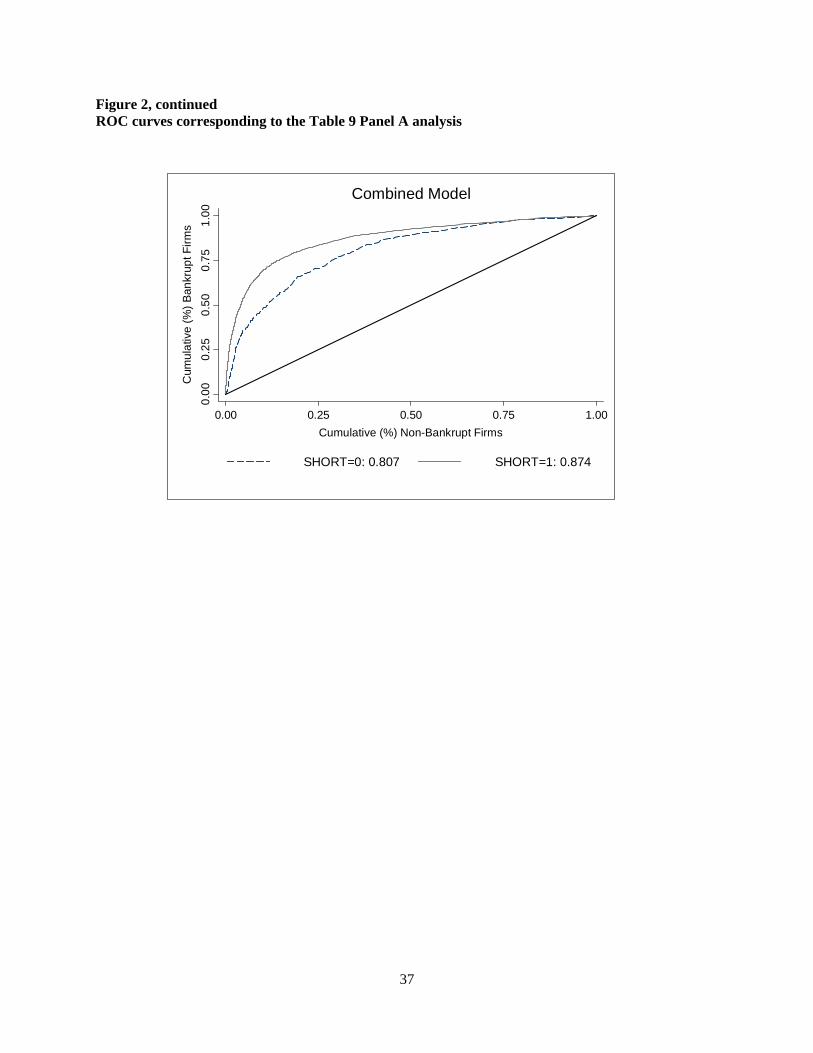
Figure 2 plots the ROC curves that correspond to the market-only, accounting-only, and
combined models for both market friction regimes. The solid 45-degree line represents the no-
predictive-ability benchmark model, and the solid (dashed) curve represents the ROC curve for
the low (high) market friction partition. To aid interpretation, consider the curve for the
combined model in the low friction partition. The underlying full sample has been ranked by
estimated default probability, where estimated default probability decreases as the graph moves
away from the origin (note that estimated default probability is not reflected on either axis). One
of the points on that curve is approximately [0.15, 0.75]. The interpretation of this point is that, at
the particular estimated default probability underlying this point, 75% of the default observations
have a higher estimated default probability while only 15% of the non-default observations have
a higher estimated default probability.
Table 9 presents results from the ROC curve robustness analyses. Specifically, Panel A
repeats the market friction partition analysis from Table 6, Panel B repeats the corporate
transparency partition analysis from Table 7, and Panels C and D repeat the two-by-two partition
analysis from Table 8. To summarize, the pattern of results found across the panels in Table 9
are consistent with results and inferences made using our primary measure of predictive
accuracy. For example, a comparison of the differences in the ROC curve areas in the market-
only models in Panels A and B shows that the difference in predictive accuracy is more
pronounced across market friction partitions than across corporate transparency partitions (0.143
versus 0.057), and Panel A again shows that the addition of direct accounting information
29
improves predictive accuracy to a larger extent where significant frictions exist (0.120 versus
0.044).
6. Conclusion
While the factors that affect default prediction have been studied extensively in U.S.
capital markets, little is known from prior literature about how market and accounting-based
predictors of financial distress perform across countries and in particular how differences in
countries’ information environments affect market participants’ abilities to assess a company’s
likelihood of default. In this paper, we investigate these issues directly using a broad sample of
global defaults to examine cross-country differences in the predictive accuracy of a commonly
used class of default prediction models.
Although we find that our set of market and accounting-based predictors of default
generally behave as expected (in terms of sign and significance) for the vast majority of our
sample countries, we document significant differences across countries in the predictive accuracy
of these models, where the predictive ability of market-based variables differs most across
countries. Surprisingly, our results show that for half of the countries in our sample, a model that
uses only accounting information outperforms a model that uses only market-based variables.
This result stands in stark contrast to prior research which has overwhelmingly found that
market-based default predictors are superior to accounting predictors.
We also find evidence that cross-country variation in the ability of market variables to
predict default is primarily attributable to market frictions, rather than the availability of relevant
information. This finding provides some insight into the seemingly anomalous superior
performance of accounting- over market-based sources of default risk information that we
observe in some sample countries. In contrast to the market-only model, we find that both market

30
frictions and corporate transparency explain a significant portion of the variation in the
predictive accuracy of the combined model. Intuitively, this result is reassuring because the
combined prediction model directly includes financial reporting information, the informativeness
of which should be affected by the strength of the institutional infrastructure.
We find evidence that the direct inclusion of accounting information in default prediction
models helps to overcome the effects of market frictions, particularly in countries with relatively
high corporate transparency. Prior default prediction literature does not clearly articulate why,
other than model misspecification, public financial reporting information should have any effect
on default prediction incremental to market information. We shed light on this issue by
identifying market frictions as an explanation for the incremental explanatory power of
accounting-based sources of default risk information relative to market-based sources. Moreover,
our findings highlight improved default prediction accuracy in the presence of significant market
frictions as an additional capital market benefit of greater corporate transparency.
Consistent with extant literature, we do not attempt to quantify and incorporate variables
into the prediction models that capture publicly available information from non-accounting
sources, such as analyst outputs or media reports. It is unclear why extant literature has ignored
these sources of information in default prediction, other than the apparent assumption that
market-based variables likely incorporate default risk-relevant information from these alternate
information providers. One implication of our study is that, in the presence of market frictions,
this omission is not innocuous because information contained in these alternate sources may not
be imbedded in market-based variables. Therefore, including such variables may further improve
default prediction accuracy where significant market frictions exist. This issue remains an
interesting avenue for further study.

31
Appendix Variable definitions Subscripts i and t refer to a particular firm and fiscal year, respectively. Subscript c refers to a country, and subscript m refers to a particular default prediction model (market-only, accounting-only, or combined). ACCURm The predictive accuracy of default prediction model m, measured as the
cumulative percentage of default firm observations in the highest three predicted default probability deciles, where deciles are computed from combined default and non-default firm-year observations.
DEFAULTi,t An indicator variable that equals one if firm i has a default event in year t, and equals zero otherwise, where default events are identified from the RMI data from National University of Singapore.
ENGLISHc An indicator variable that equals one if the bankruptcy code in country c has an English legal origin, and equals zero otherwise.
ETLi,t Cash-flow-to-total liabilities ratio for firm i in year t; calculated from the RMI data as cash flow from operations divided by total liabilities.
FCLOSEc A variable that equals one if the hypothetical firm in Djankov et al. (2008) is most likely to undergo a foreclosure given the hypothetical circumstances presented, and equals zero otherwise.
FRENCHc An indicator variable that equals one if the bankruptcy code in country c has a French legal origin, and equals zero otherwise.
GERMANc An indicator variable that equals one if the bankruptcy code in country c has a German legal origin, and equals zero otherwise.
LIQUIDc A variable that equals one if the hypothetical firm in Djankov et al. (2008) is most likely to undergo a liquidation given the hypothetical circumstances presented, and equals zero otherwise.
LRETi,t Twelve month cumulative stock return for firm i ending in the month following firm i's financial statement availability for fiscal year t; calculated from the NUS RMI price data file.
LRSIZEi,t The natural logarithm of firm i's relative size, computed at the end of the month following firm i's fiscal year t financial statement data availability; relative size is computed as firm i's stock market capitalization (in U.S. dollars) divided by the aggregate sample market capitalization (in U.S. dollars), where stock market capitalization is obtained from Datastream.
LSIGMAi,t Standard deviation of firm i's monthly stock return for the twelve months ending in the month following firm i's financial statement availability for fiscal year t; calculated from the NUS RMI price data file.
LTAi,t Leverage ratio for firm i in year t; calculated from the RMI data as total liabilities divided by total assets.
32
NORDICc An indicator variable that equals one if the bankruptcy code in country c has a Nordic legal origin, and equals zero otherwise.
REORGc A variable that equals one if the hypothetical firm in Djankov et al. (2008) is most likely to undergo a reorganization given the hypothetical circumstances presented, and equals zero otherwise.
ROAi,t Return on assets for firm i in year t; calculated from the RMI data as net income divided by lagged total assets.
SHORTc A country-level price informativeness measure based on short-sales ability in country c; an indicator variable that equals one if short-selling is allowed/practiced in country c (i.e., "high" price informativeness) and equals zero otherwise (i.e., "low" price informativeness), where the coding is done based on the analysis in Bris et al. (2007).
TRANSPc An indicator variable that equals one if country c has a relatively strong corporate transparency (Leuz [2010] cluster 1 or 2), and equals zero otherwise (Leuz [2010] cluster 3, 4, or 5).
33
REFERENCES
Altman, E., 1968. Financial ratios, discriminant analysis and the prediction of corporate bankruptcy. Journal of Finance 23, 589-609.
Beaver, W., 1966. Financial ratios as predictors of failure. Journal of Accounting Research 4, 71-
111. Beaver, W., Correia, M., McNichols, M., 2012. Do differences in financial reporting attributes
impair the predictive ability of financial ratios for bankruptcy? Forthcoming, Review of Accounting Studies.
Beaver, W., McNichols, M., Rhie, J., 2005. Have financial statements become less informative?
Evidence from the ability of financial ratios to predict bankruptcy. Review of Accounting Studies 10, 93-122.
Bris, A., Goetzmann, W., Zhu, N., 2007. Efficiency and the bear: Short sales and markets around
the world. Journal of Finance 62 (3), 1029-1079. Bushman, R., Piotroski, J., Smith, A., 2004. What determines corporate transparency? Journal of
Accounting Research 42 (2), 207-252. Campbell, J., Hilscher, J., Szilagyi, J., 2008. In search of distress risk. Journal of Finance 63 (6),
2899-2939. Chava, S., Jarrow, R., 2004. Bankruptcy prediction with industry effects. Review of Finance 8,
537-569. Claessens, S., Klapper, L., 2005. Bankruptcy around the world: explanations of its relative use.
American Law and Economics Review 7 (1), 253-283. Djankov, S., Hart, O., McLiesh, C., Shleifer, A., 2008a. Debt enforcement around the world.
Journal of Political Economy 116 (6), 1105-1149. Durnev, A., Morck, R., Yeung, B., Zarowin, P., 2003. Does greater firm-specific return variation
mean more or less informed stock pricing? Journal of Accounting Research 41 (5), 797-836. Fernandes, N., Ferreira, M., 2009. Insider trading laws and stock price informativeness. Review
of Financial Studies 22, 1845-1887. Hillegeist, S., Keating, E., Cram, D., Lundstedt, K., 2004. Assessing the probability of
bankruptcy. Review of Accounting Studies 9, 5-34. Lang, M., Lins, K., Maffett, M., 2012. Transparency, liquidity and valuation: International
evidence on when transparency matters most. Journal of Accounting Research 50 (3), 729-774.
34
Leuz, C., 2010. Different approaches to corporate reporting regulation: how jurisdictions differ
and why. Accounting and Business Research 40 (3), 229-256. Leuz, C., Nanda, D., Wysocki, P., 2003. Earnings management and investor protection: An
international comparison. Journal of Financial Economics 69, 505-527. Maffett, M., 2012. Financial reporting opacity and informed trading by international institutional
investors. Journal of Accounting and Economics, forthcoming. Morck, R., Yeung, B., Yu, W., 2000. The information content of stock markets: why do
emerging markets have synchronous stock price movements? Journal of Financial Economics 58, 215-260.
Ohlson, J., 1980. Financial ratios and the probabilistic prediction of bankruptcy. Journal of
Accounting Research 18, 109-131. Saffi, P., Sigurdsson, K., 2011. Price efficiency and short selling. Review of Financial Studies 24
(3), 821-852. Shumway, T., 2001. Forecasting bankruptcy more accurately: A simple hazard model. Journal of
Business 74, 101-124. Sobehart, J., Keenan, S., Stein, R., 2001. Benchmarking quantitative default risk models: a
validation methodology. ALGO Research Quarterly 4, 57-72. Vassalou, M., Xing, Y., 2004. Default risk in equity returns. Journal of Finance 59, 831-868. Zmijewski, M.,1984. Methodological issues related to the estimation of financial distress
prediction models. Journal of Accounting Research 22, 59-82.
35
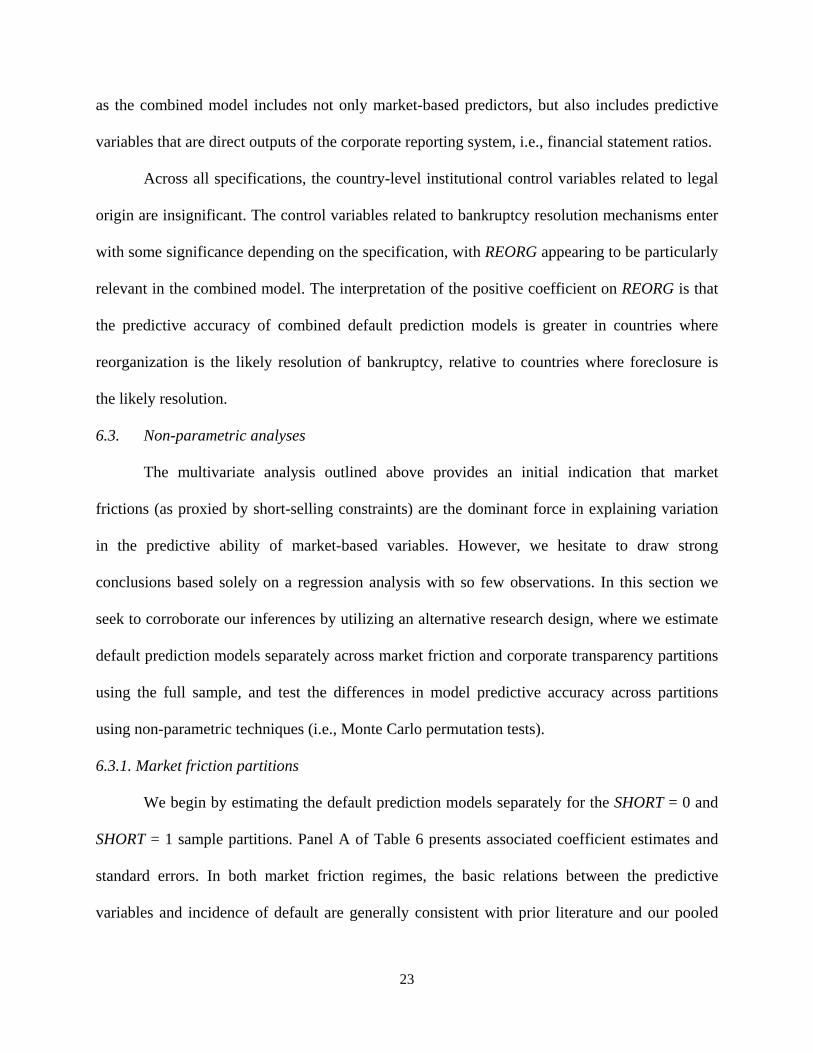
Figure 1 Sample defaults by year Figure 1 presents calendar-year frequency of the 2,871 default observations in our sample.
Year Frequency Percent Year Frequency Percent
1991 2 0.07 2002 323 11.25
1992 4 0.14 2003 216 7.52
1993 11 0.38 2004 150 5.22
1994 18 0.63 2005 116 4.04
1995 16 0.56 2006 85 2.96
1996 31 1.08 2007 86 3.00
1997 88 3.07 2008 247 8.60
1998 161 5.61 2009 349 12.16
1999 165 5.75 2010 117 4.08
2000 188 6.55 2011 94 3.27
2001 387 13.48 2012 17 0.59
Total 2,871 100.00
36
0.0
00
.25
0.5
00
.75
1.0
0
Cum
ula
tive
(%)
Ban
krup
t Fir
ms
0.00 0.25 0.50 0.75 1.00
Cumulative (%) Non-Bankrupt Firms
HPI_SHORT=0: 0.687 HPI_SHORT=1: 0.830
Market-only Model
0.0
00
.25
0.5
00
.75
1.0
0
Cum
ula
tive
(%)
Ban
krup
t Fir
ms
0.00 0.25 0.50 0.75 1.00
Cumulative (%) Non-Bankrupt Firms
HPI_SHORT=0: 0.803 HPI_SHORT=1: 0.823
Accounting-only Model
Figure 2 ROC curves corresponding to the Table 9 Panel A analysis Figure 2 plots curves from a receiver operating characteristic analysis across market friction regimes based on the existence of country-level short-selling constraints for the market-only, accounting-only, and combined default prediction models. The dark solid 45-degree line in each graph represents the appearance of a ROC curve for a random model with no predictive ability. A larger area under the curve reflects a model with greater predictive accuracy.
37
0.0
00
.25
0.5
00
.75
1.0
0
Cum
ula
tive
(%)
Ban
krup
t Fir
ms
0.00 0.25 0.50 0.75 1.00
Cumulative (%) Non-Bankrupt Firms
HPI_SHORT=0: 0.807 HPI_SHORT=1: 0.874
Combined Model
Figure 2, continued ROC curves corresponding to the Table 9 Panel A analysis
38
Table 1 Defaults by country Table 1 presents the number of firm-year observations for both the total sample and the default sample, by country. Table 1 also presents information on whether short selling is practiced within the country (Bris et al. 2007), and the Leuz (2010) institutional cluster categorization. Total Observations Default Observations Short-Selling Leuz (2010)
Country Frequency Percent Frequency Percent Practiced? Cluster
Australia 17,216 5.35 117 4.08 Yes 1
Austria 838 0.26 4 0.14 Yes 3
Belgium 1,229 0.38 4 0.14 Yes 2
Canada 10,570 3.28 96 3.34 Yes 1
China 12,846 3.99 159 5.54 No 4
Denmark 2,185 0.68 11 0.38 Yes 3
Finland 1,803 0.56 4 0.14 No 2
France 8,168 2.54 39 1.36 Yes 3
Germany 8,351 2.59 109 3.80 Yes 3
Hong Kong 12,590 3.91 37 1.29 Yes 1
India 18,056 5.61 29 1.01 No 1
Indonesia 2,994 0.93 33 1.15 No 5
Italy 3,172 0.99 16 0.56 Yes 2
Japan 42,501 13.20 170 5.92 Yes 2
Malaysia 11,932 3.71 76 2.65 No 1
Netherlands 2,417 0.75 20 0.70 Yes 2
Norway 2,222 0.69 11 0.38 Yes 3
Philippines 1,896 0.59 24 0.84 No 5
Portugal 681 0.21 1 0.03 Yes 3
Singapore 7,081 2.20 27 0.94 Yes 1
South Korea 16,582 5.15 91 3.17 No 2
Spain 1,320 0.41 4 0.14 No 3
Sweden 4,761 1.48 20 0.70 Yes 3
Switzerland 2,721 0.85 8 0.28 Yes 3
Taiwan 12,587 3.91 32 1.11 No 2
Thailand 5,419 1.68 106 3.69 No 5
UK 24,025 7.46 106 3.69 Yes 1
US 85,784 26.65 1,517 52.84 Yes 1
Total 321,947 100.00 2,871 100.00
39
Table 2 Descriptive statistics Table 2 presents descriptive statistics for key variables used in our study. ROA, LTA, and ETL are accounting-based measures of return-on-assets, leverage, and cash flow-to-liabilities, respectively. LRET, LSIGMA, and LRSIZE are market-based measures of cumulative annual return, return volatility, and relative market capitalization, respectively. All variables are further defined in the Appendix. N Mean Std Min P25 P50 P75 Max
ROA 321,947 -0.007 0.185 -1.464 -0.016 0.027 0.073 0.359
LTA 321,947 0.500 0.244 0.007 0.315 0.502 0.669 1.613
ETL 321,947 0.010 0.931 -13.286 -0.010 0.098 0.247 2.847
LRET 321,947 0.103 0.674 -1.000 -0.300 -0.025 0.311 4.600
LSIGMA 321,947 0.154 0.113 0.000 0.082 0.124 0.190 1.244
LRSIZE 321,947 -10.561 2.336 -21.554 -12.202 -10.711 -9.083 -0.387
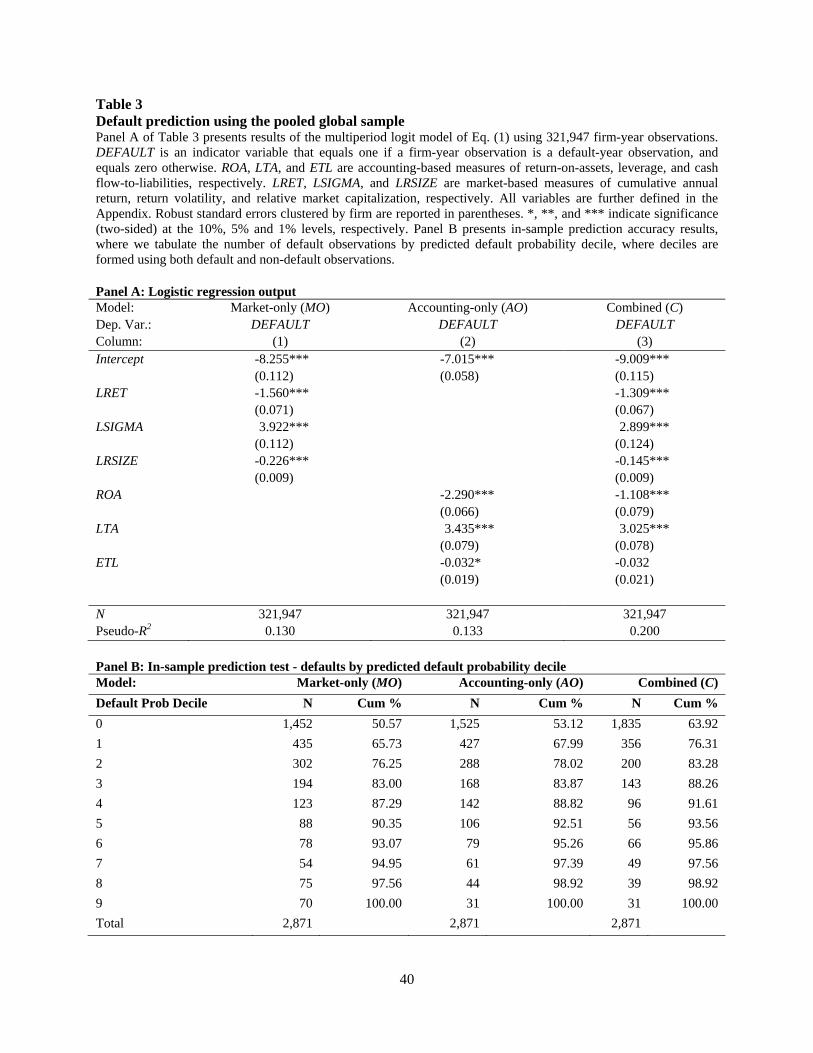
40
Table 3 Default prediction using the pooled global sample Panel A of Table 3 presents results of the multiperiod logit model of Eq. (1) using 321,947 firm-year observations. DEFAULT is an indicator variable that equals one if a firm-year observation is a default-year observation, and equals zero otherwise. ROA, LTA, and ETL are accounting-based measures of return-on-assets, leverage, and cash flow-to-liabilities, respectively. LRET, LSIGMA, and LRSIZE are market-based measures of cumulative annual return, return volatility, and relative market capitalization, respectively. All variables are further defined in the Appendix. Robust standard errors clustered by firm are reported in parentheses. *, **, and *** indicate significance (two-sided) at the 10%, 5% and 1% levels, respectively. Panel B presents in-sample prediction accuracy results, where we tabulate the number of default observations by predicted default probability decile, where deciles are formed using both default and non-default observations. Panel A: Logistic regression output Model: Market-only (MO) Accounting-only (AO) Combined (C) Dep. Var.: DEFAULT DEFAULT DEFAULT Column: (1) (2) (3) Intercept -8.255*** -7.015*** -9.009*** (0.112) (0.058) (0.115) LRET -1.560*** -1.309*** (0.071) (0.067) LSIGMA 3.922*** 2.899*** (0.112) (0.124) LRSIZE -0.226*** -0.145*** (0.009) (0.009) ROA -2.290*** -1.108*** (0.066) (0.079) LTA 3.435*** 3.025*** (0.079) (0.078) ETL -0.032* -0.032 (0.019) (0.021) N 321,947 321,947 321,947 Pseudo-R2 0.130 0.133 0.200
Panel B: In-sample prediction test - defaults by predicted default probability decile Model: Market-only (MO) Accounting-only (AO) Combined (C)
Default Prob Decile N Cum % N Cum % N Cum %
0 1,452 50.57 1,525 53.12 1,835 63.92
1 435 65.73 427 67.99 356 76.31
2 302 76.25 288 78.02 200 83.28
3 194 83.00 168 83.87 143 88.26
4 123 87.29 142 88.82 96 91.61
5 88 90.35 106 92.51 56 93.56
6 78 93.07 79 95.26 66 95.86
7 54 94.95 61 97.39 49 97.56
8 75 97.56 44 98.92 39 98.92
9 70 100.00 31 100.00 31 100.00
Total 2,871 2,871 2,871
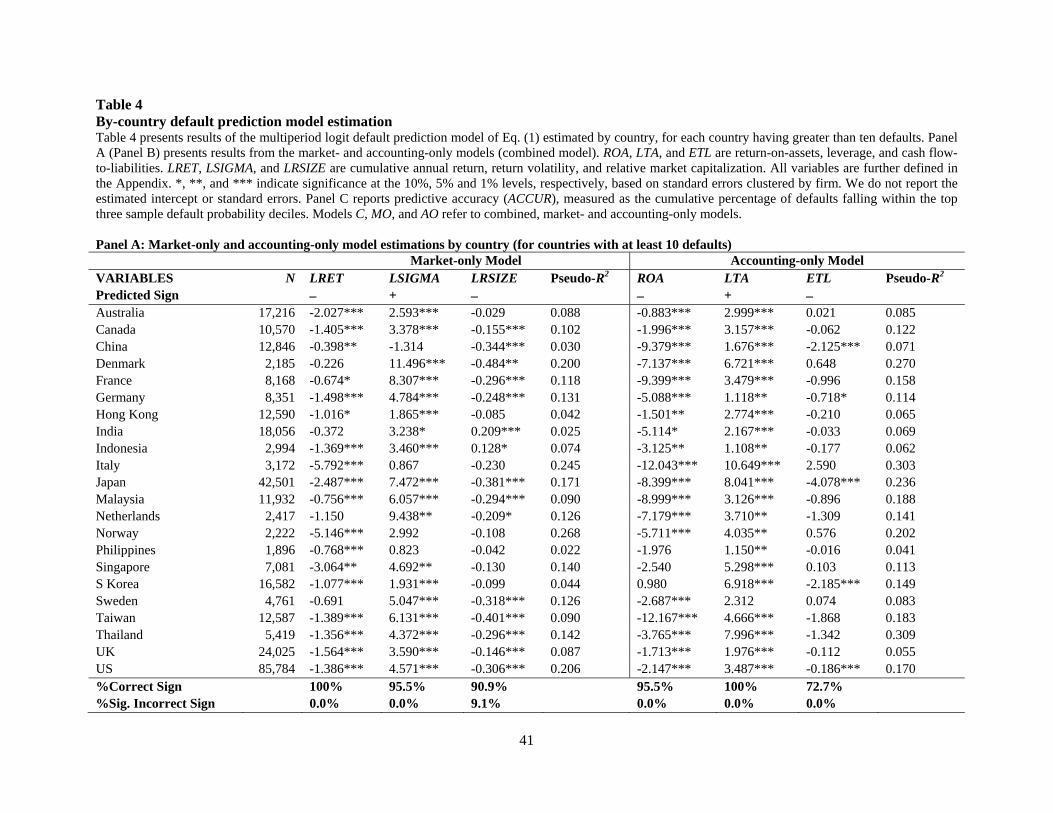
41
Table 4 By-country default prediction model estimation Table 4 presents results of the multiperiod logit default prediction model of Eq. (1) estimated by country, for each country having greater than ten defaults. Panel A (Panel B) presents results from the market- and accounting-only models (combined model). ROA, LTA, and ETL are return-on-assets, leverage, and cash flow-to-liabilities. LRET, LSIGMA, and LRSIZE are cumulative annual return, return volatility, and relative market capitalization. All variables are further defined in the Appendix. *, **, and *** indicate significance at the 10%, 5% and 1% levels, respectively, based on standard errors clustered by firm. We do not report the estimated intercept or standard errors. Panel C reports predictive accuracy (ACCUR), measured as the cumulative percentage of defaults falling within the top three sample default probability deciles. Models C, MO, and AO refer to combined, market- and accounting-only models. Panel A: Market-only and accounting-only model estimations by country (for countries with at least 10 defaults) Market-only Model Accounting-only Model VARIABLES N LRET LSIGMA LRSIZE Pseudo-R2 ROA LTA ETL Pseudo-R2 Predicted Sign + + Australia 17,216 -2.027*** 2.593*** -0.029 0.088 -0.883*** 2.999*** 0.021 0.085 Canada 10,570 -1.405*** 3.378*** -0.155*** 0.102 -1.996*** 3.157*** -0.062 0.122 China 12,846 -0.398** -1.314 -0.344*** 0.030 -9.379*** 1.676*** -2.125*** 0.071 Denmark 2,185 -0.226 11.496*** -0.484** 0.200 -7.137*** 6.721*** 0.648 0.270 France 8,168 -0.674* 8.307*** -0.296*** 0.118 -9.399*** 3.479*** -0.996 0.158 Germany 8,351 -1.498*** 4.784*** -0.248*** 0.131 -5.088*** 1.118** -0.718* 0.114 Hong Kong 12,590 -1.016* 1.865*** -0.085 0.042 -1.501** 2.774*** -0.210 0.065 India 18,056 -0.372 3.238* 0.209*** 0.025 -5.114* 2.167*** -0.033 0.069 Indonesia 2,994 -1.369*** 3.460*** 0.128* 0.074 -3.125** 1.108** -0.177 0.062 Italy 3,172 -5.792*** 0.867 -0.230 0.245 -12.043*** 10.649*** 2.590 0.303 Japan 42,501 -2.487*** 7.472*** -0.381*** 0.171 -8.399*** 8.041*** -4.078*** 0.236 Malaysia 11,932 -0.756*** 6.057*** -0.294*** 0.090 -8.999*** 3.126*** -0.896 0.188 Netherlands 2,417 -1.150 9.438** -0.209* 0.126 -7.179*** 3.710** -1.309 0.141 Norway 2,222 -5.146*** 2.992 -0.108 0.268 -5.711*** 4.035** 0.576 0.202 Philippines 1,896 -0.768*** 0.823 -0.042 0.022 -1.976 1.150** -0.016 0.041 Singapore 7,081 -3.064** 4.692** -0.130 0.140 -2.540 5.298*** 0.103 0.113 S Korea 16,582 -1.077*** 1.931*** -0.099 0.044 0.980 6.918*** -2.185*** 0.149 Sweden 4,761 -0.691 5.047*** -0.318*** 0.126 -2.687*** 2.312 0.074 0.083 Taiwan 12,587 -1.389*** 6.131*** -0.401*** 0.090 -12.167*** 4.666*** -1.868 0.183 Thailand 5,419 -1.356*** 4.372*** -0.296*** 0.142 -3.765*** 7.996*** -1.342 0.309 UK 24,025 -1.564*** 3.590*** -0.146*** 0.087 -1.713*** 1.976*** -0.112 0.055 US 85,784 -1.386*** 4.571*** -0.306*** 0.206 -2.147*** 3.487*** -0.186*** 0.170 %Correct Sign 100% 95.5% 90.9% 95.5% 100% 72.7% %Sig. Incorrect Sign 0.0% 0.0% 9.1% 0.0% 0.0% 0.0%
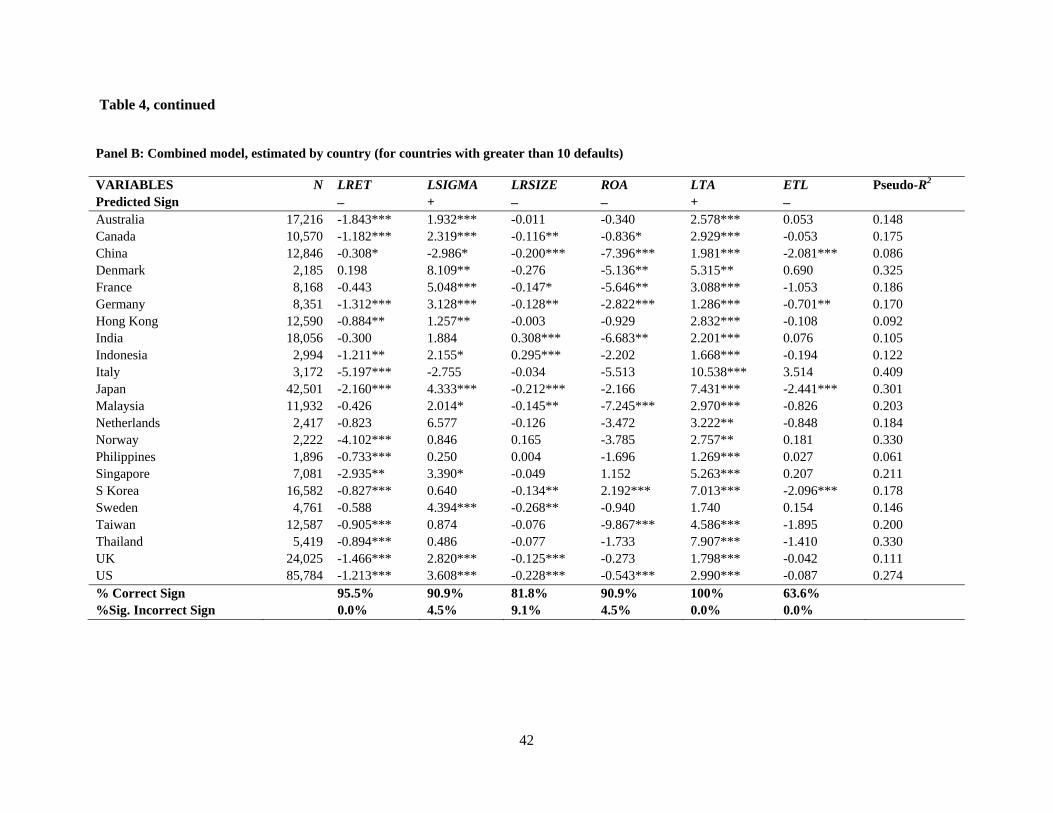
42
Table 4, continued
Panel B: Combined model, estimated by country (for countries with greater than 10 defaults)
VARIABLES N LRET LSIGMA LRSIZE ROA LTA ETL Pseudo-R2 Predicted Sign + + Australia 17,216 -1.843*** 1.932*** -0.011 -0.340 2.578*** 0.053 0.148 Canada 10,570 -1.182*** 2.319*** -0.116** -0.836* 2.929*** -0.053 0.175 China 12,846 -0.308* -2.986* -0.200*** -7.396*** 1.981*** -2.081*** 0.086 Denmark 2,185 0.198 8.109** -0.276 -5.136** 5.315** 0.690 0.325 France 8,168 -0.443 5.048*** -0.147* -5.646** 3.088*** -1.053 0.186 Germany 8,351 -1.312*** 3.128*** -0.128** -2.822*** 1.286*** -0.701** 0.170 Hong Kong 12,590 -0.884** 1.257** -0.003 -0.929 2.832*** -0.108 0.092 India 18,056 -0.300 1.884 0.308*** -6.683** 2.201*** 0.076 0.105 Indonesia 2,994 -1.211** 2.155* 0.295*** -2.202 1.668*** -0.194 0.122 Italy 3,172 -5.197*** -2.755 -0.034 -5.513 10.538*** 3.514 0.409 Japan 42,501 -2.160*** 4.333*** -0.212*** -2.166 7.431*** -2.441*** 0.301 Malaysia 11,932 -0.426 2.014* -0.145** -7.245*** 2.970*** -0.826 0.203 Netherlands 2,417 -0.823 6.577 -0.126 -3.472 3.222** -0.848 0.184 Norway 2,222 -4.102*** 0.846 0.165 -3.785 2.757** 0.181 0.330 Philippines 1,896 -0.733*** 0.250 0.004 -1.696 1.269*** 0.027 0.061 Singapore 7,081 -2.935** 3.390* -0.049 1.152 5.263*** 0.207 0.211 S Korea 16,582 -0.827*** 0.640 -0.134** 2.192*** 7.013*** -2.096*** 0.178 Sweden 4,761 -0.588 4.394*** -0.268** -0.940 1.740 0.154 0.146 Taiwan 12,587 -0.905*** 0.874 -0.076 -9.867*** 4.586*** -1.895 0.200 Thailand 5,419 -0.894*** 0.486 -0.077 -1.733 7.907*** -1.410 0.330 UK 24,025 -1.466*** 2.820*** -0.125*** -0.273 1.798*** -0.042 0.111 US 85,784 -1.213*** 3.608*** -0.228*** -0.543*** 2.990*** -0.087 0.274 % Correct Sign 95.5% 90.9% 81.8% 90.9% 100% 63.6% %Sig. Incorrect Sign 0.0% 4.5% 9.1% 4.5% 0.0% 0.0%
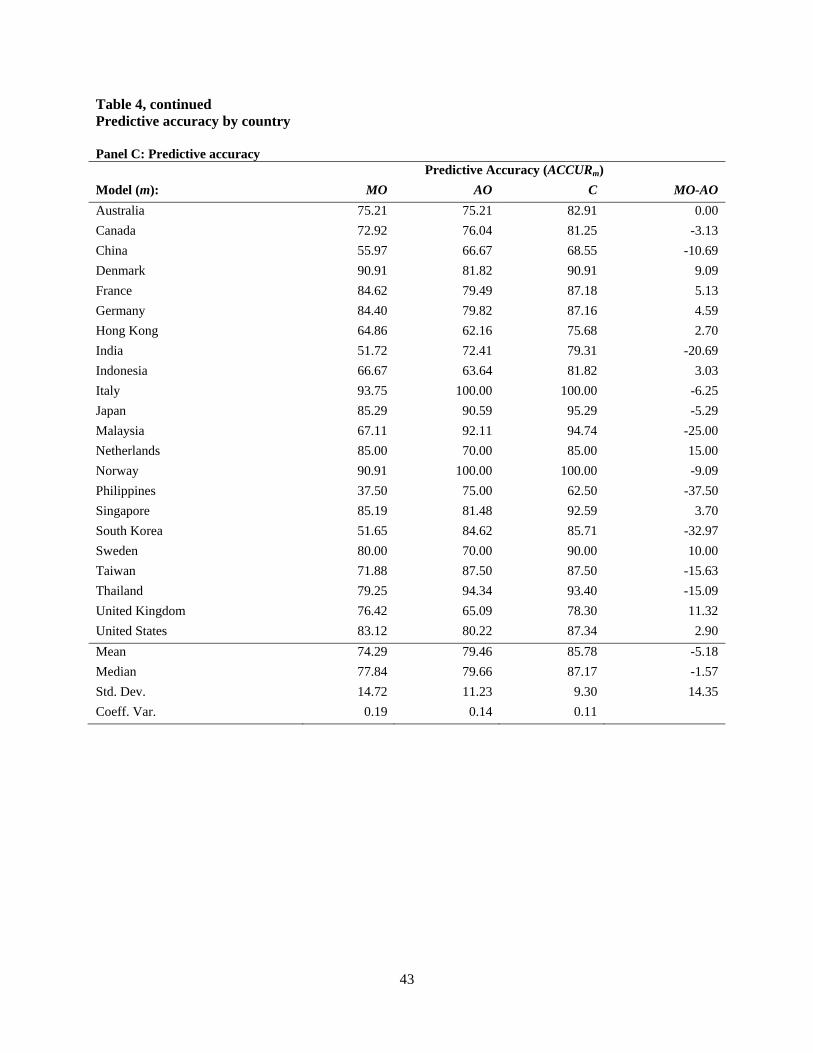
43
Table 4, continued Predictive accuracy by country Panel C: Predictive accuracy Predictive Accuracy (ACCURm)
Model (m): MO AO C MO-AO
Australia 75.21 75.21 82.91 0.00
Canada 72.92 76.04 81.25 -3.13
China 55.97 66.67 68.55 -10.69
Denmark 90.91 81.82 90.91 9.09
France 84.62 79.49 87.18 5.13
Germany 84.40 79.82 87.16 4.59
Hong Kong 64.86 62.16 75.68 2.70
India 51.72 72.41 79.31 -20.69
Indonesia 66.67 63.64 81.82 3.03
Italy 93.75 100.00 100.00 -6.25
Japan 85.29 90.59 95.29 -5.29
Malaysia 67.11 92.11 94.74 -25.00
Netherlands 85.00 70.00 85.00 15.00
Norway 90.91 100.00 100.00 -9.09
Philippines 37.50 75.00 62.50 -37.50
Singapore 85.19 81.48 92.59 3.70
South Korea 51.65 84.62 85.71 -32.97
Sweden 80.00 70.00 90.00 10.00
Taiwan 71.88 87.50 87.50 -15.63
Thailand 79.25 94.34 93.40 -15.09
United Kingdom 76.42 65.09 78.30 11.32
United States 83.12 80.22 87.34 2.90
Mean 74.29 79.46 85.78 -5.18
Median 77.84 79.66 87.17 -1.57
Std. Dev. 14.72 11.23 9.30 14.35
Coeff. Var. 0.19 0.14 0.11
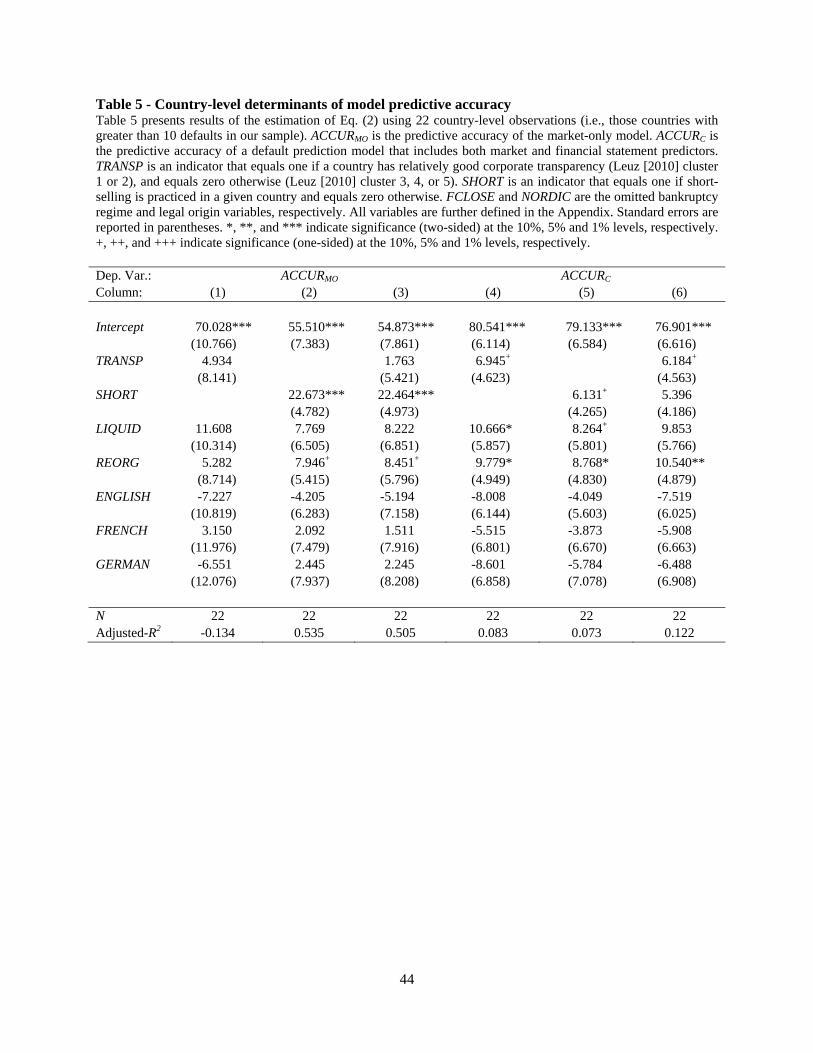
44
Table 5 - Country-level determinants of model predictive accuracy Table 5 presents results of the estimation of Eq. (2) using 22 country-level observations (i.e., those countries with greater than 10 defaults in our sample). ACCURMO is the predictive accuracy of the market-only model. ACCURC is the predictive accuracy of a default prediction model that includes both market and financial statement predictors. TRANSP is an indicator that equals one if a country has relatively good corporate transparency (Leuz [2010] cluster 1 or 2), and equals zero otherwise (Leuz [2010] cluster 3, 4, or 5). SHORT is an indicator that equals one if short-selling is practiced in a given country and equals zero otherwise. FCLOSE and NORDIC are the omitted bankruptcy regime and legal origin variables, respectively. All variables are further defined in the Appendix. Standard errors are reported in parentheses. *, **, and *** indicate significance (two-sided) at the 10%, 5% and 1% levels, respectively. +, ++, and +++ indicate significance (one-sided) at the 10%, 5% and 1% levels, respectively. Dep. Var.: ACCURMO ACCURC Column: (1) (2) (3) (4) (5) (6) Intercept 70.028*** 55.510*** 54.873*** 80.541*** 79.133*** 76.901*** (10.766) (7.383) (7.861) (6.114) (6.584) (6.616) TRANSP 4.934 1.763 6.945+ 6.184+ (8.141) (5.421) (4.623) (4.563) SHORT 22.673*** 22.464*** 6.131+ 5.396 (4.782) (4.973) (4.265) (4.186) LIQUID 11.608 7.769 8.222 10.666* 8.264+ 9.853 (10.314) (6.505) (6.851) (5.857) (5.801) (5.766) REORG 5.282 7.946+ 8.451+ 9.779* 8.768* 10.540** (8.714) (5.415) (5.796) (4.949) (4.830) (4.879) ENGLISH -7.227 -4.205 -5.194 -8.008 -4.049 -7.519 (10.819) (6.283) (7.158) (6.144) (5.603) (6.025) FRENCH 3.150 2.092 1.511 -5.515 -3.873 -5.908 (11.976) (7.479) (7.916) (6.801) (6.670) (6.663) GERMAN -6.551 2.445 2.245 -8.601 -5.784 -6.488 (12.076) (7.937) (8.208) (6.858) (7.078) (6.908) N 22 22 22 22 22 22 Adjusted-R2 -0.134 0.535 0.505 0.083 0.073 0.122
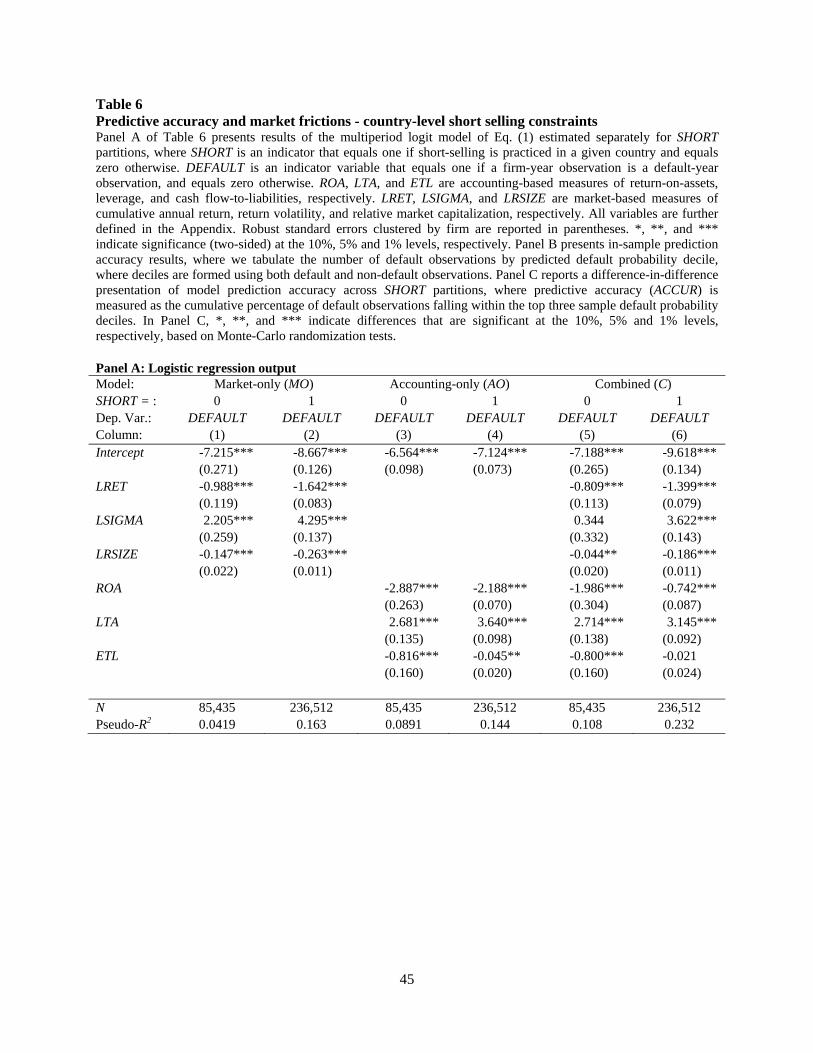
45
Table 6 Predictive accuracy and market frictions - country-level short selling constraints Panel A of Table 6 presents results of the multiperiod logit model of Eq. (1) estimated separately for SHORT partitions, where SHORT is an indicator that equals one if short-selling is practiced in a given country and equals zero otherwise. DEFAULT is an indicator variable that equals one if a firm-year observation is a default-year observation, and equals zero otherwise. ROA, LTA, and ETL are accounting-based measures of return-on-assets, leverage, and cash flow-to-liabilities, respectively. LRET, LSIGMA, and LRSIZE are market-based measures of cumulative annual return, return volatility, and relative market capitalization, respectively. All variables are further defined in the Appendix. Robust standard errors clustered by firm are reported in parentheses. *, **, and *** indicate significance (two-sided) at the 10%, 5% and 1% levels, respectively. Panel B presents in-sample prediction accuracy results, where we tabulate the number of default observations by predicted default probability decile, where deciles are formed using both default and non-default observations. Panel C reports a difference-in-difference presentation of model prediction accuracy across SHORT partitions, where predictive accuracy (ACCUR) is measured as the cumulative percentage of default observations falling within the top three sample default probability deciles. In Panel C, *, **, and *** indicate differences that are significant at the 10%, 5% and 1% levels, respectively, based on Monte-Carlo randomization tests. Panel A: Logistic regression output Model: Market-only (MO) Accounting-only (AO) Combined (C) SHORT = : 0 1 0 1 0 1 Dep. Var.: DEFAULT DEFAULT DEFAULT DEFAULT DEFAULT DEFAULT Column: (1) (2) (3) (4) (5) (6) Intercept -7.215*** -8.667*** -6.564*** -7.124*** -7.188*** -9.618*** (0.271) (0.126) (0.098) (0.073) (0.265) (0.134) LRET -0.988*** -1.642*** -0.809*** -1.399*** (0.119) (0.083) (0.113) (0.079) LSIGMA 2.205*** 4.295*** 0.344 3.622*** (0.259) (0.137) (0.332) (0.143) LRSIZE -0.147*** -0.263*** -0.044** -0.186*** (0.022) (0.011) (0.020) (0.011) ROA -2.887*** -2.188*** -1.986*** -0.742*** (0.263) (0.070) (0.304) (0.087) LTA 2.681*** 3.640*** 2.714*** 3.145*** (0.135) (0.098) (0.138) (0.092) ETL -0.816*** -0.045** -0.800*** -0.021 (0.160) (0.020) (0.160) (0.024) N 85,435 236,512 85,435 236,512 85,435 236,512 Pseudo-R2 0.0419 0.163 0.0891 0.144 0.108 0.232
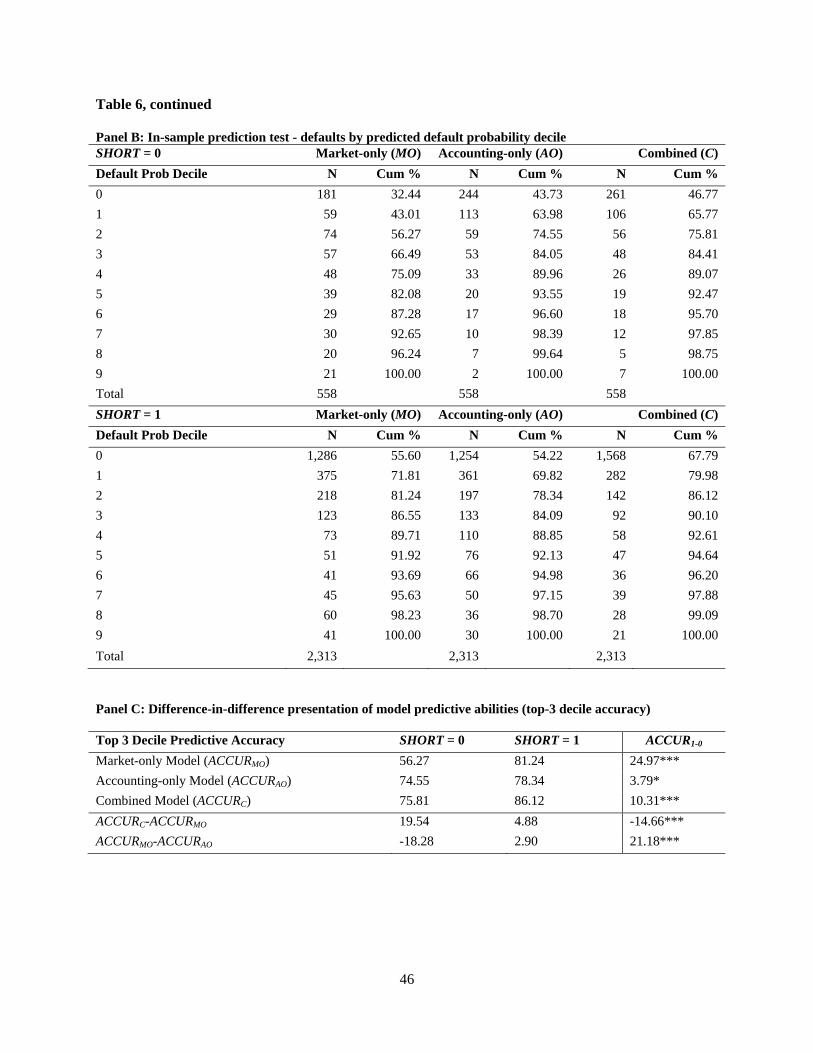
46
Table 6, continued Panel B: In-sample prediction test - defaults by predicted default probability decile SHORT = 0 Market-only (MO) Accounting-only (AO) Combined (C)
Default Prob Decile N Cum % N Cum % N Cum %
0 181 32.44 244 43.73 261 46.77
1 59 43.01 113 63.98 106 65.77
2 74 56.27 59 74.55 56 75.81
3 57 66.49 53 84.05 48 84.41
4 48 75.09 33 89.96 26 89.07
5 39 82.08 20 93.55 19 92.47
6 29 87.28 17 96.60 18 95.70
7 30 92.65 10 98.39 12 97.85
8 20 96.24 7 99.64 5 98.75
9 21 100.00 2 100.00 7 100.00
Total 558 558 558
SHORT = 1 Market-only (MO) Accounting-only (AO) Combined (C)
Default Prob Decile N Cum % N Cum % N Cum %
0 1,286 55.60 1,254 54.22 1,568 67.79
1 375 71.81 361 69.82 282 79.98
2 218 81.24 197 78.34 142 86.12
3 123 86.55 133 84.09 92 90.10
4 73 89.71 110 88.85 58 92.61
5 51 91.92 76 92.13 47 94.64
6 41 93.69 66 94.98 36 96.20
7 45 95.63 50 97.15 39 97.88
8 60 98.23 36 98.70 28 99.09
9 41 100.00 30 100.00 21 100.00
Total 2,313 2,313 2,313
Panel C: Difference-in-difference presentation of model predictive abilities (top-3 decile accuracy) Top 3 Decile Predictive Accuracy SHORT = 0 SHORT = 1 ACCUR1-0
Market-only Model (ACCURMO) 56.27 81.24 24.97***
Accounting-only Model (ACCURAO) 74.55 78.34 3.79*
Combined Model (ACCURC) 75.81 86.12 10.31***
ACCURC-ACCURMO 19.54 4.88 -14.66***
ACCURMO-ACCURAO -18.28 2.90 21.18***
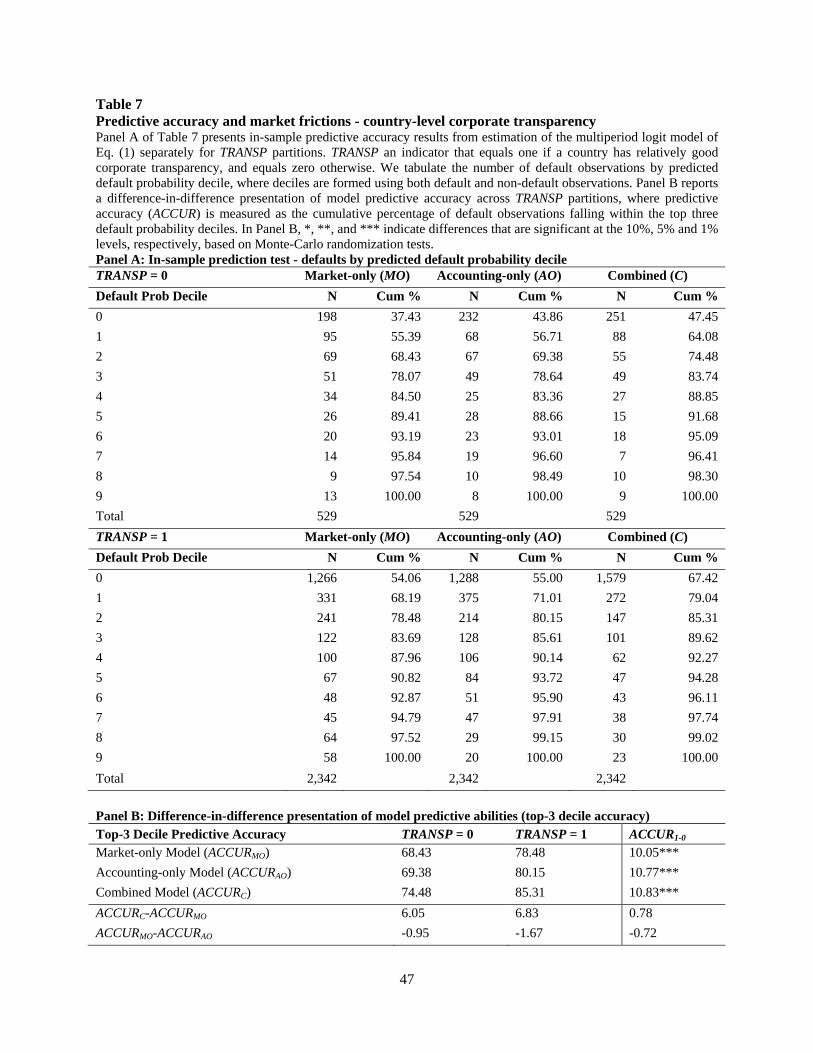
47
Table 7 Predictive accuracy and market frictions - country-level corporate transparency Panel A of Table 7 presents in-sample predictive accuracy results from estimation of the multiperiod logit model of Eq. (1) separately for TRANSP partitions. TRANSP an indicator that equals one if a country has relatively good corporate transparency, and equals zero otherwise. We tabulate the number of default observations by predicted default probability decile, where deciles are formed using both default and non-default observations. Panel B reports a difference-in-difference presentation of model predictive accuracy across TRANSP partitions, where predictive accuracy (ACCUR) is measured as the cumulative percentage of default observations falling within the top three default probability deciles. In Panel B, *, **, and *** indicate differences that are significant at the 10%, 5% and 1% levels, respectively, based on Monte-Carlo randomization tests. Panel A: In-sample prediction test - defaults by predicted default probability decile TRANSP = 0 Market-only (MO) Accounting-only (AO) Combined (C)
Default Prob Decile N Cum % N Cum % N Cum %
0 198 37.43 232 43.86 251 47.45
1 95 55.39 68 56.71 88 64.08
2 69 68.43 67 69.38 55 74.48
3 51 78.07 49 78.64 49 83.74
4 34 84.50 25 83.36 27 88.85
5 26 89.41 28 88.66 15 91.68
6 20 93.19 23 93.01 18 95.09
7 14 95.84 19 96.60 7 96.41
8 9 97.54 10 98.49 10 98.30
9 13 100.00 8 100.00 9 100.00
Total 529 529 529
TRANSP = 1 Market-only (MO) Accounting-only (AO) Combined (C)
Default Prob Decile N Cum % N Cum % N Cum %
0 1,266 54.06 1,288 55.00 1,579 67.42
1 331 68.19 375 71.01 272 79.04
2 241 78.48 214 80.15 147 85.31
3 122 83.69 128 85.61 101 89.62
4 100 87.96 106 90.14 62 92.27
5 67 90.82 84 93.72 47 94.28
6 48 92.87 51 95.90 43 96.11
7 45 94.79 47 97.91 38 97.74
8 64 97.52 29 99.15 30 99.02
9 58 100.00 20 100.00 23 100.00
Total 2,342 2,342 2,342
Panel B: Difference-in-difference presentation of model predictive abilities (top-3 decile accuracy) Top-3 Decile Predictive Accuracy TRANSP = 0 TRANSP = 1 ACCUR1-0
Market-only Model (ACCURMO) 68.43 78.48 10.05***
Accounting-only Model (ACCURAO) 69.38 80.15 10.77***
Combined Model (ACCURC) 74.48 85.31 10.83***
ACCURC-ACCURMO 6.05 6.83 0.78
ACCURMO-ACCURAO -0.95 -1.67 -0.72
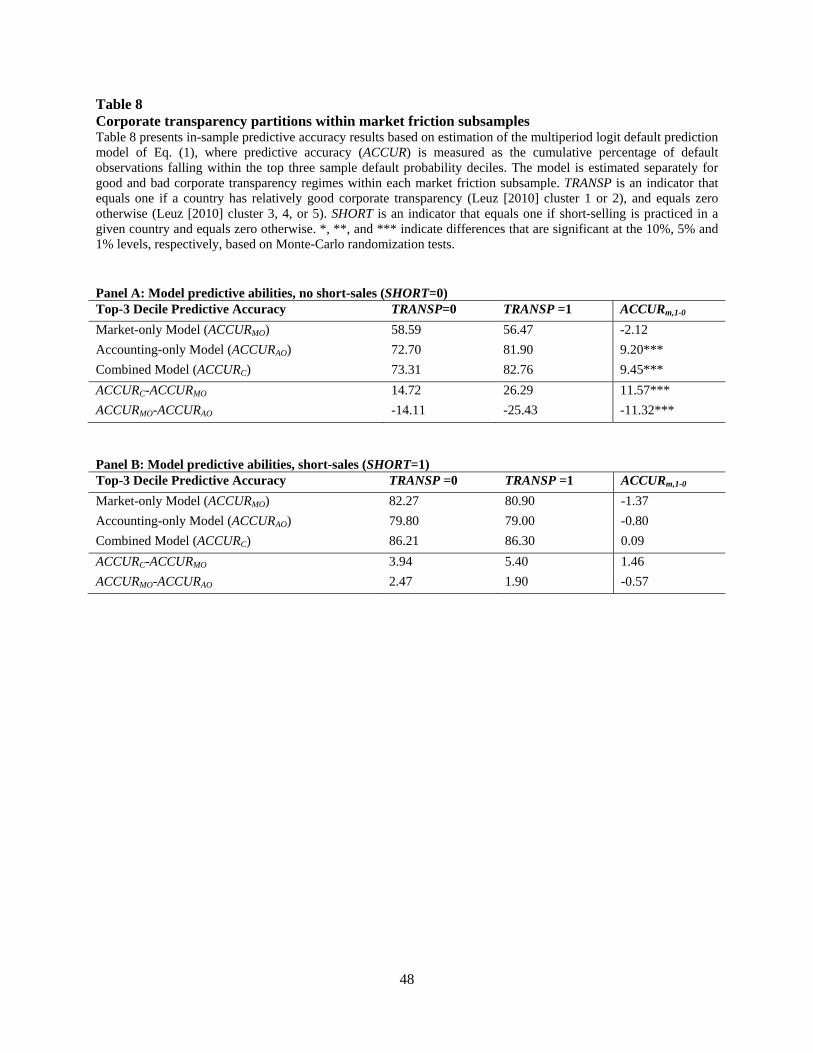
48
Table 8 Corporate transparency partitions within market friction subsamples Table 8 presents in-sample predictive accuracy results based on estimation of the multiperiod logit default prediction model of Eq. (1), where predictive accuracy (ACCUR) is measured as the cumulative percentage of default observations falling within the top three sample default probability deciles. The model is estimated separately for good and bad corporate transparency regimes within each market friction subsample. TRANSP is an indicator that equals one if a country has relatively good corporate transparency (Leuz [2010] cluster 1 or 2), and equals zero otherwise (Leuz [2010] cluster 3, 4, or 5). SHORT is an indicator that equals one if short-selling is practiced in a given country and equals zero otherwise. *, **, and *** indicate differences that are significant at the 10%, 5% and 1% levels, respectively, based on Monte-Carlo randomization tests. Panel A: Model predictive abilities, no short-sales (SHORT=0) Top-3 Decile Predictive Accuracy TRANSP=0 TRANSP =1 ACCURm,1-0
Market-only Model (ACCURMO) 58.59 56.47 -2.12
Accounting-only Model (ACCURAO) 72.70 81.90 9.20***
Combined Model (ACCURC) 73.31 82.76 9.45***
ACCURC-ACCURMO 14.72 26.29 11.57***
ACCURMO-ACCURAO -14.11 -25.43 -11.32***
Panel B: Model predictive abilities, short-sales (SHORT=1) Top-3 Decile Predictive Accuracy TRANSP =0 TRANSP =1 ACCURm,1-0
Market-only Model (ACCURMO) 82.27 80.90 -1.37
Accounting-only Model (ACCURAO) 79.80 79.00 -0.80
Combined Model (ACCURC) 86.21 86.30 0.09
ACCURC-ACCURMO 3.94 5.40 1.46
ACCURMO-ACCURAO 2.47 1.90 -0.57
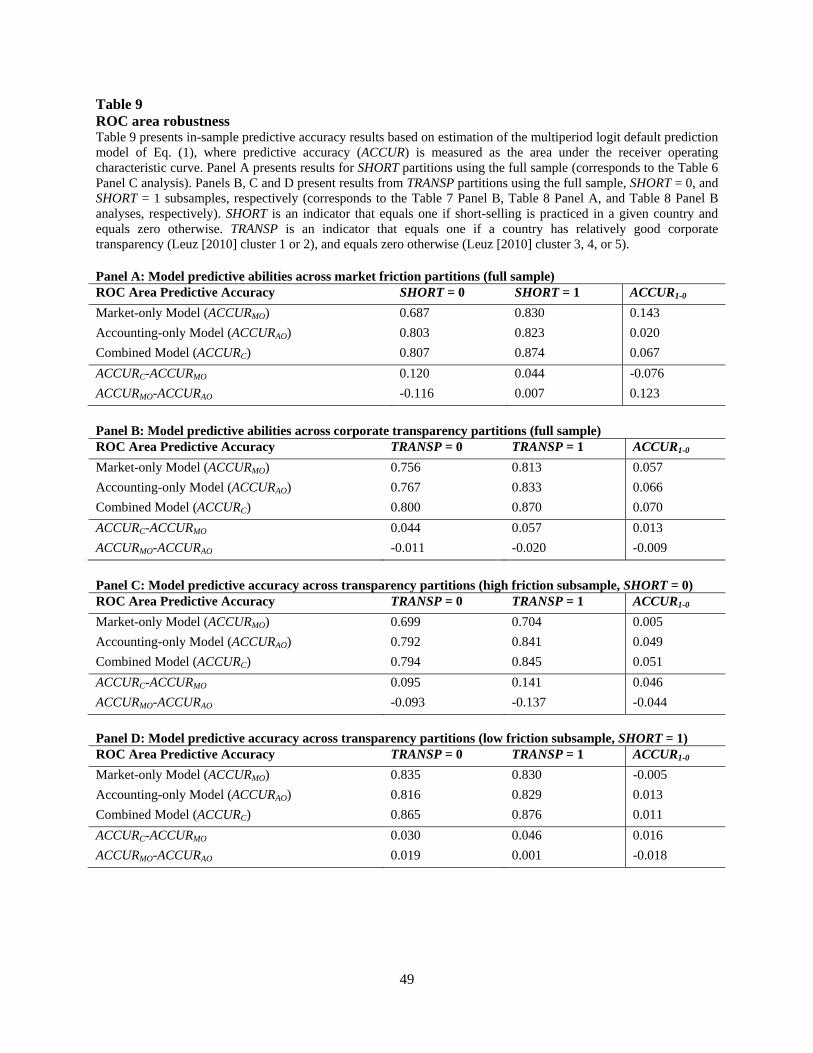
49
Table 9 ROC area robustness Table 9 presents in-sample predictive accuracy results based on estimation of the multiperiod logit default prediction model of Eq. (1), where predictive accuracy (ACCUR) is measured as the area under the receiver operating characteristic curve. Panel A presents results for SHORT partitions using the full sample (corresponds to the Table 6 Panel C analysis). Panels B, C and D present results from TRANSP partitions using the full sample, SHORT = 0, and SHORT = 1 subsamples, respectively (corresponds to the Table 7 Panel B, Table 8 Panel A, and Table 8 Panel B analyses, respectively). SHORT is an indicator that equals one if short-selling is practiced in a given country and equals zero otherwise. TRANSP is an indicator that equals one if a country has relatively good corporate transparency (Leuz [2010] cluster 1 or 2), and equals zero otherwise (Leuz [2010] cluster 3, 4, or 5). Panel A: Model predictive abilities across market friction partitions (full sample) ROC Area Predictive Accuracy SHORT = 0 SHORT = 1 ACCUR1-0
Market-only Model (ACCURMO) 0.687 0.830 0.143
Accounting-only Model (ACCURAO) 0.803 0.823 0.020
Combined Model (ACCURC) 0.807 0.874 0.067
ACCURC-ACCURMO 0.120 0.044 -0.076
ACCURMO-ACCURAO -0.116 0.007 0.123
Panel B: Model predictive abilities across corporate transparency partitions (full sample) ROC Area Predictive Accuracy TRANSP = 0 TRANSP = 1 ACCUR1-0
Market-only Model (ACCURMO) 0.756 0.813 0.057
Accounting-only Model (ACCURAO) 0.767 0.833 0.066
Combined Model (ACCURC) 0.800 0.870 0.070
ACCURC-ACCURMO 0.044 0.057 0.013
ACCURMO-ACCURAO -0.011 -0.020 -0.009
Panel C: Model predictive accuracy across transparency partitions (high friction subsample, SHORT = 0) ROC Area Predictive Accuracy TRANSP = 0 TRANSP = 1 ACCUR1-0
Market-only Model (ACCURMO) 0.699 0.704 0.005
Accounting-only Model (ACCURAO) 0.792 0.841 0.049
Combined Model (ACCURC) 0.794 0.845 0.051
ACCURC-ACCURMO 0.095 0.141 0.046
ACCURMO-ACCURAO -0.093 -0.137 -0.044
Panel D: Model predictive accuracy across transparency partitions (low friction subsample, SHORT = 1) ROC Area Predictive Accuracy TRANSP = 0 TRANSP = 1 ACCUR1-0
Market-only Model (ACCURMO) 0.835 0.830 -0.005
Accounting-only Model (ACCURAO) 0.816 0.829 0.013
Combined Model (ACCURC) 0.865 0.876 0.011
ACCURC-ACCURMO 0.030 0.046 0.016
ACCURMO-ACCURAO 0.019 0.001 -0.018