defect prevention: a tester’s role in - chicago quality ... 2011/iisp - defect... · defect...
TRANSCRIPT
www.spinstitute.org 1
© IISP, 1996-2008
Defect Prevention: A Tester’s Role in
Process Improvement and reducing
the Cost of Poor Quality
Mike Ennis, Senior Test Manager
Accenture
www.spinstitute.org 2
© IISP, 1996-2008
Defect Prevention versus Defect Detection
• Defect Prevention
Techniques that are designed to find defects “before” the artifact has been developed
• Defect Detection
Techniques that are designed to find defects after the artifact “under test” has been developed
www.spinstitute.org 3
© IISP, 1996-2008
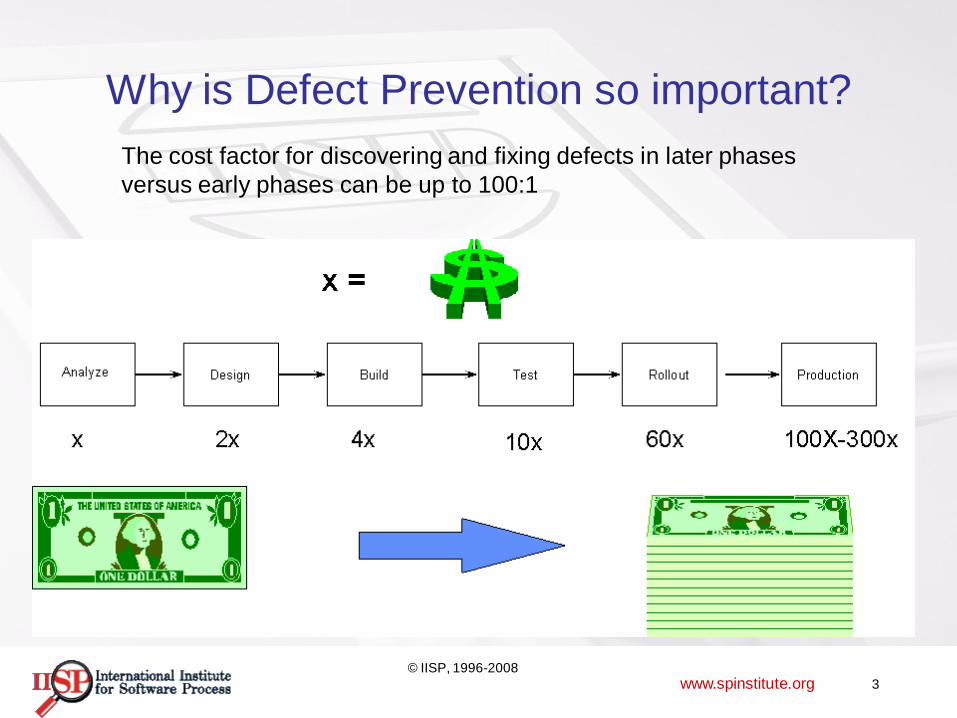
Why is Defect Prevention so important?
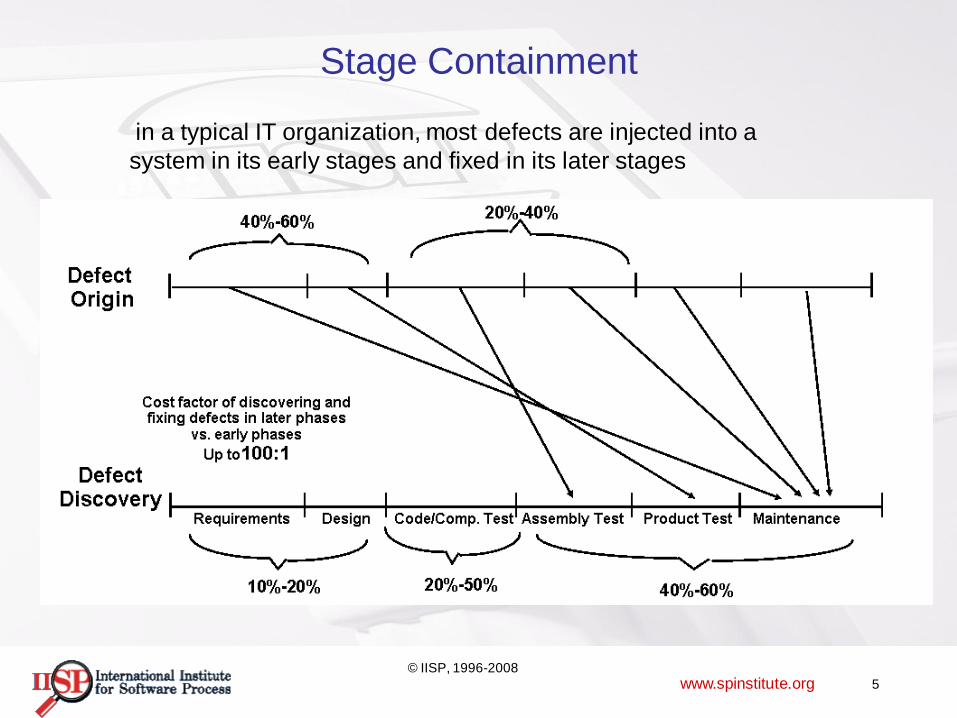
The cost factor for discovering and fixing defects in later phases
versus early phases can be up to 100:1
www.spinstitute.org 4
© IISP, 1996-2008
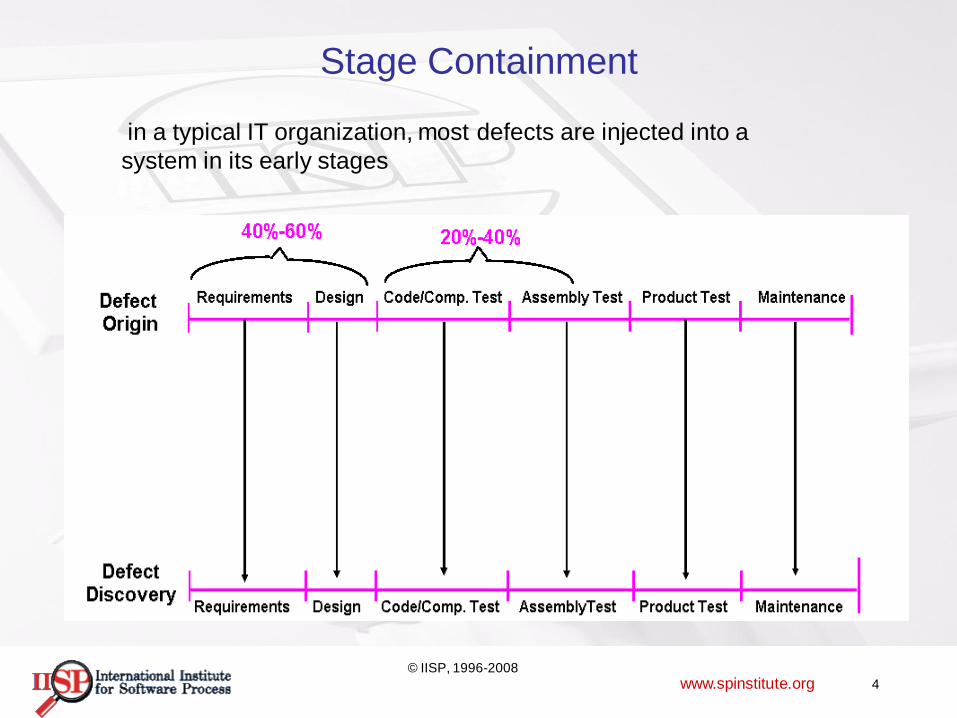
Stage Containment
in a typical IT organization, most defects are injected into a
system in its early stages
www.spinstitute.org 5
© IISP, 1996-2008
Stage Containment
in a typical IT organization, most defects are injected into a
system in its early stages and fixed in its later stages
Quality Assurance
• Activities that modify the development process to prevent
the introduction of flaws
– Staff function
– Implements management‟s quality policies
– Responsible for continuous improvement of the software
development process
• Proactive approach focused on defect prevention
• Examples:
– Defining change control procedures
– Facilitating post-project reviews
– Analyzing metrics to identify opportunities for process improvement
© IIST, 1996-2010 www.iist.org 6
Quality Control
• Activities within the development process to detect the introduction of flaws– Test planning and execution
– Quality control measures a product against the existence of an attribute
– Determines whether the product conforms to a standard or procedure (also known as compliance checking).
• Proactive approach focused on defect detection
• Examples:– Writing and executing test cases and scripts
– Participating in verification and validation activities
– Reporting defects to identify opportunities for process improvement
© IIST, 1996-2010 www.iist.org 7
www.spinstitute.org 8
© IISP, 1996-2008
Defect Prevention Techniques
Risk Based Testing
Inspections
Reviews
Walkthroughs
Examples of Defect Prevention:
www.spinstitute.org 9
© IISP, 1996-2008
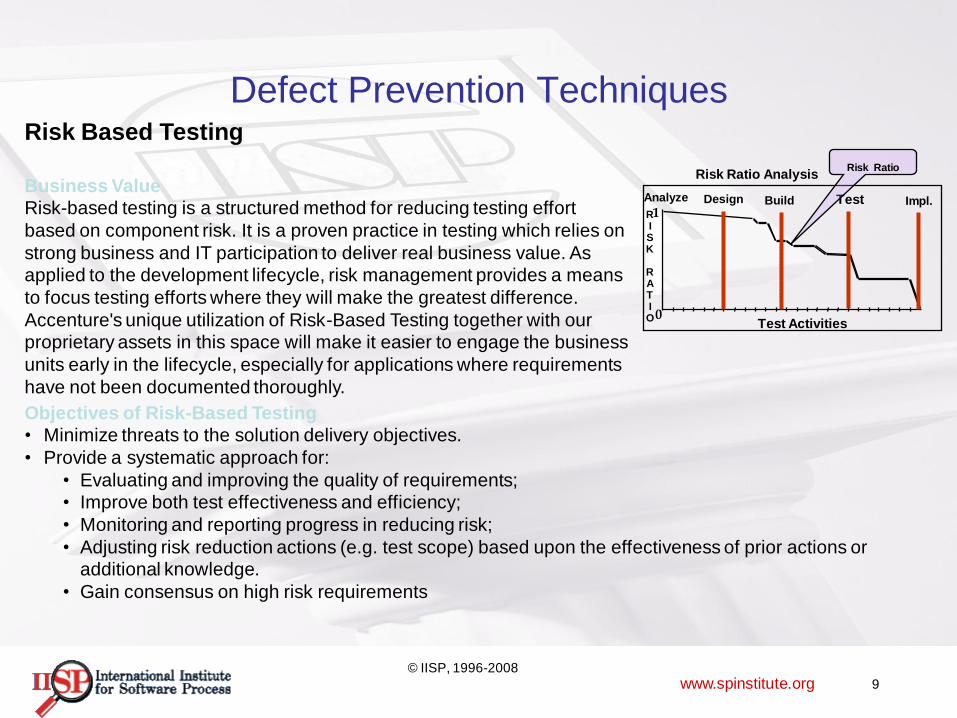
Risk Based Testing
Business Value
Risk-based testing is a structured method for reducing testing effort
based on component risk. It is a proven practice in testing which relies on
strong business and IT participation to deliver real business value. As
applied to the development lifecycle, risk management provides a means
to focus testing efforts where they will make the greatest difference.
Accenture's unique utilization of Risk-Based Testing together with our
proprietary assets in this space will make it easier to engage the business
units early in the lifecycle, especially for applications where requirements
have not been documented thoroughly.
Objectives of Risk-Based Testing
• Minimize threats to the solution delivery objectives.
• Provide a systematic approach for:
• Evaluating and improving the quality of requirements;
• Improve both test effectiveness and efficiency;
• Monitoring and reporting progress in reducing risk;
• Adjusting risk reduction actions (e.g. test scope) based upon the effectiveness of prior actions or
additional knowledge.
• Gain consensus on high risk requirements
Analyze Build Design Test
0
Impl.
Test Activities
RISK
RATIO
1
Risk Ratio AnalysisRisk Ratio
Defect Prevention Techniques
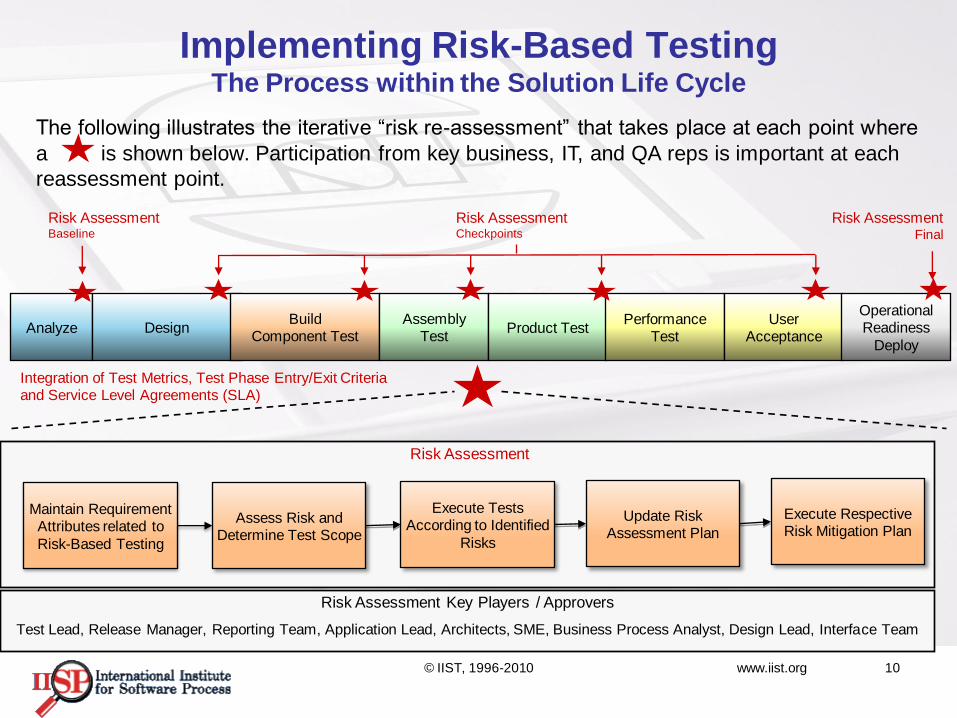
Implementing Risk-Based TestingThe Process within the Solution Life Cycle
Risk Assessment Key Players / Approvers
Test Lead, Release Manager, Reporting Team, Application Lead, Architects, SME, Business Process Analyst, Design Lead, Interface Team
Risk Assessment
The following illustrates the iterative “risk re-assessment” that takes place at each point where
a is shown below. Participation from key business, IT, and QA reps is important at each
reassessment point.
Maintain Requirement Attributes related to
Risk-Based Testing
Assess Risk and Determine Test Scope
Execute Tests According to Identified
Risks
Update Risk Assessment Plan
Execute Respective Risk Mitigation Plan
Analyze
Risk AssessmentCheckpoints
Integration of Test Metrics, Test Phase Entry/Exit Criteriaand Service Level Agreements (SLA)
DesignBuild
Component TestAssembly
TestProduct Test
Performance Test
User Acceptance
Operational Readiness
Deploy
Risk AssessmentBaseline
Risk Assessment Final
© IIST, 1996-2010 www.iist.org 10
© IIST, 1996-2010 www.iist.org 11
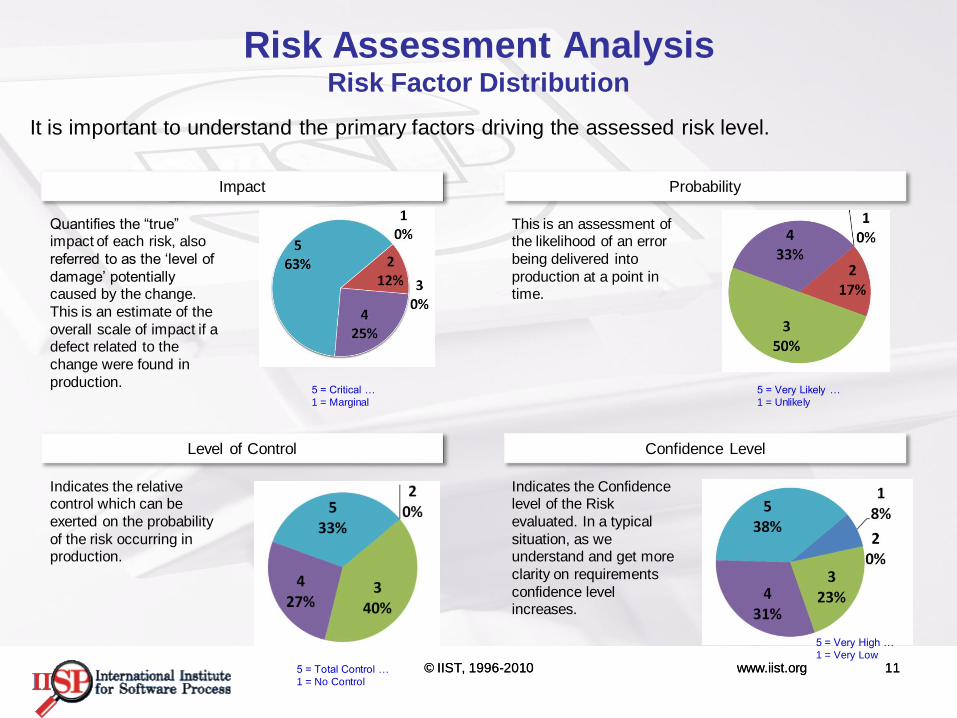
This is an assessment of the likelihood of an error
being delivered into
production at a point in time.
Quantifies the “true” impact of each risk, also
referred to as the „level of
damage‟ potentially caused by the change.
This is an estimate of the
overall scale of impact if a defect related to the
change were found in
production.
Indicates the relative control which can be
exerted on the probability
of the risk occurring in production.
Indicates the Confidence level of the Risk
evaluated. In a typical
situation, as we understand and get more
clarity on requirements
confidence level increases.
5 = Critical …
1 = Marginal
5 = Very Likely …
1 = Unlikely
5 = Total Control …
1 = No Control
Risk Assessment AnalysisRisk Factor Distribution
It is important to understand the primary factors driving the assessed risk level.
Impact Probability
Level of Control Confidence Level
5 = Very High …
1 = Very Low
© IIST, 1996-2010 www.iist.org 11
www.spinstitute.org 12
© IISP, 1996-2008
Defect Prevention Techniques
Inspections
Create an Inspection Plan
Inspections should raise the quality of an application
Inspections should find faults with requirements, test plan documents, design documents.
Similar to a Peer Review
www.spinstitute.org 13
© IISP, 1996-2008
Defect Prevention Techniques
Reviews
Establish a Peer Review Process
Identifies issues/risks in Test Planning
Types of Reviews:
-Formal
-Informal
-Facilitated
-Unfacilitated
www.spinstitute.org 14
© IISP, 1996-2008
Defect Prevention
Walkthroughs
No Formal Plan
Peer/Lead Checks
Typically done in a group setting while walking through a test script or document
Feedback given by attendees during walkthrough
www.spinstitute.org 15
© IISP, 1996-2008
Defect Prevention – Type of Defects Found
Work product elements that are:Missing
Inconsistent or mismatched (such as interface specifications)
Non-conforming (fail to follow processes)
Incorrect (deviate from requirements and rules or standards)
Unclear
Ambiguous
Unnecessary
Un-testable
www.spinstitute.org 16
© IISP, 1996-2008
Defect Prevention – What Can Be Reviewed?
• Specifications– Requirements
– Design
• Memos
• Proposals
• Plans
• Policies
• Procedures
• Brochures
• Statements of work
• Contracts
www.spinstitute.org 17
© IISP, 1996-2008
Defect Prevention – Value of Reviews
• Provide early quality assessments (verification) of the work products
– Detecting dependencies and inconsistencies in software models, such
as links
– Improved maintainability of code and design
• Colleagues will see what you can‟t
• Catch bugs earlier
– It‟s cheaper to prevent a defect than to repair one later in the life cycle
• Identification of defects not easily found by dynamic testing
www.spinstitute.org 18
© IISP, 1996-2008
Defect Prevention – Value of Reviews (cont.)
• Early warning about suspicious aspects of the code or
design (high complexity measures)
• Opportunities for process improvements
– Prevention of defects, if lessons are learned in development
• Reduce overall project time scales
• Potential opportunities for communication and learning
www.spinstitute.org 19
© IISP, 1996-2008
Defect Detection Techniques
Functional
Structural
Examples of Defect Detection:
www.spinstitute.org 20
© IISP, 1996-2008
Defect Detection Techniques - Functional
Functional:• Functional testing is based on requirements and functionality.
• Functional testing covers how well the system executes the functions and features.
• Functional testing is not based on any knowledge of internal software design or code.
• Functional testing covers the front-end functions, as well as the back-end operations such as security and how upgrades affect the system.
• Generally functional testing is often done toward the end of the development cycle.
• It is recommended to be started earlier such as individual components and processes.
• Black Box, Acceptance, Closed box and Integration testing are functional testing techniques.
www.spinstitute.org 21
© IISP, 1996-2008
Defect Detection Techniques – Structural
• Structural testing is typically based on the architecture of
the system
– Aspects such as a calling hierarchy, data flow diagram, design
specification, etc.
• Structural (white-box) testing may be performed at all
test levels
– System, system integration, or acceptance testing levels (e.g., to
business models or menu structures)
• Structural techniques are best used after specification-
based techniques
www.spinstitute.org 22
© IISP, 1996-2008
Defect Detection Techniques – Structural
• Structural testing is primarily about coverage
– Coverage is the degree to which a structure has been exercised
by the set of tests
• Typically it is expressed as a percentage of the items being covered
• More on coverage later
• Tools can be used at all test levels to measure the code
coverage of elements, such as statements or decisions
– Tools are especially useful at component and component
integration testing
www.spinstitute.org 23
© IISP, 1996-2008
Black Box Versus White Box
Black box testing focuses on functional testing, not based on any knowledge of internal software design or code, where as White box focuses on knowledge of the internal logic of an application's code.
Black box testing is based on requirements and functionality, where as White box testing is based on coverage of code statements, branches, paths and conditions.
Equivalence Partitioning, Boundary Analysis and Error Guessing are
successful techniques for managing the amount of input data for
Black box testing.
Statement Coverage, Decision Coverage, Condition Coverage,
Decision/Condition Coverage and Multiple Condition Coverage are
five important techniques for White box testing.
www.spinstitute.org 24
© IISP, 1996-2008
Static Versus Dynamic
• Static testing is performed using the software documentation.
The code is not executing during static testing where as
Dynamic testing requires the code to be in an executable
state to perform the tests.
• Most verification techniques are static tests where as
validation tests are dynamic tests.
• Feasibility Reviews and Requirements Reviews are examples
of Static testing.
• Unit, Integrated, System and User Acceptance testing are
examples of Dynamic testing.
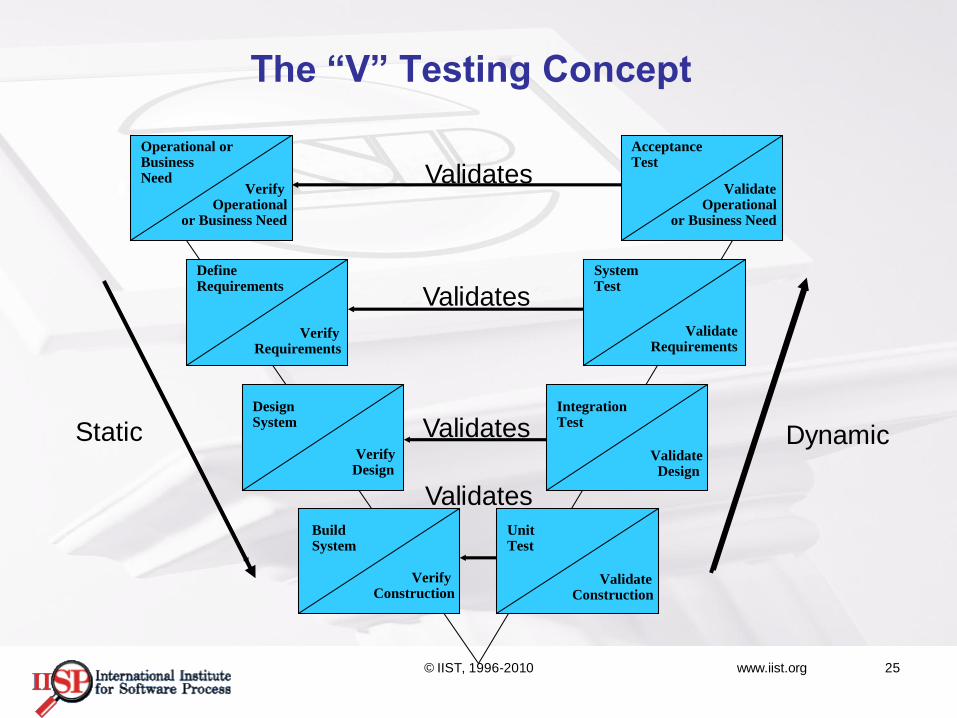
The “V” Testing Concept
Operational orBusinessNeed
VerifyOperational
or Business Need
DefineRequirements
VerifyRequirements
DesignSystem
VerifyDesign
BuildSystem
VerifyConstruction
AcceptanceTest
ValidateOperational
or Business Need
SystemTest
ValidateRequirements
IntegrationTest
ValidateDesign
UnitTest
ValidateConstruction
Static Dynamic
Validates
Validates
Validates
Validates
© IIST, 1996-2010 www.iist.org 25
www.spinstitute.org 26
© IISP, 1996-2008
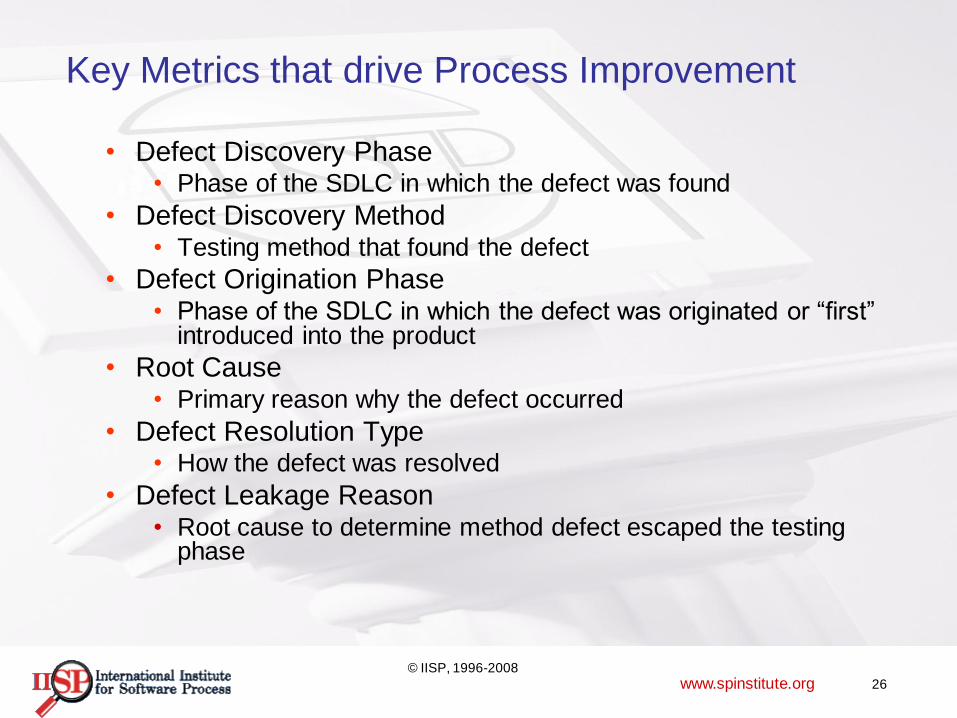
Key Metrics that drive Process Improvement
• Defect Discovery Phase• Phase of the SDLC in which the defect was found
• Defect Discovery Method• Testing method that found the defect
• Defect Origination Phase• Phase of the SDLC in which the defect was originated or “first”
introduced into the product
• Root Cause• Primary reason why the defect occurred
• Defect Resolution Type• How the defect was resolved
• Defect Leakage Reason• Root cause to determine method defect escaped the testing
phase
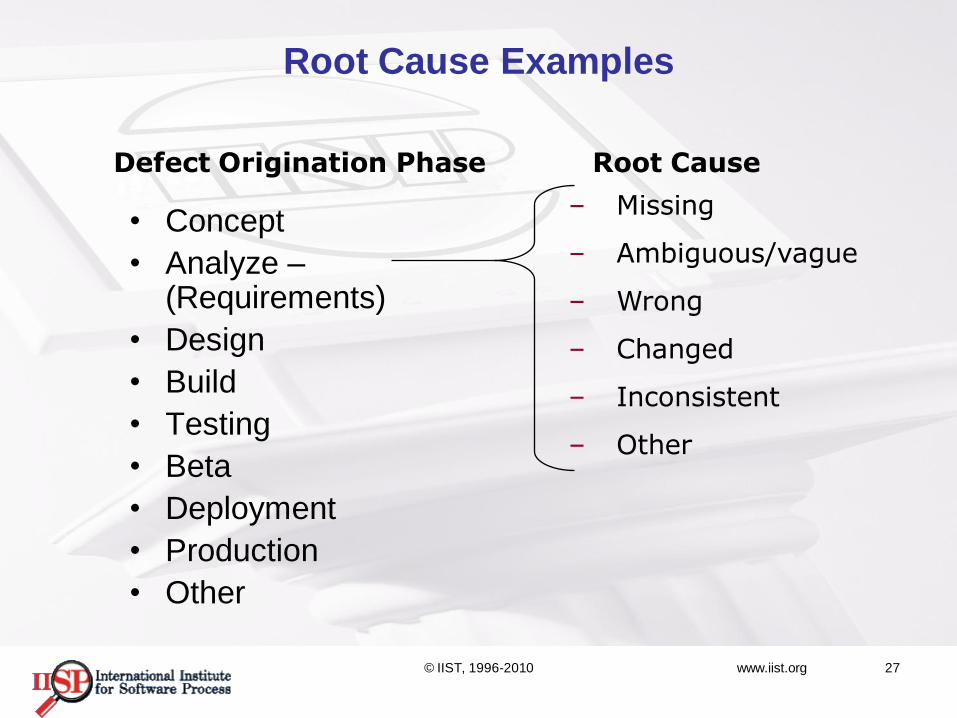
Root Cause Examples
• Concept
• Analyze –(Requirements)
• Design
• Build
• Testing
• Beta
• Deployment
• Production
• Other
– Missing
– Ambiguous/vague
– Wrong
– Changed
– Inconsistent
– Other
Defect Origination Phase Root Cause
© IIST, 1996-2010 www.iist.org 27
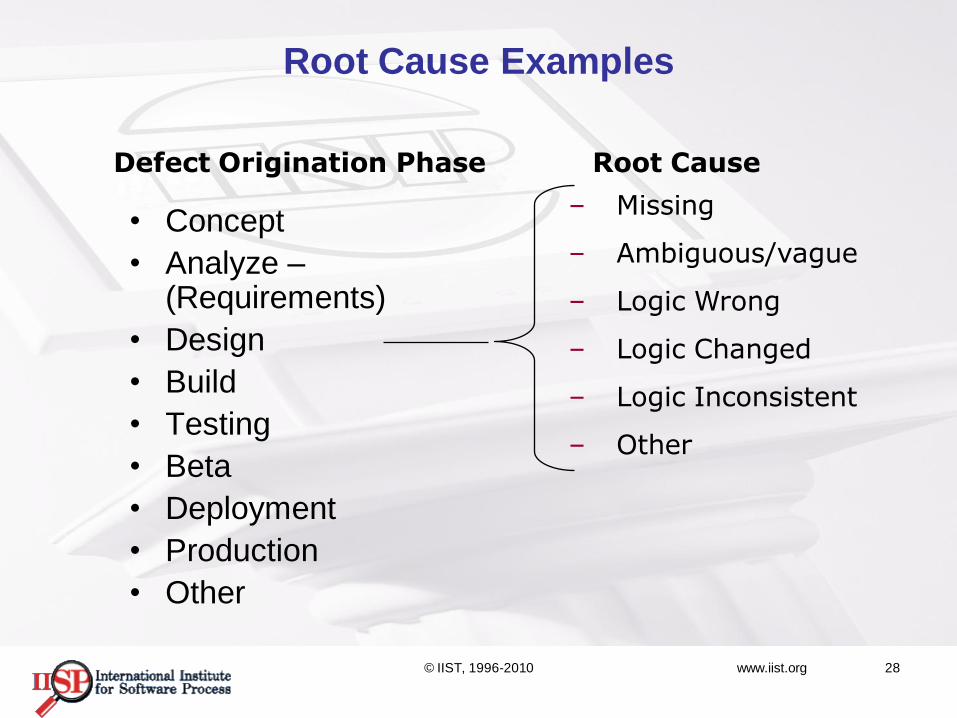
Root Cause Examples
• Concept
• Analyze –(Requirements)
• Design
• Build
• Testing
• Beta
• Deployment
• Production
• Other
– Missing
– Ambiguous/vague
– Logic Wrong
– Logic Changed
– Logic Inconsistent
– Other
Defect Origination Phase Root Cause
© IIST, 1996-2010 www.iist.org 28
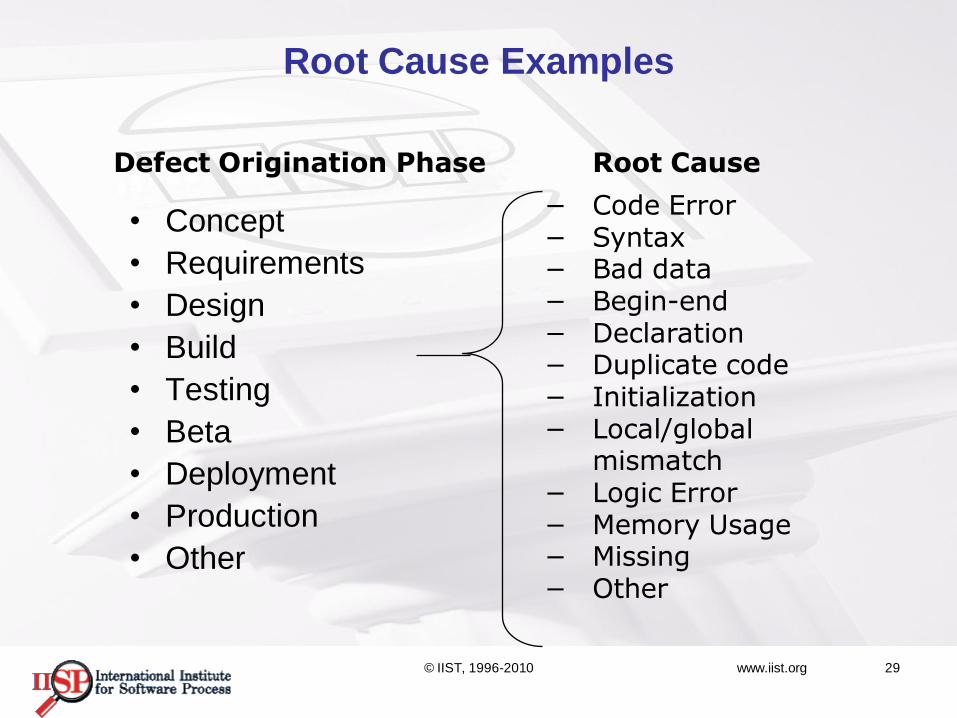
Root Cause Examples
• Concept
• Requirements
• Design
• Build
• Testing
• Beta
• Deployment
• Production
• Other
− Code Error− Syntax− Bad data− Begin-end− Declaration− Duplicate code− Initialization− Local/global
mismatch− Logic Error− Memory Usage− Missing− Other
Defect Origination Phase Root Cause
© IIST, 1996-2010 www.iist.org 29
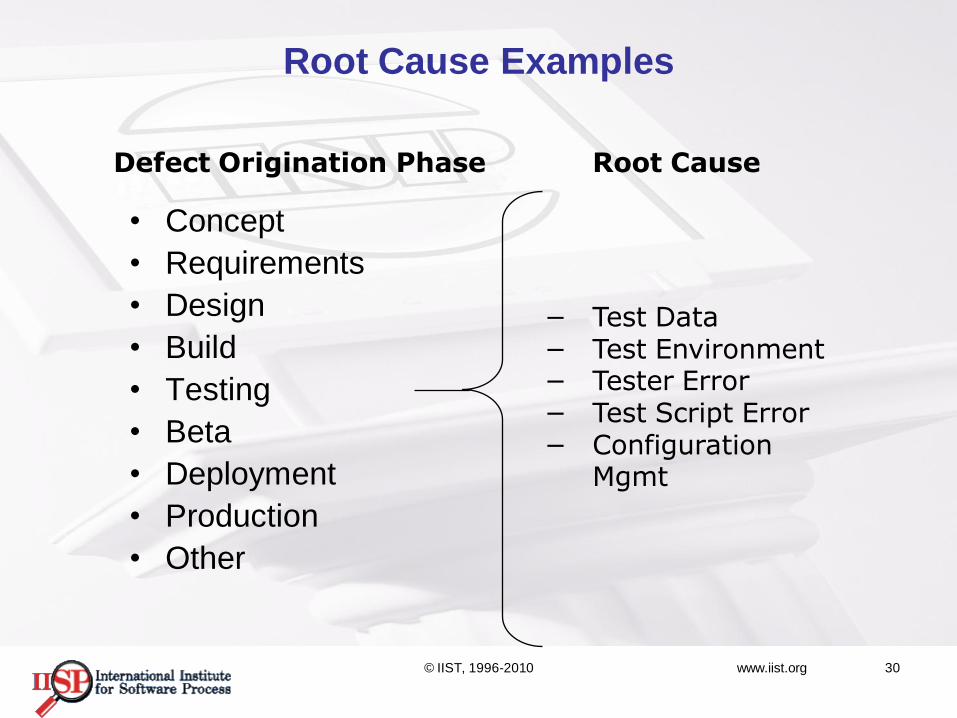
Root Cause Examples
• Concept
• Requirements
• Design
• Build
• Testing
• Beta
• Deployment
• Production
• Other
− Test Data− Test Environment− Tester Error− Test Script Error− Configuration
Mgmt
Defect Origination Phase Root Cause
© IIST, 1996-2010 www.iist.org 30
Effective Execution (Quality Assurance)
Goal: Effectively execute all of our projects (delivering
high-quality software, on budget and on
schedule)
Questions: Are defects detected early in the SDLC?
Where are we discovering defects?
How are we discovering our defects?
Are defects escaping to later test phases?
Metrics:
– Defect detection by discovery phase
– Defect detection by discovery method
© IIST, 1996-2010 www.iist.org 31
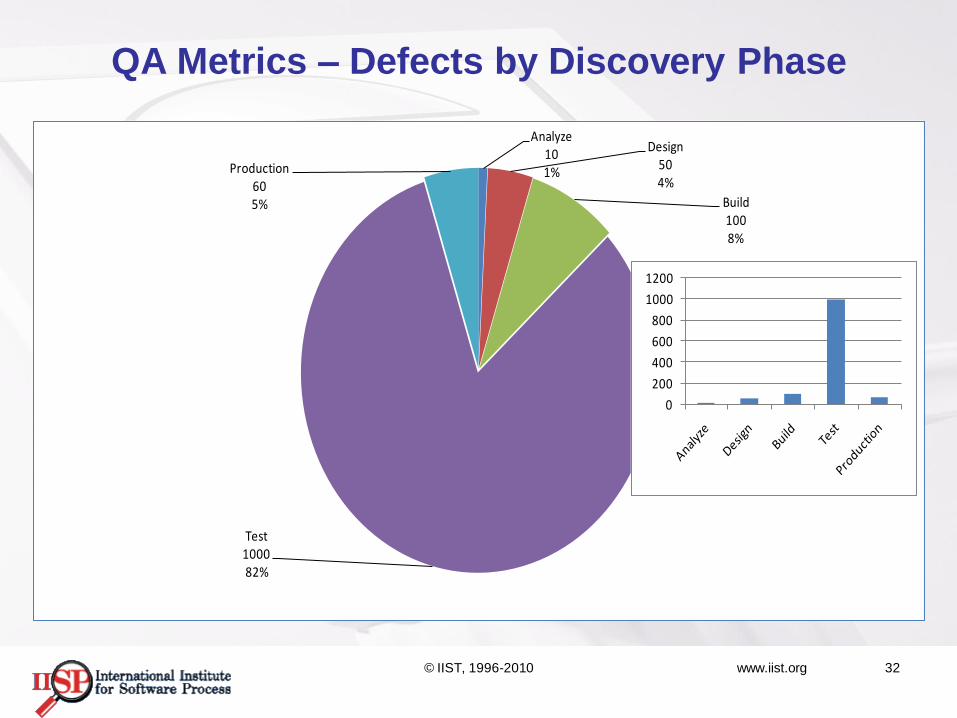
QA Metrics – Defects by Discovery Phase
Analyze101%
Design504%
Build1008%
Test100082%
Production605%
0
200
400
600
800
1000
1200
© IIST, 1996-2010 www.iist.org 32
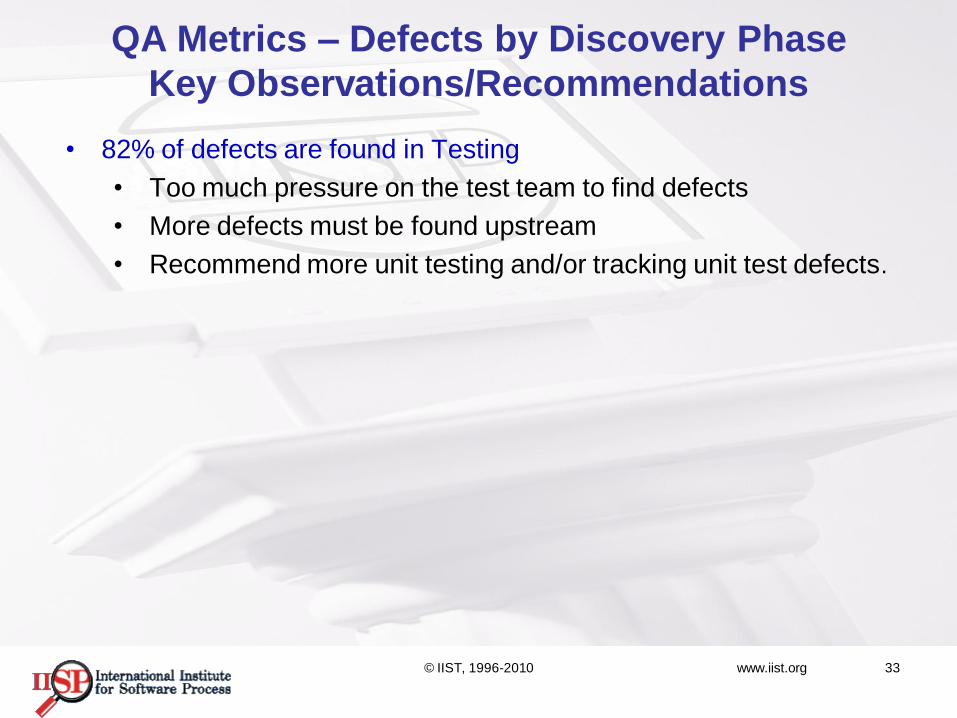
QA Metrics – Defects by Discovery Phase
Key Observations/Recommendations
• 82% of defects are found in Testing
• Too much pressure on the test team to find defects
• More defects must be found upstream
• Recommend more unit testing and/or tracking unit test defects.
© IIST, 1996-2010 www.iist.org 33
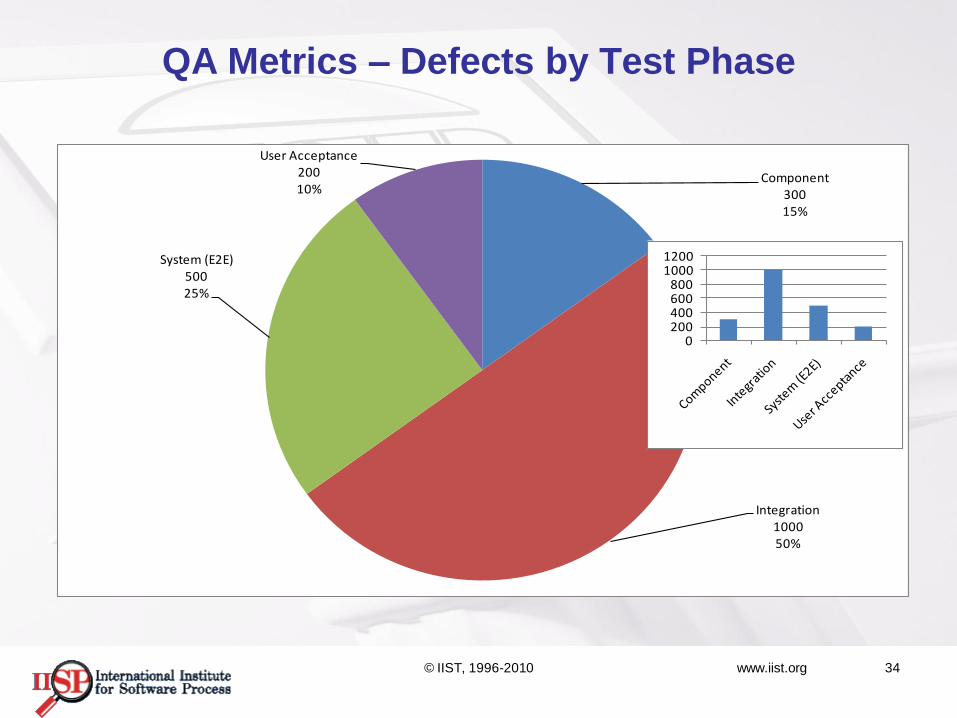
QA Metrics – Defects by Test Phase
Component30015%
Integration100050%
System (E2E)50025%
User Acceptance20010%
0200400600800
10001200
© IIST, 1996-2010 www.iist.org 34
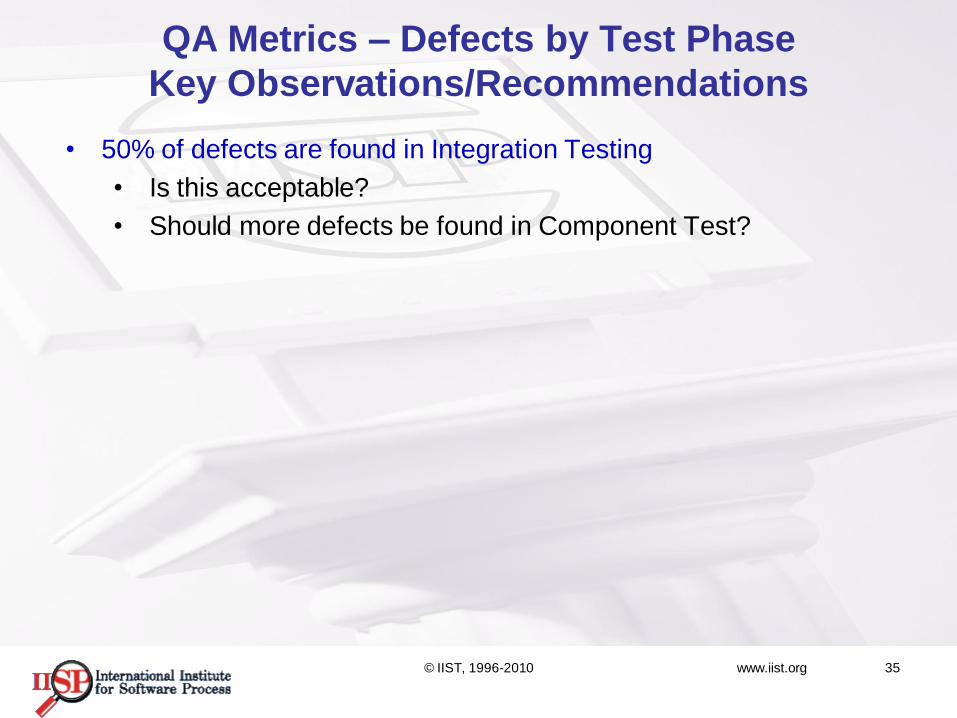
QA Metrics – Defects by Test Phase
Key Observations/Recommendations
• 50% of defects are found in Integration Testing
• Is this acceptable?
• Should more defects be found in Component Test?
© IIST, 1996-2010 www.iist.org 35
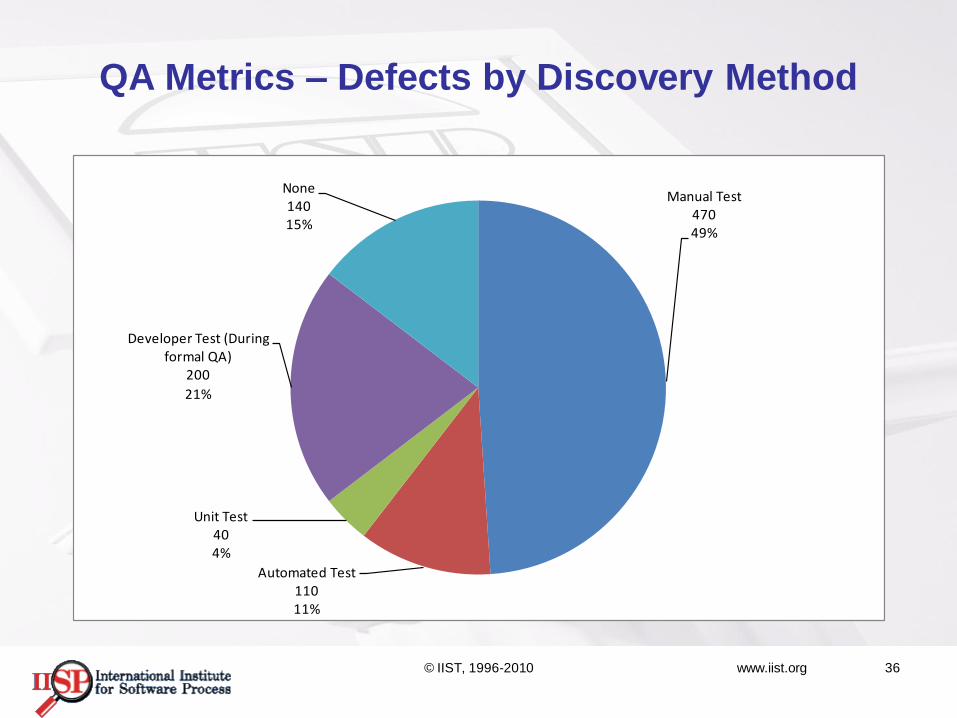
QA Metrics – Defects by Discovery Method
Manual Test47049%
Automated Test11011%
Unit Test404%
Developer Test (During formal QA)
200
21%
None14015%
© IIST, 1996-2010 www.iist.org 36
QA Metrics – Defects by Discovery Method
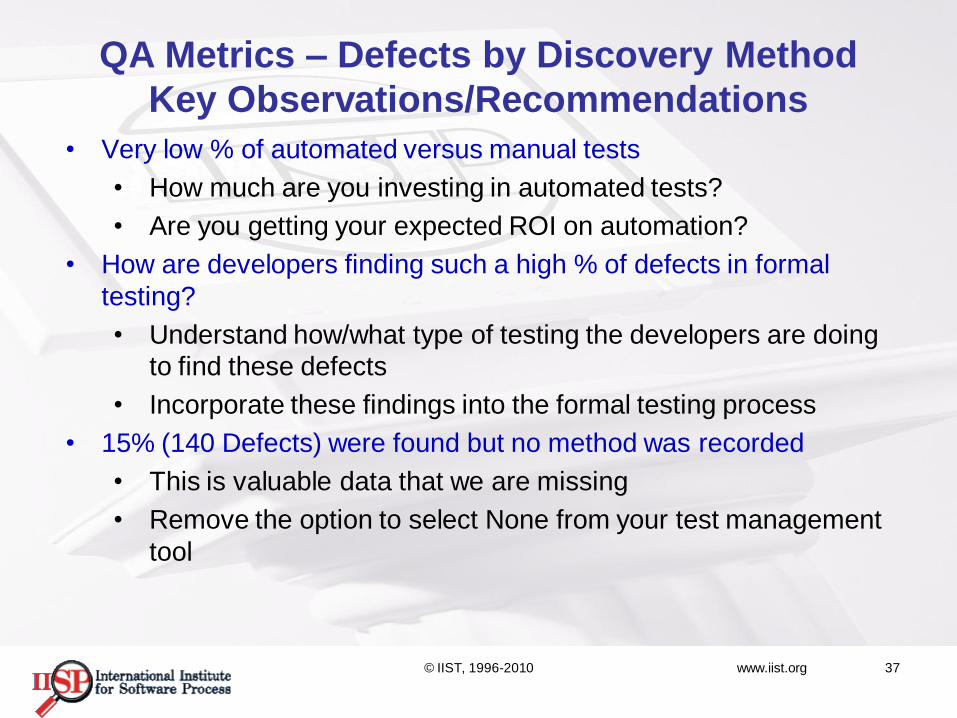
Key Observations/Recommendations
• Very low % of automated versus manual tests
• How much are you investing in automated tests?
• Are you getting your expected ROI on automation?
• How are developers finding such a high % of defects in formal
testing?
• Understand how/what type of testing the developers are doing
to find these defects
• Incorporate these findings into the formal testing process
• 15% (140 Defects) were found but no method was recorded
• This is valuable data that we are missing
• Remove the option to select None from your test management
tool
© IIST, 1996-2010 www.iist.org 37
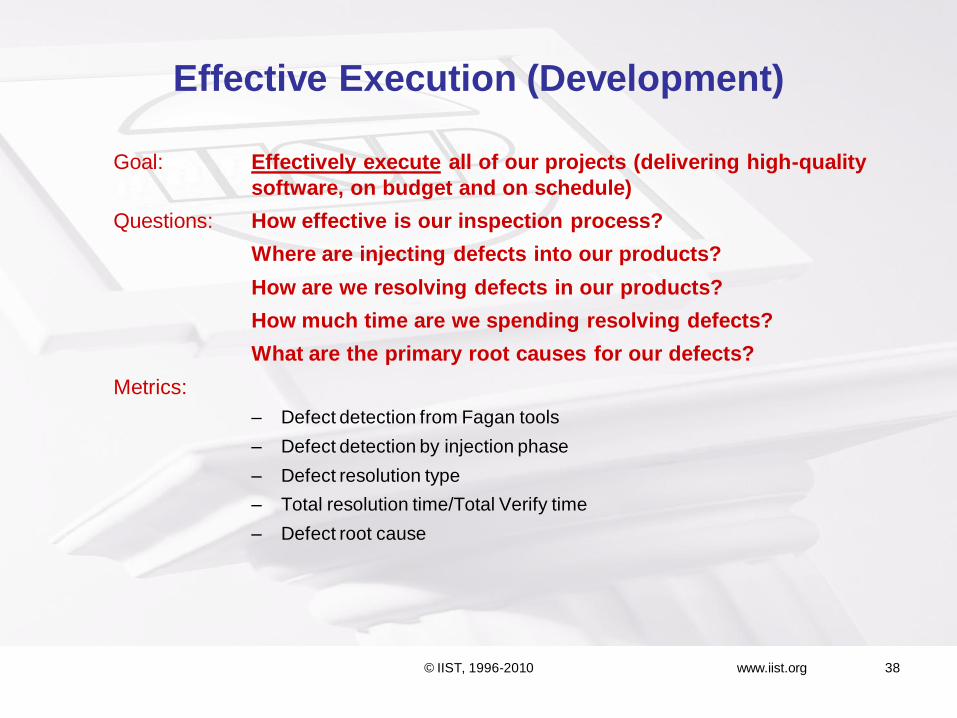
Effective Execution (Development)
Goal: Effectively execute all of our projects (delivering high-quality
software, on budget and on schedule)
Questions: How effective is our inspection process?
Where are injecting defects into our products?
How are we resolving defects in our products?
How much time are we spending resolving defects?
What are the primary root causes for our defects?
Metrics:
– Defect detection from Fagan tools
– Defect detection by injection phase
– Defect resolution type
– Total resolution time/Total Verify time
– Defect root cause
© IIST, 1996-2010 www.iist.org 38
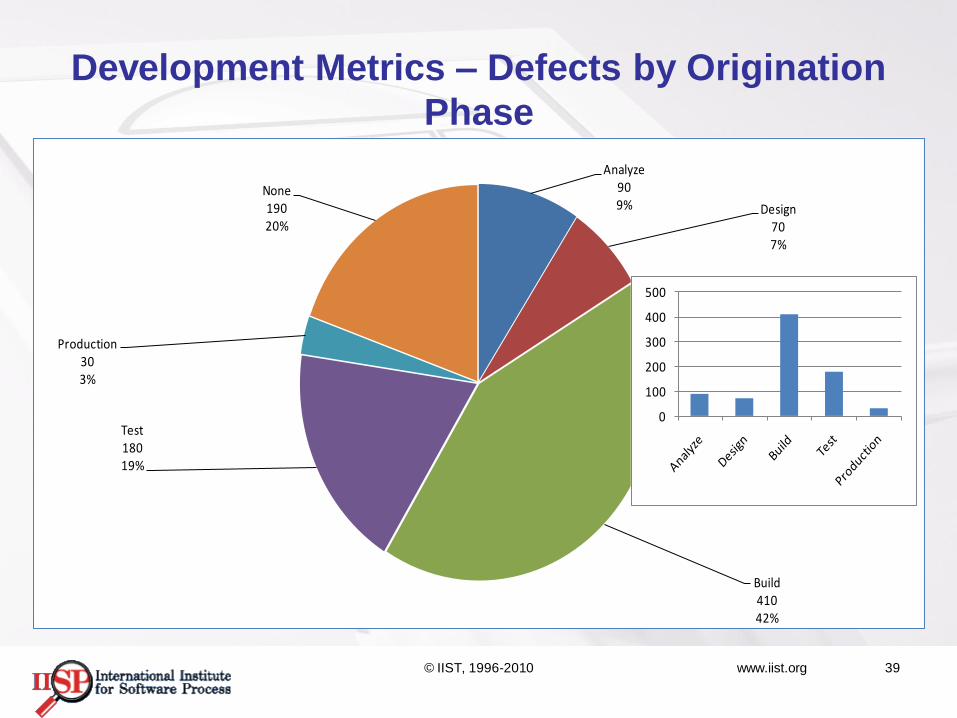
Development Metrics – Defects by Origination
Phase
Analyze909% Design
707%
Build41042%
Test18019%
Production303%
None19020%
0
100
200
300
400
500
© IIST, 1996-2010 www.iist.org 39
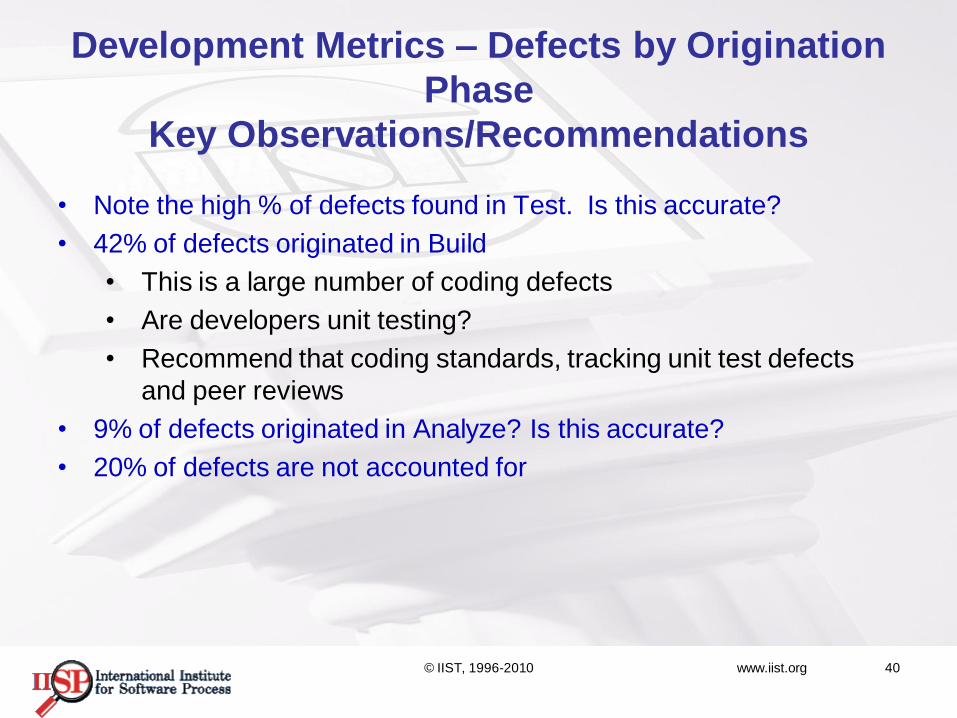
Development Metrics – Defects by Origination
Phase
Key Observations/Recommendations
• Note the high % of defects found in Test. Is this accurate?
• 42% of defects originated in Build
• This is a large number of coding defects
• Are developers unit testing?
• Recommend that coding standards, tracking unit test defects
and peer reviews
• 9% of defects originated in Analyze? Is this accurate?
• 20% of defects are not accounted for
© IIST, 1996-2010 www.iist.org 40
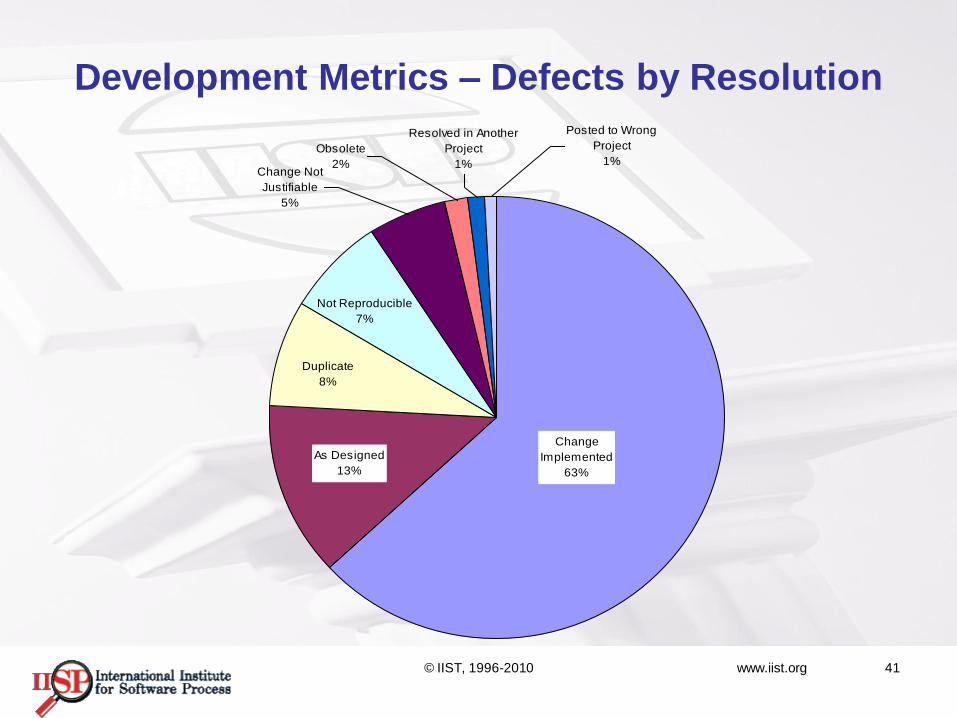
Development Metrics – Defects by Resolution
Obsolete
2%
Resolved in Another
Project
1%
Posted to Wrong
Project
1%Change Not
Justifiable
5%
Not Reproducible
7%
Duplicate
8%
Change
Implemented
63%
As Designed
13%
© IIST, 1996-2010 www.iist.org 41
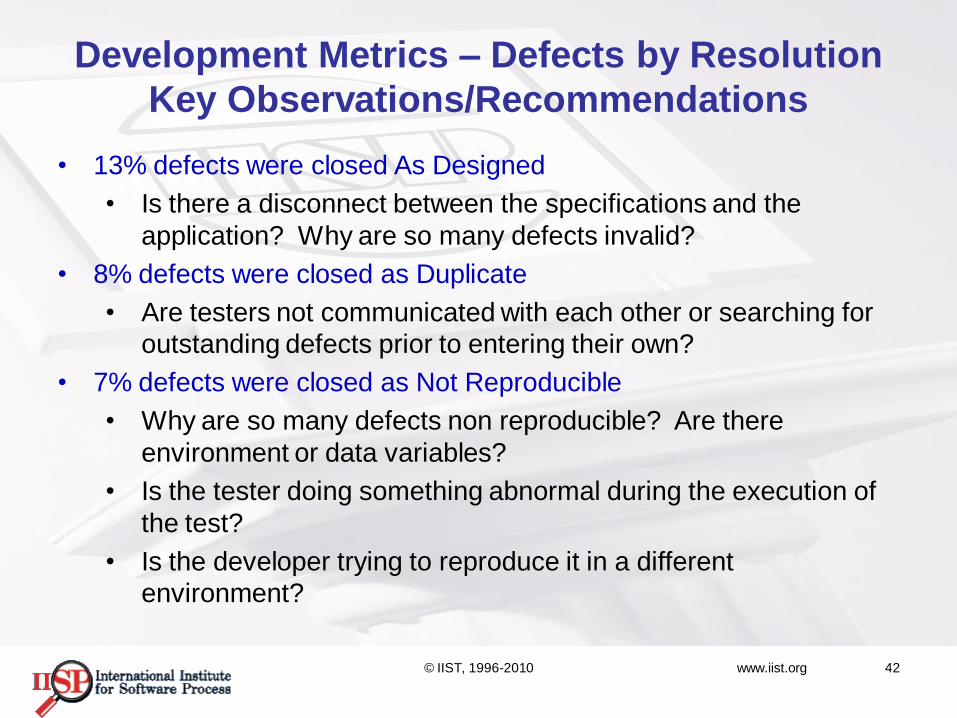
Development Metrics – Defects by Resolution
Key Observations/Recommendations
• 13% defects were closed As Designed
• Is there a disconnect between the specifications and the
application? Why are so many defects invalid?
• 8% defects were closed as Duplicate
• Are testers not communicated with each other or searching for
outstanding defects prior to entering their own?
• 7% defects were closed as Not Reproducible
• Why are so many defects non reproducible? Are there
environment or data variables?
• Is the tester doing something abnormal during the execution of
the test?
• Is the developer trying to reproduce it in a different
environment?
© IIST, 1996-2010 www.iist.org 42
Understanding the Cost of Poor Quality
(CoPQ)
Cost of Poor Quality: The cost of rework associated with fixing any
defects in the product. This includes support
and maintenance costs associated with a
product.
Cost of Quality: The regularly schedule cost for testing a
product. This includes unit testing as well as
the cost for each test phase.
REWORK!!
© IIST, 1996-2010 www.iist.org 43
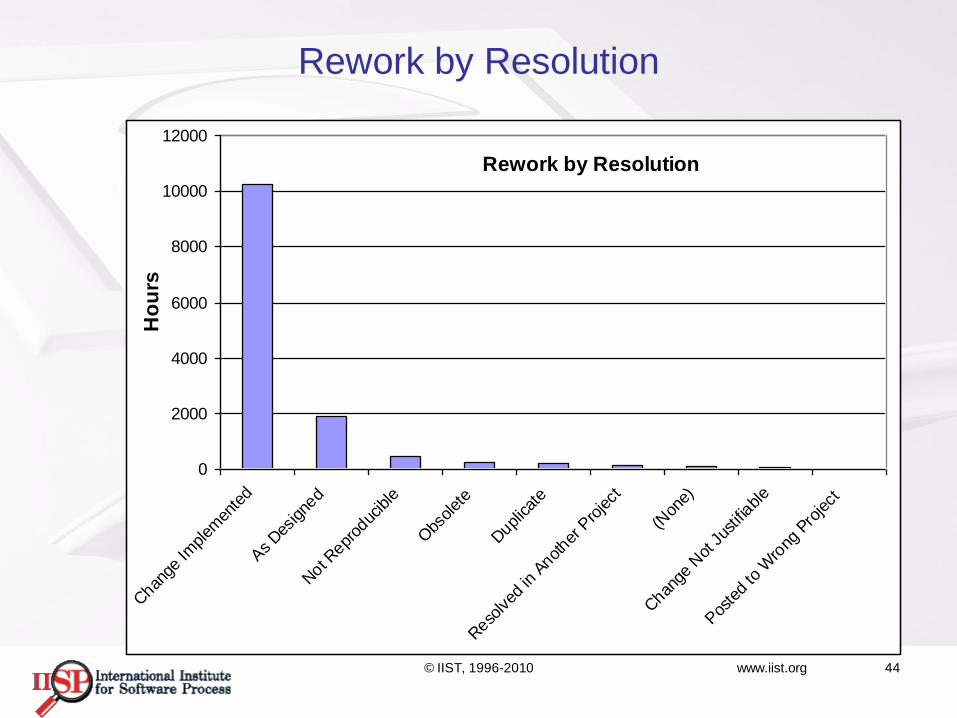
Rework by Resolution
Rework by Resolution
0
2000
4000
6000
8000
10000
12000
Chan
ge Im
plem
ente
d
As Des
igne
d
Not R
eprod
ucible
Obs
olet
e
Dupl
icat
e
Reso
lved
in A
nother
Pro
ject
(Non
e)
Chan
ge N
ot Jus
tifiable
Pos
ted to
Wro
ng P
roject
Ho
urs
© IIST, 1996-2010 www.iist.org 44
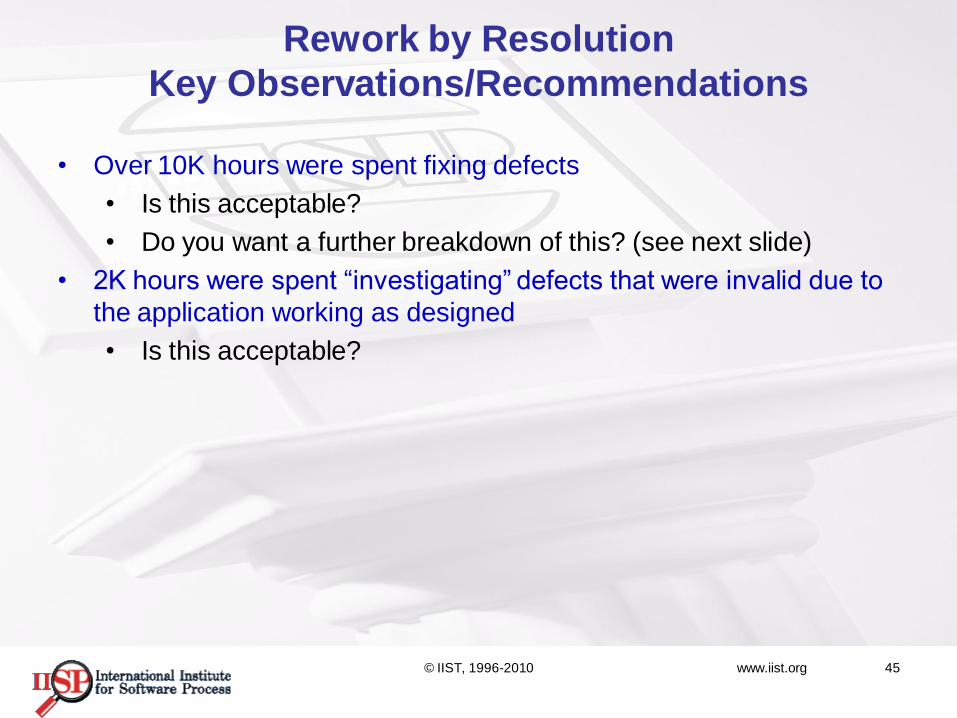
Rework by Resolution
Key Observations/Recommendations
• Over 10K hours were spent fixing defects
• Is this acceptable?
• Do you want a further breakdown of this? (see next slide)
• 2K hours were spent “investigating” defects that were invalid due to
the application working as designed
• Is this acceptable?
© IIST, 1996-2010 www.iist.org 45
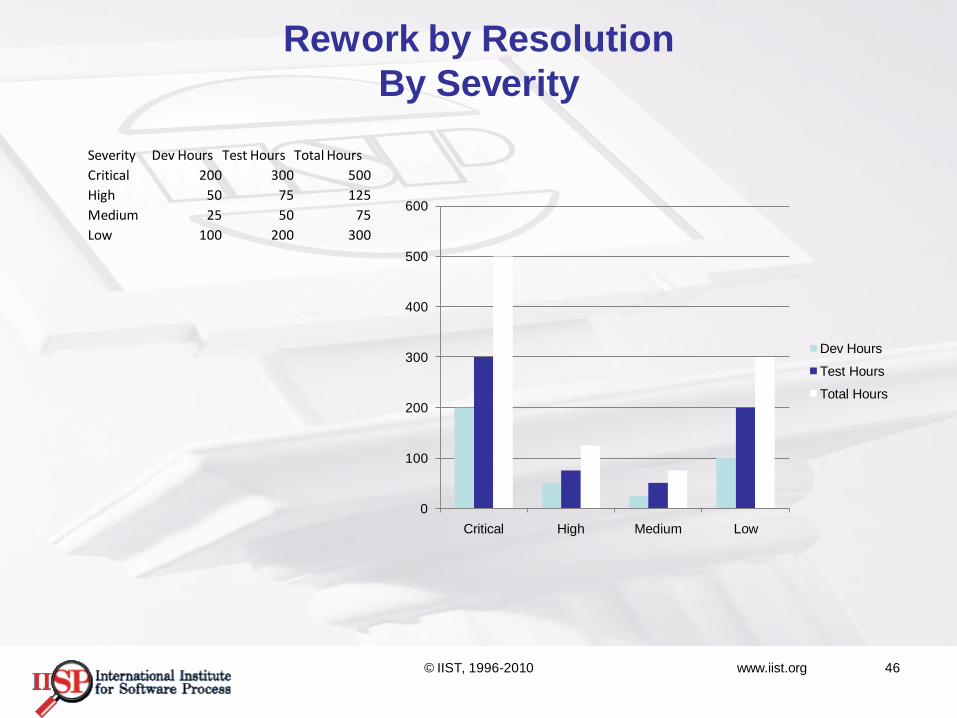
Rework by Resolution
By Severity
0
100
200
300
400
500
600
Critical High Medium Low
Dev Hours
Test Hours
Total Hours
Severity Dev Hours Test Hours Total Hours
Critical 200 300 500
High 50 75 125
Medium 25 50 75
Low 100 200 300
© IIST, 1996-2010 www.iist.org 46
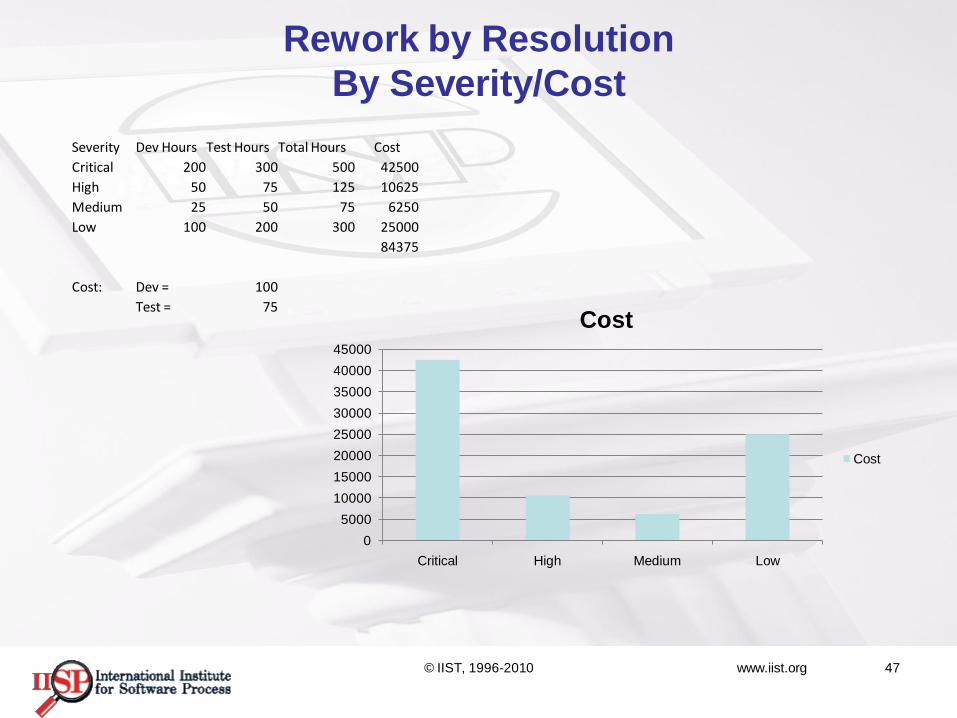
Rework by Resolution
By Severity/Cost
Severity Dev Hours Test Hours Total Hours Cost
Critical 200 300 500 42500
High 50 75 125 10625
Medium 25 50 75 6250
Low 100 200 300 25000
84375
Cost: Dev = 100
Test = 75
0
5000
10000
15000
20000
25000
30000
35000
40000
45000
Critical High Medium Low
Cost
Cost
© IIST, 1996-2010 www.iist.org 47
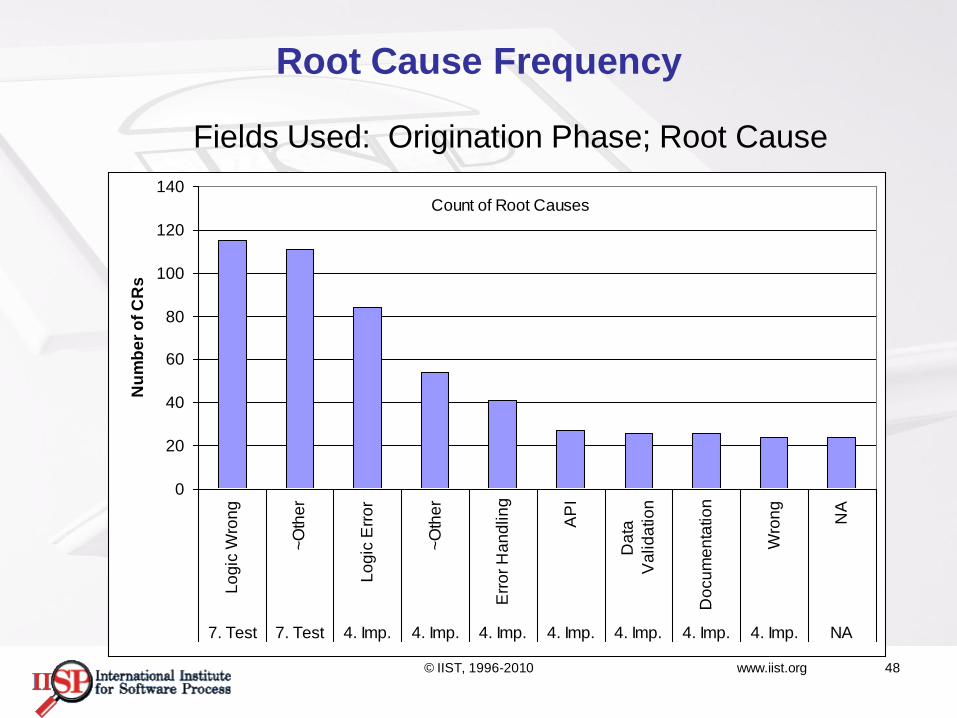
Root Cause Frequency
Fields Used: Origination Phase; Root Cause
Count of Root Causes
0
20
40
60
80
100
120
140
Lo
gic
Wro
ng
~O
the
r
Lo
gic
Err
or
~O
the
r
Err
or
Ha
nd
lin
g
AP
I
Da
ta
Va
lid
atio
n
Do
cu
me
nta
tio
n
Wro
ng
NA
7. Test 7. Test 4. Imp. 4. Imp. 4. Imp. 4. Imp. 4. Imp. 4. Imp. 4. Imp. NA
Nu
mb
er
of
CR
s
© IIST, 1996-2010 www.iist.org 48
Root Cause Frequency
Key Observations/Recommendations
• Almost 200 defects (CRs) are caused due to Logic errors
• This project is having serious issues with their design logic
• Are requirements clear?
• Are these inexperienced developers?
• Do they truly understand how the system is built?
• Over 170 defects are due to UNKNOWN reasons
• Unacceptable
• We have no idea how to fix these issues because the root cause
is unknown
© IIST, 1996-2010 www.iist.org 49
www.spinstitute.org 50
© IISP, 1996-2008
THANK YOU!!
CONTACT INFO:
QUESTIONS???