defence and security electronics and systems
TRANSCRIPT

2
Driving successby executing our goals
Defence andSecurity Electronicsand Systems

3
Radars andIntegrated Systems
Marina Grossi
CEO
Driving successby executing our goals
4
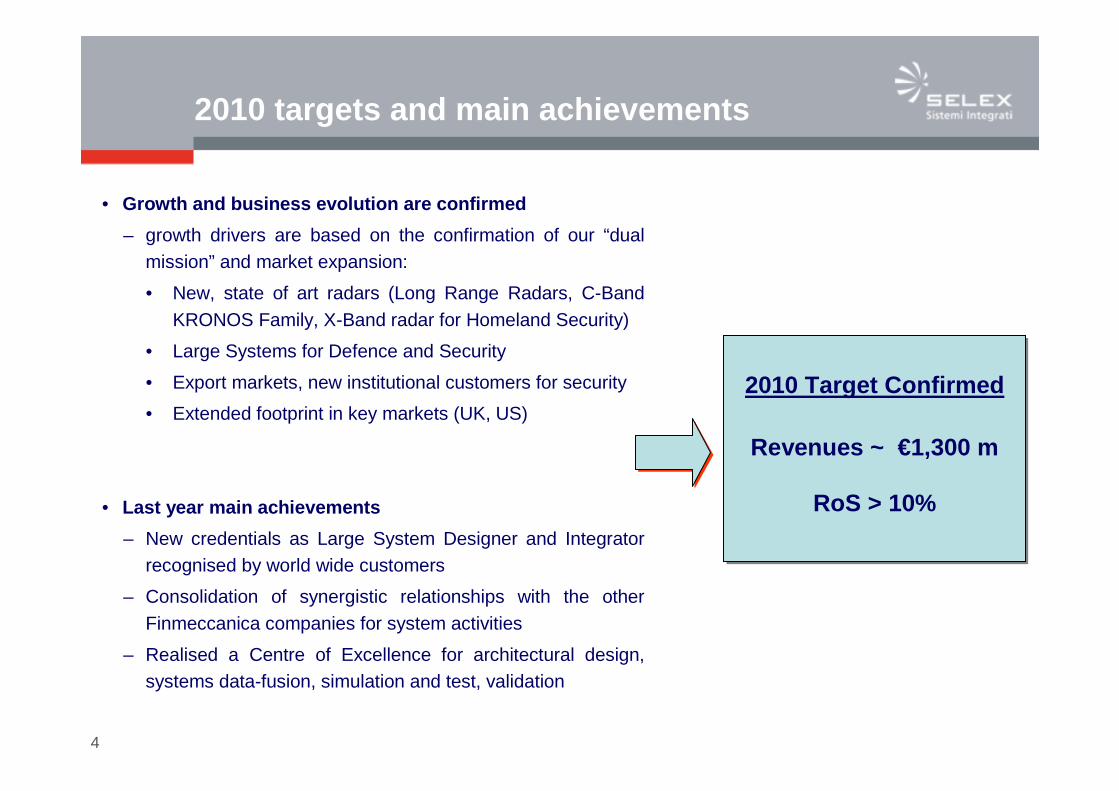
2010 targets and main achievements
• Growth and business evolution are confirmed
– growth drivers are based on the confirmation of our “dual mission” and market expansion:
• New, state of art radars (Long Range Radars, C-Band KRONOS Family, X-Band radar for Homeland Security)
• Large Systems for Defence and Security
• Export markets, new institutional customers for security
• Extended footprint in key markets (UK, US)
• Last year main achievements
– New credentials as Large System Designer and Integrator recognised by world wide customers
– Consolidation of synergistic relationships with the other Finmeccanica companies for system activities
– Realised a Centre of Excellence for architectural design, systems data-fusion, simulation and test, validation
Revenues ~ €1,300 m
RoS > 10%
2010 Target Confirmed

5
3%14%
33%
45%
5%
56%
21%
5%
12%
6%
• ATMAS
• Logistics
• Large Systems
• Land Systems
• Naval Systems
• Italy
• Rest of Europe
• America
• Far East
• Middle East & Africa
2006 - 2010 Growth and business evolution
42%
23%
4%
17%
14%
22%
15%
16%13%
26%
8%
From stand alone productsand “verticalised” systems
To large scale, cross-domain solutions
€673m8.8% RoS
€673m8.8% RoS
20062006 2010E2010E
ca.€1,300m> 10% RoSca.€1,300m> 10% RoS
Focus on…internationalisationbalanced portfoliostable profitability
20062006 2010E2010E
Border & TerritoryControl
Combat SystemsIntegration
Strategic C4I &Air Defence Systems
Land & Naval Radars
Air Traffic Radars& Centers
Naval Combat Management Systems
Security
Defence

6
Revenues growth
• Air Traffic Management
• Logistics
• Large Systems
• Land Systems
• Naval Systems
2006 2010E
GROWTH DRIVERS• Major programmes in the Italian market , for key military
and institutional customers:- Digitalised Brigade- New Frigates (FREMM) and Upgradings- Integrated Systems for Italian Civil Protection
• Relevant opportunities in legacy business , both in Italy and worldwide:- Long Range Radars (Italy, Algeria, Morocco)- Air Traffic Radars and Centers (Russia, China,
Malaysia, Syria)- Naval Radar and Systems for export markets (UAE,
Algeria, Turkey, India, Indonesia)• Strong demand in the area of Homeland Security , with
some major opportunities close to materialise:- Border and Territory Control (Algeria, Saudi, Turkey)- VTS and Maritime Awareness (Italy, Malaysia,
Greece, Yemen)- Critical Infrastructure Protection (Saudi, Turkey, UAE,
Italy, Russia)
SUPPORTING ACTIONS• Increasing commercial efforts in the most attractive areas• Selective external growth and local and programme-
focused alliances• Continuous improvement of system-oriented capabilities
• Italian MoD Radars (~400)• Export Systems (>400)
• Italian Civil Protection (~100)• Large Systems for export
Homeland Security (~400)• Vessel Traffic Systems(~150)
• Digitalised Brigade (>400)
• FREMM (>100)• Italian upgradings (>100)• Export customers (>300)
2007-2010Key Orders & Prospects
2007-2010Key Orders & Prospects
• Domestic programmes (~300)• Major export customers for
radars and centers (> 500)
• Italian Customers (~180)
Security
Defence
1,3001,300
673673
€ m

7
Ebit margin improvement
€ m
KEY DRIVERS AND SUPPORTING ACTIONS
• Business mix change- Increase amount of high value activities with significant
system integration content and service oriented solutions (from ~20% to ~45% of Revenues)
- Pursue customers with a more favorable spending attitude (high wealth countries)
- Consolidate legacy activities, with mature technologies and market proven products
- Innovative turn-key logistics with high value added activities
• Continuous review of industrial processes and operations, in order to obtain efficiency gains in procurement, production and logistics - Process and product standardisation- Product modularity and building block approach- Component re-use- COTS utilisation- Advanced Product and Knowledge management
procedures- SG&A effectiveness to reduce % of revenues- Increased R&D investment returns
59
> 130
8.8%
>10%
2006 2010E
Ebit Ebit margin

8
Investments: R&D and CAPEX
Military Radar 43%
ATC Radar 6%
Large Systems 20%
Other Systems 7%
ATM Systems 24%
Total Gross R&D (Accumulated 2007-2010)
Product Development
65%
Mandatory 5%
Maintenance 30%
Customer funded 66%
Expensed 6%
Capitalised investments
28%
€53 m€53 m
€780 m€780 m
Capitalised R&D 2007-2010
€218 m€218 m
CAPEX (Accumulated 2007-2010)

9
Driving successby executing our goals
Defence andSecurity Electronicsand Systems

10
Driving successby executing our goals
Sensors andAirborne Systems
Steve MogfordCEO

11
Products and programmes
Product LinesProduct Lines Major Achievements of 2007Major Achievements of 2007
AirborneRadar
Electronic Warfare & Battlespace
Avionics & UAS
Integrated Logistic Support
Space
Electro Optics
•EFA Typhoon Salam
•Countermeasures particularly in US
•Seaspray E-Scan Radar - US Coast Guard -flight qualification - opportunity for follow-onsales
•Coast Watch Australia - ATOS Surveillancesystems
•Storm Shadow - Naval Scalp
•UK Tornado support programme
•Falco UAV in service with export Customer a leading EU Tactical UAV Company

12
Year 2010 target
Revenue targets 2010:
Reasons for difference:
- Re-definition of NATO AGS Ground Surveillance Programme
- Re-scheduling of NH-90 deliveries
- Re-scheduling of ATOS Surveillance sales
- Grifo & Vixen combat radar export
Investor DayPresentation 2006
Investor DayPresentation 2007
�€2.4 bn E �€2.2 bn E
13
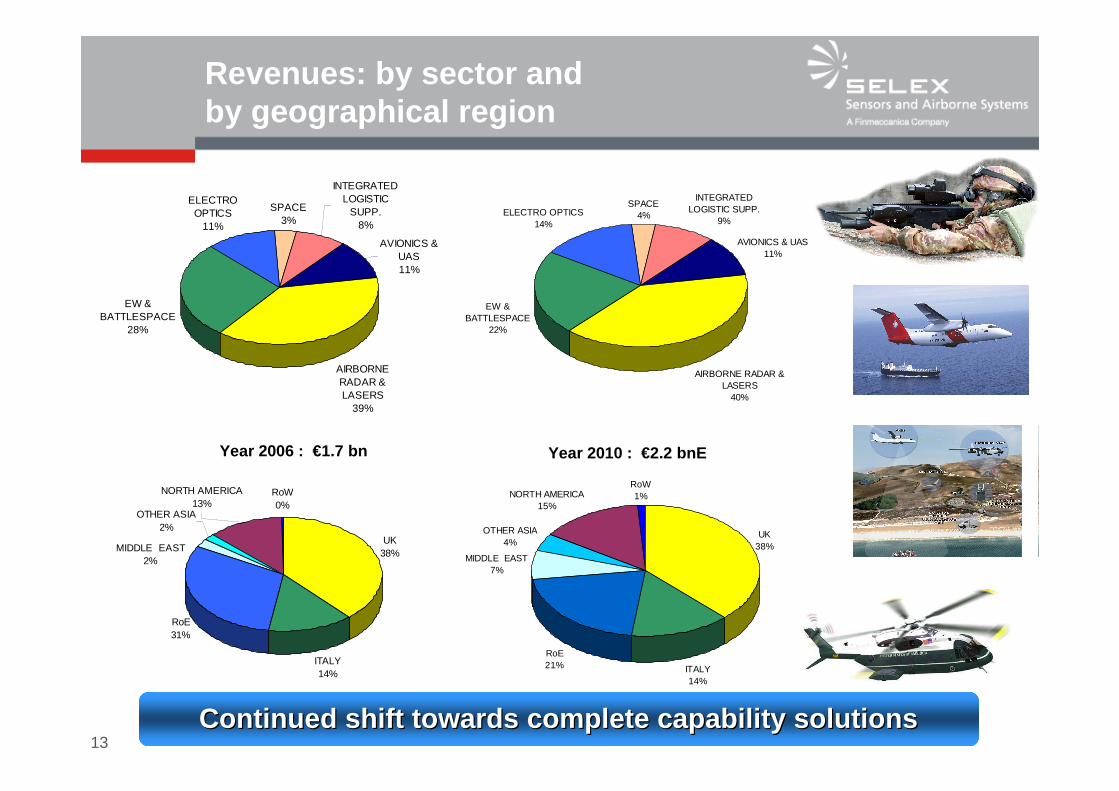
UK38%
ITALY14%
RoE21%
MIDDLE EAST7%
OTHER ASIA4%
NORTH AMERICA15%
RoW1%
Revenues: by sector andby geographical region
Year 2010 : €2.2 bnE
ITALY14%
RoE31%
RoW0%
MIDDLE EAST2%
OTHER ASIA2%
NORTH AMERICA13%
UK38%
AIRBORNE RADAR & LASERS
39%
ELECTRO OPTICS
11%
SPACE 3%
INTEGRATED LOGISTIC
SUPP.8%
AVIONICS & UAS11%
EW & BATTLESPACE
28%
AIRBORNE RADAR & LASERS
40%
ELECTRO OPTICS14%
SPACE 4%
INTEGRATED LOGISTIC SUPP.
9%
AVIONICS & UAS11%
EW & BATTLESPACE
22%
Continued shift towards complete capability solutio nsContinued shift towards complete capability solutio ns
Year 2006 : €1.7 bn

14
Drivers of revenue growth
• Production orders for mature products
• Exploitation of E-scan radar technology
• Tactical UAVs, UAV payloads and Support
• Exploitation of Situational Awareness Capability in Land Sector
• Maritime and Border Surveillance
• Through Life Support Capability of in-service Inventory
2006 2006 -- 2010 CAGR: 5.8% 2010 CAGR: 5.8%

15
Increasing profitability
• Quality of new order intake
• Acceleration of integration process and simplifying and rationalising group structure
• SG&A costs growing slower than revenues - SG&A Growth 2006-10 ~ 5%, Revenue Growth 2006-10 ~ 25%
• Investment levels growing yet absorbing a lower percentage of revenues
- Capex 3.2% of revenues in 2006 - 2.8% in 2010
RoSRoS growth from under 7% in 2005 to over 10% in 2010growth from under 7% in 2005 to over 10% in 2010

16
Investments: R&D and CAPEX
Capex 2007- 2010: €250 m
Total R&D 2007- 2010: €1,150 m
Total R&D stable at 16% throughout plan
Self funded R&D (4% of Revenues) is almost entirely expensed in P&L
Costs currently being Capitalised (1%) refer to E-Scan radar
Balance of spend moving from major infrastructure projects to support specific product launches
CAPEX IN 2007-2010
Product development
59%
Maintenance 26%
Mandatory 15%
Capitalised R&D2007-2010
E Scan Radar 100%
Total Gross R&D Investments2007- 2010
Customer funded
74%
Capitalisedinvest. 1%
Expensed 25%
17
Key messages
• Order book quality improving because of product maturity
• Attention being placed on margins - not on revenues
• Driving underlying performance to improve margins
• Working Key Markets: North America, Middle East, Asia
• A leading player in the UAV market in European tactical UAS
• Servicing the TLCM Support market
• Focussing Land - Battlespace product portfolio
• Systems approach to business opportunities
Positioned for the future Positioned for the future
19
FINMECCANICA INVESTOR DAY
Selex Communications
NOVEMBER 2006
Roma, November 2006
Communication systems
Maurizio TucciCEO
Driving successby executing our goals

20
Revenue growth 2006 - 2010
Revenues: €1,112 mROS: 12%
Investor Day 2006Investor Day 2006Targets 2010
Revenues: €1,100 mROS: 12%
Investor Day 2007Investor Day 2007Targets 2010
Consolidate in multidomestic market Growth in selected foreign market
Consolidate in multidomestic market Growth in selected foreign market
On the basis of 2007 expected results, these target s confirmedOn the basis of 2007 expected results, these target s confirmed
�Army & Security: €120 m; of which:� Saudi C4I: €28 m� Armasat: €36 m
�Avionics: €175 m; of which: � EFA: €42 m� NH90: €35 m� MIDS: €12 m� IFF: €10 m
� Inter Police Force Project €280 m; of which:� Progetto Interpolizie: €250 m
�Naval: €47 m
�Prof &Civil: €46 m
�Telcos & Rail €18 m
Last year achievements (orders):

21
Company evolution 2006 - 2010
From…From… …To…To
National domestic market
National National domestic domestic marketmarket
Growth in selected foreign markets
Growth in Growth in selected selected foreign foreign marketsmarkets
By Geography
ByMarket Segment
Focus on Defencemarket
segment
Focus on Focus on DefenceDefencemarket market
segmentsegment
Multifocuson Defence,
Secure Professional Civil market
MultifocusMultifocuson on DefenceDefence , ,
Secure Secure Professional Professional Civil marketCivil market
2006 revenues 2010 revenues
Army & Security
46%
Avionics32%
Professional & Civil
22%
Avionics25%
Army & Security
32%
Professional & Civil43%
Romania1%
"Multidomestic"
90%
Russia1%
Germany1%
Turkey1%
UK25%
Italy
61%
Rest of the Word;
10%
Russia2%
"Multidomestic"
81%
Romania1%
Germany2%
Turkey
4%
UK15%
Italy57%
Rest of the Word
19%
2006 revenues 2010 revenues
1272 M €€1,100 m
1272 M €€1,100 m1272 M €€703 m
1272 M €€703 m

22
� Focus on key activity projects
� Battlefield digitalisation (B-NEC)
� Avionics will leverage on FNM platform companies growth (Aeronautic and Helicopter)� “Interpolizie Project” (TETRA System)
� Internationalisation
� Capitalisation of the acquired experience in the major national projects (in particular TETRA, B-NEC) in order to reinforce presence on multi-domestic target markets (UK, Romania, Turkey) and other specific selected foreign countries (Russia, Brazil, India)
HOW
Revenue Growth
From…From… …To…To
2006
€703 m
20062006
€€703 m703 m
2010
€1,100 m
20102010
€€1,100 m 1,100 m
Revenue GrowthRevenue Growth

23
Profitability growth
From…From… …To…To
2006
8%
20062006
8%8%
2010
12%
20102010
12%12%
ROS GrowthROS Growth
� Reorganisation under process for
� Rationalisation and simplification of Company structure� Extraordinary measure to downsize work force (selecting skills in line with Communication
Systems core business) � 570 employees involved� €32 m - Cost in 2007 - 2009� €53 m - Benefits 2007-2009
� €18 m/year after 2009� Industrial processes optimisation
� Redesign-to-cost investments relevant to Communication Systems main key products� Savings obtained by means of optimisation of procurement processes and G&A structure
reduction
HOW
24
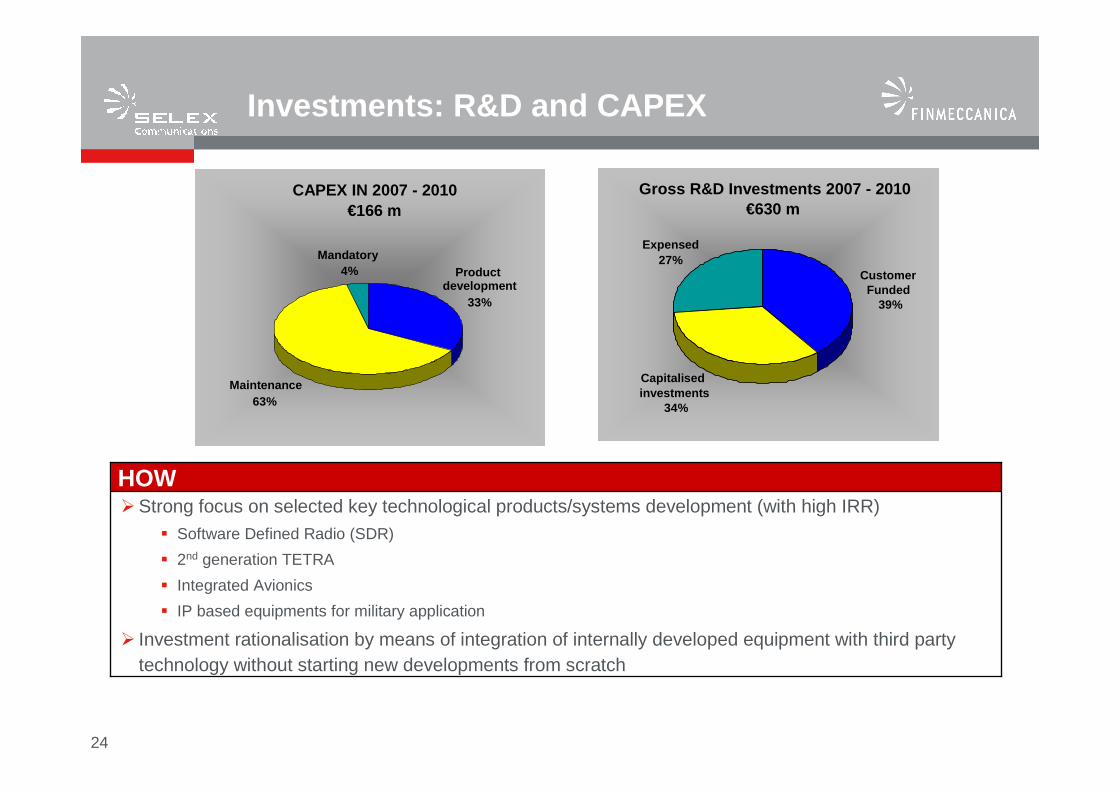
Investments: R&D and CAPEX
�Strong focus on selected key technological products/systems development (with high IRR)� Software Defined Radio (SDR)
� 2nd generation TETRA
� Integrated Avionics
� IP based equipments for military application
� Investment rationalisation by means of integration of internally developed equipment with third party technology without starting new developments from scratch
HOW
CAPEX IN 2007 - 2010€166 m
Maintenance63%
Product development
33%
Mandatory 4%
Gross R&D Investments 2007 - 2010€630 m
Customer Funded
Expensed 27%
Capitalisedinvestments
34%
39%

26
Security and Automation
Driving successby executing our goals
Carlo GualdaroniCEO

27
Revenue growth 2006 - 2010
€327 m
Forecast for security business (2010)
Investor Day 2006
Consolidate the domestic market and grow internatio nally:
• During the Investor Day 2006 Elsag Datamat presented its result and forecast for the security business only: €327 m in 2010
• On the basis of 2007 Expected results and of the updated Business Plan, this challenging target is today confirmed
€330 m
Forecast for security business (2010)
Investor Day 2007
Last year’s achievements (orders):
• Italian Postal System, sorting systems & ICT: €90 m
• Telecom Italia, secure communication solutions: €25 m
• Russian post hybrid mail: €65 m
• IT Service for Italian Government (Cnipa): €70 m
• USA Law Enforcement (including Lower Manhattan Security Project): €7 m
• Mission Planning NH 90: €7 m
• Frame contract ESA/Esrin Phase n. €4 m
• Minesweepers for Finish Navy: €4 m
28
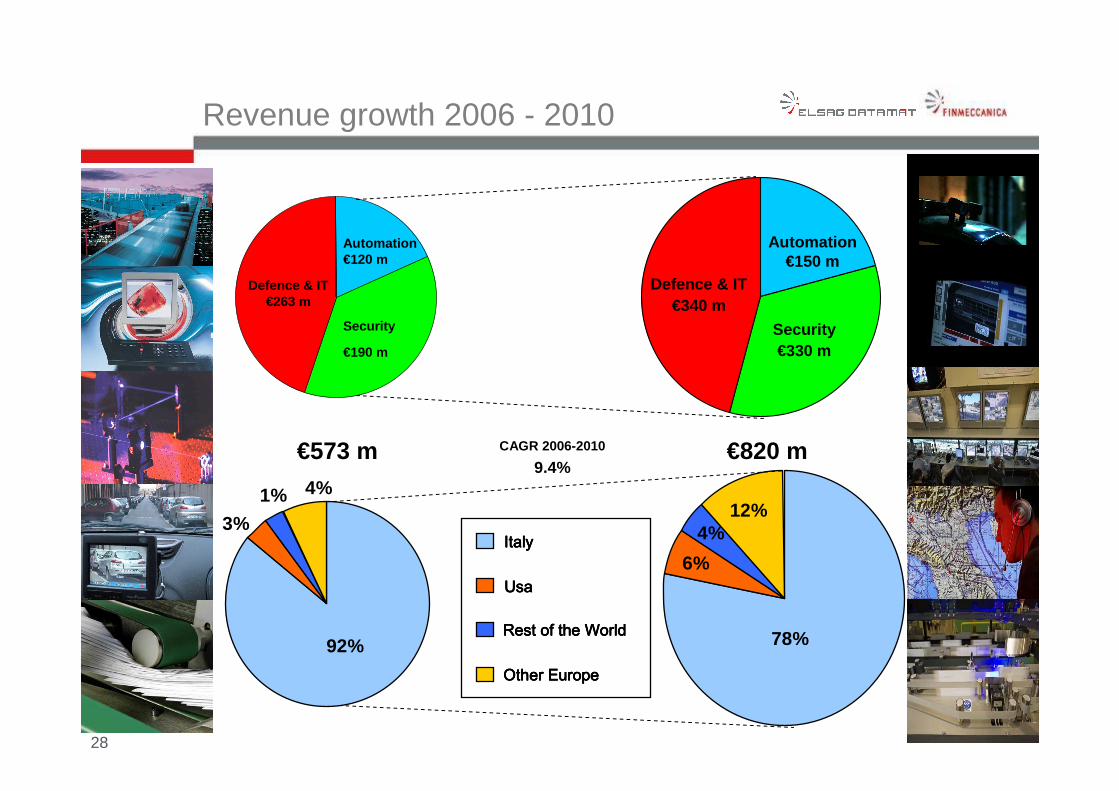
Revenue growth 2006 - 2010
Automation €120 m
Defence & IT €263 m
Security
€190 m
Automation €150 m
Defence & IT €340 m
Security €330 m
€573 m €820 mCAGR 2006-2010
9.4%
3%
4%1%
78%
6%
12%4%ItalyItalyItalyItaly
UsaUsaUsaUsa
Rest of the WorldRest of the WorldRest of the WorldRest of the World
Other EuropeOther EuropeOther EuropeOther Europe92%

29
Main drivers for growth
0
1000
2000
3000
4000
5000
2006 2007 2008 2009 2010
0
500
1000
1500
2000
2500
2006 2007 2008 2009 2010
0
400
800
1200
1600
2006 2007 2008 2009 2010
Automation
1370 Target Market 1540 3.0%
5.7%
8.8% Market Share 9.7%
120 Revenues 150
€m
Security
1500 Target Market 2350 11.9%
14.8%
12.6% Market Share 14.0%
190 Revenues 330
Defence & IT
4525 Target Market 5080 2.9%
6.6%
5.8% Market Share 6.7%
263 Revenues 340
CAGR
Consolidate the domestic marketand grow internationally:
Automation & Security
•Replicate the US success story and leverage on it to develop theinternational market, also through new international subsidiaries
•Continue investing in Security Solutions and Law Enforcement Products to present to international operators
•Complete “plurisorter” development, presenting it to operators to demonstrate the technological advantage delivered with our Automation business
Defence & IT
•Implement the mission of “Group Software Architect” and play an active role in all main Finmeccanica programmes
•Leverage being the new Group Center of Excellence for Logisticand Ground Support Solutions to enlarge the domestic and international market
•Increase efficiency through further business consolidation

31
Profitability trend
EBIT CAGR 2006 - 2010: 22%
12.5%8.0%
20102006
EBIT MARGIN
Cost savings : savings for G&A reduction and purchasing optimisation
Business synergies : integrated and cost effective Defence and IT business
€58 m
€22 m
Accumulated 2007-2010
The Elsag Datamat merger has provided significant business synergies and cost savings:

32
Investments: R&D and CAPEX
Capex (Accumulated 2007-2010: €60 m)
Total R&D (Accumulated 2007-2010: €117 m)
• The main capitalised R&D programme in Automation is the development of the new Multisorter Product Suite, which will enable us, starting in the second half 2008, to penetrate the parcel market, with a forecasted order intake of about €120 m in 2008 -2010
• Continuous upgrading of Law Enforcement Suite, to gain international market share
• €10 m investment in a new assembly facilitity in the US (Reles) to boost the Law Enforcement market penetration
CAPEX IN 2007-2010
Product development
20%
Mandatory 13%
Maintenance 67%
Total Gross R&D
Investments 2007-2010
Customer funded 30%
Capitalisedinvestments
31%
Expensed 39%
Capitalised R&D 2007-2010
Automation 50%
Security 28%
Defence & IT 22%

34
Armament Business
Carlo Alberto IardellaCEO
Driving successby executing our goals

35
Finmeccanica Investor Day, 2007 vs 2006
Disclosed Targets� 2010 Revenues €420 m� 2010 Ebit Margin > 10%
Disclosed Targets� 2010 Revenues €420 m� 2010 Ebit Margin > 10%
Investor Day
London November 20th, 2006
Investor Day
Cascina Costa November 26th, 2007
One Year After:
� Market success in Germany for 127/64 LW Vulcano Nava l Gun
� Guided Ammunitions Development Programmes on Track
� Portfolio of orders expected larger than 2006 and l argely from abroad
� Final set up of OTO Melara North America production facilities in USA

36
Revenues, EBIT and ROS evolution
2010 Total Revenues: €420 m
EBIT €42 m
ROS > 10%
Rest of EU
USA
ROW Italy
ASIA
Naval
Air
Ammunition
Land
2006 Total Revenues: €325 m
By Country
EBIT €30 m
ROS 9.1%
By Product Segment
Naval
AirAmmunition
Land
Rest of EU
ROW
ItalyASIA
CAGR 2006 – 2010 5%

37
Rationale for volume increase
Contract acquisition, new products/current products
New Products
�0
�100
�200
�300
�400
�500
�600
�2007 �2008 �2009 �2010
€m
�Air
�Land
�Ammunition
�Naval
�Current Products (All)
New products sales will boost acquisitionsand then revenues

38
Main new products (1/4): Guided ammunitions
DART VULCANO

39
Main new products (2/4):Naval
127/64 LW Vulcano Naval Gun STRALES for 76/62 SR

40
Main new products (3/4): Land
VBMWarrior
Lethality Improvement Program
FULL RANGE OF TURRETS FOR VEHICLES

41
Main new products (4/4):Air
Vulcan gun for JSFSDB
(Small Diameter Bombs)

42
Subsidiaries:
OTO MELARA IBERICA VALENCIA – SPAINOTO MELARA NORTH AMERICA WASHINGTON DC - USA
ROMA
BRESCIA
LA SPEZIA
Rationale for profitability increase (1/2)
Brescia site rationalisation
• Transfer of conventional manufacturing activities to subcontractors
• Layout and plant optimisation
La Spezia Site Improved efficiency
• Average manpower age reduction and competencies enhancement
• Focus on core activities
• Product and process reengineering

43
Rationale for profitability increase (2/2)
Means increase in sales, then higher volumeswith higher margins
New products with higher attractivenessand lower market competition

44
Investments: R&D and CAPEX
Capex Accumulated 2007-2010 : €39.8 m
€4.5 bn of Revenues expected from total R&D Investments in the next 10 years
Mandatory
Maintenance
Product Development
�CAPEX IN 2007-2010
�9%
�23%
�68%
Total R&D Accumulated 2007-2010 : €174.4 m
Self funded
Capitalised
Customer Funded
�Total Gross R&D Investments �2007-2010
�84%
�8%
�8%
New Turrets
Siccona (BM S)Others
US Navy 76/62 SR Qualification
66%
�Capitalised R&D2007-2010
�12%�6%
�16%