defense technical information
TRANSCRIPT

;·-----·-~~·~~~~'~biiiii1C ... IIiiA11i51111ii-...':1111 .. 5 .. 0-.wila.-111iD11i4•1T•i .. D._ ... ~---
DEFENSE TECHNICAl INFORMATION
CENTER
DEFENSE INFORMATION SYSTEMS AGENCY DEFENSE TECHNICAL INFORMATION CENTER
8725 JOHN J. KINGMAN ROAD, SUITE 0944 FORT BELVOIR. VIRGINIA 22060-6218

r·---.-.. --. ··--------4·-~·__.. .. ___... ... ~-----·~ ----__...~--~.~--............... p~~ l i
·---··-·-----------•'-.i.." ill-).'-''.;..· Ill _.,_.,._. tflli.''lli1 .. 61IMilililll ''ii!IIJII!i'~lt-il!ll"l~-l~itll~------
l•ofic~ on t h(• Redbtrihulion of DTI C -S upplit~d Information
\ ·; J \.'<:nJHion l·1r nht3lnm~.: DTIC ~==n L(t.'~. ~1 l i inlt•ntM~;,•r • r~,·t'l\c,J l ~om i) Ill.' ti:.tt ' ' :11 •! .:k.l.r· ;' m:.tr~d tor puhlh: rdc~c wtll n<! used ,,nly ti' htJ ,,:· ~·.-n~~m; '·' \'rk Lll1(11: r :t ' :-.; ( n•~nrllll\~ni .:< 1!1ll'3l'l •.\r gr:lnl l>r for !lllrpOSI!S '>P<.~Ulk:dh :tUli1l.lfl/i.!d h:. til~ l '· l J\>\t.'ffinll'!11 Zh'CI'h:l.' ~'WI !'i
;'on.~onng .1~:~:css Furtha. the mfonnatll\J! will no\ t'l' nubltsh-:J t',·.r pr,,t"tt •.'r in any m.ulnt:r •• >t ti:red for sak .
\ <.HH:,_,mpli:m<:t.: m:1y result in tcrmlnalt•l:t of .IL:-:c::>.s .mJ ;1 r~·qLHr~o'ml.'nt !1> rdum all int.,rm;Hi<m ,,htained from DTrC.
'iOTlCE
\.\'e :1rc pleased 10 supply this do~.:wncnl 111 rc::sp<mse w ~nur rcques!
!'he .u:quisltion of technical rcpon.s. note~. memorandums. etc. i-; :m active. dngomg program .11 :he Oefense Tecbniul Information Ccntu· (HTICl that depends. in p;1n, •.•n tiw ctt~ms .md 1 ntcr.-:-1 uf u::.ers ;md ~~mtn butors.
I hert!fore, tf ynu know,,( the cxtslCIKC lit .lilY ssgniticant rcpLins . ..: t ~: .. that o..m.: lt<•l m th~ OTJ(_· ulllt.:cllon. Wt' \\llU]d appn:c1:.1h.: r.:c;:nmg cop1cs 1Jf mt'Lln11ilt\On n:btt'd to their '"urct:~ an,] avail.lbtlity.
: h: .1ppropnatc n:gulathl!iS .Ht' DqJartmcm ut Dcft:n~t.: Dir~o:~:tt\ c ·; ~0() 12. i Jt•U '-.,:Jcrtu lil.' Jnd : :,iuuoi ~ntormauon ~~~<h.'.t.un: Dt'ranmcnt ,,f !kkr:se Dtrectne ~2.iiJ 2-t. Dlsl:thuttun ., l,lh:m~nts , 1n Tcchmc:!.l I l<)l'UrHCnt -; : \ at11mal ! ntorm J.!lun ) t.mJ.lnis Urg~Hll/.~tth.'ll , ~ I S() 1 "r.mdard /?.9.1 K-! 4G5. Sucntti!c :md kdtni~:ai Rcpon:-: .. Lkmcnts. Ur~<um;mnn ;md [k::;l~,:n .
; ll'rartm<.:nt of Defense ~.::.00 1-R. inti.mnJtiml Sc:"cum~ l'n,~ram Rcgu!;uion
1 lm ..\~:qu&sicions Branch, UTIC-OCA .,, til ;~~s1st tn rc.:sni\·in):! ;tn~ qucsuons ;''ll rn;.~; :;:.t\1.' .:·:-n,,:nung dummcnts to be \Ubmint.'d l\.'kphom: numbers :;,r thl' 1\ltice are (70.3) 76 7-8040 •.•r !)S~-127-~0.JO. Tl1c Refcrenct and H.l'frie\al S(•nin' Branch, J>TIC-BRR i\til ;\S:' t' l ::\ ,h:·.llm·nt tJcntJ!'JCation . .. mienn!_.( ar1d ~d.H~·J qut· ~tH•n~ . l'dephom· num~r; '''r t!t~: <ltJi(c.: .11~
· -n,:\)767-RP.J ,,r HSN42-'-~Z74
~---------------
! DO ;'~OT kF.Tl'RN THIS UOCl ~1F:'\T TO UTI('
EACH ACTiVITY IS RESPONSIBLE FOI< OESTRUCTION OF THIS I>OCV\IL'iT :\CCOIU>I~G TO AI'PLIC\BLE REGliLATIONS.
l
I I I i
·----·-.. - ..... .. ---·-----.. ·--•---•t•'J>•Jittlflli"'l!l .. ' .-b'.bll' llttiF.-IWiiRB._;IA'.I'Irl;ll'lllltlllti'illlill. )_., ___ _._ ---------'

NATIONAL TECHNOLOGICAL COMPETITIVENESS
AND THE REVOLUTION IN MILITARY AFFAIRS
Final Report, Phase I
by David Reeths, William Edgar,
David Roessner, Michael Salomone
Prepared for the Director, Office of Net Assessment Office of the Secretary of Defense
April1, 1998
Contract No. DASW01-96-C-0042 Report No. JMSTR 98.4.1
JOINT MANAGEMENT SERVICES P. 0 . BOX 186792
DUNWOODY, GA 30356-0791 (170) 666-0396
20061227299 - . -----· ·------- - ------

FIGURES
r.w
Military Developmental Resource Leveraging Network Escalator 17
2 Significont Regression Results 20
3 Change in Electronic Data Processing Equipment Purchases and Teehnicallnhstructure for Selected Nations 1990-1996 22
4 Change in National Orientation Indicator and Productive Capacity Indicator for Selected Nations !990-!996 24
5 Change in Gross National Product and Military Expenditures for Selected Nations 1990-1995 25
6 National Rankings by Muhip!e Criteria 26
7 Cumulative Ranking and Change in Technological Standing and Rate of Technological Change 1990-1996 27
-·-------------

TABLE OF CONTENTS
Introduction
Premises Underlying Pha.se I
The Research Process
National Orientation
Socioeconomic Infrastructure
T echoologicallnfrastructure
Productive Capacity
Techoological Standing
Technological Emphasis
Rate ofTechoological Cbaoge
The Military Developrnont.al Resource Leveraging Network Model
Exploring the Model
Conclusions
Notes
----·····-···-········-----
3
5
6
7
7
8
g
9
9
14
I&
28

Introdudion
National Technological Competitiveness
and the Revolution in Military Affairs
Phase I Final Report
The objective of Phase I of this project is to identify a subset of nations in the Asia
Pacific region that demonstrate the following three characteristics. First is a relatively
rapidly growing technological capacity. Second is an ability to rapidly absorb and utihze
technology, Third is a particular orientation toward using nonstandard models of
technology diffusion to acquire technology quickly through arrangements such as joint
ventures, foreign direct investnient, co production arrangements and outsourcing from
multinational corporations. Ultimately, though. the purpose of the project is to identify and
to evaluate potential participants in the revolution in military affairs among the rapidly
industria1izinJ:! nations in the Asia Pacific region.
There are several views of the revolution in military affairs (RMA). Some do not
find the concept useful. A subset nf these critics site the technology of the Gulf War and
be1ieve th� what we are currently observing is an evolution rather than a revolution.
Others believe that the revolution is already upon us. Still others, observing the last 200
years of history, believe that we are in the early developing phases of a revolulion in
military affairs that will culminate in the first quarter of the next century and change, in a
very fundamental way. how warfare is conducted by nations capable of adapting advanced
technologies to military purpose. These technologies will be mated to highly adaptive
military organizations employing imaginative operational schemes. They cite historical

Joint Ms.�t��geme11t $entiCes April J, 1998
Ns.tlotud Tech11ological Comp•titiveMss tJtul th• R•volu.tiort in MUltary Affairs
parallels, such as the illll()Vations that occurred in the interWar period, and conclude that
presently we are in a period analogous to the 1920s in terms of the contemporary RMA. We accept this latter view and its premises. but would add the following observations.
As is now apparent, and will likely be more so in the first half of the next century,
the ability to wage modern war bas become a function of economic strength that rests in
large measure on the indigenous capacity to create, manufacture. and market tecbnoiOBY·
based products successfully. This fact will most likely underlie any basis for a revolution
in military affairs and serve as the platform from which military innovation of the type to
denote peer competition will be launched.
To the extent that national military and economic prowess depend upon similar
institutional bases, anticipating a nation's future military upacity requires the ability to
anticipate its future technological capscity as well as the social bases of organizational
learning. The capacity of a milicary organization is defined as a diverse set of abilities that
permit an organization to perform complex tasks, such as the various skills necessary to
project military force over open ocean. Indeed. the idea of a military�technological
revolution explicitly reflects the central role that technology plays in the calculus of military
power.
Recent analyses of national competitiveness demonstrate the key role that
technology aud technological change play in developing and maintaining national econorn1c
power. Thus technology rests at the nexus of national economic strength and military
prowess.
Joint Mdn.og-m•nt Senic•• April 1, 1998
NtllioMl T•chnological Competitiwtmen talttl th� llnolution in Militory A.ffairt
To idenrifY potelltial participants in the revollltion i11 milizary affairs ( RMAJ. it
follows from tJ�e above Ihal one must idemiJy nations that exhibit a sel of characteristics
thai are prediclive ojteclmology�based compeliliveness. Granted, this alone does not fully
accomplish the desired goal since nations may choose to channel their competitive
capacities primarily in military directions, or may choose a shon�run strategy that builds
economic/military strength at the expense of citizens• standard of living. However, most
contenders to future competitiveness must pass through a series of development stages.
These include, first, the absorption of new technology from abroad which is
frequently manifested as platform manufacturing:. Absorption is followed by the adaptation
and application or external technology to local conditions or production. Even1ually, the
nation may progress to the use of locally-developed technology and technical expertise to
create products that corn pete successfully in inte:mauona.l markets, or on the battlefield.
Premises Underlying Phase J
Our analysis is premised on several fundamental shifts in the international
environment. The first major shift is a fundamental change in the nature of weapons
development. The discovery of important new defense technologies has shifted, from
development through intensive research directed by the govetnillent, then followed by the
identification of civilian applications (spin-off), to the development of new teChnologies
largely in and through commercial or civilian research, then followed by the identification
of military applications (spin-on).
Technologies developed directly for military application are often no longer cutting
edge; the accelerating pace of development in the civilian research and development

Joint MaiUigem.l!lll Service• April 1, 1998
Natio114l Technological Competiti•enftss and the Re,olution in Militnry Af/r.drl
community has meant that by the time a new military system becomes operational, its
component technologies can be obsolete by several generations. This is most apparent in
the mkTO-electronics revolution.
A second factor that will impact the development of militarily competitive nations in
the Asia Pacific region is the over capacity of the global anns market. Diffusion of
militarily relevant technologies with indigenous weapons production potential has been
accelerated. In reaction to the contracting anns market and the increasing costs of weapons
development, governments and defense firms have responded by marketing weapons.
weapons technologies, and defense production knowledge on a worldwide basis. Due to
the current "buyer's market" consumer nations are able to demand the transfer of advanced
weapons technology nnd production knowledge as a condition of purchase from an
industrialized supplier.
The third development in the international environment is the growing importance
of multinational corporations and economic globaJizatiorL In the post Cold War era,
research and development by multinational corporations has replaced state sponsored
technology development as the most important source of technological innovation. These
immense and mobile finns are primarily driven by economic and cornmercial
considerations. Their quest for higher profits can lead to the diffusion of sensitive
technologies irrespective of any single nation's national security goals or policies.
FinaJly, we believe that all but the wealthiest nations will have difficulty sustaining
independent defense industries and their research and development oornplexes. The current
consolidation or failure of defense industries and firms in the industrialized world will
p,,, 4

/()lilt Ma�tagt:mttnt S11nictt1 April I, 1998
Nationul Tt:clmol<�gical CotllptttiriltrtllCU tmd th� Rt:•olurion in Mililll"J' A/fairs
continue. lndustrializlng nations will be forced to develop their military tt:ehnology base
through leveraging the civilian economy.
The growing importance of spin-on, the global over capacity of defense industries
in the industrialized West and Russia. and the emergence of economic globalization driven
by multinational corporations are significant changes in the international environment that
will directly affect the development of industrialization in Asia with national security
consequences. If economic resources are available to developing nations and if these
resources are leveraged properly, \he subsequent transformations mean that the growth of
advanced civilian technology sectors within a nation can provide a base for development of indigenous high technology industries from which military innovation can be launched.
The Research Proctss
Our search to identify the subset of nations in the Asia Pacific region that are most
likely to achieve the technological capacity to become militarily competitive in the region
began with a review of p:rtinent literature. We located and examined two types of relevant
Jiterature: (1) sources that describe the current technological status of nations in the Asia
Pacific region in both the civilian and military arenas and (2) sources that describe the likely
processes through which the development can occur. From our literature review and
preliminary qualitative analysis we determined a set of data sources that would likely be
informative and useful. The most obviously relevant data set we sought were several
editions of the Militarily Critical Technologtes List (MCTL) that is produced by the
Department of Defense. The Office of the Uooer Secretary of Defense for Acquisition and
Technology, which produces the MCTL. describes the report as a detailed and structured
compendium of the technologies DoD assesses as critical to maintaining superior US

Joint Maru;g•mt'*t S11nie111 April I, 1998
N'uUnul.l Tcch,.tJltJgical Compctiti••neot6 atu! tlu Rt��ollllion ilf Milittt.rJ Affairs
military capabilities. The repon contains Foreign Technology Assessments (Ff As) which
are estimates of foreign capabilities in each of the technology areas.
Our second source wac; a National Science Foundation study on the Indicators of
Technology-Based Competitiveness) Thi; study began in the late 1980s and sought to
identify indicators of high �hnology�based development that would measure the
competitiveness of selected countries. The study identifies four composite "input"
indicators that are predictive of future competitiveness and three composite "output"
indicators that indicate current competitiveness based on world ma:rket share of high�
technology products, especially electronics. These are ref erred to as high technology
indicators or''HTl". The four composite .. input" indicators of competitiveness that are
described below are National Orientation. Socioeconomic Jnfra.<ttructure, Technological
Jnfra.o;tructure, and Productive Capacity.
Natiomd Ori�t�llltilm: This input indicator is evidence that a nation is
undertaking directed action to achieve technological competitiveness. Evidence of such
action can be manifested at the bw;iness. government, or cultural levels, or any
combination thereof. •Directed• action would be indicated by the existence of:
• an explicit national strategy developed and implemented by govenunent.
• an ex.plicit national strategy resulting from negotiations between business and
government.
• an implicit national strategy reflecting lndividual business actions and, possibly,
government support,
• an implicit national strategy reflecting a general consensus in the values and
attitudes of the populace about the role of technology in social and economic life.
Pafl 6

}olnt MiiMgem•llt S.,l'kll April 1, 199/J
Nt:�ti.OIUII Technologict:JI Competitli'IMSI and lhl Rl"olu#on in Milittlry AJfail'l
Socioeconomic /ll[rartructure: This input indicator evaluates the social and
economic institutions that support and maintain the pllysical, lluman, organizational, and
economic resources essential to the functioning of a modern, tectmologywba.'red industrial
nation. The existence of such institutions and their effectiveness could be indicated by:
• evidence of effectively functioning capital markets, including mobility of capital;
or, in more centra1ly�plaoned economies, evidence of flexible, rapid, and
appropriate responses to changing investment requirements,
• rates of capiUll fonn11tion, capital investment, and savings,
• levels of direct foreign investment,
• levels of national investment in education.
Teclmologtcal lnfrallructurt: lnsurutions and resources that contribute
directly to a nation's capacity to develop, produce, and market new technology comprises
this input indicator. Central to the concept are the ideas of economic investment and social
support for technology absorption and utilization. which could take the forms of monetary
payments, laws and regulations, and existing social institutions. Also included is the
physical and human capital currently in place that is capable of developing. producing, and
marketing new technology. TeclmologicalitJfrastructure includes elements of the
socioeconomic inf rawucture and productive capacity that are directly and specifically
technological in character or purpose. Examples of technological infrastructure might
include;
• R&D expenditures by business and government,
• effective protection of intellectual propeny rights (e.g., a functioning patent
system),
---�·----------

Joint MfiMfUIUft Str-,U:u Apri.l 1, 1998
Naliornd T•eh�tologir::�al Compditlu11eu and lht R••t;tlution i" Milti�Aey A/f4irl
• alliances with te<::bnology�based multinational corporations via licensing, joint
ventures, and direct foreign investment,
• public or private organizations such as trade associations that provide technical
support services to industry.
• leehnological capital stock (R&D plant and equipment, data proce""ing
equipment, telecommunications equipment and networks),
• technological knowledge stock {foreign and domestic patents owned, royalty
payments, technical hooks and journals produced),
• technical human resources (scientists and engineers: skilled bluewoollar workers,
skilled service and support workers; innovative, experienced technical managers,
entrepreneurs, and marketing people� technical educators and trainers).
• technical support. services (component suppliers:job shops; consulting services).
Producti�e Capacity: This input indicator measures the physical and human
resources devoted to manufacturing products, and the efficiency with which thare
resources are used. Examples include:
• indicators of manufacturing productivity,
• manufacturing capital equipment (machine tools, robotics).
• proportion of GDP accounted for by manufacturing.
The three composhe .. output" indicatorsofKfl competitiveness are described
below as Technological Standing, Technological EmphasiS, and Rate ofTechnical Change.
Tecllnological Sta11ding: This measures the current world market share in high
technology products, reflecting not on1y current export market share statistics but also
current manufacturing capability. Examples ofTechnalogtcal Standing include:
Pare I

}oim Mtl.lillfMUitll s-niCII A.pril 1, 199&
Nnti(uud Tuh11ologhud Competiti•e"�n dltd tM R�•oluli.ott ill MiliUMry A/fairs
• indicators of the overall level of technology�intensive production,
• high technology exports,
• electronics exports.
Tttcllnological Em.plaads: This output indicator measures the extent to which a
nation emphasizes high technology products in its export mix. Examples of a nation's
t.cchnological emphasis include:
• the proportion of high tech exports to total exports,
• the ratio of the difference between electronicst:�tpons and impons from year to
year, to the sum of electronics exports and imports.
Rate of Tttclmologlcal Clumge: This is an indicator which captures the speed
with which a nation is expanding its export market share ln high teChnology products.
Examples include:
• the ratio of the difference between the value ofblgh tech exports and imports over
time,
• the ratio of the difference between the value of electronics exports and imports
over tirne.
As noted above, each of these input and output indicators are composites and
consist of several sub-variables. OUr research Md analysis uses many of the NSF study's
survey results and additional statistical indexes from sub-variables that constitute each of
the compooite indicators. The experts surveyed included science counselors and/or
economic advisors to embassies and consulates for the United States; editorial boards of
,..,, 9

Joint Mti.Ntlg�·'�"' s�nk;s April 1, 1998
Nstiorud r�chnolo1ictd Competiri.,ttten sttd tl&e R••olulion itt Military AffliliTI
international journals in the field of development and technology policy; members of
international development organizations and lists of attendees at conferences dealing with
technology and development; the personal networks of key individuals in the National
Science Foundation's International and Science Resources Studies Divisions; and the
personal networks of academics contributing to the field of technology and development.
The additional statistical data that comprises components of the aggregate indicators is as
follows:
• NationalOrWmation: Uses the Frost and Sullivan 5-year investment risk index�
(in addition to survey data).
• SocioecmJOmic ll!frastructure: Uses the percentage of students enrolled in
secondary education and the percentage of students enrolled in tertiary education
from the Harbison-Myers Human Skills Index and UNESCO (in addition to survey
data).
• Ttclutologicallrifrastrucmre: Uses electronic data processing equipment
purchases from the Elsevier Yearbook of World Electronics and the raw number of
scientists and engineers engaged in research and experimental development as
defined by the UN Statistical Yearbook (in addition to survey data).
• Productive capacity: Uses the Elsevier Yearbook of World Ekcrronics (in
addition to survey data).
• Teclmological Standing: Uses the value of high tech exportS from the United
Nations Statistical Office trade statistics and the value of electronic exports from the
Elsevier Yearbook ofWorld Electronics Data (in addition to survey data),
• Teclmological Emp/wis: Uses the ratio of high tech exports to U>tal exportS frorn
the UN Statistical Office and the ratio of electrOnic exporu to total expons,
Pa.1r: 1 iJ

Joint M41Mgtmttnt S�r•ic.s April 1, 1998
NatioM.l Ttclmological Compttithue.u and tl1e R111rolwiort in Mililary Affair1
including re�ex.ports, from the Elsevier Yearbook of World Elecuouics Data, but
does not use survey data.
• RateofTec/uwlogical Clwuge: Uses the change in the value of high technology
exports over 3 years as reported by the UN Statistical Office and the change in the
value of electronic exports far three years from the Elsevier Yearbook of World
Electronics Data (in addition 10 survey data).
The third rnain source used was the 1995 edition of the United Stares Arms Control
and Disarmament Agency•s World Milizary Expendimres and Artru TrallSjers (WMEAT).
WMEA Twas used to provide aggregate economic and military figures. The data utilized
fromACDA'sWMEATincluded:
• Gross National Product,
• Central Government Expenditures,
• Military Expenditures,
• Anns Imports,
• Anns Exports,
• Tot:tl lmpons,
• Total ExportS.
We used annual data from 1985to 1995, with all the figures in constant 1995
dollars. Complete data was available for each variable for all the nations targeted ln this
study. Once our data sources were identified and located. we continued by determining a
smaller subset of target countries that warranted further analysis.
In the process of selecting the subset of nations that would be more closely
analyzed in Phase 1, we detennined that our planned quantitative analysis would not be
Page l I

}oint Mtmagement Slinir:es April J, 1998
Ndtiotud Tcchnologictll Competilivuut arut the Revolu.tion in Mililury A/.fail'l
possible. Originally we hoped to use the MCTL FT As and the other sources in a discreet
time series analysis to test hypothesized relationships between high technology industrial
competitiveness, economic development, and the development of militarily critical
technologies. However, controlling for missing or inconsistent data in the MCTL FT As
made the investigation extremely challenging. Consistent and expanding measures of each
country's technological standing in industries that produce or use technologies central to the
manufacture of advanced wea{Xlns systems simply are not available. Instead, we were
forced 10 develop heuristic measures, which are discussed later in this report.
We found that the existing data provided by the MCfL FT As has serious
weaknesses and gaps which made it impossible to use in a discreet time series analysis.
While the coverage of WeaJXMlS technologies in the MCTL is quite comprehensive, the
MCJ'L Ff As proved to be extremely inconsistent from edition to edition. Despite its Slated
purpose, the MCfL is, at best, a spot assessment of the weapons systems technologies of a
small, shifting set of nations. The set or nations examined changes within each technical
division of the report as well as from edition to edition. The MCTL FT As data is scaled
into four very broad measurements. These are capability in a majority of the technology
area critical elements, capability in some critical elements, capability in only a limited set of
the critical elements, and no capability or consensus regarding the capabihty.
Consequently, the data are not compatible with a precise statisti<:al analysis. Use of this
data was problematic at best, and many nations in the Asia Pacific region are not included
in the document.
Despite the deficiencies of the data, the MCTL FT As proved useful in a more
qualitative analysis. Because the data was inconsistent with statistical analysis, we instead
used much cruder methods to evaluate the comparative standing of each included nation.
,.,. 12

Joint Mtuu.agtmltnt Servielts April I, 1998
National T�tcluaologicetl ComplttitiVUt/11 and tl•e R�tvolution in Military Affair�
By assigning each measurement category 11 numerical value (4, 3, 2 and 1, res�ctively2)
and by summing the total value for each nation across each of the eighty-four technology
sub-sections of the Ff As, we constructed a raw ranking of the technical capabilities across
the entire spectrum of militarily critical technologies. While the raw ranking lacks the
precision we had hoped to achieve, we believe that the method is sufficient to accurately
show the relative standings of the nations. Not surprisingly, the US fared the best in this
test, earning 97% of total possible score, and Japan followed with 71%. Somewhat
surprisingly, China scored third highest in our subset with 40%, followed by Italy (31 %),
Taiwan (25%), India (20%) and South Korea (17%).
Through our literature review and the raw ranking produced by summing the
MCfL fT As data, we determined the ten most likely high technology competitors in the
Asia Pacific region. These nations constituled our subset for further study in Phase L • Japan
• China
• South Korea
• Taiwan
• Singapore
• Malaysia
• Thailand
• India
• Philippines
• Indonesia
Joim M•nagemut Set"r�es April l, 1998
Natioaal TechaologictJl Coutpttitivuess t�tul the Rnolutio• ia Mililflry Affair-s
In order to ensure that the analysis established the importance of relative position
changes, data for the US was used to provide a moving point of reference. In addition, we
chose to include Italy as a European point of reference for the study. Because of its
position as a late developing western nation that has followed developmental strategies
similar to many of the nations in the stu<ly subset, it seemed a uniquely valuable point of
reference. Once data was collected and our target countries were identified, we began to develop and operationalize a model of military technical capability development
The Military Developmental Resource Leveraging Network Model
The concept underpinning our Phase I analysis of the development of potential
future military competitors in the Asia Pacific region is a hybrid theory based upon a model
of technological evolution and the dynamic conceptions of r/u: displacenMIII ojnatio11s as
the uttelwlkmged leadas of reclmologicaJ imrovariotlllwtls ftmdmnenralro our llll!ory of
tecluwlogical progress.
The technological evolution model developed by John Mathews and published in
the December 1996issue of Joumal ofltJdustry Studies was used as a foil for the
development of our model of technological evolution. Mathews advances an explanation of
the mechanisms for acquiring and enhancing industrial"technological capability". We
believe, however, tltat Mathews' conception of teclmological development as a series of
steps to sustaimJble innovariot� that mtce achieved are ir-reversible is sJ.mpty inco"ect.
Mathews also portrays the developmeiJl of sustainable i1movati<m as a natural, illevitable
eve Ill. Hislory has slwwtJ. lwwever, t/uJt anempts at sustaitrable develo�nt ojte11 fail.
Our model explicitly delit�eates the collditions ''ecessary for tllis developme111, a1Jd our
Psg1 J 4

Joint Mtnulgtmtn.t Srrvic•s A.pril J, 1991!
Natiorud Technologicdl Compditi.1uus dnd IM Revolution in MUiUlry A.f/AirJ
model includes tile possibility thai a curtelll high ttclmology imrovator can be left belliud in
a future tecllnological revolutiou.
Current trends in the character of arms and anns technology ttansfer make our
model increasingly relevant in the development of military technological capability i n the
Asia Pacific region. The confluence of the dual elements of expanding market forces
driving arms and arms technology transfei"S and the increasing importance of dua1 use technologies and CQfllmercial-off-the�shelf products in weapons development will likely
continue well into the next centruy. Comequenlly, we believe that our model or the
Developmental Resource Leveraging Network lS appropriate for the srudy of future military
competitors.
The Mililary Developmental Resource Leveraging Network (MDRLN), that we
developed as hybrid of Mathew!ii' work and our own, is a dynamic depiction of
technological progress. Rather lhotn portraying lhe acquisition of technological capability as
a destination to be reached. the MDRLN accurately represents the process as a Ouid and
advancing structure. Today's cutting-edge technology is tomorrow's industry standard,
and technological leaders often find their p<lSition of advanta8e extremely neeting, much
like military competitors. rr technotogicaJ champions fail to conslantly innovate, their lead
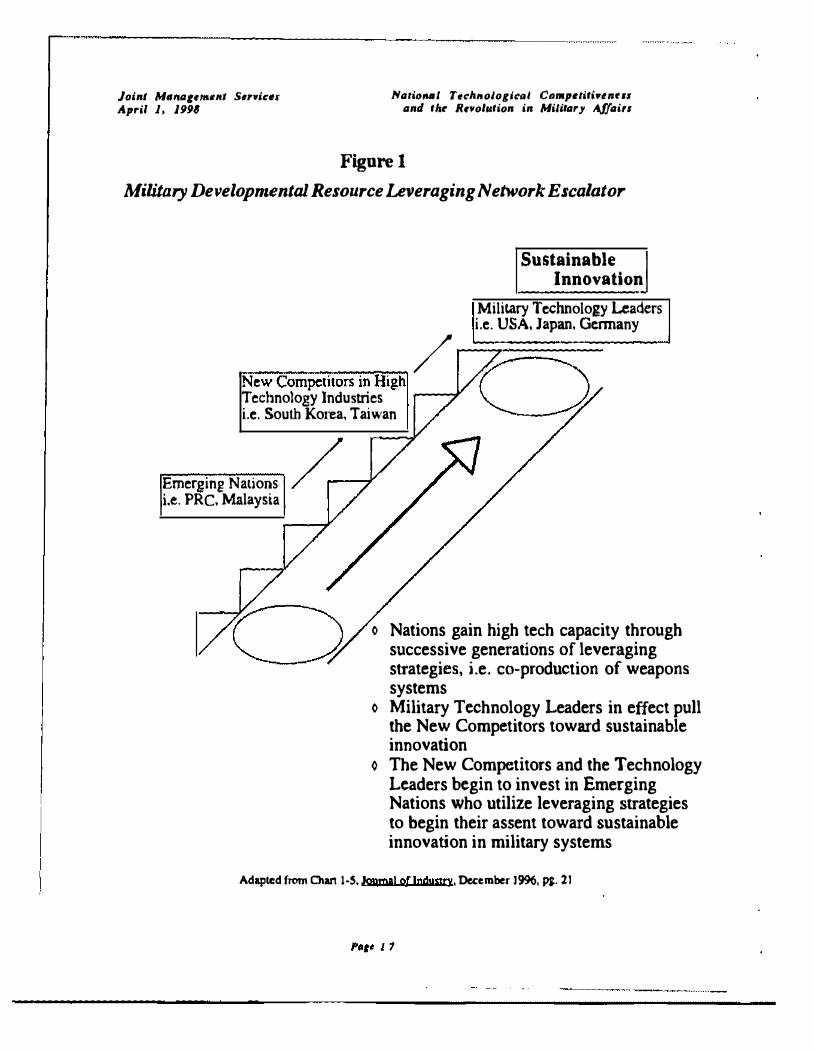
diminishes and may be lost entirely. Thus, we represent military teehnological capability as a downward moving escalator.
Figure 1 on page 17 is a depiction of the model of development of military
technological capability in the Asia Pacific region. Potential competitors step onto the escalator through the incremental build-up of skills and technology. This initial progress
can be achieved through conscious public p;;.hcy consisting of labor-intensive and capital-
,.,, J s

Joint Mtmogtment S•r•ic•s April 1 � 1998
f!/tJiional T1chnol8gicol C8mpetiti...:nnt and #ht Runlctlion in Military A/fair•
intensive industrialization strategies that include technology transfer or through the
involuntary workings of the civilian market economy and the suppon of external actors,
such as multinational corporations. Once the nation has acquired this base, they pull
themselves up the escalator by leveraging market farces through contractual linkages. This
is the result of conscious policy choices and strategies. For example, once a base of
minimal technological capability has been achieved, if market conditions are amenable, off�
set agreements can create a basis of near cutLing-.edge high�technology production.
Because of the benefits of experience and the slope of the technological learning
curve, each successive generation of high·technology brings the nation closer to the
cutting.edge of production. Clusters of high-technology industries can form significant
reciprocal and symbiotic relationships with benefits to the status of the entire high
technology economy. Once they have advanced to near cutting�edge production, nations
utilize their favorable position to profit through conlmctuai linkages that result in production
ln other technologically ripe nations through foreign direct in\les tment,joint ventures and
technology transfer agreements. This in tum leads to the export of technological,
organizational, and production expertise to these nations, who then can advance upon the
escalator.
Pat� J 6
Joint Mtmagem.ttn.t St�TIIictts April 1, 1998
Natitmtll Tttchn.ologl.ct.�i Cnmpetiti.l'tntrs and thr Rel'olution in Mililary A/faits
Figure 1
Military Developmental Resource Leveraging Network Escalator
Sustainable Innovation
Military Technology Leaders i.e. USA, Japan, Germany
/ .=:;==;::::::::==---J r.:N;-e-w""'C"'o-m=pe-:t-.it.-ors-:-cin:"i1H""ig:;:,h 0 Technology lndusbies i.e. South Korea. Taiwan
� / Emerging Nations / ri.e. PRC, Malaysia
o Nations gain high tech capacity through successive generations of leveraging strategies, i.e. co-production of weapons systems
o Military Technology Leaders in effect pull the New Competitors toward sustainable innovation
o The New Competitors and the Technology Leaders begin to invest in Emerging Nations who utilize leveraging strategies to begin their assent toward sustainable innovation in military systems
Adapted from Chant-S, Jm1mal nflnduurv, December J996, "'· 21

}oint Managtmaul S•nices April l, 1998
Notional T•chnologicol Ctnnp4titi�tnttts and the Revolution in MiliJary Al/t#n
Incremental improvement and sufficient resource allocation eventually leads to the
symbiotic conditions necessary to enter Ute highest level of production, and Ute need to
maintain this position creates incentives to cultivate cutting�edge innovation. If the nation
continues to foster continued growth and development. sustainable innovation can occur.
If this does not occur, Ute nation may fall behind the pace of advance and be passed by one
of the nations that it was pulling up the escalator. This we term "leade111hip displacement".
Our model emphasizes the interplay of developed and developing nations and the
importance of both conscious pursuit of techuological cspabilities by governments and the
workings of market forces. 3
Two key factors led us to develop this model as the underpinning of our analysis of
future militarily competitive states in the Asia Pacific region. The first is the close
relationships between many of the business communities in the region due to ethnic and
family ties. The second is the deep involvement of militaries in the Asia Pacific region in
the civilian economic arena. These two factors create potential opportunities for diffusion
of technological capabilily to militaries througbont the region.
Exploring the Model
As part of our process to locate measures that would serve to adequately
operationalize of the important components of Ute MDRLN model, we conducted a
regression analysis of large numbers of variables in order to locate high technology
indicator variables that covaried with military measures. Because the MCTL FT As data is
incompatible with a statisti� analysis. none of the variables available would be able to
comprehensively operationalize growth in military capability development Therefore. the
Pa;t 18

.-----------------··-·····---·--······-----
Joint MaMgt:ment Ser,tcts Apr# I, 1998
Nati.onol TeclutologictJl CQmpetirheneu ttnd tlae Ruolution in Military Afftiirt
covariance would not establish a causal relationship between the high tech indicators and
military capability development.
However, because we assumed that these nations tend to import only weapons they
themselves cannot produce, we believe changes in anns exports (taken in the context of the
overall anns transfer environment) operationalizes this concept. We believed that the
analysis would identify potential relationships that could help in the identification of a small
set of likely competitors. These relationships could then be better explored in Phase 11 of
the project with a more appropriate methodology, case study analysis of a small number of
likely competitive nations.
We also used regression analysis to explore hypothesized relationships between
economic data and military data. In order 10 increase the number of cases being observed
IUld to provide a basis for comparison of the Asia Pacific region with the rest of the world,
we included a sma11 number of nations from Europe, North America, Oceania and Smith
America in several of the data analysis. The nations included in the analysis, except where
exclusions are noted, are the Asia Pacific region's ten nation subset, plus the US, Italy,
Spain, the Netherlands, Switzerland, Hungary, Canada, Australia, Bra1JI, and Argentina-�
a total of twenty nations. This constituted the vast majority of the nations for whom both
ACDA data and NSF HTI data were available. Our regression runs were all bivariate and
included runs with variations in the countries included as well as lagged time periods. The
R2 statistic represents, on a scale from 0.0 to 1.0, the degree of correlation between the
variables being tested. The more significant correlations approach 1.0. Significant results
are listed in Figure 2. Implications from this data analysis are explained in the
Conclusions section below.
P111� I 9

JoJ11t Mt�nag�menl Seni�ef April 1, 1998
Nari.ortJJl Ttclmologicol Competiti'lu•n otul tl•e Rnohllion in Mili.lary A.f/t�irs
' v ...... v ......
<JNr w-9>
UN<'�>O
UNY�»
UN,9Q.YS
��-s GNP"'"
A£9().95 M·YU·YS
ODe,.,., GNP'"'93
tJ..W»-96 AE9Q.9s
Fignre 2
Significant Regression Results
�ti= "" """"" I "Y
(.)f'I-A.$1811 ·'" .uw:! and Japan
� � ' ·""'
l'IOft'A.Iilatl ·"'' WJI
Japan ano '-'·"'· ·""' UWI "'"' ·""' <JWI
Non.As•an ·"'· .UUU> �f"l·M! 497 ""' lnd J:�p.m
l"k::n-Mian ,. 0.4
M&- Military ExPf:mhrures GNP-- GI'0$5 National Product AE-- Am•� &pori$ EDP- B�troni;,: Data Processina:-Equipment Purcha�es
lJu�"·�·-Statiscicl' 1.>5
"" Z7U
'" Z.U)
1.>1 1.9:;,
1.83
• A �n Wataon Statislic 1ignil'icantly above or bdow2.0can indicate autocom:lation in tm umplt. Thi1 meat�$ that the varillblesare not truly indepen&:nt of ooo another. Those values clustered around:! 0 rnr.an that the variablea varyiadepeldently
p,.,, 2 0

Joint M11.n4gemen.1 Serrices April 1. 1998
Natituud Technological Comp4!ritiwn"s a(fli th• R•Poluti.on in Milita'1 A.fft�ir•
In order to further establish a smaller subset of nations in the Asia Pacific region
that are most likely to become militarily competitive. we analyzed the NSF High
Technology Indicators study and established that the indicators ofT echnologicaJ
Infrastructure, Technological Emphasis, Rate ofT echnological Change, and the sub
indicators ofTechnological Masrery (the ability to make effective use of technological
knowledge, from a survey question that is a component of Technological Infrastructure)
and electronic data processing equipment purchases best operationalized the components of
growth in high technology capacity that provides the potential for development of militarily
competitive nations in the Asia Pacific region. We then constructed scatterplots that graphed
bivariate relationships between conceptually related indicators.
The scatterplots revealed significant clustering: of the Asia Pacific region countries
in related indicator groups. Clear groupings of nations appeared. To a great degree, these
groupings support the relative standings advanced in the economic development literature. ln order to observe the movement of the target countries overtime with respect to the high·
technology indicators, we also overlaid dabl from earlier portions of the NSF HTI study on
the most recent comparable results.
Figure 3 shows the change in electronic data pl"<.lCeSsing equipment purchases
front 1987 to 1996 on the venical axis and the overall change in the Technological
Infrastructure indicator from 1990 to 1996 on the horizontal axis. This figure clearly
shows movement in the predicted direction (up and to the right) for our subset of nations
with Singapore, South Korea and the PRC showing the greatest improvement.

Joim Manng•mttU Suriut April 1, 1998
NatWnal T•chnological Comp�titi.tt«nut ud IM Re-,olutioll in Mililury Affairs
Figure 3
Change in Electronic Data Procesring Equipment Purchases and
Technical Infrastructure for Selected Nations 1990-1996
EDP & Tl 1 996 Excluding US & Japan
�
j��L..o-" � � .s
J
Electronic Data Processing 96
T echnological lnfi'astructure

JoltU Mtuaagem«nt S•r,icu April 1, 1998
N�tti.onal T•chnoloticol Ctnnp«titi•en•ss and the Rl!'volution in Military Affairs
Figure 4 on page 24 shows the change in the Productive Capacity indicator from
1990 to 1996 on the vertical axis and the change in the National Orientation indicator from
1990 to 1996 on the horizontal axis. Again, our subset of nations. in the Asia Pacific region
show extremely similar patterns of movement. SingajXlre, Taiwan, India, the Philippines
and China show growth in both categories with Singapore, South Korea and Tal wan
surpassing several major Western European players such as Switzerland and Italy in their
combined scores.
Figure 5 on page 25 shows the change in military expenditures (in constant 1995
dollars) from J99Q..1995 on the venical axis and the change in ONP in constant 1995
dollars on the vertical axis (excluding the US and Japan). Our subset of nations in the Asia
Pacific Region shows positive ,growth in both areas while the countries included for
comparison lnrgely exhibit negative movement. Taiwan and the PRC are outliers. The
PRC has vastly outperformed the other nations in GNP growth, but more importantly, it is
also greatly outspending its neighbors in tenns of military expenditures. This is aU the
more revealing in that the military expenditure figures for the PRC may be underestimated
by fifty to one hundred percent. In addition, this rise in military eApenditures has come
amid reorganization and downsizing of the People's Liberation Army. Modernization in
terms of equipment replacement and upgrading tocontemJXJrary technological standards
probably amounts for a significant portion of the measured increase, and because of the
under reporting of actual Chinese military e,;:penditures, this modemtzation program is
probably much more extensive than the figures reveaL
Po1• ;; 3

JoitU Managtmtnt Str'l'it:t!Jt April I, 1998
NaUoMl T•chnological Compttitiun.eu a11d tlu Revolution in Mi.litarJ A/fa.il"l
Figure 4
Change in National Orientu.tion lndicaJor and Productive
Capacity lndicaJor for Selected Nations 1990-1996
··-····-····----------------,
NO & PC 1 996 Excluding US & Japan
30 50 60 70 80 90
National Orientation 96 ·-·-··---�--------____j
Productive Capacity 9

}&in.t Mtuuagemrnt StJr•icrs .April 1, 1998
National Tecl11•ological Competiti'ffMU and tM R�MluJion in. Military A..f.fairs
Figure S
Change in Gross National Product and Military Expenditures
for Selected Nations 1990-1995
-·····
Change GNP by ME 90-95 Excluding US & Japan
.
7500 I PRC I
6000
� 4500
� t 3000 I ROC I
•
� .Jl 1 500 ha � t!l·@§Pl .ll! 'i o- •
• Phlfll1' [EiiJ Spn
·1500 �··. en. a/Nthr<l
� ·3 b 250ooo sobooo ?sbooo 1 odoooo 125 ·250000
GNP c9().95
Military Expenditure c90.95

Joint MIIMgett�elll Se"i,;ts April 1, 1998
National Technological C:o�t�pttiti'lien�•t 4ml tlu Rtt�olution (n MiUUII'J' .tffa.irs
In order to examine the advancement of each nation between 1990 and 1996. we
developed a composite rank ordering based on the indicators and sub-indicators from the
NSF stUdy. The indicators and compcments that we chose best operationalized the potential
competitiveness of these utions in the context of a miliUlf)' revolution. In constructing the
composite rank ordering. we first rank ordered Ute nine target natiQRS in the Asia Pa.cifjc
region based on their position in the scatterplots (Figures 3,4, and 5). We e><Ciude<l Japan,
because this would skew the results. In addition we ranked ordered the Asia Pacific region
sample on the change in Technological Standing and the Rate of Technological Change for
the years 1990 through 1996. These results are porttayed in Figure 6, below. The
nations are grouped and shaded as they tended to cluster on the scatterplots.
National Rankings by Multiple Criteria
Note: Shaded cells indicate clusters of countries that grouped together on the ranlclng criterion.
EOP • total purchases of eleetronle data processing equipment Tl • Teehnological Infrastructure NO • National Orientation PC • Productlve Capaelty ME • military expenditures TS • "l:echnological Standing RTC • Rate of Teehnological Change GNP • gross national product
- - - - ·���---------------

Joint Matu�tttmutt Sttrrktts April 1, 19911
N1Atioul Tcclmologiclll Compftitin,.us ,,ttl tlu Rnolution i11 Military AJ/t�U's
We then summed the rank order from the first three columns of Figure 6. The
nation with the greatest positive change scored a 9, the second greatest scored an 8, and so
on. TlUs gave us some indication of cumulative ranking within the group. We also
recorded whether each nation had a positive change in theirTC(:hnical Standing and/or a
positive change in their Rate of Technological Change. The results are reported in Figure
7 below. China's cumulative perfonnance far exceeds that of any nation in the sample. in
addition, while China's technological standing continues to increase, its rate of
technological change has begun to slow. This may indicate a maturation within the Chinese
economy. It may also indicate a series of policy decis1ons prior to a new period of high
intensity growth or renewed expansion of the economy and science and technology policy
reform.
Cumulative Ranking and Change in Technological Standing
and Rate ofTechnological Change 1990.1996
COUNTRY TOTAL RANK +4 TS +4 RTC
CHINA 26 yes
SINGAPORE 1 8 ves ves THAILAND 1 8 yes
KOREA 1 5 ves
TAIWAN 1 5 ves
PHILIPPINES 1 5 ves ves MALAYSIA 1 2 ves
INDIA 9 INDONESIA 7 ves
EDP • total purchases of electronic data processing equipment Tl • Technological Infrastructure NO � National Orientation PC = Productive Capacity ME • military expenditures TS = Technological Standing RTC = Rate of Technological Change GNP • gross national product
P•r• 2 1

Joint MatUJg�ment s.r .. iCII April 1, 1998
Condusions
Ntttioned Technological Co.npttitivlnf'IS o.nd tlllf Rnoluli.on in MililtJry A/lairs
Our Phase I analysis has led to the creation of three propositions.
First, there is a co�petition taking place in the Asia Pacific region. As Paul
Bracken has noted:
.. It is not that Asian states are now maneuvering to attack one
another, but that they are in a Post Cold War environment and they have to
build capacities to deal with future possibilities whose precise shape is
unknown. Openly declaring that they are building a strong military would
trigger negative counter reactions. It would disrupt econQDlic progress, and
pn:xiuce counter build-ups. "4
The first row of statistics in Figure 2 on page 20 shows that there is a significant
correlation between the growth of Asia Pacific region economies and the growth of military
expenditures. This finding is even more telling when overall global trends in military
expenditures are e)(atnined. The second row of Figure l shows that this relationship
does not exist for the full twenty nation sample. Outside of Asia. all major regions of the
world are experiencing a clear trend of reductions in military expenditure regard1ess of
economic growth. Nations in the Asia Pacific region are clearly diverging from this global
trend and militarizing at a rate constrained only by their economic success or failure.
StCOIJd, rows three through six of Figure l show that arms exports from this
region is strongly correlaled with both GNP growth and military expenditures. The larger
the nation's economy and the more it spends on defense, the more apt it is to export anns.

Joillt Mttnagemud Suricu April 1, 1998
Ntttio�t.al Tcd,.,olotical CompclitirCMU tuul lh.f 8.trollllian Ill Military Affair�
While arms exports do not completely serve as a surrogate for increasing military
capacities, we believe that these rtSults, in combination with the clear trend toward
increasing high technology industrialization In our Asia Pacific region sample, provide
support for the hypothesized relationship between high technology capactty development
and the growth of militarily competitive nations in the region.
Third, during our analysis of the high technology indicators, we found that
electronic data processing equipment purchases (EDP) is significantly correlated with both
ONP and arms exports. This suggests that EDP may be an effective measure of these
countries physical efforts at improvmg their competitiveness in military related areas. It
appears that a country's potential for successful adaptation to and exploitation of the RMA
will be significantly impacted by its ability to promote and utilize high technology
industries, particularly those directly related to or dependent upon the advancing
information technology and micro-electronics revolution.
White we did locate several interesting relationships between economic and
technical indicators and military data through statistical analysis, we believe that it is
impossible at this time with these data to confirm many of the interesting relationships only
partially revealed. Essentially, these relationships are over determined because of all of the
geopolitical and economic .. noise" that occurred concurrently in the early 1990's.
In October we briefed Mr. Marshall and received permi:ssion to implement Phase II
of the project. With Mr. Marshall's guidance, we selected China, Taiwan. Singapore wtd
India for closer qualitative analysis. Using the case study approach, we will examine
civilian and military institutional structures, processes, issues and capacities. The central
question for Mr. Marshall is: .. What kinds of military institutions did those nations: have

Joint Maugemtnt Stf'Pit:el April J, 1998
National Ttt:hnological C()mpetili•tiU'II •nd lit• Re•oltuion in MiiUary Afl•irs
that emerge<! rapidly as mililaf'JI powetS" such as Japan after the tum of the century? To
operationalize this question we will examine the ways that the militaries in the target nations
demonsttate absorptive capabilities., adaptive: capabilities and innovative capabilities, or lack
there of.
Among the nations of the Asia Pacific region, only Japan currently can be
considered militarily competitive. However, the People's Republic of China appean; to be
fulfilling the conditions necessary to become militarily competitive within the next fifteen to
twenty year:s. They have seen rapid and consistent increases in the indicators which best
represent high technology development, and though the extremely conservative ACDA
figures place them behind Japan in mililai'JI expenditures. their true mililaf'Ji expenditures
are cenoinly underestimated by a large amount, and are almost cenoinly the largest in the
region. In addition, they are expanding. These two facts, combined with the heavy
involvement of the PLA in high technology commercial ventures throughout Asia and the
continued expansion of the Chinese economy, represent the circumstances necessary for
advance upon the high technology esculator. While this advance is far from cenoin, the
Chinese government has consistently exhibited a long term commitment to expansion of their high technology capacity.
Taiwan and Singapore have also exhibited long term commitment to expansion of their high technology capncity by allocating sufficient resources to technological
infrastructure and allowing finns to operate in a stable, non·intrusive environment.
However. because of their smaJI size. these nations cannot begin to rival the PRC as likely
militarily competitive nations. They are far more lilrely to become niche competitors. Their
most important role in the Asia Pacific region may be as conduits for the transfer of
technology and expertise to larger states in the region.
Pt.ll" 3: 0

/()iftl MonGguuutt St�,.,le•s A.pril 1, 1998
Noli.on•l Technological Compelili11ruus ond lhfl Rerolulion in Militt�ry Ajfoir•
Many of the other nations of the Asia �ific subset have shown extremely mixed
results. While Indonesia and Malaysia have shown flashes of brilliance in the past, their
overall perf onnance has been tempered by inconsistency of purpose. Their governments
have made great strides in setting up the conditions necessary for high technology
development, but as the recent economic crisis has shown, many contradictions continue to
exist in those nations.
Probably the ma;t perplexing and disappointing perfonnance has. been that of India.
India would seem to have most, ir not all, of the resources necessary ro advance rapidly
upon the military high technology escalator. However, it has experienced periods of both
rapid growth and rapid decline in some of the most importanL high technology indicators.
Lack of government cohesiveness and consistent decision making has created an extremely
unstable environment for high technology growth.
1 Roessner, J. David, er al. lmplemetliOtil:m and Further Analysts of ll1dicators ojTechnology·bastd Camperiltveness· Final Report. March 1995. NSF Grant SBE-9219337, supported by lbe Rc:scareh on Science and Tcclmcdogy Program and l.be Scieocc md Engineering lrldicators Program. The study prodl.lee'd a variety o( materials, iudlkting a large data brule: aod three scpanilC periQd reports, ali Qf which were examined as part or our analytiv 2 A significant UIUUlptioo underlying this scoring is that because the nations that will be as3essed i• oot fu.ed, inclusion in the set wamnts a score d 1 3 Bracken, Paul Nonstandard Models of the Di/fusio,J �J/ Mi.lirQry Technologies: An Alternarivt View· Technical Report. Joint Maruagement Services ror the Dirc:c10r of lhe Office of the Secretary of' Defense, Net Anessment February 15, 1997. Mathews, Jolul. "High Technology lndusuialisation in East Asia." Jou:nwl of Industry Studies. �be:r 1996.
Rasiah, Rajnh. "innovation and lnstiMions: Moving Toward the Technological Froolier in the electronics lnduslty in Malaysia." Joumal ojltlduslry Sruditts. �bet 1996.

Joint Manag�IHtnt Stl'tliCt.f April 11 1998
Natitnud Ttchnological Compttti.tiu�tus 1111d ,h� RtmJluJiolt in Uiliiary A./ftH"rs
Agmoo.. T. and voo Gliww, M., editors. Tuhii(Jlogy TTtJlLifer in lmenltllionalBusiness. Oxfml:Oxford University Preas, 1991.
Johnson, Chalmers. MIT/ Wid the ltlfXbU!Sit Mirtu:bt: The Growth tJfblihutrioJ PtJiicy, 1925-1975. Stanford: Swdord University Ptess, 1982,
Joboson, Chalmers. "Political lml.itutiorlS .00 Eoonccnic Performance: The Governmut-lhuioell!l Relationship in Japan. Soulh Korea and Taiwan", in F. De yo, tdilot, The Political EcotJOmy of thE New Asfan JHdustriali.rm. ll.baca, Ne"· York: Cornell Ulrivmity Press, 1987. IDoue, R., Kohama, H. and Urat.a, S., editors. lflllwtrial Policy in East Asia. Tokyo: JETRO, 1993.
4Asian Military Institutions, Joint MauagelllCDt Services for the Director of the Office of the Secretary of Defeo.<Je, Net Assessment April 1993.
UNCLASSIFIED/LIMITED
' i
. I
UNCLASSIFIED/LIMITED