defensive efficacy interim design
TRANSCRIPT

Defensive E¢ cacy IA Design:dynamic bene�t/risk assessmentusing probability of success (POS)
Zhongwen Tang

Outline
� Motivation
� POS (probability of success) supported defensive e¢ cacy IA design
� Design paradigm
� POS calculation
� Dynamic decision making
� Numerical example
� Take home messages

HA: Bene�t/risk assessment
� FDA: Assessments of a products bene�ts and risks involves an analysis of the severityof the condition treated and the current treatment options available for the givendisease (FDA PDUFA V, 2013).
� EMA: The assessment of the bene�ts and risks in the context of a new drug ap-plication must reach, as objectively as possible, a su¢ cient level of con�dence thata set level of quality, e¢ cacy, and safety of the new medical product has beendemonstrated (CHMP bene�t-risk re�ection paper, 2007).

HA: e¢ cacy IA
� FDA: It is important to bear in mind that early termination for e¢ cacy shouldgenerally be reserved for circumstances where there is the combination of compellingethical concern and robust statistical evidence" (FDA adaptive design guidance,2010).
� EMA: To argue for design modi�cations in a phase III trial (...) is then a contradic-tion to the con�rmatory nature of such studies and will be rarely acceptable withoutfurther justi�cation ... (CHMP adaptive design re�ection paper, 2007)

Spending functions vs POS
� Current e¢ cacy IA group sequential designs are based on alpha spending.
� Spending function only has e¢ cacy component.
� Spending function choice is arbitrary.
� Static
� Propose to use probability of success (POS) to design e¢ cacy IA
� �exible success criteria to incorporate safety, severity of disease and other com-poents
� link e¢ cacy IA to �nal design
� Dynamic

POS is a random variable
� Power
� Conditional power: probability of observing statistical signi�cance in the �nal analysis given the
obsrerved data and the treatment e¤ect parameter equals to a speci�c value.
� Predictive power: probability of observing statistical signi�cance in the �nal analysis given the
obsrerved data.
� Probability of success (POS)
� Conditional probability of success (CPOS): probability of success in terms of estimated treatment
e¤ect in the �nal analysis given the observed data and the treatment e¤ect parameter equals
to a speci�c value.
� Predictive probability of success (PPOS): probability of success in terms of estimated treatment
e¤ect in the �nal analysis given the observed data.
� Posterior probability of success (OPOS): probability of success in terms of the treatment e¤ect
parameter given the observed data

Defensive Decision Rule for E¢ cacy IA
f center of POS() � cut1� � 100th POS percentile () � cut2
for declaring e¢ cacy
where cut1 > cut2 are values close to 1. � is a value close to 0.
POS can be PPOS or CPOS

Defnesive POS Optimal Design
Finding the optimal design is equivalent to �nd the solution to the following equationswith respect to the design parameters.
f center of POS() = cut1� � 100th POS percentile () = cut2

Types of POS
� Type of data: binary, normal, time to event
� Function:
� Inference: Make inference about general population using trial data.
� Predictive: Use available data to predictive future analysis.
� Relationship between the trial providing data and the trial to be predicted
� cross trial: using data from one trial to predict another independent trial
� within trial: using IA to predict �nal anlaysis
� Relationship between the end point providing information and the end point to be predicted
� 1:1 Using 1 end point to predict same end point
� 1:1� Using 1 end point to predict di¤erent end point

Within Trial Predictive POS
� End point: time to event
� Parameter of interest: ln (HR)
� �̂(t) is the estimated ln (HR) at the interim analysis
�̂ (t) j�~N��; �21 = 1= (r (1� r) d)
�d is the number of events at the time of interim analysi t.
where r is the randomization ratio

Within Trial Predictive POS
Assume a Gaussian prior ln (HR) = �~N��0; �
20 = 1= (r (1� r) d0)
�

Within Trial Predictive POS
The posterior distribution is
�j�̂ (t) ~N�'�̂ (t) + (1� ') �0; �20 (1� ')
�
where ' =�1 +
�21�20
��1=�
�20�20+�
21
�
Within Trial CPOS
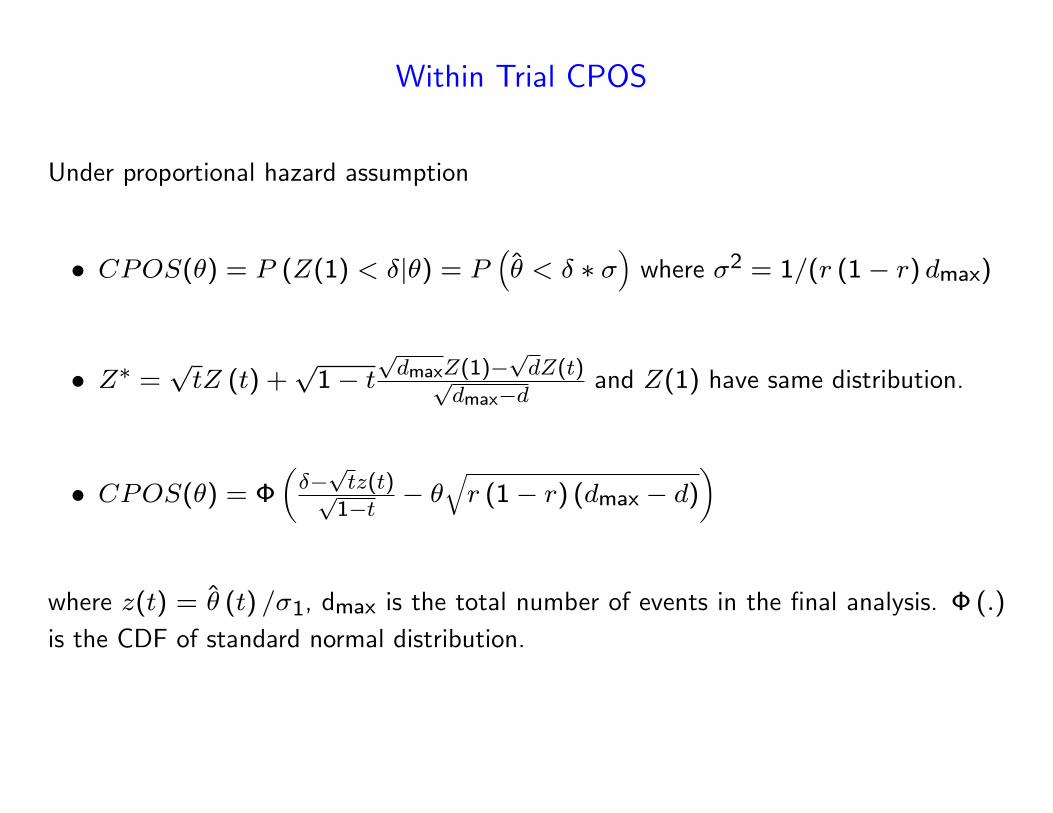
Under proportional hazard assumption
� CPOS(�) = P (Z(1) < �j�) = P��̂ < � � �
�where �2 = 1=(r (1� r) dmax)
� Z� =ptZ (t) +
p1� t
pdmaxZ(1)�
pdZ(t)p
dmax�dand Z(1) have same distribution.
� CPOS(�) = ����ptz(t)p1�t � �
qr (1� r) (dmax � d)
�
where z(t) = �̂ (t) =�1, dmax is the total number of events in the �nal analysis. �(:)is the CDF of standard normal distribution.

CPOS Credible Interval
� median CPOS=mCPOS = CPOS(median of �)
� low percentile (width of CI): � � 100 percentile ofCPOS = CPOS((1� �) � 100 percentile of �).
� mCPOS and � � 100th CPOS percentile is an equivalent statistic of observedhazard ratio and number of events.

PPOS and Credible Interval
� PPOS��̂ (t)
�= �
0B@ ��ptz(t)p1�t =
pr(1�r)(dmax�d)�
h'�̂(t)+(1�')�0
iq�20(1�')+�
22
1CA where �22 =1=(r (1� r) (dmax � d))
� median PPOS=mPPOS��̂ (t)
�= �
0B@ ��ptz(t)p1�t =
pr(1�r)(dmax�d)�
h'�̂(t)+(1�')�0
iq�20(1�')+�
22
1CA
� low percentile (width of CI): � � 100 percentile ofPPOS = PPOS ((1� �) � 100 percentile of �).
� mPPOS and � � 100th PPOS percentile is an equivalent statistic of observedhazard ratio and number of events.

Decision making is dynamic
Big registration trials often involve protracted decision making.
� Drug development landscape changes quickly.
� Long term and rare adverse events may only emerge after the exploratory stage.

Time to treatment failure
TTF=min(TTE, TTS).
TTE: time to e¢ cacy failure
TTS: time to safety failure
TTF: time to treatment failure.
Assuming exponential distribution: HRTTE � HRTTF � �1e=�2c.
For the experimental arm, TTS ~exp(�1e) and TTE ~exp(�2e).
For the control arm, TTE ~exp(�2c).

Success adjustment
�� = � + �1e=�2c.
� : HR success cuto¤ of e¢ cacy end point TTE
�� : HR success cuto¤ of composite end point TTF

Example
� Primary end point: PFS (progression free survival)
� Sample size: 324 events in �nal analysis.
� Randomization ratio: 1:1
� Success criteria at design stage: HR � 2=3 (clinical meaningful) in the �nalanalysis.
� Prior information
� Non-informative prior: prior variance = in�nity (equivalent to 0 event)

Example: optimal defensive e¢ cacy interim design
When the following 2 conditions must be satis�ed to declare e¢ cacy.
1. mCPOS � 99%.
2. 10th percentile of the CPOS is � 95%.
Optimal e¢ cacy IA design:t = 0:78; d1 = 253 and cuto¤ HR at IA to be 0:59.

Optimal e¢ cacy interim design

Defensive e¢ cacy interim design

Example: defensive design with newly emerged safety signal
� The time to the grade3/4 QT prolongation has approximate exponential distributionwith rate parameter equals to 0.0052 (�1e = 0:0052).
� The median PFS of the control arm is estimated to be 9 month (�2c = log(2)=9 =0:077).
� To o¤set the QT toxicity, the cuto¤ HR of PFS to declare success in the �nalanalysis is adjusted from 2/3 (�HR = 2=3) to 0.6 (�
�HR = 0:6).
� Optimal e¢ cacy IA design:t = 0:78 and cuto¤ HR at IA to be 0:53.

Take home messages
� POS is an information dependent statistic.
� POS defensive design can faciliate buying from HAs when the submission is basedon IA data.

Reference
CHMP adaptive design re�ection paper, 2007, London, UK, European Medicines Agency,Re�ection paper on methodological issues in con�matory clinical trials planned with anadaptive designs. http://www.ema.europa.eu/docs/en_GB/document_library/Scienti�c_guideline/2009/09/WC500003616.pdf
Dubey SD, Chi GYH, and Kelly RE, the FDA and IND/NDA statistical review process,statistics in the pharmaceutical industry, 3rd ed. edited by Buncher CR and Tsay J,2006, p55-78.
EMA Bene�t-risk methodology project: work package 2 report: applicability of currenttools and processes for regulatory bene�t-risk assessment. 2010, http://www.ema.europa.eu/docs/en_GB/document_library/Report/2010/10/WC500097750.pdf
FDA Adaptive design Guidance for Industry: Adaptive Design Clinical Trials for Drugsand Biologics, 2010
FDA PDUFA V draft implementation plan: structured approach to bene�t-risk assess-ments in drug regulatory decision-making. 2013

Reference
Tang, Z. Dey, J. (2011). Bayesian PPOS design for clinical trials. PaSIPHIC anualmeeting.
Tang Z, (2015), PPOS design, slideshare. http://www.slideshare.net/ZhongwenTang/ppos-design-48730837
Tang, Z. (2015). Optimal futility interim design: a predictive probability approach withtime to event ene point. Journal of Biopharmaceutical Statistics. 25(6), 1312-1319.
Tang, Z. (2016). Defensive e¢ cacy interim design: structured bene�t/risk assesse-ment using probability of success. Journal of Biopharmaceutical Statistics, 2016,.doi:10.1080/10543406.2016.1198370.