deferred taxes: your balance sheet may not be what you think
TRANSCRIPT

Deferred Taxes: Your Balance Sheet
May Not Be What You Think
IL Soy Advisor Webinar (AMP Summer Series), August 19, 2021

Agenda
About Presenters
Farm Financial Standards Council
Overview of Deferred Taxes
Examples of Deferred Taxes

Todd Doehring Bio
▪ Todd is a Director with Centrec Consulting Group, LLC, located in Savoy.
▪ Centrec is a management consulting company working within the food and ag sector: research, education, consulting.
▪ Contact at:
• linkedin.com/in/tdoehring
• centrec.com
• 217-352-1190
▪ Director at Centrec for over 30 years
▪ Member of the Farm Financial Standards Council for nearly 20 years, past president, and currently serving as co-chair of the Technical Committee
▪ Grew up on a farm in central Illinois and attended the University of Illinois earning, degrees in Agricultural Economics
▪ Taught at the University of Illinois for 10 years

Dick Wittman Bio
▪ Dick Wittman is former manager and board chair of a 20,000-acre Idaho family farm partnership involving crops, cattle and timber and provides consulting services in family farm business and financial management in the US and abroad.
▪ Contact at:
• www.linkedin.com/in/dick-wittman-97559821/
• wittmanfarms.com
• 208-305-1344
▪ Former FCS lender
▪ Served on numerous commodity
and financial institution boards
▪ Member and past president of the
Farm Financial Standards Council
▪ Past president/founding member
of the PNW Direct Seed
Association
▪ Adjunct faculty member of Texas
A&M University teaching annually
at the TEPAP Executive program
and King Ranch Institute

About the Farm Financial Standards
Council (FFSC)

About the FFSC
▪ Began in 1989, on the heels of the ‘80s farm crisis
▪ Primary mission is to develop standards for preparation and analysis of
agriculture financial statements
▪ Today, the FFSC, is comprised of over 150 members across the U.S., and
includes, producers, accountants, lenders, academicians, extension agents,
software developers, and consultants.
▪ Continuing efforts are to keep the guidelines current and relevant to
agriculture
Overview of Deferred Taxes
Dick Wittman

Deferred and Estimated Taxes
▪ What is difference between cost and market value?
▪ Why is it important to know?
• Annual tax planning, business expansion
• Optimizing estate and succession planning strategies
• Asset transfers/replacement/tax free exchanges
▪ How much of your net worth is unrealized gain?
• What portion is deferred income?
• What portion is valuation equity?
▪ How do we calculate deferred and estimated tax liability what financial statements do they impact?
• Impact on Accrual-Adjusted Income Statement
• Impact on Net Worth Reconciliation

CostCostCost
MktValue
DeferredTax Liab
Changes in Current Assets/Liab. + Base Values Breeding Stock, M&E
Result in→ Change in Deferred Tax (affects Accrual Adjusted Net Income)

Interm.Assets/
Liab
EstimatedTax
Changes in Cost (Book) vs. MV of Fixed Assets – Valuation Equity
Result in→ Change in Estimated Tax (affects NW reconciliation – not Accrual NI)

Good Management Practice:
Make Valuation Equity Transparent!
*Unrealized Gain (Valuation Equity & Deferred Income)
= 43% of Total Equity Value
…How much of your NW is YOURS vs. GAIN Subject to Tax?
Owners Book Capital Unreal Gain* Total Equity
Partner A $1,750,000 $1,300,000 $3,050,000
Partner B $1,500,000 $1,113,000 $2,613,000
Partner C $900,000 $675,000 $1,575,000
Totals $4,150,000 $3,088,000 $7,238,000

Items that Contribute to:
Deferred Income and Tax
▪ Excess of Carrying (Book) Value over Tax Basis
▪ Deferred Income Items: Current Assets that are taxable when sold or converted to cash
• Commodities, Accts Receivable, Prepaid expenses
• Hedging Equity, Cash Investment in Growing Crop
▪ Deferred Expense Items: Current Liabilities that are deductible when paid
• Accounts payable, accrued interest, property taxes
• Estimated federal and state income and payroll taxes
• Unearned government payments
▪ Book (Base) Value vs. Tax Basis
• Breeding Stock, Machinery/Equip, Bldgs & Improvements

Items that Contribute to:
Valuation Equity & Estimated Tax
▪ Difference between Market Value and Book (Base Value)*
• Breeding Stock
• Machinery & Equipment
• Building & Improvements
• Cash Value of Life Insurance
• Securities and Investments
• Farm Real Estate
* This difference results in the Valuation Equity portion of Net Worth

In Perfect World –
3 column Balance Sheet is the IDEAL
▪ Tax/Cost Basis
▪ Accrual/Book Value
▪ Market Value
→ Look for accounting systems that can deliver all three sets of values

Where should Deferred Tax be Recorded?
Two Options:
1. Record on the balance sheet as Deferred and Estimated Tax Liability
a. Pros – more realistic presentation of net worth for owners' evaluation of retirement wealth, buyouts and transition
b. Cons – bankers don’t like this…distorts serviceable debt, financial ratios, and credit scoring models
2. Record as footnote to financial statements
a. Pros – discloses potential liability that exists; acknowledges the amount is not an exact science (tax laws subject to change; death can erase or reduce tax)
b. Cons – tends to overstatement recognizable equity on primary financial statements
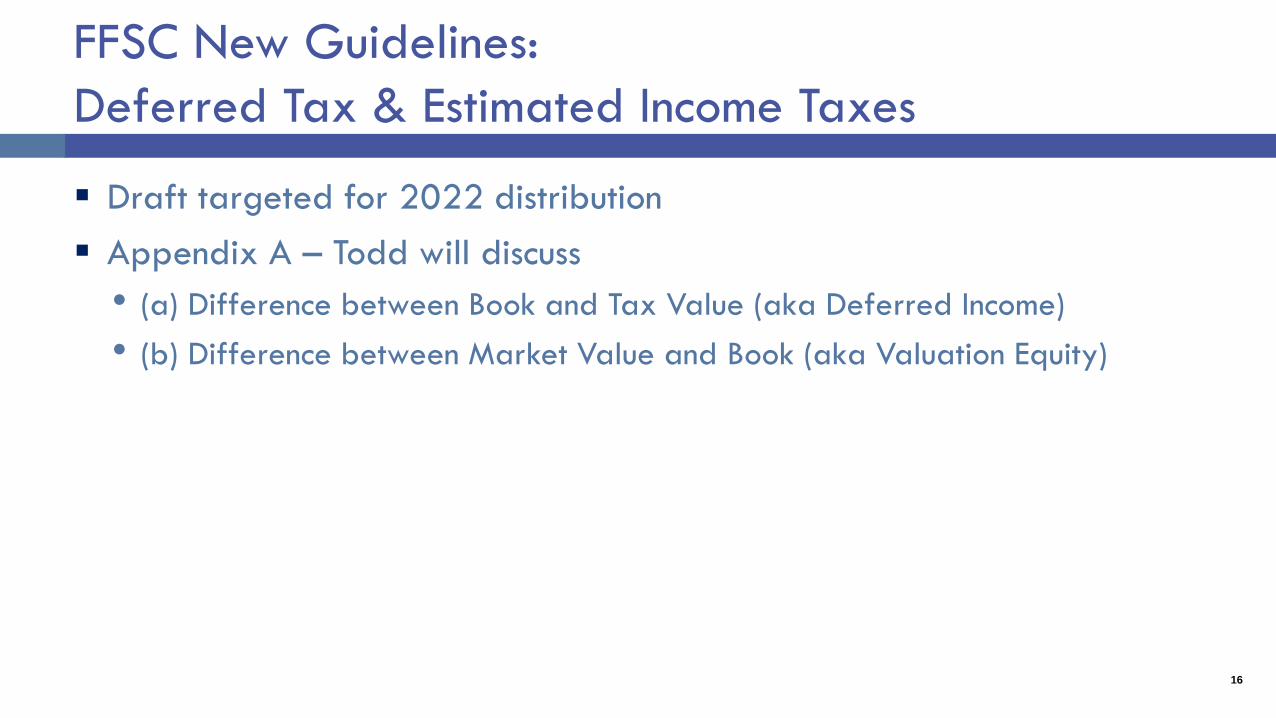
FFSC New Guidelines:
Deferred Tax & Estimated Income Taxes
▪ Draft targeted for 2022 distribution
▪ Appendix A – Todd will discuss
• (a) Difference between Book and Tax Value (aka Deferred Income)
• (b) Difference between Market Value and Book (aka Valuation Equity)
16

Examples of Deferred Taxes
Todd Doehring

Deferred Taxes Calculation
Deferred Taxes of Current Assets
less Current Liabilities
Deferred Taxes of Book/Tax* Differences on
M&E, B&I
Estimated Income Taxes from
Valuation Equity
*Also relates to base value of raised breeding stock

Bill and Betty Farmer
Balance Sheet (Market Value)
Business Assets and Liabilities (with personal separated)
As of 12/31/X7 and 12/31/X8
ASSETS 12/31/X8 12/31/X7 LIABILITIES 12/31/X8 12/31/X7
Cash 52,208$ 68,419$ Accounts Payable, Crops 0$ 0$
Hedging Account Equity 19,000 22,250 Accounts Payable, Livestock 6,578 4,563
Accounts Receivable, Crops 10,500 0 Overdrafts 0 0
Accounts Receivable, Livestock 0 0 Notes Due Within One Year (Sched. 5) 95,570 74,750
Inventories, Crops (Sched. 1) 88,750 77,625 Current Portion of Term Debt (Sched. 5) 57,816 100,926
Inventories, Feed (Sched. 1) 32,825 33,025 Current Portion of Finance Leases (Sched. 6) 14,215 13,506
Inventories, Livestock (Sched. 1) 51,750 48,600 Accrued Interest, Notes Due Within One Year (Sched. 5) 3,385 1,616
Inventories, Supplies (Sched. 1) 2,548 1,800 Accrued Interest, Noncurrent Loans (Sched. 5) 24,941 27,535
Prepaid Expenses (Sched. 1) 45,000 28,000 Accrued Interest, Finance Leases (Sched. 6) 2,162 2,812
Cash Investment in Growing Crops 35,400 32,679 Business Income Taxes Payable 13,705 14,769
Other Current Assets 0 0 Other Accrued Expenses 0 0
Other Current Liabilities 0 0
Total Current Assets 337,981$ 312,398$ Total Current Liabilities 218,372$ 240,477$
Breeding Livestock (Sched. 2) 298,100 307,650 Noncurrent Portion, Notes Payable (Sched. 5) 66,257 94,150
Machinery & Equipment (Sched. 3) 728,000 767,000 Noncurrent Portion, Real Estate Debt (Sched. 5) 501,868 531,791
Right-of-Use Assets, Finance Leases 44,921 58,427 Noncurrent Portion, Finance Leases (Sched. 6) 30,706 44,921
Investments in Other Entities 0 0 Deferred Income Tax (Sched. 7) 231,960 197,178
Investments in Cooperatives 27,763 27,763 Other Noncurrent Liabilities 0 0
Land (Sched. 4) 2,480,000 2,384,000
Buildings & Improvements (Sched. 4) 207,825 172,825
Other Assets 0 0
Total Noncurrent Assets 3,786,609$ 3,717,665$ Total Noncurrent Liabilities 830,791$ 868,040$
Total Business Liabilities 1,049,163$ 1,108,517$
Estimated Income Tax (Sched. 7) 459,545$ 432,872$
Total Business Liabilities and Estimated Income Tax 1,508,708$ 1,541,389$
Retained Capital 1,237,246 1,190,059 Valuation Equity (Sched. 8) 1,378,636 1,298,615
Total Business Net Worth 2,615,882$ 2,488,674$
Total Business Assets 4,124,590$ 4,030,063$ Total Business Liabilities and Net Worth 4,124,590$ 4,030,063$
Personal Assets (Sched. 9) 260,900$ 251,250$ Personal Liabilities and Related Taxes (Sched. 9) 21,191$ 15,780$
Total Liabilities 1,529,899 1,557,169
Total Net Worth 2,855,591 2,724,144
Total Assets 4,385,490$ 4,281,313$ Total Liabilities and Net Worth 4,385,490$ 4,281,313$
Note: This Balance Sheet includes both personal and business assets and liabilities

Bill and Betty Farmer
Farm Income Statement (Accrual-Adjusted)
For the Period January 1, 'X8 Thru December 31, 'X8
Revenues
Crop Sales 509,518$
Increase (Decrease) in Crop Inventories 11,125
Increase (Decrease) in Crop Accounts Receivable 10,500
Total Crop Revenue 531,143$
Market Livestock Sales 118,128
Increase (Decrease) in Market Livestock Inventories 3,150
Increase (Decrease) in Livestock Accounts Receivable 0
Total Market Livestock Revenue 121,278
Raised Breeding Livestock Sales 21,000
Increase (Decrease) in Base Value of Raised Breeding Livestock 13,000
Purchased Breeding Livestock Sales 7,915
Less Net Book Value of Purchased Breeding Livestock Sales (10,040)
Total Breeding Livestock Revenue 31,875
Crop Insurance Proceeds 0
Ag Program Payments 46,336
Patronage Dividends 3,300
Other Operating Revenue 0
Hedging Gains (Losses)* 1,750
Increase (Decrease) in Other Receivables 0
Total Other Operating Revenues 51,386
Gross Revenues 735,682$
Expenses
Operating Expenses 466,329
Feed Purchases 31,583
(Increase) Decrease Feed Inventories 200
Feeder Livestock Purchases 0
(Increase) Decrease Supplies Inventories (748)
(Increase) Decrease Prepaid Expenses (17,000)
(Increase) Decrease Cash Investment in Growing Crops (2,721)
(Increase) Decrease Other Current Assets 0
Increase (Decrease) Accounts Payable 2,015
Increase (Decrease) Other Accrued Expenses 0
Depreciation Expense 67,204
Amortization of Finance Leases 13,506
Total Operating Expenses 560,368
Income from Operations 175,314$
Other Revenue (Expenses)
Interest Income 0
Interest Expense:
Interest on Current Loans (1,879)
(Increase) Decrease in Interest Payable on Current Loans (1,769)
Interest on Noncurrent Loans (35,838)
Interest on Finance Leases (3,067)
(Increase) Decrease in Interest Payable on Noncurrent Loans 3,244
Amortization of Loan Fees 0
Total Interest Expense (39,309)
Sales of Farm Assets 0
Less Net Book Value of Farm Assets Sold 0
Total Gain (Loss) on Sale of Farm Assets 0
Other Miscellaneous Income (Expense) 0
Total Other Revenue (Expenses) (39,309)
Income before Income Tax (Net Farm Income) 136,005$
Income Tax Expense
Income Taxes 14,769
Increase (Decrease) in Accrued Income Taxes (1,064)
Increase (Decrease) in Deferred Taxes 34,782
Total Income Tax Expense 48,487
Net Income 87,518$
*Hedging Gains (Losses) may be allocated to Crop or Livestock Sales, or Feed or Livestock Purchases.

Bill and Betty Farmer
Statement of Net Worth
For the Period January 1, 'X8 Thru December 31, 'X8
Net Worth at Beginning of Period (Market Value) 2,724,144$
Net Income/Loss (Business Income Statement) 87,518$
Withdrawals for Labor & Management (55,740)$
Other Withdrawals (12,680)
Nonfarm Income Contributed to the Farm Business 28,089
Owner Withdrawals, Net (40,331)
Other Capital Contributions, Gifts, Inheritances 0
Capital Distributions, Gifts Made 0
Total Change in Retained Capital 47,187$
106,694
Change in Estimated Income Tax Liability Related to Valuation Equity (26,673)
Total Change in Valuation Equity 80,021$
Total Change in Total Business Net Worth 127,208$
Increase in Value of Personal Assets 9,650
Less Increase in Personal Liabilities 5,411
Net Worth Change due to Changes in Personal Assets and Liabilities 4,239$
Net Worth at End of Period (Market Value) 2,855,591$
Change in Excess of Market Value over Book/Base Value of Noncurrent Assets

Schedule 7 -- Deferred & Estimated Income Taxes
'X8 'X7
Net Realizable Value (NRV) Tax Differences NRV Tax Basis Difference NRV Tax Basis Difference
Deferred Income Items:
Inventories 175,873$ 0$ 175,873$ 161,050$ 0$ 161,050$
Accounts Receivable 10,500 0 10,500 0 0 0
Hedging Account Equity 19,000 19,000 0 22,250 22,250 0
Prepaid Expenses 45,000 0 45,000 28,000 0 28,000
Cash Investment in Growing Crops 35,400 0 35,400 32,679 0 32,679
Excess of Carrying Value over Tax Basis of Current Assets 266,773 221,729
Deferred Income Liability on Crop Insurance, Disaster Payments and Contracts 0 0
Total Deferred Income 266,773 221,729
Deferred Expense Items:
Accounts Payable 6,578 4,563
Accrued Interest 30,488 31,963
Net Operating Losses (NOL) & Other Deductions 0 0
Other Accrued Expenses 0 0
Total Deferred Expenses 37,066 36,526
Net Deferred Income Subject to Income Tax 229,707$ 185,203$
Estimated Federal and State Income Tax Rate 30.00% 30.00%
Estimated Federal and State Income Tax 68,912 55,561
Self-Employment Tax:
Self-Employment Income Cap 128,400 127,200
22,073 20,733
(a) Total Deferred Tax Liability Related to Current Assets and Current Liabilities 90,985$ 76,294$
Book (Base Value) Tax Differences Book/Base Tax Basis Difference Book/Base Tax Basis Difference
Raised Breeding Livestock 228,000$ 0$ 228,000$ 215,000$ 0$ 215,000$
Purchased Breeding Livestock 43,848 29,800 14,048 56,857 42,235 14,622
Machinery and Equipment 382,416 159,802 222,614 437,490 231,731 205,759
Real Estate and Improvements 1,221,480 1,216,225 5,255 1,190,641 1,223,075 (32,434)
Net Deferred Income Subject to Income Tax 469,917$ 402,947$
Estimated Federal and State Income Tax x 30.00% x 30.00%
(b) Total Deferred Tax Liability Related to Book/Base Value of Noncurrent Assets 140,975$ 120,884$
Total Deferred Taxes (a + b) 231,960$ 197,178$
140,975$ 120,884$
Estimated Taxes Related to Valuation Equity Market Value Book/Base Difference Market Value Book/Base Difference
Raised Breeding Livestock 240,600$ 228,000$ 12,600$ 239,250$ 215,000$ 24,250$
Purchased Breeding Livestock 57,500 43,848 13,652 68,400 56,857 11,543
Machinery and Equipment 728,000 382,416 345,584 767,000 437,490 329,510
Real Estate and Improvements 2,687,825 1,221,480 1,466,345 2,556,825 1,190,641 1,366,184
Excess of Market over Book/Base Values of Noncurrent Assets 1,838,181$ 1,731,487$
Estimated Federal and State Income Tax x 25.00% x 25.00%
(c) Total Estimated Income Tax Liability Related to Valuation Equity 459,545$ 432,872$
Self-Employment Tax of 15.3%, subject to SE Income Cap of 93.25% on Net Deferred Income plus
2.9% on Net Deferred Income exceeding SE Income Cap

'X8 'X7
Net Realizable Value (NRV) Tax Differences NRV Tax Basis Difference NRV Tax Basis Difference
Deferred Income Items:
Inventories 175,873$ 0$ 175,873$ 161,050$ 0$ 161,050$
Accounts Receivable 10,500 0 10,500 0 0 0
Hedging Account Equity 19,000 19,000 0 22,250 22,250 0
Prepaid Expenses 45,000 0 45,000 28,000 0 28,000
Cash Investment in Growing Crops 35,400 0 35,400 32,679 0 32,679
Excess of Carrying Value over Tax Basis of Current Assets 266,773 221,729
Deferred Income Liability on Crop Insurance, Disaster Payments and Contracts 0 0
Total Deferred Income 266,773 221,729
Deferred Expense Items:
Accounts Payable 6,578 4,563
Accrued Interest 30,488 31,963
Net Operating Losses (NOL) & Other Deductions 0 0
Other Accrued Expenses 0 0
Total Deferred Expenses 37,066 36,526
Net Deferred Income Subject to Income Tax 229,707$ 185,203$
Estimated Federal and State Income Tax Rate 30.00% 30.00%
Estimated Federal and State Income Tax 68,912 55,561
Self-Employment Tax:
Self-Employment Income Cap 128,400 127,200
22,073 20,733
(a) Total Deferred Tax Liability Related to Current Assets and Current Liabilities 90,985$ 76,294$
Self-Employment Tax of 15.3%, subject to SE Income Cap of 93.25% on Net Deferred Income plus
2.9% on Net Deferred Income exceeding SE Income Cap
Due to Current Assets & Current Liabilities

Book (Base Value) Tax Differences Book/Base Tax Basis Difference Book/Base Tax Basis Difference
Raised Breeding Livestock 228,000$ 0$ 228,000$ 215,000$ 0$ 215,000$
Purchased Breeding Livestock 43,848 29,800 14,048 56,857 42,235 14,622
Machinery and Equipment 382,416 159,802 222,614 437,490 231,731 205,759
Real Estate and Improvements 1,221,480 1,216,225 5,255 1,190,641 1,223,075 (32,434)
Net Deferred Income Subject to Income Tax 469,917$ 402,947$
Estimated Federal and State Income Tax x 30.00% x 30.00%
(b) Total Deferred Tax Liability Related to Book/Base Value of Noncurrent Assets 140,975$ 120,884$
Total Deferred Taxes (a + b) 231,960$ 197,178$
Due to Book/Tax Differences
'X8 'X7

Estimated Taxes Related to Valuation Equity Market Value Book/Base Difference Market Value Book/Base Difference
Raised Breeding Livestock 240,600$ 228,000$ 12,600$ 239,250$ 215,000$ 24,250$
Purchased Breeding Livestock 57,500 43,848 13,652 68,400 56,857 11,543
Machinery and Equipment 728,000 382,416 345,584 767,000 437,490 329,510
Real Estate and Improvements 2,687,825 1,221,480 1,466,345 2,556,825 1,190,641 1,366,184
Excess of Market over Book/Base Values of Noncurrent Assets 1,838,181$ 1,731,487$
Estimated Federal and State Income Tax x 25.00% x 25.00%
(c) Total Estimated Income Tax Liability Related to Valuation Equity 459,545$ 432,872$
Due to Market/Book Differences
'X8 'X7

Earnings Impact of Deferred Taxes
Reconciliation of Total Change in Deferred Taxes for Business 'X8 'X7 Change
Deferred Tax Liability Related to Book-Tax Differences (a) 90,985$ 76,294$ 14,691$
Deferred Tax Liability Related to Book (Base Value) Tax Differences (b) 140,975 120,884 20,091
Total Increase (Decrease) in Deferred Tax Liability Used in Calculating Total Income Tax Expense in 'X8 34,782
Estimated Income Taxes Related to Valuation Equity (c) 459,545 432,872 26,673
Total Increase (Decrease) in Deferred and Estimated Income Tax Liability 61,455$

Net Deferred Income Subject to Income Tax (NRV/Tax Differences) 229,707$ 185,203$
Net Deferred Income Subject to Income Tax (Book/Tax Differences) 469,917$ 402,947$
Excess of Market over Book/Base Values of Noncurrent Assets (Market/Book Differences) 1,838,181$ 1,731,487$
Deferred Income Subject to Income Tax and Valuation Equity Subject to Estimated Income Taxes 2,537,805$ 2,319,637$
(a) Total Deferred Tax Liability Related to Current Assets and Current Liabilities 90,985$ 76,294$
(b) Total Deferred Tax Liability Related to Book/Base Value of Noncurrent Assets 140,975$ 120,884$
(c) Total Estimated Income Tax Liability Related to Valuation Equity 459,545$ 432,872$
Deferred Income Taxes and Estimated Income Taxes 691,505$ 630,050$
Tax Rate on Deferred Income Related to NRV/Tax Differences 39.61% 41.19%
Tax Rate on Deferred Income Related to Book/Tax Differences 30.00% 30.00%
Tax Rate on Value Equity Related to Market/Book Differences 25.00% 25.00%
Weighted Average Tax Rate on Deferred Income and Valuation Equity 27.25% 27.16%
$ Amounts of Deferred Income/Taxes
'X8 'X7

Liabilities & Equity, Million $
3.31
2.62
0.82
1.51
0.0
0.5
1.0
1.5
2.0
2.5
3.0
3.5
4.0
4.5
Without Deferred Taxes With Deferred Taxes
Millions
Total Business Net Worth Total Business Liabilities and Estimated Income Tax
~$700K

Liabilities & Equity as % of Assets
80.2%
63.4%
19.8%
36.6%
0%
10%
20%
30%
40%
50%
60%
70%
80%
90%
100%
Without Deferred Taxes With Deferred Taxes
Equity as % of Assets Liabilities as % of Assets
~2X

As of 12/31/2020 As of 12/31/2019
Net Realizable Value (NRV) Tax Differences NRV Tax Basis Difference
Deferred Income Items:
A1 Inventories 0$
A2 Accounts Receivable 0
A3 Hedging Account Equity 0
A4 Prepaid Expenses 0
A5 Cash Investment in Growing Crops 0
A Excess of Carrying Value over Tax Basis of Current Assets [Sum A1:A5] 0
B Deferred Income Liability on Crop Insurance, Disaster Payments and Contracts 0
C Total Deferred Income [A + B] 0
Deferred Expense Items:
D1 Accounts Payable
D2 Accrued Interest
D3 Net Operating Losses (NOL) & Other Deductions
D4 Other Accrued Expenses
D Total Deferred Expenses [Sum D1:D4] 0
E Net Deferred Income Subject to Income Tax [C - D] 0$
F Estimated Federal and State Income Tax Rate 30.00%
G Estimated Federal and State Income Tax (E x F) 0
Self-Employment Tax:
H Self-Employment Income Cap 137,700
I 0
J Total Deferred Tax Liability Related to Current Assets and Current Liabilities [G + I] 0$
Book (Base Value) Tax Differences Book/Base Tax Basis Difference
K1 Raised Breeding Livestock 0$
K2 Purchased Breeding Livestock 0
K3 Machinery and Equipment 0
K4 Real Estate and Improvements 0
K Net Deferred Income Subject to Income Tax [Sum K1:K4] 0$
L Estimated Federal and State Income Tax Rate 30.00%
M Total Deferred Tax Liability Related to Book/Base Value of Noncurrent Assets [K x L] 0$
N Total Deferred Taxes [J + N] 0$
0$
Estimated Taxes Related to Valuation Equity Market Value Book/Base Difference
O1 Raised Breeding Livestock 0$
O2 Purchased Breeding Livestock 0
O3 Machinery and Equipment 0
O4 Real Estate and Improvements 0
O Excess of Market over Book/Base Values of Noncurrent Assets [Sum O1:O4] 0$
P Estimated Federal and State Income Tax 25.00%
Q Total Estimated Income Tax Liability Related to Valuation Equity [O x P] 0$
Self-Employment Tax of 15.3%, subject to SE Income Cap of 93.25% on Net Deferred Income plus
2.9% on Net Deferred Income exceeding SE Income Cap
Deferred tax
form will be
Made available

Conclusions
▪ Based on the definition of a balance sheet—a listing of all assets owned,
and liabilities owed as of a particular date—deferred (and estimated)
income taxes should be included on agricultural balance sheets.
▪ No impact on liquidity, but can greatly impact solvency*
▪ Impacts profitability by matching income taxes owned with income earned
▪ Critical issue for estate, retirement planning, and business valuation

Thank You!