define data analytic and explain why it is -...
TRANSCRIPT
After completion of this unit you will be able to:
Define data analytic and explain why it is important
Outline the data analytic tools and techniques and explain them
Now the difference between descriptive and predictive analytics
The relationship between analytics and organisation performance
Using regression to predict the future business performance or cost
Analytics “the use of data, statistical analysis, and explanatory and predictive models to gain insights and act on complex issues.” Jacqueline Bichsel
Data analytics is the science of examining raw data with the purpose of drawing conclusions about that information.
Data analytics is used in many industries to allow companies and organization to make better business decisions and
In the sciences to verify or disprove existing models or theories.
Data analytics is distinguished from data mining by the scope, purpose and focus of the analysis.
Data miners sort through huge data sets using sophisticated software to identify undiscovered patterns and establish hidden relationships.
A major goal of data mining is to discover previously unknown relationships among the data, especially when the data come from different databases
Data analytics focuses on inference, the process of deriving a conclusion based solely on what is already known by the researcher.
Data Analytics involves processes andactivities designed to obtain and evaluatedata to extract useful information. Theresults of Data Analytics may be used toidentify areas of key risk, fraud, errors ormisuse; improve business efficiencies andperformances; verify process effectiveness;and influence business decisions.
Data quality is an essential characteristic that determines the reliability of data for making decisions. High-quality data is:
Complete: All relevant data such as accounts, addresses and relationships for a given customer is concurrent.
Accurate: Common data problems like misspellings, typos, and random abbreviations have been cleaned up.
Reliable: Data should be able to be trusted.
Available: Required data is accessible on demand; users do not need to search manually for the information.
Timely: Up-to-date information is readily available to support decisions.
“Analysis of volumes of business data enables users to make more informed decisions more quickly, improving companies‟ reactions to events and possibly improving company performance.” Kurt Schlegel
(a). Generate customer insights
target the most profitable segments
predict churn
track loyalty
index and enhance satisfaction
refine cross-sell and up-sell strategies
(b). Accelerate product innovation
correlate customer needs and service data
identify market gaps and new opportunities
maximize new cross-sell potential
(c). Optimize supply chains increase planning efficiency improve demand forecasting refine inventory procurement, sourcing, plus asset and warehouse
management identify optimal pricing
(d). Reduce cost increase productivity provide great insight increase production efficiency
(e). Understand financial performance correlate potential investments, efforts and pricing changes with returns pinpoint the greatest market opportunities and risks translate financial performance knowledge into increased revenue.
(f). Analytics beat judgment Executives feel that business analytics are far more accurate than
judgment, according to Accenture survey. However some of business decisions are still made based on judgment alone, due to an absence of good data.
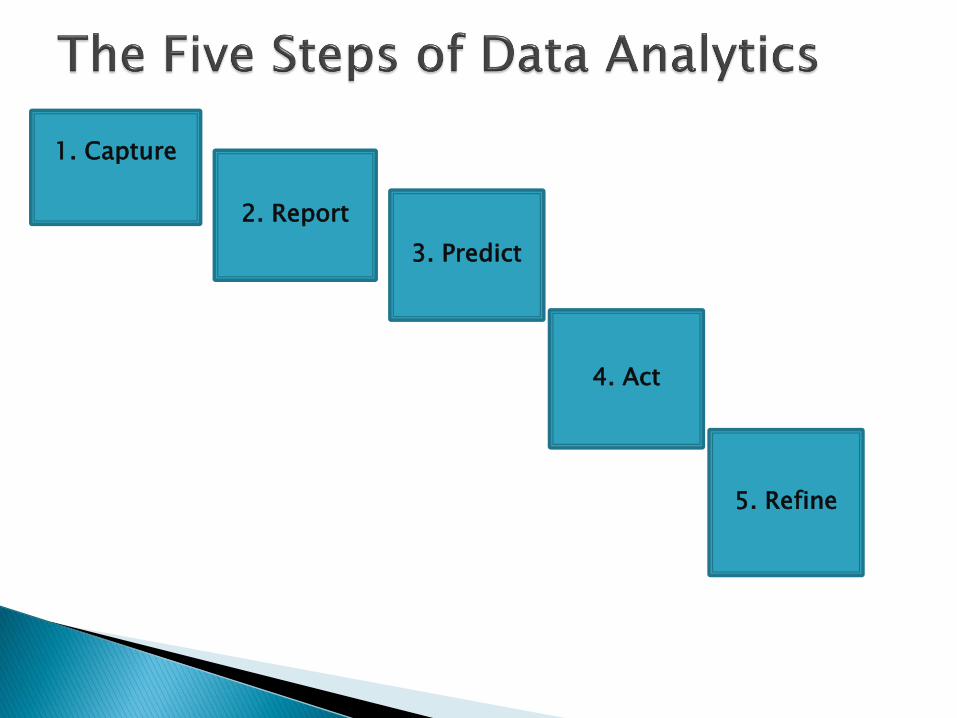
1. Capture
2. Report
4. Act
5. Refine
3. Predict
Data is the foundation of all analytics efforts. Academic analytics can be based on data from multiple sources (such as Central Data Sever, Data Management Store, or Financial Systems) and in multiple formats (such as spreadsheets, enterprise financial system reports, or paper records).
Moreover, data can originate inside or outside the institution. Managing these and other variables in the collection, organization, and rationalization of data can be a considerable challenge but is vital because decisions based on data hinge on the quality and integrity of that data.
Selecting and Organizing Data - Analytics requires determining
what data is available, what form it is in, and methods for collecting
it. Institutions collect a wide array of data about students and
courses. One of the first questions to ask is which data could
provide useful insights. The frequency of data updates affects the
nature of the questions that can be answered. For example, if
business performance is only measured as the profit?
Policy Decisions - Analytics projects require institutions to
understand and address a number of policy issues about the
collection and use of institutional data, including questions
about data privacy and stewardship. The data collected and
analyzed in a business analytics project might be protected by
federal, state, and institutional privacy regulations.
Once the data have been extracted and stored in a common location, staff equipped with query, reporting, and analysis tools can perform queries, examine the information, and identify trends, patterns, and exceptions in the data. Descriptive statistics (mean, standard deviation) are often generated.
Predict - Data that have been collected and warehoused are analyzed using statistics. The rules governing the models can be simple or extremely complex, based on numerous data points and statistical algorithms to generate predictions.
For example, a regression model using data from the class attendance data might predict the student‟s likelihood of returning the following year. When data indicate that a student has limited preparation in mathematics and has not attended class for several sessions, a rule might raise a red flag that the student is at risk for failing the course.
Prediction step can be fully carried out by developing a predictive module, with the right skill and experience from your team. Reliability of the module plays an important role and has an impact on the frequency of the module being used.
The goal of any analytics project is to enable an institution to act based on predictions and probabilities. Actions might range from “information” to “invention.”
For example, an analytics project might provide students with information in the form of an educational progress dashboard where they can view their progress toward a degree, comparisons with their peers, and possibly suggestions on how to improve. At the other end of the spectrum, if the model predicts that a student could be at risk of dropping out of school, analytics might trigger an intervention designed to change student behavior and improve learning.
That intervention could be an automated, technology-mediated contact or a personal phone call or e-mail from an advisor about study skills and resources, such as help sessions or office hours. Institutions should create mechanisms for measuring impact, such as whether students actually came to office hours when invited.
Analytics projects should include a self-improvement process. Monitoring the impact of the project is a continual effort, and statistical models should be updated on a regular basis.
For example, admissions analytics projects typically refine the model annually. A pilot project might use the same model for a year or two, but as the project moves into production, more frequent updates should be anticipated.
Refinements can involve new data, process improvements, or different actions. Additional data collected from the outcomes can be added as another component of the data warehouse, allowing institutions to update their models and assess how their interventions affect performance
"It's hard to make predictions, especially when they are about the future" Yogi Berra
What Are Predictive Analytics
Investopedia defines Predictive Analytics as “theuse of statistics and modelling to determinefuture performance based on current andhistorical data. Predictive analytics look atpatterns in data to determine if those patternsare likely to emerge again, which allowsbusinesses and investors to adjust where theyuse their resources in order to take advantage ofpossible future events.”
(a). Predictive models - look for certain relationships and patterns that usually lead to certain behaviour, point to fraud, predict system failures, assess credit worthiness, and so forth.
By determining the explanatory variables, you can predict outcomes in the dependent variables.
(b). Descriptive models aim at creating segmentations, most often used to classify customers based on for instance socio demographic characteristics, life cycle, profitability, product preferences and so forth.
Where predictive models focus on a specific event or behaviour, descriptive models identify as many different relationships as possible.
(c). Decision models that use optimization techniques to predict results of decisions.
This branch of predictive analytics leans particularly heavily on operations research, including areas such as resource optimization, route planning and so forth.
Examples: critical path, network planning and scheduling.
Organizations that make use of predictive analytics in their day-to-day activities achieve the following benefits:
Enhance business processes to improve decision-making and achieve the ability to automate, optimize and direct decisions as per demand to reach business goals
Manage current challenges and boost the probability of future success
Analytics tools give logistic and marketing manager a way to predict how their customers, and potential customers, will react to certain promotions and where they‟re likely to drop out of the purchase funnel based on historical data and real-time campaign insights.
Below is the list of the most common data analytic tools available to businesses:
Microsoft Excel Micro-strategy Oracle Data Mining SAP IBM SPS and IBM Big Data & Analytics SAS and SAS Entries Miner Statistica MATLAB Weka R TIBCO Spotfire Toovio Vertica Datameer
The Regression analysis is a statistical tool to investigateand analyze relationships between variables. The startingpoint of regression is to have something to analyze.
Usually, the investigator seeks to ascertain the causaleffect of one variable upon another, the effect of a priceincrease upon demand for example, or the effect ofchanges in the packaging price upon the market inflationrate.
To explore such issues, the investigator assembles dataon the underlying variables of interest and employsregression to estimate the quantitative effect of thecausal variables upon the variable that they influence.
In simple linear regression, we predict scores on one variable from the scores on a second variable.
The variable we are predicting is called the criterion/ dependent variable and is referred to as Y.
The variable we are basing our predictions on is called the predictor/ independent variable and is referred to as X.
When there is only one predictor variable, the prediction method is called simple regression.
In simple linear regression, the topic of this section, the predictions of Y when plotted as a function of X form a straight line.
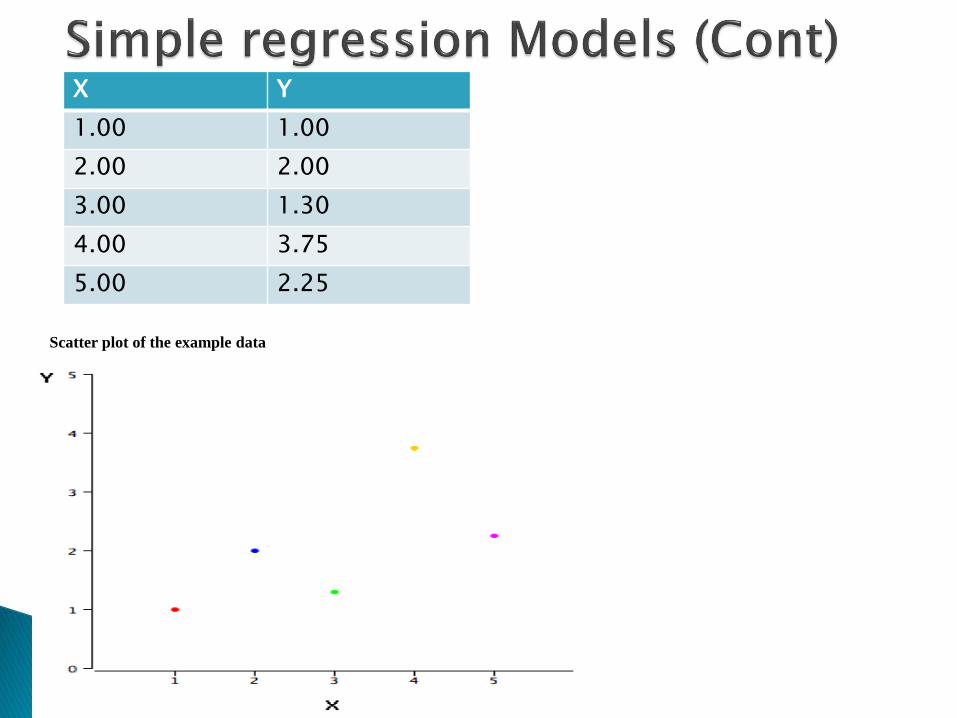
X Y
1.00 1.00
2.00 2.00
3.00 1.30
4.00 3.75
5.00 2.25
Scatter plot of the example data
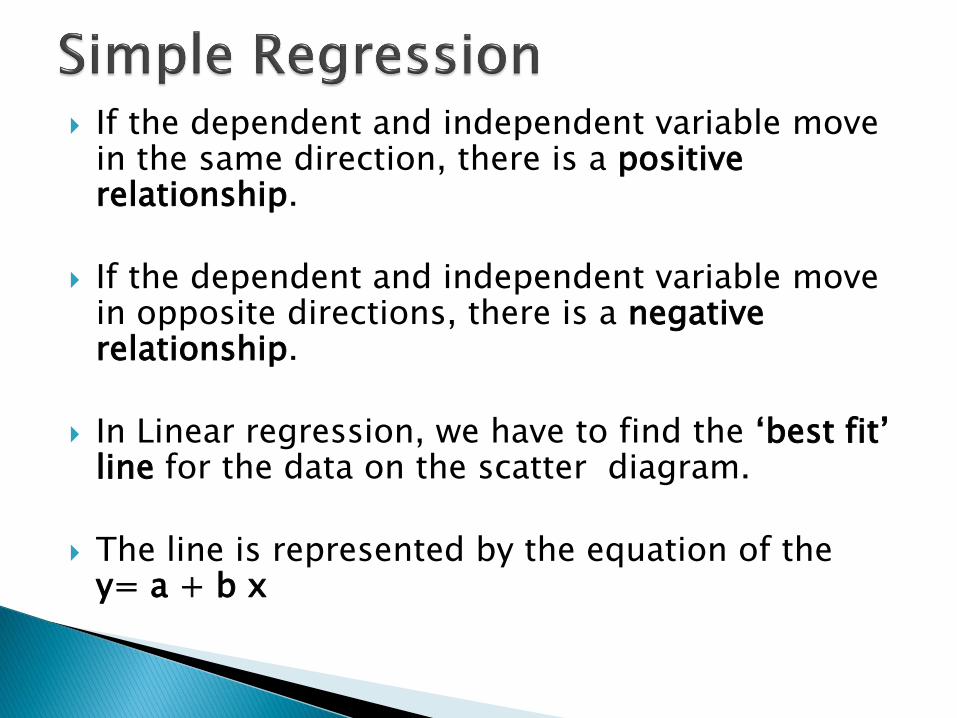
If the dependent and independent variable move in the same direction, there is a positive relationship.
If the dependent and independent variable move in opposite directions, there is a negative relationship.
In Linear regression, we have to find the „best fit‟ line for the data on the scatter diagram.
The line is represented by the equation of the y= a + b x
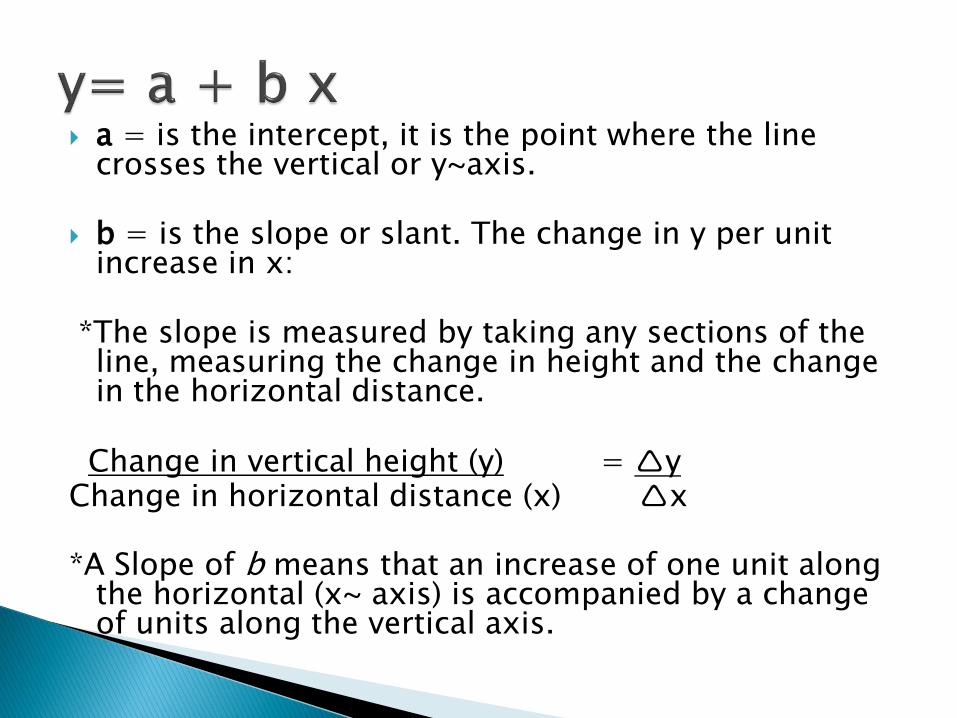
a = is the intercept, it is the point where the line crosses the vertical or y~axis.
b = is the slope or slant. The change in y per unit increase in x:
*The slope is measured by taking any sections of the line, measuring the change in height and the change in the horizontal distance.
Change in vertical height (y) = yChange in horizontal distance (x) x
*A Slope of b means that an increase of one unit along the horizontal (x~ axis) is accompanied by a change of units along the vertical axis.
Variable Y is called the dependent or endogenous variable because it is said to be depend on the value of X.
Variable X is called the independent explanatory, or exogenous, variable.
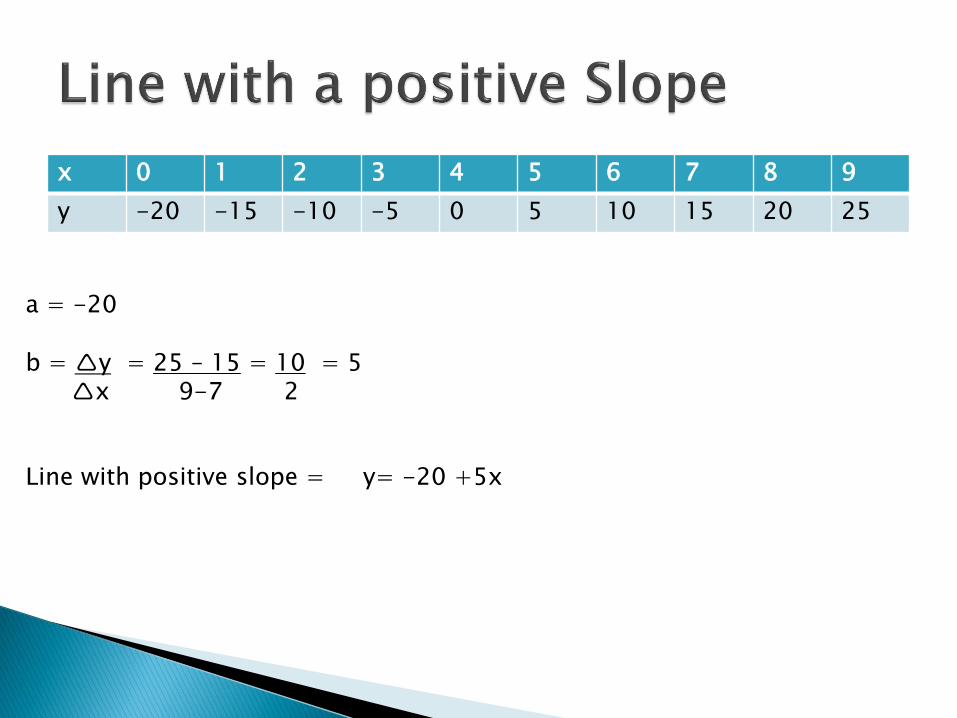
x 0 1 2 3 4 5 6 7 8 9
y -20 -15 -10 -5 0 5 10 15 20 25
a = -20
b = y = 25 – 15 = 10 = 5 x 9-7 2
Line with positive slope = y= -20 +5x
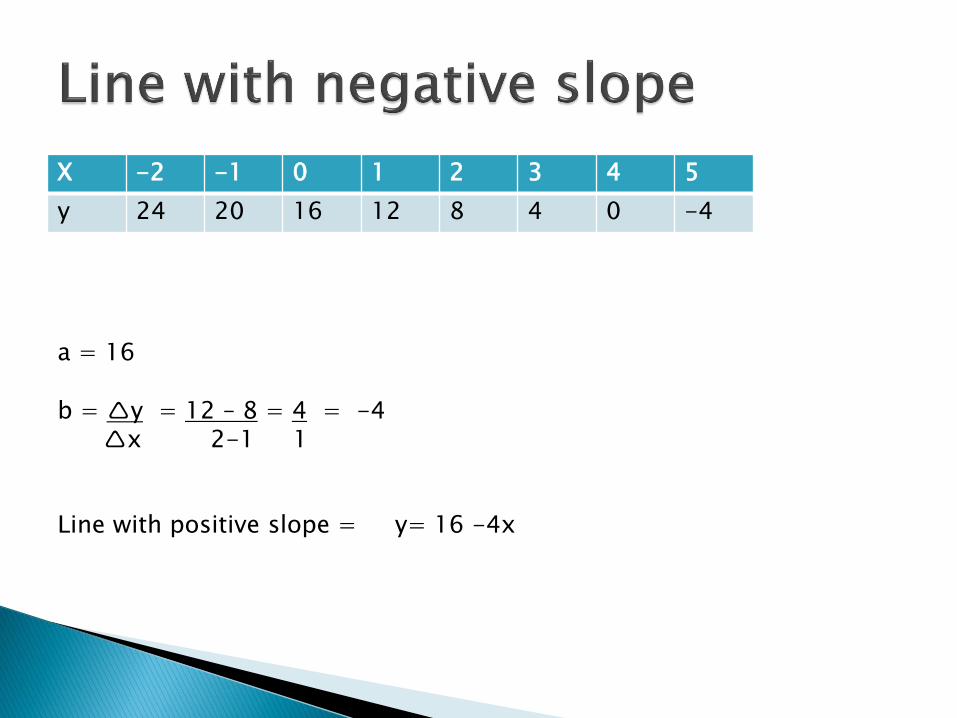
X -2 -1 0 1 2 3 4 5
y 24 20 16 12 8 4 0 -4
a = 16
b = y = 12 – 8 = 4 = -4 x 2-1 1
Line with positive slope = y= 16 -4x
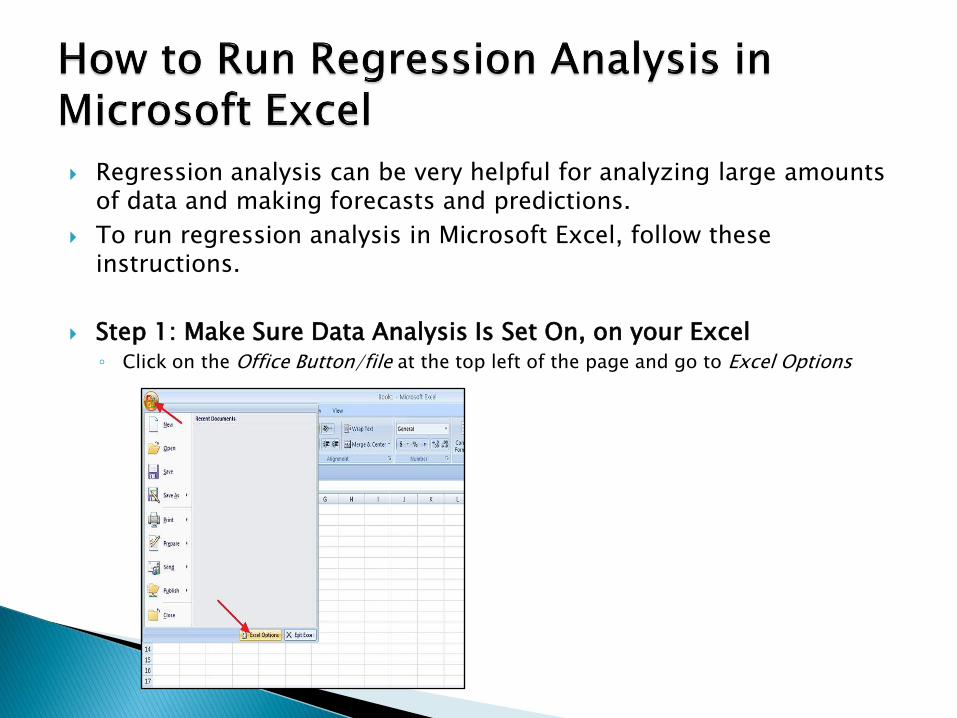
Regression analysis can be very helpful for analyzing large amounts of data and making forecasts and predictions.
To run regression analysis in Microsoft Excel, follow these instructions.
Step 1: Make Sure Data Analysis Is Set On, on your Excel◦ Click on the Office Button/file at the top left of the page and go to Excel Options
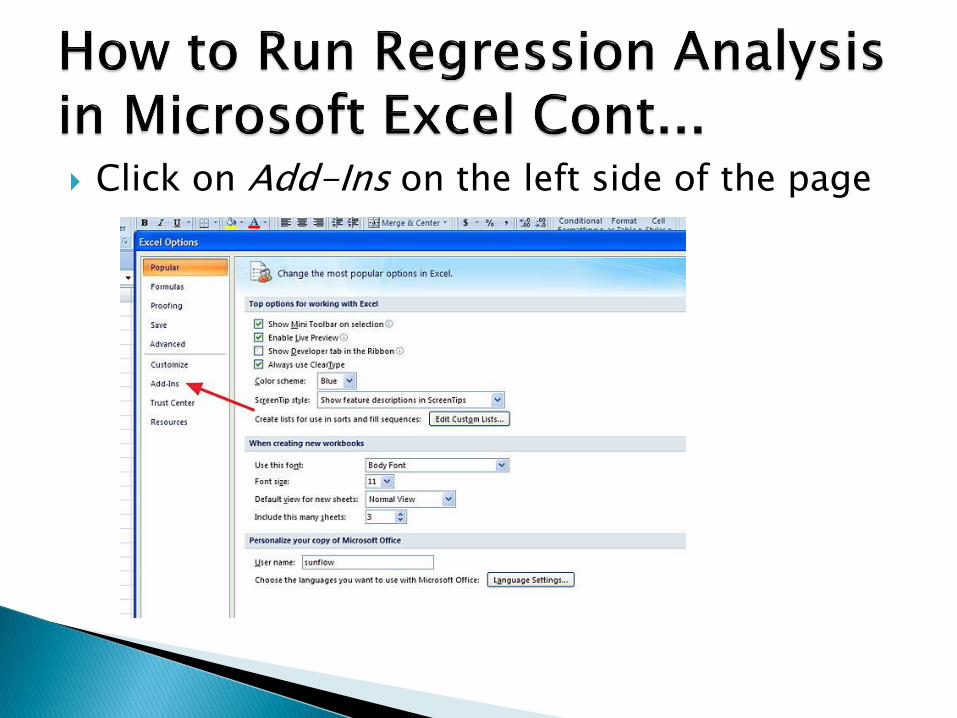
Click on Add-Ins on the left side of the page
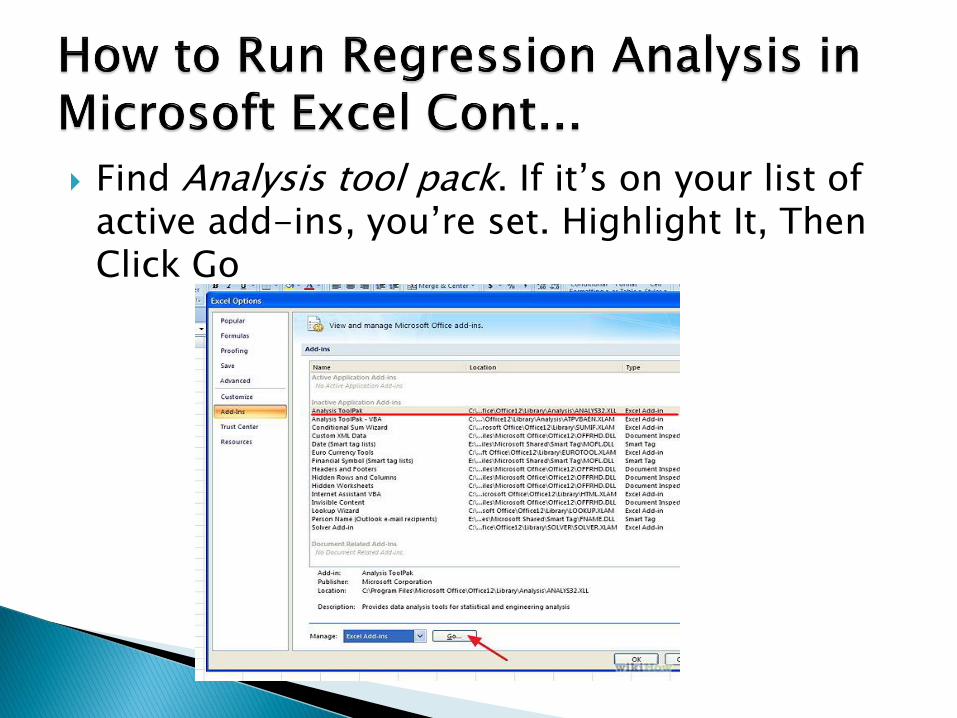
Find Analysis tool pack. If it‟s on your list of active add-ins, you‟re set. Highlight It, Then Click Go
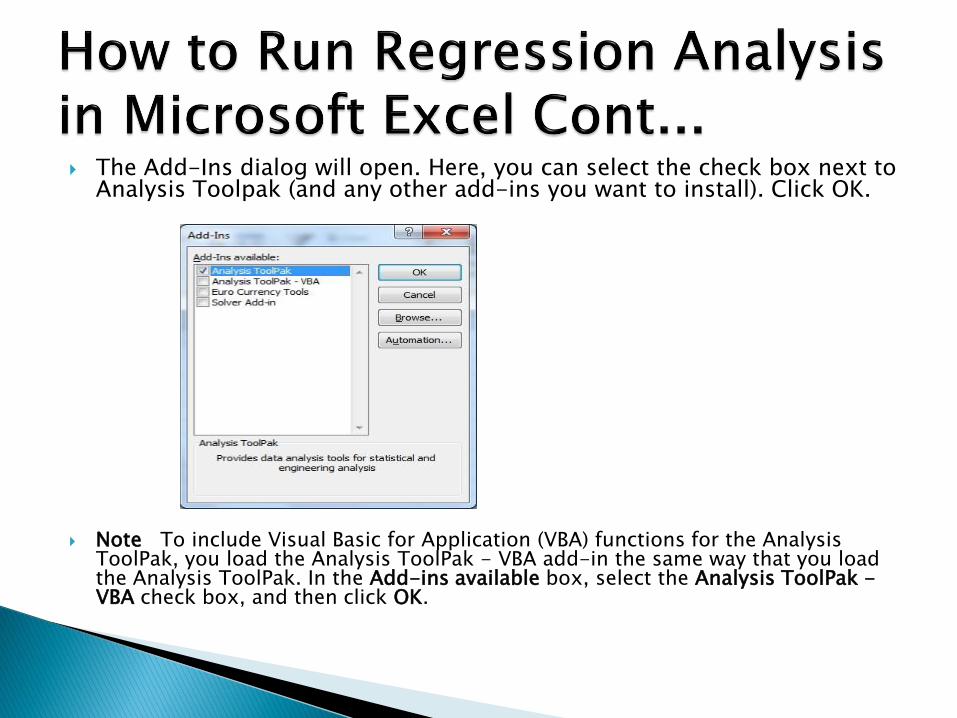
The Add-Ins dialog will open. Here, you can select the check box next to Analysis Toolpak (and any other add-ins you want to install). Click OK.
Note To include Visual Basic for Application (VBA) functions for the Analysis ToolPak, you load the Analysis ToolPak - VBA add-in the same way that you load the Analysis ToolPak. In the Add-ins available box, select the Analysis ToolPak -VBA check box, and then click OK.
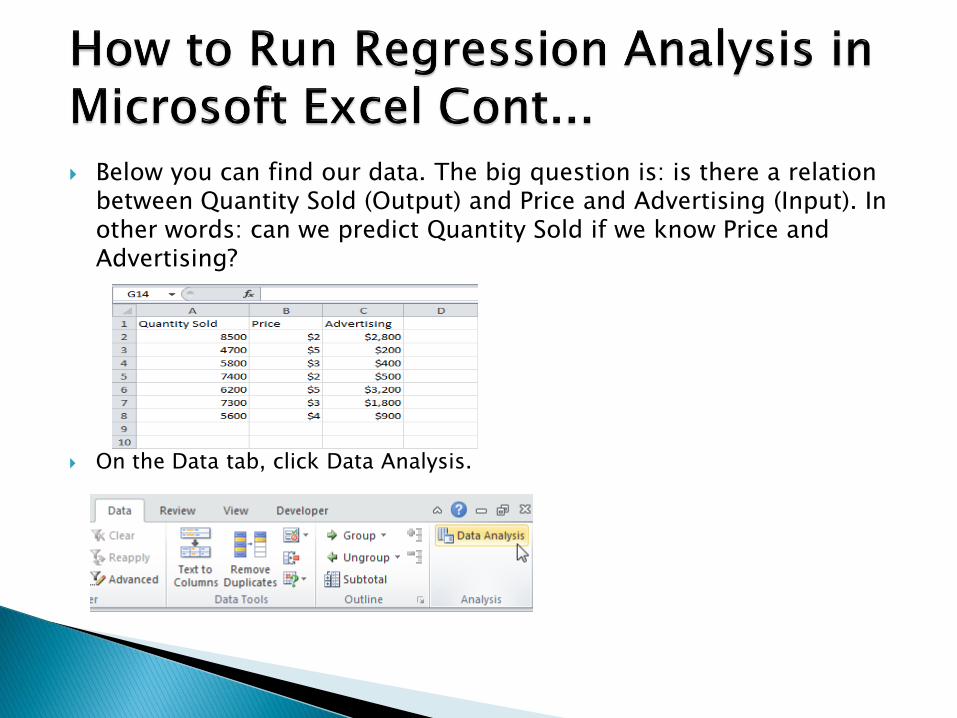
Below you can find our data. The big question is: is there a relation between Quantity Sold (Output) and Price and Advertising (Input). In other words: can we predict Quantity Sold if we know Price and Advertising?
On the Data tab, click Data Analysis.
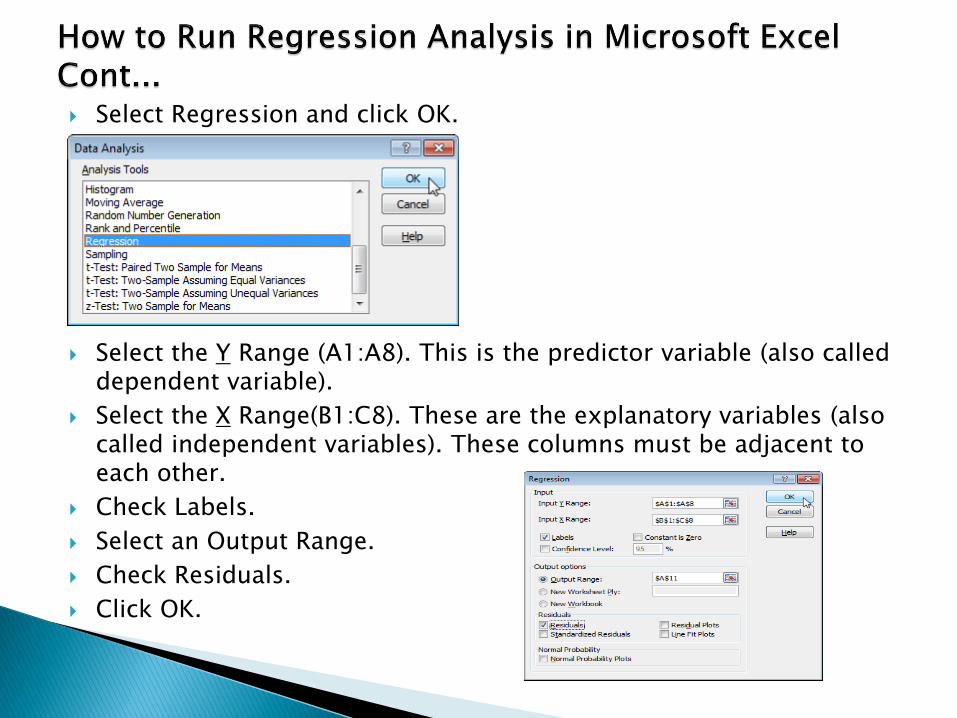
Select Regression and click OK.
Select the Y Range (A1:A8). This is the predictor variable (also called dependent variable).
Select the X Range(B1:C8). These are the explanatory variables (also called independent variables). These columns must be adjacent to each other.
Check Labels.
Select an Output Range.
Check Residuals.
Click OK.
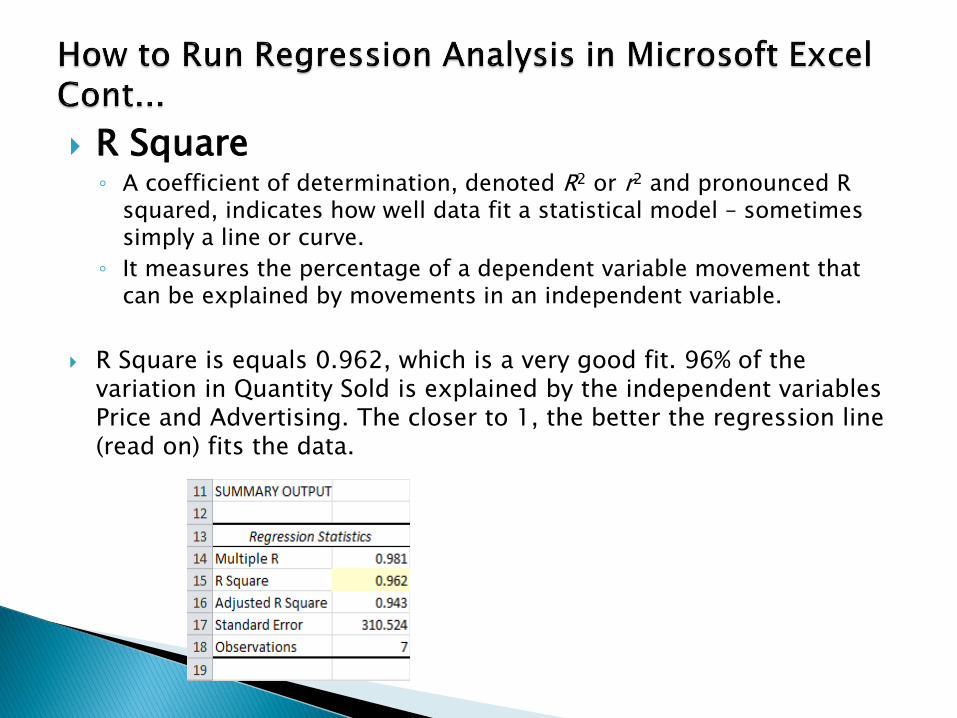
R Square◦ A coefficient of determination, denoted R2 or r2 and pronounced R
squared, indicates how well data fit a statistical model – sometimes simply a line or curve.
◦ It measures the percentage of a dependent variable movement that can be explained by movements in an independent variable.
R Square is equals 0.962, which is a very good fit. 96% of the variation in Quantity Sold is explained by the independent variables Price and Advertising. The closer to 1, the better the regression line (read on) fits the data.
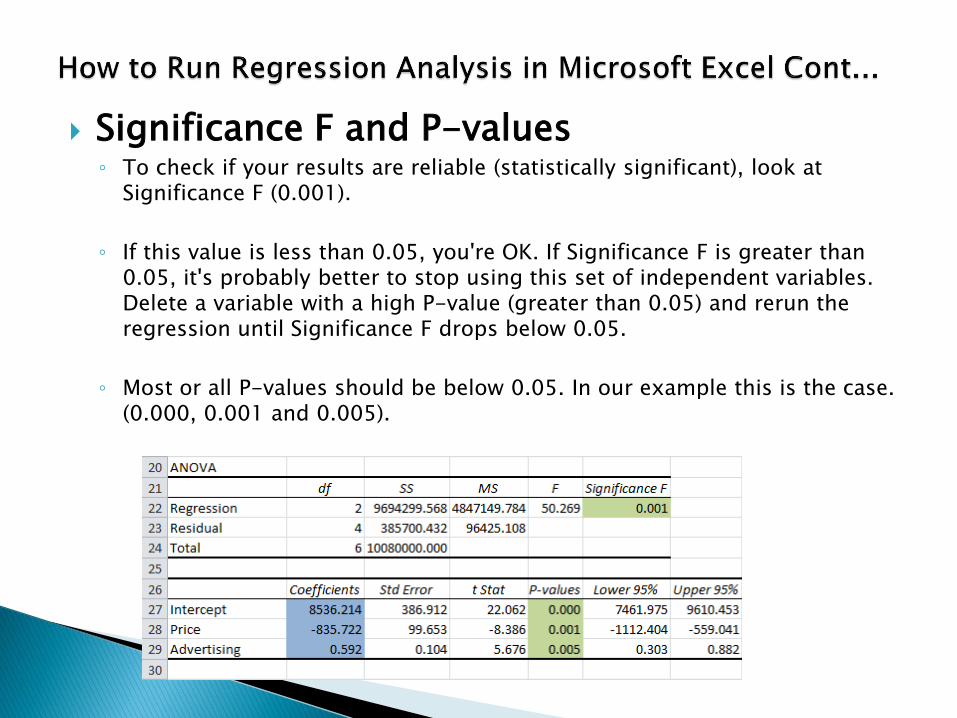
Significance F and P-values◦ To check if your results are reliable (statistically significant), look at
Significance F (0.001).
◦ If this value is less than 0.05, you're OK. If Significance F is greater than 0.05, it's probably better to stop using this set of independent variables. Delete a variable with a high P-value (greater than 0.05) and rerun the regression until Significance F drops below 0.05.
◦ Most or all P-values should be below 0.05. In our example this is the case. (0.000, 0.001 and 0.005).
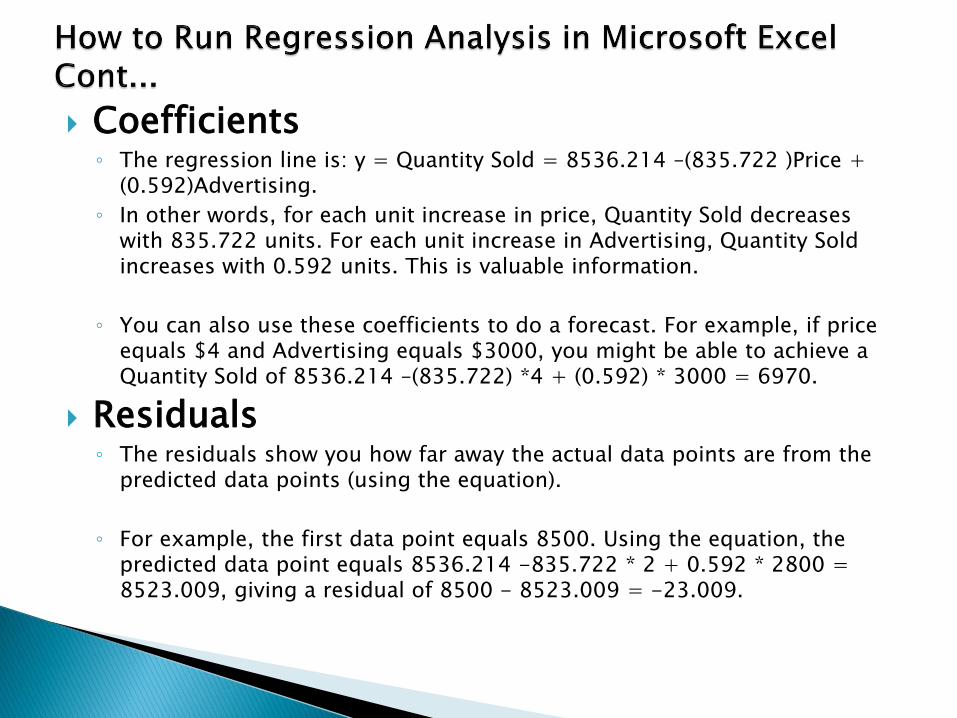
Coefficients◦ The regression line is: y = Quantity Sold = 8536.214 –(835.722 )Price +
(0.592)Advertising.
◦ In other words, for each unit increase in price, Quantity Sold decreases with 835.722 units. For each unit increase in Advertising, Quantity Sold increases with 0.592 units. This is valuable information.
◦ You can also use these coefficients to do a forecast. For example, if price equals $4 and Advertising equals $3000, you might be able to achieve a Quantity Sold of 8536.214 –(835.722) *4 + (0.592) * 3000 = 6970.
Residuals◦ The residuals show you how far away the actual data points are from the
predicted data points (using the equation).
◦ For example, the first data point equals 8500. Using the equation, the predicted data point equals 8536.214 -835.722 * 2 + 0.592 * 2800 = 8523.009, giving a residual of 8500 - 8523.009 = -23.009.
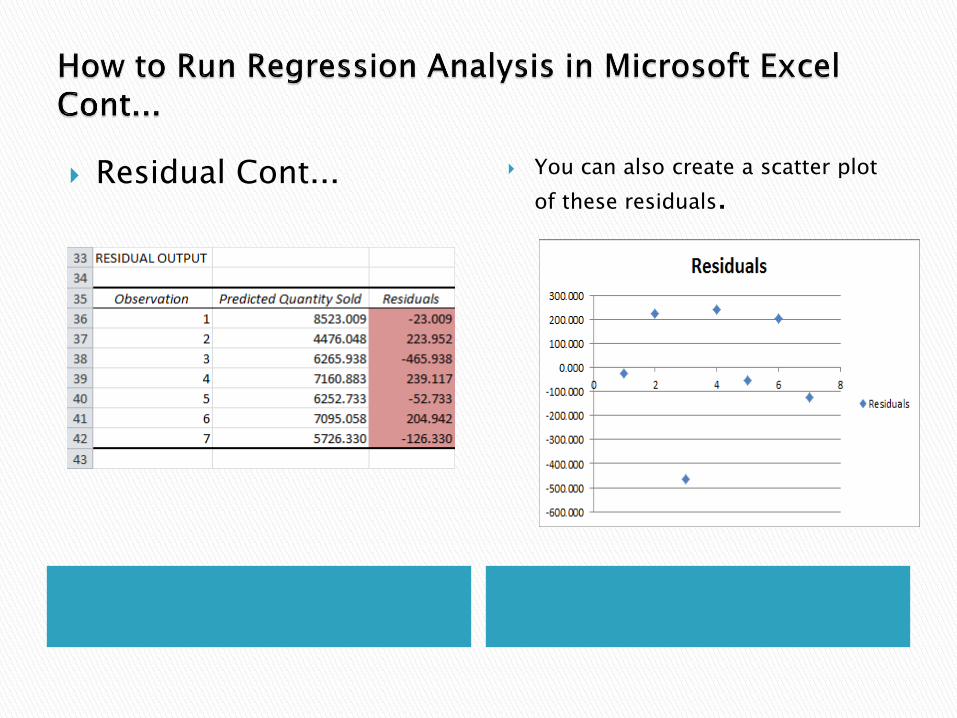
You can also create a scatter plot
of these residuals. Residual Cont...

Thank you