defining a national energy efficiency strategy stage 1 report
TRANSCRIPT
DEFINING A
NATIONAL ENERGY
EFFICIENCY STRATEGY
Stage 1 Report
Prepared by McLennan Magasanik Associates Pty Ltd
July 2008

DEFINING A NATIONAL ENERGY EFFICIENCY STRATEGY – STAGE 1 REPORT
_____________________________________________________________________________________________
PAGE 3 STAGE 1 REPORT
This report has been commissioned as part of a two stage research project for The Climate Institute. Stage 2 will involve more detailed economic modelling. The views contained in this report are the views of Mclennan Magasanik Associates and do not necessarily reflect the views of The Climate Institute.
ISBN: 978-1-921611-20-9

DEFINING A NATIONAL ENERGY EFFICIENCY STRATEGY – STAGE 1 REPORT
STAGE 1 REPORT PAGE 4
TABLE OF CONTENTS
EXECUTIVE SUMMARY_____________________________________________________ 5
1. INTRODUCTION______________________________________________________ 8
2. AUSTRALIA’S ENERGY USE PRACTICES COMPARED TO OTHER OECD
COUNTRIES ________________________________________________________ 10
2.1 Manufacturing Sector ____________________________________________ 13
2.2 Transportation Sector ____________________________________________ 17
2.3 Commercial Services Sector_______________________________________ 23
2.4 Residential Sector_______________________________________________ 24
3. POTENTIAL FOR ENERGY EFFICIENCY IMPROVEMENTS _________________ 28
3.1 Global Potential for Energy Efficiency Improvements ___________________ 28
3.2 Potential for Energy Efficiency Improvements in Australia________________ 29
4. BARRIERS TO THE ADOPTION OF ENERGY EFFICIENT PRACTICES ________ 32
4.1 The Effect Of The Introduction Of An Emissions Trading Scheme _________ 32
4.2 Information Failures _____________________________________________ 34
4.3 Transactions Costs ______________________________________________ 35
4.4 Incentive Misalignments __________________________________________ 36
4.5 Public Good Aspects of Information _________________________________ 37
4.6 Public Good Aspects of RD&D _____________________________________ 38
4.7 Capital Constraints ______________________________________________ 38
4.8 Behavioural and Organisational Barriers _____________________________ 39
5. NON-GREENHOUSE GAS ABATEMENT RELATED BENEFITS OF ENERGY
EFFICIENCY________________________________________________________ 41
5.1 Other Environmental and Health Benefits ____________________________ 41
5.2 Increased National Competitiveness ________________________________ 41
5.3 Improved Energy Security_________________________________________ 41
5.4 Infrastructure Savings and Ability to Take Better Advantage of New
Technologies___________________________________________________ 42
5.5 Ameliorating the Regressive Impacts of Higher Energy Prices Caused by an
Emission Trading Scheme ________________________________________ 42
6. IDENTIFYING EFFICIENT AND EFFECTIVE INTERVENTIONS _______________ 43
6.1 Information Related Interventions___________________________________ 48
6.2 Regulatory Measures ____________________________________________ 50
6.3 Financial Interventions ___________________________________________ 57
7. REFERENCES _________________________________________________________ 59
DEFINING A NATIONAL ENERGY EFFICIENCY STRATEGY – STAGE 1 REPORT
_____________________________________________________________________________________________
PAGE 5 STAGE 1 REPORT
EXECUTIVE SUMMARY
This report is Stage 1 of a study undertaken for the Climate Institute to inform the current
energy efficiency policy debate in Australia. This debate has been modified by the Australian
Government’s recent decision to introduce an emissions trading scheme in Australia. Prior to
this, a major justification for energy efficiency policy had been its abatement effect on total
greenhouse gas emissions. However, with the introduction of a comprehensive emissions
trading scheme, including an emission cap, energy efficiency policy ceases to be a means of
reducing total greenhouse gas emissions but rather becomes a tool to reduce the cost of
abatement in the economy. This is because an emissions cap sets the total amount of
emissions not to be exceeded in the economy so that any abatement achieved through
energy efficiency improvements automatically relaxes the constraint on the rest of the
economy. So if energy efficiency policy is deployed it will not affect the overall emissions
under the cap but rather affect the cost of achieving that cap.
In order to gain an understanding of the scope of potential energy efficiency improvements,
the report first compares Australia's energy use practices to those of other OECD countries
taking into account national circumstances. It finds that while energy intensity in Australia is
either below average or average in the commercial and residential sectors, and the freight
transport sector, energy intensity in Australia is higher than average in the passenger
transport and manufacturing sectors. This remains the case for manufacturing even when
energy intensity is adjusted to take into account the high proportion of energy intensive raw
material production in Australian manufacturing. This data suggests that there is significant
scope for Australia to achieve energy efficiency improvements in the manufacturing and
passenger transport sectors.
An analysis of energy efficiency opportunities across all sectors in Australia shows, however,
that even in the commercial and residential sector where Australia's energy intensity is
average within the OECD, significant energy efficiency improvements could be made. While
estimates vary widely, various studies have found that energy efficiency improvements of
between 13 and 73% in the residential sector, 10 and 70% in the commercial sector and 6
and 46 % in the manufacturing sector are available (see Table 3.2).
The existence of energy efficiency opportunities as such do not directly translate into a case
for government intervention. Intervention is only worth while if policies directed at exploiting
such opportunities have net benefits and are therefore cost-effective. We find that there is
significant evidence that energy efficiency opportunities that are cost-effective in the sense of
reducing the overall cost of greenhouse gas emission abatement (socially cost-effective
measures) are not currently undertaken because of a range of market failures and other
barriers to the development and adoption of energy efficiency opportunities. These market
failures and barriers include information failures, transaction costs, incentive misalignments,
public good aspects of information and RD&D, capital constraints and behavioural and

DEFINING A NATIONAL ENERGY EFFICIENCY STRATEGY – STAGE 1 REPORT
STAGE 1 REPORT PAGE 6
organisational barriers. They give rise to a strong prima facie case for government
intervention.
These market failures are likely to be particularly pronounced in the period when the economy
is transitioning to higher energy prices as a result of the introduction of a carbon constraint.
Thus, some policy interventions that are not likely to be efficient and effective in the long run
can be efficient and effective over the coming years. In other words, an assessment of the
efficiency and effectiveness of energy efficiency policy interventions that takes into account
transition issues, especially those related to behavioural aspects of market participants’
decision making, justifies stronger and more ‘coercive’ interventions than static equilibrium
assessments would.
Improved energy efficiency can also have additional positive effects by:
• reducing pollutants other than greenhouse gases that arise from energy production
and/or use;
• increasing energy security;
• leading to infrastructure savings as well as deferral of new investments and thus
allowing the deployment of more advanced and less carbon intensive technologies;
• ameliorating the impact that higher energy prices under an emission trading scheme
could otherwise have on low income families and increasing productivity.
That said, government interventions can also bring with them significant costs and create their
own distortions. Each policy intervention needs to be considered carefully, weighing up the
negative and positive effects. Overall this report concludes that, when implemented alongside
emissions trading:
• Well designed information based interventions – including mandatory labelling and
the dissemination of best practice energy efficiency information – provide the
foundation of an efficient and effective policy response to the market failures and
other barriers preventing the uptake of cost-effective energy efficiency policies.
• The adoption of mandatory economy wide or sectoral energy efficiency targets is
not likely be an efficient and effective policy intervention so long as the emissions
reduction target set through an ETS adequately prices the greenhouse gas
emissions externalities. This assessment applies to mandatory targets and is not
meant to extend to campaigns that promote aspirational energy efficiency targets
and/or highlight Australia’s energy efficiency performance over time and relative to
other countries.
• Mandatory performance standards – including in the building and appliance
sectors – are likely to provide a useful contribution to the energy efficiency policy

DEFINING A NATIONAL ENERGY EFFICIENCY STRATEGY – STAGE 1 REPORT
_____________________________________________________________________________________________
PAGE 7 STAGE 1 REPORT
mix in the transition period to, and the early years of, an emissions trading scheme.
Once market participants have adjusted to the new relative price environment, the
role of mandatory energy performance standards should be limited to (1) areas
where it is not possible to provide information about energy efficiency in a format
that is readily comprehensible; and (2) where particular technologies are easy to
implement and can cost effectively save energy but are difficult to incorporate into
information based interventions.
• A review of existing regulations and government interventions to remove
unnecessary barriers to energy efficiency improvements and perverse incentives
with respect to energy use should be a high priority.
• The introduction of policies to further the purchase of energy efficiency
improvements by low income households (including smart financing and some well
targeted rebates), subsidies for energy efficiency RD&D and public sector
investment in energy efficiency improvements are likely reduce the net cost of
emissions abatement in the economy and thus to be efficient and effective policy
interventions.

DEFINING A NATIONAL ENERGY EFFICIENCY STRATEGY – STAGE 1 REPORT
STAGE 1 REPORT PAGE 8
1. INTRODUCTION
This report is Stage 1 of a study undertaken for the Climate Institute to inform the current
energy efficiency policy debate in Australia. Stage 2 will quantitatively assess the net benefits
of selected energy efficiency policy interventions for Australia.
Improving energy efficiency was first given prominence in industrialised countries following
the oil crises of 1973 and 1980 when rapidly increasing fuel prices gave rise to concerns
about long-term energy security. The International Energy Agency (IEA) estimated that the
energy consumption would have been 49% higher in OECD countries without the efficiency
savings between the first oil crisis of 1973 and 1998.1
Low energy prices during the mid-1980s led to a reduction in interest in energy efficiency.
However, a recent tightening in the global energy supply/demand balance due to rapid
demand growth in emerging economies and the lack of investment in energy production has
contributed to a renewed increase in energy prices and the revival of energy security as a
concern.
Furthermore, during the 1990s and early 2000s, policy attention has increasingly been
directed to energy efficiency as a means of reducing greenhouse gas emissions and the
implementation of measures that either mandate or encourage increased energy efficiency
have experienced a resurgence in many countries, including Australia.
Section 2 of this report reviews Australian energy use practices in light of this history and
compares it to those of selected OECD countries. This section covers all major sectors
including transport. However, transport energy efficiency measures are otherwise beyond the
scope of this study. Section 2 forms the background to an identification of the potential for
energy efficiency improvements in Australia. This analysis is set out in Section 3.
The recent decision by the Australian government to introduce an emissions trading scheme
in Australia has changed the policy debate with respect to energy efficiency. Prior to this
decision a major justification for energy efficiency policy had been its abatement effect on
total greenhouse gas emissions. However, the introduction of a comprehensive emissions
trading scheme, including an emission cap, achieves that same goal and thus has led to calls
for a re-evaluation of the ongoing need for, and nature of, energy efficiency policies.
1 IEA, Energy Policies of IEA Countries, 2006 Review, pg 24
DEFINING A NATIONAL ENERGY EFFICIENCY STRATEGY – STAGE 1 REPORT
_____________________________________________________________________________________________
PAGE 9 STAGE 1 REPORT
Indeed, under a cap and trade system, the role of energy efficiency policy as a means of
reducing total greenhouse gas emissions is reduced to indirect effects on setting the
emissions cap.2 Its primary aim becomes the reduction of the cost of achieving the emissions
cap by lowering abatement costs.
The potential for energy efficiency policies to reduce the cost of abatement derives from
various market failures and barriers to the development and adoption of energy efficiency
opportunities. These include non-price barriers such as lack of information, information
asymmetries, split incentives (the benefit from undertaking energy efficiency measures does
not flow through to those incurring the cost) and other behavioural factors. These market
failures and barriers to the development and uptake of energy efficiency are discussed in
more detail in Section 4.
Energy efficiency measures may also provide a range of non-greenhouse related benefits
including energy security, reduced air pollution and infrastructure cost savings and thus may
be justified even in the absence of an effect on the cost of greenhouse gas abatement. The
co-benefits of energy efficiency measures are discussed in Section 5.
Finally, Section 6 qualitatively discusses the costs and benefits of selected energy efficiency
policy interventions in light of their likely contributions both to reducing the cost of greenhouse
gas emissions abatement and to achieving other social benefits.
2 Energy efficiency measures indirectly affect the overall emissions constraint set as part of emissions trading
scheme to the extent that: � policy makers take into account the expected cost of any constraint when setting it and that energy
efficiency policies have an impact on the cost of abatement; and � political processes are influenced by the effects of the emissions constraint on sub-sectors or particular
regions of the economy (rather than purely informed by the net economic benefit across all economic sectors and Australia wide) and that energy efficiency
� measures can also affect the overall emissions constraint if they have distributional impacts.
DEFINING A NATIONAL ENERGY EFFICIENCY STRATEGY – STAGE 1 REPORT
STAGE 1 REPORT PAGE 10
2. AUSTRALIA’S ENERGY USE PRACTICES COMPARED TO OTHER OECD COUNTRIES
In Australia energy consumption has averaged an annual growth rate of about 2.5% since the
oil crisis (1973 to 2000/01 figures) with economic growth of about 3% the major factor.
Overall, Australia used 93% more energy in 2000/01 than it did in 1973/74. Without
reductions in energy intensity, however, ABARE estimates that Australia would have used
136% more energy in 2000/01 than in 1973/74.
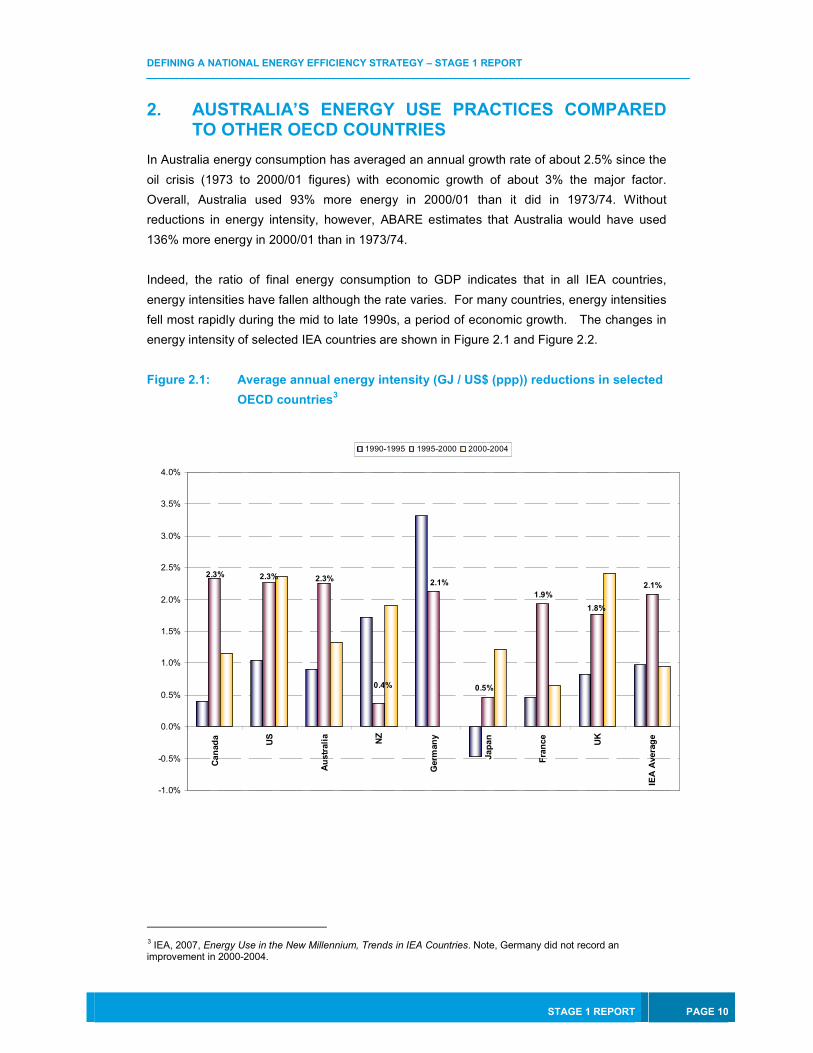
Indeed, the ratio of final energy consumption to GDP indicates that in all IEA countries,
energy intensities have fallen although the rate varies. For many countries, energy intensities
fell most rapidly during the mid to late 1990s, a period of economic growth. The changes in
energy intensity of selected IEA countries are shown in Figure 2.1 and Figure 2.2.
Figure 2.1: Average annual energy intensity (GJ / US$ (ppp)) reductions in selected
OECD countries3
1.9%2.1%
0.5%
1.8%
2.3%2.3%2.1%
0.4%
2.3%
-1.0%
-0.5%
0.0%
0.5%
1.0%
1.5%
2.0%
2.5%
3.0%
3.5%
4.0%
Canada
US
Australia
NZ
Germany
Japan
France
UK
IEA Average
1990-1995 1995-2000 2000-2004
3 IEA, 2007, Energy Use in the New Millennium, Trends in IEA Countries. Note, Germany did not record an improvement in 2000-2004.

DEFINING A NATIONAL ENERGY EFFICIENCY STRATEGY – STAGE 1 REPORT
_____________________________________________________________________________________________
PAGE 11 STAGE 1 REPORT
Figure 2.2: Energy intensity of selected OECD countries4
3
4
5
6
7
8
9
10
11
1990 1991 1992 1993 1994 1995 1996 1997 1998 1999 2000 2001 2002 2003 2004
GJ/U
S$ PPP 2000
Canada US Australia NZ Germany Japan France UK IEA Average
Over the period from 1990 to 2004, energy use in the IEA countries increased by 14%. GDP
during this period grew by 38%. As a result, energy intensity as a proportion of GDP fell by
17%. The United Kingdom had the strongest decline among the countries shown in Figure
2.2. Its energy use per unit of GDP fell about 24% between 1990 and 2004. The US also had
declines greater than 20% over the same period. Most of the other major countries’ intensity
fell by between 15% and 19% including Australia’s intensity which fell by 17%. The exception
was Japan’s energy intensity which reduced by only 4% during this period.
The reduction in intensity between 1990 and 2004 is slower than the reduction in intensity
between 1973 and 1990 as reported by the IEA. The IEA estimates that since 1990, the rate
of improvement in energy efficiency has been about half of what it was in the previous period.
The reason provided was that the oil price shocks in the 1970s and the resulting energy
policies controlled energy demand considerably more than the energy efficiency and climate
policies implemented since 1990. In the earlier period energy intensity fell partly because the
rate at which energy intensive goods, building area and travel activity grew was less than
GDP5. Since 1990 however, travel activity grew at a significantly higher rate than GDP. The
Boston Consulting Group estimates that between 1995 and 2000, international air passenger
travel has grown at 1.7 times the rate of GDP growth. With the advent of low cost carriers,
the growth rate has increased. The International Air Transport Association (IATA) reports that
in 2004, that passenger growth was around 15% and cargo growth was about 8%.6
4 IEA, 2007, Energy Use in the New Millennium, Trends in IEA Countries 5 IEA, 2004, Oil, Crises & Climate Challenges, 30 Years of Energy Use in IEA Countries 6 IATA, 2008, Fact Sheet- Industry Statistics

DEFINING A NATIONAL ENERGY EFFICIENCY STRATEGY – STAGE 1 REPORT
STAGE 1 REPORT PAGE 12
While energy intensity may have fallen for most IEA countries, not all of this is due to
improvements in energy efficiency. Changes to the structure of the economy also affect the
energy intensity. As the economy shifts from more energy intensive sectors to less energy
intensive sectors, the aggregate energy intensity of the country may fall even though the
sectorial energy intensity may not have changed by much. While Australia’s aggregate
energy intensity may have fallen by 17% between 1990 and 2004, the smaller reductions in
the sectorial intensities indicate that much of the reduction in the aggregate intensity is the
result of changes in the structure of the economy rather than energy efficiency improvements.
The Climate Institute, using methodologies consistent with the IEA, found that between 1990
and 2004, Australia’s energy efficiency improvements averaged around 0.3% pa compared
with the IEA average of 0.9% pa (Figure 2.3). The sectorial energy intensities are discussed
further below.
Figure 2.3: Annual average technical energy efficiency improvements in OECD
countries (1990-2004)7
0.2%
1.4%
0.6%
0.0%
0.4%
1.2%
0.5%
1.0%
0.4%
0.9%
1.5%
-0.3%
0.3%0.3%
0.7%
0.9%
-0.4%
-0.2%
0.0%
0.2%
0.4%
0.6%
0.8%
1.0%
1.2%
1.4%
1.6%
Australia
IEA-14
Austria
Canada
Denmark
Finland
France
Germ
any
Italy
Japan
The Netherlands
New Zealand
Norw
ay
Sweden
UK
USA
Annual Improvement (%)
ABARE estimates that three sectors account for 80% of the energy consumed in Australia8:
• conversion of energy to its final form (35%),
• manufacturing (18%), and
• transport and storage (27%).
7 Climate Institute 2007b, National Energy Efficiency Target, Policy Brief, The Climate Institute, Sydney, Australia.
8 Tedesco L and Thorpe S, 2003, Trends in Australian Energy Intensity, 1973-74 to 2000-01, ABARE

DEFINING A NATIONAL ENERGY EFFICIENCY STRATEGY – STAGE 1 REPORT
_____________________________________________________________________________________________
PAGE 13 STAGE 1 REPORT
The conversion sector comprises mainly electricity generation, electricity and gas
transmission and distribution, and petroleum refining. More energy is used to convert fuels
into a final form of energy suitable for consumption than for any other purpose within
Australia. Most of this is used in the generation, transmission and distribution of electricity.
Transport is the second largest energy consuming sector. The consumption of liquid fuels
dominates in this sector although the quantity of gas use is increasing albeit off a very low
base. Manufacturing is the third largest energy consuming sector with the consumption of
gas and electricity increasing while the consumption of liquid fuels is declining.
While residential consumption of energy has been rising, its share of total energy
consumption fell from 8.8% in 1973/74 to 7.9% in 2001/01. As with manufacturing,
substitution of liquid fuels by gas and electricity was the major trend in the residential sector.
Energy use in other sectors of the economy also increased, in particular in the commercial
sector.
2.1 Manufacturing Sector
The ratio of energy consumption to GDP (energy intensity) is high in the manufacturing sector
in Australia, as a result of a high proportion of the sector producing energy intensive raw
materials. Indeed, the OECD/IEA notes that expansion of these energy intensive industries
since 1974 has been a primary contributor to growth in energy demand.9
Between 1990 and 2004, average IEA manufacturing energy use per unit of value added has
declined by 23%.10 This is shown in Figure 2.4. The rate of manufacturing energy use in the
US declined by 36% while in Canada, the decline was 27%. In contrast, the rate of energy
used in manufacturing in Australia declined by only 9% and in the UK the reduction was 2%.
9 IEA, 2007, Energy Use in the New Millennium, Trends in IEA Countries 10 IEA, 2007, Energy Use in the New Millennium, Trends in IEA Countries

DEFINING A NATIONAL ENERGY EFFICIENCY STRATEGY – STAGE 1 REPORT
STAGE 1 REPORT PAGE 14
Figure 2.4: Manufacturing energy use of selected OECD countries
0
5
10
15
20
25
Canada
US
Australia NZ
Germ
any
Japan
France
UK
IEA Average
MJ/US$PPP2000
1990 2004
Differences between energy intensity in the manufacturing sector in Australia and other IEA
countries is primarily a result of the bias towards energy intensive raw material production in
the Australian manufacturing sector, rather than a result of Australian manufacturers using
energy in a particularly inefficient way. In some IEA countries including Australia and Canada
where the production of raw materials is a significant component of the economy, energy
intensity is significantly higher than other countries like France and Japan where raw material
production accounts for a much smaller proportion of the economy.
To account for this structural difference, the IEA estimated energy intensity in the
manufacturing sector for member countries as if all had a common structure. Figure 2.5
shows the results of this adjustment for selected IEA countries.

DEFINING A NATIONAL ENERGY EFFICIENCY STRATEGY – STAGE 1 REPORT
_____________________________________________________________________________________________
PAGE 15 STAGE 1 REPORT
Figure 2.5: Manufacturing energy intensity of selected OECD countries
0
2
4
6
8
10
12
14
16
18
20
Canada
US
Australia NZ
Germ
any
Japan
France
UK
IEA Average
MJ/US$PPP2000
2004 Actual Intensity 2004 Common Structure Intensity
Based on this adjustment, Australia’s very high energy intensity can largely be explained by
the structure of its manufacturing sector. The very high share of energy intensive industries in
Australia distorts the energy intensity and when this is accounted for, Australia’s energy
intensity falls significantly. A similar result is seen in Canada’s energy intensity although not
quite as dramatic. Nonetheless, energy intensity in the manufacturing sector in Australia
remains well above than the IEA average, which suggests that energy efficiency opportunities
in the sector exist.
2.1.1 The Aluminium Sector
One example of an area where energy efficiency opportunities exists is the manufacture of
aluminium. The aluminium sector is a major component of Australia’s manufacturing industry.
This sector is the single largest industrial consumer of electricity in Australia, accounting for
about 15% of industrial consumption.11 Average energy consumption in Australian plants is
11 GJ per tonne of alumina produced. The Department of Industry, Science and Resources
believes that energy consumption in the production of alumina could be reduced to 9.5 GJ/t
11 Department of Industry Science and Resources, 2000, Energy Efficiency Best Practices in the Australian
Aluminium Industry, Canberra

DEFINING A NATIONAL ENERGY EFFICIENCY STRATEGY – STAGE 1 REPORT
STAGE 1 REPORT PAGE 16
through better heat integration and improved combined heat and power (CHP) systems. The
global average was 11.4 GJ/t in 2004, with a range of 10 to 12.6 GJ/tonne. This is shown in
Table 2.1.
More recently some Alumina refineries in Australia have moved to using more efficient natural
gas fired generation systems, indeed the most recently built refinery at Yarwun in Central
Queensland has a claimed energy efficiency of 9 GJ/t alumina.12
Table 2.1: Regional average energy use in alumina production, 2004
GJ/tonne Alumina
Africa and South Asia 12.6 North America 10.4 Latin America 10 East Asia and Oceania 11.9 Europe 12.4 Weighted Average 11.4
Source: World Aluminium, 2006, Electrical Power Used in Primary Aluminium Production.
Electrolysis is the most energy intensive step in the production of aluminium. The main
producers of aluminium are located in China, North America, Latin America, Western Europe,
Russia and Australia. The aluminium industry is an important part of the economy in other
countries with low-cost electricity, such as Norway, Iceland, Canada and Russia. In recent
years, new aluminium smelters have been built in Africa, taking advantage of the availability
of low cost hydro-electricity.
Figure 2.6 shows the energy consumption for the smelting of aluminium in various regions.
As technology improves, energy consumption has been declining in most regions as new
capacity is constructed and old capacity is retrofitted with newer technology. Africa has the
most energy efficient aluminium smelters in the world followed by Oceania (mainly Australia).
This reflects the relatively young age of the smelters in Africa and newer smelters in Australia.
12 Rio Tinto Aluminium 2007, 2006 Gladston Sustainable Development report.

DEFINING A NATIONAL ENERGY EFFICIENCY STRATEGY – STAGE 1 REPORT
_____________________________________________________________________________________________
PAGE 17 STAGE 1 REPORT
Figure 2.6: Regional aluminium smelting energy consumption
13.5
14.5
15.5
16.5
17.5
18.5
1980 1985 1990 1995 2000 2005
MWh/tonne Primary Aluminium
North America Europe Latin American Asia Ocenia Africa World Average
Source: International Aluminium Institute, 2003, Life Cycle Assessment of Aluminium: Inventory Data for the Worldwide Primary Aluminium Industry, London
2.2 Transportation Sector
The trend of energy use for transportation may also be explained by certain country
characteristics. While a commitment to public transport played a role, in some northern EU
countries including Finland, Germany and the UK, the decline in transport energy use also
reflects the limited growth in vehicle ownership, limited increases in distance travelled and
improved fleet efficiency. Such mitigating factors are less pronounced in Australia, indeed,
urban sprawl and the large distances over which freight must be carried exacerbate the lack
of good public transport infrastructure in Australia
2.2.1 Passenger Travel
Passenger travel distances have been increasing in all IEA countries between 1990 and
2004. Countries with a high population density like Japan have significantly lower levels of
travel per capita compared with low density countries like Australia and Canada. These lower
population density countries experience greater travel distances in both car passenger travel
as well as air travel. Although the United States does not have as low a population density as
Australia or Canada, it has the highest level of travel per capita. This reflects the high levels
of car ownership and utilisation in the United States. The distance travel per capita for
selected countries is shown in Figure 2.7.
Some of the increase in travel distances may be explained by the increase in per capita
income. As income increases, people demand quicker and more flexible options for travelling.

DEFINING A NATIONAL ENERGY EFFICIENCY STRATEGY – STAGE 1 REPORT
STAGE 1 REPORT PAGE 18
As a result, there is decreased usage of buses and trains and an increase in the use of cars
and aeroplanes. People also travel further as income rises. In most OECD countries
including Australia, car travel accounts for the majority of distance travelled. In 1990, car
travel accounted for over 85% of all travel. The rate fell to just under 80% in 2004 as cheaper
air travel became available. This pattern was also seen in Canada (from 75% to 71%). In
Japan however, car travel made up only 52% of all travel in 1990, although rising to 57% in
2004. The distance travelled by rail in Japan was significantly greater than in the other
countries with over a third of all travel in 1990 and 29% in 2004. The strength of rail travel is
due to the density of Japan and the highly developed and integrated rail system.
Nevertheless, as other modes of transportation become more popular, there has been a
reduction in the rail’s share of passenger transport given the lack of further growth
opportunities in Japan’s mature rail system. In Australia, rail travel accounts for less than 5%
of all travel and the figure is declining.
Figure 2.7: Passenger travel distance per capita (‘000 km pa)
0
5
10
15
20
25
30
35
1990 1995 2000 2004
'000 km per capita
Canada US Australia NZ Germany
Japan France UK IEA Average
In Europe, public transport (mainly trains and buses) capture a significant share of passenger
transport compared to Australia, Canada and the United States. In these countries, air
passenger shares increased to above 10% in 2004 making air travel second in importance to
cars.
The energy intensity of most modes of transport declined between 1990 and 2004. Air travel
intensity showed the largest reduction of 28%. The energy intensity of air travel decreased
from about 2.6MJ per passenger kilometre in 1990 to about 1.9MJ/km in 2004. This is due to
improvements in the energy efficiency of aircraft engines and the design of larger aircraft
requiring less energy while transporting more passengers. At the same time, the average
load factor increased resulting in greater passenger kilometre travelled with almost no change
in energy use. Energy intensities have not changed as significantly for other modes of

DEFINING A NATIONAL ENERGY EFFICIENCY STRATEGY – STAGE 1 REPORT
_____________________________________________________________________________________________
PAGE 19 STAGE 1 REPORT
transportation. In cars, energy efficiency improved by 4% due to the replacement of old cars
with newer, more energy efficient cars. The IEA estimates that in 1990, the energy intensity
of car travel was about 2.2MJ per passenger kilometre. This declined to about 2.1MJ/km in
2004. This is in large part due to the engine efficiency gains having been offset by people
purchasing heavier and more powerful vehicles.
While rail and bus transportation are relatively efficient in comparison with other modes of
transportation, the energy efficiency of rail and bus have remained essentially the same
between 1990 and 2004. While improvements have occurred in the efficiency of bus and
train engines, these efficiencies have been offset by declining load factors. The energy
intensity of bus travel was estimated by the IEA at around 0.8MJ per passenger kilometre and
rail energy intensity around 0.35MJ/km.
Energy intensities of travel in most countries have declined between 1990 and 2004. In
Europe, the widespread use of vehicles equipped with electronic control systems for fuel
management and demand for more efficient cars especially direct injection diesel cars, which
are significantly more efficient than petrol fueld cars, as a result of high fuel prices led to
improvements in the energy intensity of travel despite the increase in the use of cars. In
Canada and the United States, energy intensity fell slightly, by 11% and 8% respectively
between 1990 and 2004 although it remains higher that in most other IEA countries. This is
due largely to the preponderance of car travel relative to bus and rail transport. The only
other country with similar travel energy intensity is Australia which also fell by about 8% over
the same period. The reason is the same as in North America with wide spread use of cars,
long commuting distances, low patronage of bus and rail travel and less substitution to more
fuel efficient vehicles. Japan’s travel energy intensity while still lower than the IEA average is
the only one that experienced a significant increase. This is a result of congestion given the
high population and car density.
The Intergovernmental Panel on Climate Change (IPCC) found that low transport fuel
economy is correlated to the presence of low fuel prices13. Regions with low fuel prices like
the USA, Canada and Australia have lower transport fuel efficiency than regions like Japan
and the European countries with higher fuel prices. As most of the differences in fuel pricing
arise from taxes, regions with higher transport fuel taxes have higher fuel efficiencies. The
IPCC found that fuel taxes are about 8 times higher in the UK than in the USA. As a result of
these taxes, fuel prices are about three times higher in the UK than the USA. UK vehicles are
about twice as fuel-efficient and distance travelled is about 20% lower. This results in
13 Ribeiro, Kobayashi, Beuthe, et al. (2007), Transport and its infrastructure, in Climate Change 2007: Mitigation. Contribution of Working Group III to the Fourth Assessment Report of the Intergovernmental Panel on Climate
Change [Metz, Davidson, Bosch, et al. (eds)], Cambridge University Press, Cambridge, United Kingdom and New
York, NY, USA.

DEFINING A NATIONAL ENERGY EFFICIENCY STRATEGY – STAGE 1 REPORT
STAGE 1 REPORT PAGE 20
significantly lower passenger travel energy intensity and, as noted by the IPCC WG III, in
lower than average per capita fuel expenditures.14
The relative travel energy intensities of selected countries are shown in
Figure 2.8.
Figure 2.8: Passenger travel energy intensity
1.2
1.4
1.6
1.8
2
2.2
2.4
2.6
1990 1991 1992 1993 1994 1995 1996 1997 1998 1999 2000 2001 2002 2003 2004
MJ/km
Canada US Australia NZ Germany Japan France UK IEA Average
A number of countries have fuel efficiency standards. These include the United, States,
Japan, Canada, China, Taiwan and South Korea. While it does not have an explicit fuel
efficiency standard, the European Union has set CO2 emission standards.
The United States require each manufacturer to meet specified fleet average fuel economy
levels. Cars and light trucks have different standards. These standards require that the
average fuel efficiency for cars must exceed 27.5 mpg, and the light truck average must
exceed 20.7 mpg. Trucks under 8500 pounds must average 22.5 mpg in 2008 improving to
23.1 mpg in 2009 and 23.5 mpg in 2010. However, a number of car manufacturers choose to
pay penalties rather than comply with the regulations.
The 2007, Energy Independence and Security Act in the US requires automotive
manufacturers to improve fuel efficiency to 35 mpg by the year 2020 for all passenger cars
and light trucks.
14 Ibid.

DEFINING A NATIONAL ENERGY EFFICIENCY STRATEGY – STAGE 1 REPORT
_____________________________________________________________________________________________
PAGE 21 STAGE 1 REPORT
California separately imposes a GHG emission standard requires manufacturers to meet fleet
average GHG targets.
While Canada's automotive industry has agreed to follow the U.S. standards, the Canadian
government has announced its intention to improve the fuel efficiency of passenger vehicles
by 25 percent by 2010. Currently the standard that applied to passenger cars is 8.6L/100 km
and 10.6L/100 km for light trucks. Transport Canada15 has estimated that in 2007 the new
passenger car fleet had achieved an average fuel efficiency of 7L/100 km and the new light
truck fleet average fuel consumption was 10.4 L/100 km.
In the European Union, the automotive industry agreed in 1998 with the government to reach
an overall fleet CO2 emission level of 140 g CO2/km by 2008 with a view to lowering this
emission level to 120g CO2/km by 2012. The 2008 target represents a 25% reduction from
the 1995 level of 186 g/km and is equivalent to a fuel efficiency standard of 5.8 L/100 km for
petrol engines and 5.25 L/100 km for diesel engines. In February 2007, the European
Commission acknowledged that the voluntary agreement has failed and that legally-binding
measures and limits would be introduced.16
In Australia, the industry has signed a voluntary agreement17 with the government, for new
petrol fuelled passenger cars to reach an overall fleet average fuel consumption of 6.8 L/100
km by 2010. 18
In Japan and China, fuel economy standards are based on a weight classification system
where vehicles must comply with the standard for their weight class. Similarly, the fuel
economy standards in Taiwan and South Korea are based on an engine size classification
system.
2.2.2 Freight Transport
Beside passenger travel, transportation of freight is another important energy consuming
activity in the transportation sector. Freight transport covers the haulage of goods by trucks,
rail and sea. Between 1990 and 2004, the energy efficiency of freight transport in IEA
countries improved by 0.6% pa. However, given the increase in the volume of goods
transported (by 32% in IEA countries) and the increased use of trucking, freight transport
energy use increased by 25% over the same period. As a result, the energy intensity has
fallen slightly.
15 http://www.tc.gc.ca/programs/environment/fuelpgm/cafcsub.htm 16 http://europa.eu/rapid/pressReleasesAction.do?reference=IP/07/155 17 http://www.fcai.com.au/media/2003/04/00000012.html 18 The impact of this volunatry measure is however likely to be limited as historically (similar agreements have been
made since 1978), it has been business as usual in the new car industry.

DEFINING A NATIONAL ENERGY EFFICIENCY STRATEGY – STAGE 1 REPORT
STAGE 1 REPORT PAGE 22
Trucking’s share of total freight transport energy consumption was 82% in 2004. While rail
freight energy consumption also increased between 1990 and 2004, its share of energy use
was only 6% in 2004. Oil dominates freight transportation supplying 99% of the energy. The
energy intensity of trucking is significantly higher than other modes of transport. In Australia,
the IEA estimates that the energy intensity of freight by trucks was about 2MJ per tonne
kilometre. It is comparable to that experienced in the United States (2.1MJ/tonne-km) and
below Canada’s estimated 3.3 MJ/tonne-km. It is also below the average IEA truck freight
energy intensity of about 2.5MJ/tonne-km. However, the energy intensity of trucking is
significantly greater than that of rail and shipping which in Australia has an intensity of about
0.2 MJ/tonne-km.19
Activity in freight haulage is strongly linked with the movement of raw material, intermediary
products and final consumer goods. There is a strong correlation between freight transport
activity and GDP. Australia and Canada experienced the largest increase in total freight
tonne-kilometres per capita between 1990 and 2004. While in Canada, the increase was
largely truck led, in Australia rail freight haulage increased more rapidly than other modes of
transport due largely to increased coal and iron ore shipments.
Australia has relatively low energy intensity for freight transport. Countries with higher
population densities like Denmark and Japan have higher energy intensities due to the fact
that a larger proportion of freight is transported using trucks as a result of the shorter haul
required with little long haul rail freight activity. Hilly countries like Greece, Norway and New
Zealand also tend to have higher intensities due to the high proportion of short trips and less
bulk per trip. Countries with the lowest intensities including Australia have high shares of rail
freight transport. The energy intensities of selected countries are shown in Figure 2.9.
19 IEA, 2007, Energy Use in the New Millennium, Trends in IEA Countries

DEFINING A NATIONAL ENERGY EFFICIENCY STRATEGY – STAGE 1 REPORT
_____________________________________________________________________________________________
PAGE 23 STAGE 1 REPORT
Figure 2.9: Freight transport energy intensity
0.5
1
1.5
2
2.5
3
3.5
4
4.5
5
5.5
1990 1991 1992 1993 1994 1995 1996 1997 1998 1999 2000 2001 2002 2003 2004
MJ/km
Greece Denmark Norway UK France Japan
NZ Germany Canada US Australia IEA Average
2.3 Commercial Services Sector
The commercial services sector in IEA countries has had energy efficiency improvements of
1.1% per year between 1990 and 2004. Despite this, energy use in this sector grew by 26%
over this period, largely as a result of a 50% increase in electricity use. Part of the
explanation for this rise is that the services sector grew by 45% over the same period. Indeed,
the IEA estimates that the services sector’s (including wholesale, retail, financial and other
business services) share of economic activity increased from 68% in 1990 to 71% in 2004. 20
Another part of the explanation is the increased use electrical equipment such as air
conditioning.
Improvements in energy efficiency have resulted in energy use growing at a lesser pace than
economic activity. While economic activity is a major driver for energy use in this sector, the
quality of building stock is another important driver. Building stock changes slowly and has
important implications for some end uses like space heating and lighting. Newer buildings are
more likely to have more efficient heating and lighting characteristics.
The Canadian service sector has the highest energy intensity reflecting the colder climate
which requires greater space heating. In contrast, Australia has one of the lowest service
sector intensities given its generally milder climate. However, the reduction in energy
intensity in this sector in Australia between 1990 and 2004 was only 6%. In contrast,
20 IEA, 2007, Energy Use in the New Millennium, Trends in IEA Countries

DEFINING A NATIONAL ENERGY EFFICIENCY STRATEGY – STAGE 1 REPORT
STAGE 1 REPORT PAGE 24
Germany achieved a reduction of energy intensity in the commercial services sector of 43%
and in the UK, the reduction was 23%. The IEA average reduction over this period was about
19%. Figure 2.10 shows the commercial services sector’s energy improvements for selected
countries between 1990 and 2004.
Figure 2.10: Service sector energy intensity improvements 1990 - 2004
-10.0%
0.0%
10.0%
20.0%
30.0%
40.0%
50.0%
Canada US Australia NZ Germany Japan France UK IEA
Average
2.4 Residential Sector
Energy used in the residential sector includes space and water heating, cooking, lighting and
appliance use in houses and apartments. The IEA estimates that between 1994 and 2004,
after correcting for annual climate variations, overall energy use increased by 14% driven by a
10% rise in population and the rapid increase in electricity use for household appliances. The
increase in appliances use overwhelms the 0.7% pa improvement in energy efficiency
resulting in a 4% increase in per capita energy consumption in households.
Space heating is the most important energy use in the residential sector. Corrected for
annual variations in the weather, energy use for space heating has increased by 5% since
1990, although as a share of household energy use, space heating’s share fell from 59% to
54%. This reflects a reduction in the per capita energy consumption for space heating
resulting from improved appliance efficiency as well as improved thermal performance of
dwellings. The most rapid growth in household demand is from the growth in appliances.
This increased by 50% from 1990 to 2004 and is the second most energy consuming
category in household energy consumption exceeding the amount of energy required for
water heating. The IEA estimates that appliance energy accounts for 20% of all energy use in
households compared to 17% for water heating and 4% to 5% each for lighting and cooking.

DEFINING A NATIONAL ENERGY EFFICIENCY STRATEGY – STAGE 1 REPORT
_____________________________________________________________________________________________
PAGE 25 STAGE 1 REPORT
As incomes increase, living spaces also increase as people purchase their own housing and
family sizes fall. Higher incomes also allow people to purchase more energy consuming
equipment including air-conditioning, entertainment and computing equipment.
Electricity and gas account for the majority of fuels used by households. Growth in electricity
consumption has been driven by increases in the use of electrical appliances. Gas
consumption is driven by the need for space heating and in some cases fuel switching from
coal and oil. Between 1994 and 2000, the IEA estimates that the share of electricity
increased from 29% to 34% of energy consumed in households and the share of gas
increased from 37% to 40%. In Australia, natural gas is the main energy source for space
heating, and second to electricity for water heating and cooking. The residential sector also
uses a large quantity of biomass fuel (fuel wood) for space heating. A study by Energy
Strategies for the Clean Energy Future Groups estimates that space heating and cooking
account for 39% of all household energy use in Australia. Table 2.2 shows the estimated
share of residential energy use in Australia.
Table 2.2: Residential energy use
Activity Share of total energy use
Electric appliances incl lighting 29%
Water heating 27%
Cooking 4%
Space heating and cooling 39%
Source: Saddler H, Diesendorf M, Denniss R, March 2004, A Clean Energy Future for Australia, WWF
Residential energy intensity is influenced greatly by climatic conditions as well as behavioural
needs and housing size. Figure 2.11 shows two comparisons of energy intensities based on
per capita residential consumption and energy consumption per floor area for selected
countries. In both cases, Canada’s consumption is highest reflecting the significantly colder
climate. However, in terms of per capita consumption the United States consumption is not
much lower than Canada’s despite a substantially warmer climate. Japan’s per capita
consumption is not significantly different from Australia’s or New Zealand’s consumption
despite a cooler climate. However, in the second comparison, Japan’s energy consumption
per floor area is more consistent with the colder climate and is higher than that in Australia or
New Zealand.

DEFINING A NATIONAL ENERGY EFFICIENCY STRATEGY – STAGE 1 REPORT
STAGE 1 REPORT PAGE 26
Figure 2.11: Residential sector energy intensity21
Residential Sector per Capita
0
5
10
15
20
25
30
35
40
45
50
1990 1991 1992 1993 1994 1995 1996 1997 1998 1999 2000 2001 2002 2003 2004
GJ/Capita
United States Australia Japan New Zealand Canada
Energy Consumption per Floor Area
0
0.2
0.4
0.6
0.8
1
1.2
1990 1991 1992 1993 1994 1995 1996 1997 1998 1999 2000 2001 2002 2003 2004
GJ/C
apita
United States Australia Japan New Zealand Canada
21 Source: The Energy Data and Modelling Centre, The Institute of Energy Economic, Japan Joint EGEDA and EGEEC Workshops on APEC, Energy Database and Energy Efficiency Indicators, 17-21 September 2007, National University of Singapore

DEFINING A NATIONAL ENERGY EFFICIENCY STRATEGY – STAGE 1 REPORT
_____________________________________________________________________________________________
PAGE 27 STAGE 1 REPORT
In terms of energy intensity trends, Australia’s residential energy intensity per capita is
increasing at around 0.8% per year while the per capita energy intensities in the residential
sectors in the United States, New Zealand and Canada remained relatively stable. Among
the countries analysed, only Japan’s residential energy consumption growth of 1.4%pa is
greater than Australia’s (Figure 2.12).
Figure 2.12: Annual residential per capita energy consumption growth
-0.50%
-0.25%
0.00%
0.25%
0.50%
0.75%
1.00%
1.25%
1.50%
1.75%
United States Australia Japan New Zealand Canada
% pa
Overall, there are likely to be significant energy efficiency improvements available in the
residential sector given that energy intensity in households today is primarily driven by
heating and the increasing use of domestic appliances and that significant energy efficiency
opportunities exist in the appliances and heating sectors (including improvements in building
envelopes and this applies to the commercial sector as well). This is discussed further in Part
4 below.

DEFINING A NATIONAL ENERGY EFFICIENCY STRATEGY – STAGE 1 REPORT
STAGE 1 REPORT PAGE 28
3. POTENTIAL FOR ENERGY EFFICIENCY IMPROVEMENTS
3.1 Global Potential for Energy Efficiency Improvements
It is widely accepted that globally there are significant untapped energy efficiency
opportunities in a range of sectors including the building, residential, commercial and power
generation sectors.22 Indeed, the IEA estimates that unexploited energy efficiency offers the
single largest opportunity for emissions reductions and believes that accelerating progress in
energy efficiency is therefore indispensable. In 2006, the IEA published a range of
accelerated technology scenarios showing how energy-related CO2 emissions could be
returned to current levels by 2050 using technologies that already exist or are under
development. In the scenarios, which did not employ any technologies with an incremental
cost of more than USD 25 per tonne of avoided CO2 emissions, improved energy efficiency in
the buildings, industry and transport sectors lead to between 17% and 33% lower energy use
than in the business as usual scenario. 23
The IEA found that there was still significant scope for adopting more efficient technologies in
buildings, industry and transport. This is particularly the case in developing countries, but
opportunities remain in developed countries such as Australia as well.
The IEA claims that new buildings could be made up to 70% more efficient than some existing
buildings, in particular through the use of new technologies including windows with three
times the insulative value of standard windows; gas and oil furnaces with 95% efficiency; air
conditioners that use 30 to 40% less energy than earlier models; and more efficient lighting.
The IEA also points to major improvements in the efficiency of domestic appliances such as
refrigerators, water heaters and washing machines, and new technologies that reduce the
standby consumption of such appliances. In industry, the IEA considers that there is huge
potential to improve the efficiency of motors, pumps, boilers and heating systems, increasing
energy recovery in materials production processes, increased recycling and more efficient
materials use.24
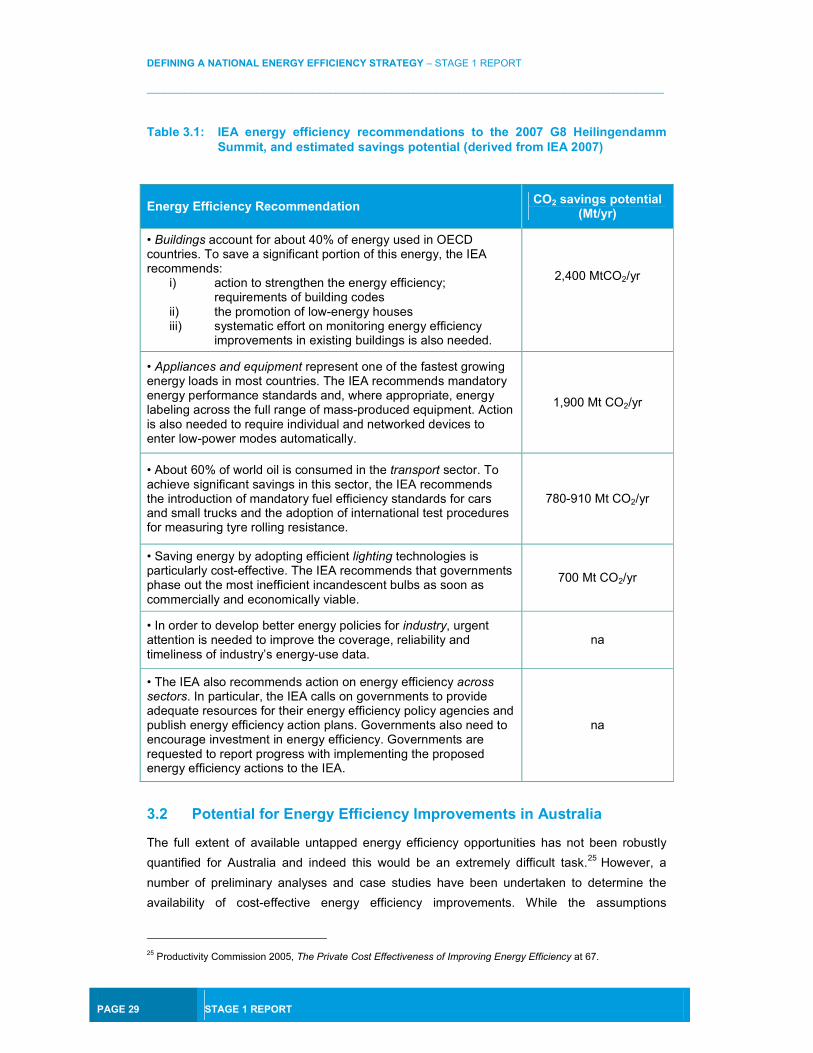
In its submission to the G8 2007 Summit in Heiligendamm, the IEA estimated that the global
implementation of its energy efficiency recommendations could save approximately
5,700 MtCO2/yr by 2030. This is equivalent to the USA’s total CO2 emissions in 2004. Table
3.1 breaks down the IEA’s estimated energy efficiency savings by sector and measure.
22 See e.g Stern Review Report on the Economics of Climate Change p 398; IEA Energy Efficiency Policy
Recommendations to the G8 2007 Summit, Heilingdamm
23 International Energy Agency, Energy Technology Perspectives, 2006, Paris: OECD/IEA. 24 Ibid
DEFINING A NATIONAL ENERGY EFFICIENCY STRATEGY – STAGE 1 REPORT
_____________________________________________________________________________________________
PAGE 29 STAGE 1 REPORT
Table 3.1: IEA energy efficiency recommendations to the 2007 G8 Heilingendamm Summit, and estimated savings potential (derived from IEA 2007)
Energy Efficiency Recommendation CO2 savings potential
(Mt/yr)
• Buildings account for about 40% of energy used in OECD countries. To save a significant portion of this energy, the IEA recommends:
i) action to strengthen the energy efficiency; requirements of building codes
ii) the promotion of low-energy houses iii) systematic effort on monitoring energy efficiency
improvements in existing buildings is also needed.
2,400 MtCO2/yr
• Appliances and equipment represent one of the fastest growing energy loads in most countries. The IEA recommends mandatory energy performance standards and, where appropriate, energy labeling across the full range of mass-produced equipment. Action is also needed to require individual and networked devices to enter low-power modes automatically.
1,900 Mt CO2/yr
• About 60% of world oil is consumed in the transport sector. To achieve significant savings in this sector, the IEA recommends the introduction of mandatory fuel efficiency standards for cars and small trucks and the adoption of international test procedures for measuring tyre rolling resistance.
780-910 Mt CO2/yr
• Saving energy by adopting efficient lighting technologies is particularly cost-effective. The IEA recommends that governments phase out the most inefficient incandescent bulbs as soon as commercially and economically viable.
700 Mt CO2/yr
• In order to develop better energy policies for industry, urgent attention is needed to improve the coverage, reliability and timeliness of industry’s energy-use data.
na
• The IEA also recommends action on energy efficiency across sectors. In particular, the IEA calls on governments to provide adequate resources for their energy efficiency policy agencies and publish energy efficiency action plans. Governments also need to encourage investment in energy efficiency. Governments are requested to report progress with implementing the proposed energy efficiency actions to the IEA.
na
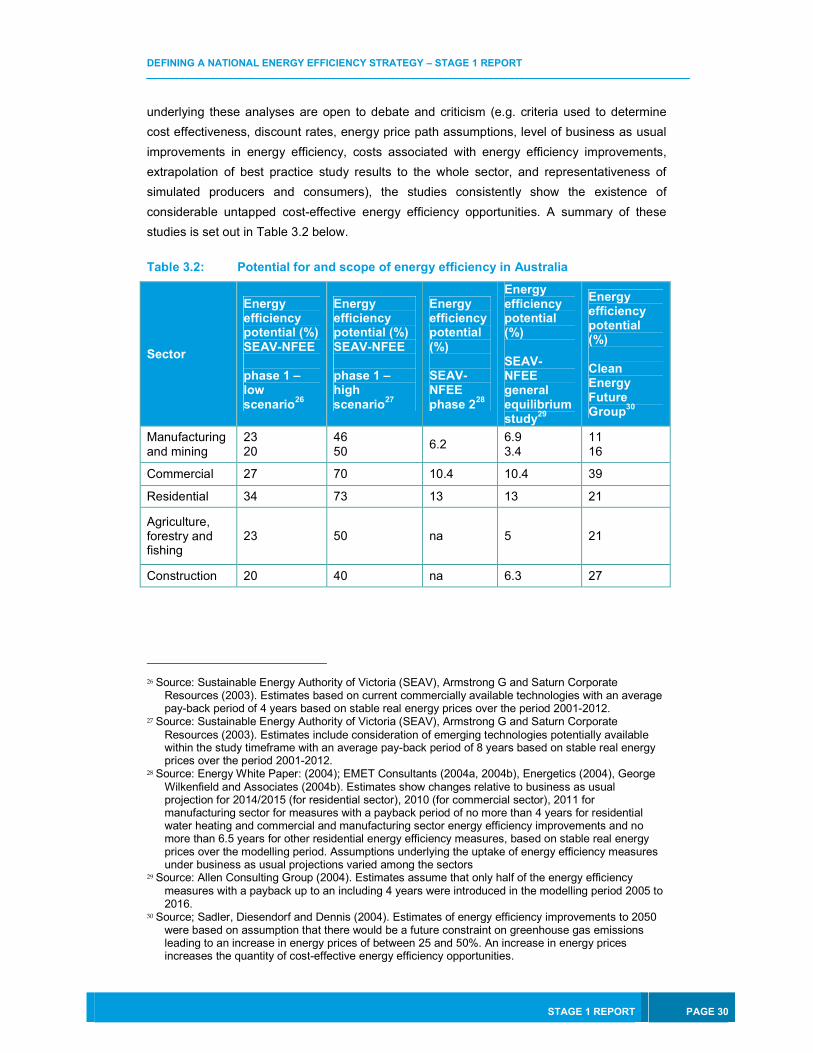
3.2 Potential for Energy Efficiency Improvements in Australia
The full extent of available untapped energy efficiency opportunities has not been robustly
quantified for Australia and indeed this would be an extremely difficult task.25 However, a
number of preliminary analyses and case studies have been undertaken to determine the
availability of cost-effective energy efficiency improvements. While the assumptions
25 Productivity Commission 2005, The Private Cost Effectiveness of Improving Energy Efficiency at 67.
DEFINING A NATIONAL ENERGY EFFICIENCY STRATEGY – STAGE 1 REPORT
STAGE 1 REPORT PAGE 30
underlying these analyses are open to debate and criticism (e.g. criteria used to determine
cost effectiveness, discount rates, energy price path assumptions, level of business as usual
improvements in energy efficiency, costs associated with energy efficiency improvements,
extrapolation of best practice study results to the whole sector, and representativeness of
simulated producers and consumers), the studies consistently show the existence of
considerable untapped cost-effective energy efficiency opportunities. A summary of these
studies is set out in Table 3.2 below.
Table 3.2: Potential for and scope of energy efficiency in Australia
Sector
Energy efficiency potential (%) SEAV-NFEE phase 1 – low scenario
26
Energy efficiency potential (%) SEAV-NFEE phase 1 – high scenario
27
Energy efficiency potential (%) SEAV-NFEE phase 2
28
Energy efficiency potential (%) SEAV-NFEE general equilibrium study
29
Energy efficiency potential (%) Clean Energy Future Group
30
Manufacturing and mining
23 20
46 50
6.2 6.9 3.4
11 16
Commercial 27 70 10.4 10.4 39
Residential 34 73 13 13 21
Agriculture, forestry and fishing
23 50 na 5 21
Construction 20 40 na 6.3 27
26 Source: Sustainable Energy Authority of Victoria (SEAV), Armstrong G and Saturn Corporate
Resources (2003). Estimates based on current commercially available technologies with an average pay-back period of 4 years based on stable real energy prices over the period 2001-2012.
27 Source: Sustainable Energy Authority of Victoria (SEAV), Armstrong G and Saturn Corporate Resources (2003). Estimates include consideration of emerging technologies potentially available within the study timeframe with an average pay-back period of 8 years based on stable real energy prices over the period 2001-2012.
28 Source: Energy White Paper: (2004); EMET Consultants (2004a, 2004b), Energetics (2004), George Wilkenfield and Associates (2004b). Estimates show changes relative to business as usual projection for 2014/2015 (for residential sector), 2010 (for commercial sector), 2011 for manufacturing sector for measures with a payback period of no more than 4 years for residential water heating and commercial and manufacturing sector energy efficiency improvements and no more than 6.5 years for other residential energy efficiency measures, based on stable real energy prices over the modelling period. Assumptions underlying the uptake of energy efficiency measures under business as usual projections varied among the sectors
29 Source: Allen Consulting Group (2004). Estimates assume that only half of the energy efficiency measures with a payback up to an including 4 years were introduced in the modelling period 2005 to 2016.
30 Source; Sadler, Diesendorf and Dennis (2004). Estimates of energy efficiency improvements to 2050 were based on assumption that there would be a future constraint on greenhouse gas emissions leading to an increase in energy prices of between 25 and 50%. An increase in energy prices increases the quantity of cost-effective energy efficiency opportunities.

DEFINING A NATIONAL ENERGY EFFICIENCY STRATEGY – STAGE 1 REPORT
_____________________________________________________________________________________________
PAGE 31 STAGE 1 REPORT
Further, in its recent report on ‘An Australian Cost Curve for Greenhouse Gas Reduction’,
McKinsey&Company identified the following energy efficiency improvement opportunities as
having negative costs (i.e. resulting in a net financial benefit to the economy) over the life-
cycle of the abatement opportunity:
• Improving electric motor efficiency in the industry sector including through the use of
control mechanisms that are more sensitive to variations in load;
• Improving the efficiency of commercial air handling, air conditioning and residential
heating systems (both water and air);
• Improving the energy efficiency of residential and commercial buildings through
insulation;
• Improving the energy efficiency of lighting and appliances (for example by ensuring
efficient standby features).31
Overall, McKinsey&Company estimated that such cost-effective energy efficiency
improvements could achieve approximately one seventh of the greenhouse gas emission
reductions required to reduce Australian emissions to 30% below 1990 levels by 2020.
Some energy efficiency improvements can be expected to take place over time simply as
more efficient technologies and methods become available. Some accelerated energy
efficiency improvements can also be expected from the rapidly rising energy prices (in part
due to the strong economic growth of emerging economies and in part due to climate change
policy interventions such as the proposed introduction of emissions trading). However, the
main subject of this paper is about the energy efficiency opportunities that would remain
untapped in the absence of additional interventions to address persistent market failures and
other barriers to the development and uptake of energy efficiency opportunities. These are
the focus of Section 4 below.
31 McKinsey&Company 2008, An Australian Cost Curve for Greenhouse Gas Reduction, at 13.

DEFINING A NATIONAL ENERGY EFFICIENCY STRATEGY – STAGE 1 REPORT
STAGE 1 REPORT PAGE 32
4. BARRIERS TO THE ADOPTION OF ENERGY EFFICIENT PRACTICES
4.1 The Effect Of The Introduction Of An Emissions Trading Scheme
As mentioned in the Introduction, recent government interventions mandating or encouraging
increased energy efficiency in Australia have been closely linked to greenhouse gas
abatement objectives.
Indeed, greenhouse gas emissions and their impact on the global climate constitute a classic
case of a market failure warranting government intervention (see Box 4.1). The negative
environmental impacts – or costs – of these emissions have historically not been reflected in
the price of energy. This failure gives rise to what is known as a negative externality and
leads to an over-supply of emissions producing activities and/or the use of technologies with
inefficiently high emissions.
Box 4. 1: Market failures and government intervention
In classic economic theory, the first best solution to externalities is to price them. In the case
of greenhouse gas emissions, either carbon taxes or emissions trading provide an efficient
and effective way of internalising externalities by putting a price on carbon (taxes do so
directly – authorities estimate the external costs and set taxes accordingly; and emissions
trading does so indirectly – authorities determine the level of emissions to be allowed and let
the market price the value of permits).
Market failures are a key rationale for government intervention. The term market failure is used
when the market, left to its own devices, produces outcomes that are not efficient in the sense that
there is the potential to make someone better off without making someone else worse off in the
process.
Care needs to be taken, however, to ensure that any intervention can reasonably be expected to
improve on the market outcomes. The existence of the theoretical possibility of making at least
someone better off without making someone else worse off is not sufficient. From an economic
efficiency perspective, the existence of a market failure provides a prima facie case for intervention
but it remains to be shown that a proposed intervention can deliver improvements. This is why
economic agencies have the tendency to insist that the rational for intervention is articulated and the
proposed interventions assessed in terms of their net benefits.
Of course economic efficiency is not the only criterion employed by policy makers to justify
interventions and nor should it be. Questions such as what does it mean for someone to be better off
and other equity and ethical questions abound. The key point is that an analysis of economic
efficiency has a strong contribution to make to policy development because it systematically seeks to
assess the costs and benefits of a particular intervention as well as requiring a clear formulation of a
policy rationale and the effectiveness with which it is being achieved.
DEFINING A NATIONAL ENERGY EFFICIENCY STRATEGY – STAGE 1 REPORT
_____________________________________________________________________________________________
PAGE 33 STAGE 1 REPORT
In light of this, the Australian Government has now committed to introducing an emissions
trading scheme as the primary vehicle for abating greenhouse gas emissions in Australia.
This policy shift requires a reconsideration of the role of energy efficiency in greenhouse
policy. This is because energy efficiency measures will only indirectly affect overall emissions
reductions when implemented alongside emissions trading.32 Emissions trading provides for
a regulatory cap on greenhouse gas emissions that cannot be exceeded and therefore, the
adoption of energy efficiency improvements simply displaces other abatement sources (such
as the deployment of renewable technologies).33 Such displacement is efficient as long as
the cost per unit of abatement from energy efficiency improvements is below the equilibrium
abatement cost in the economy.
Indeed, taking advantage of energy efficiency opportunities is part of the mix of options which
market participants can use to adjust to the new carbon constraint and it is likely that some
energy efficiency opportunities will be taken up as a response to the introduction of an
emissions constraint. However, care needs to be taken to ensure that energy efficiency
policies do not encourage the uptake of energy efficiency opportunities that are more costly
than alternative abatement options. That said, as noted in the Taskgroup on Emissions
Trading Report “there is evidence that households and firms do not always take up
opportunities for seemingly cost effective improvements in energy efficiency”.34 This is likely
to continue to be the case after emissions trading is introduced. In other words, in the
absence of interventions to complement emissions trading, many cost effective energy
efficiency opportunities risk remaining unexploited.
The concept of cost-effectiveness in this context is a complex one. Energy efficiency
improvements may be privately cost effective or socially cost-effective. Privately cost-effective
measures are measures that have a net benefit to the individual or firm taking the measure
(so-called no regrets measures). Socially cost-effective measures are measures that have a
net benefit for society as a whole if they are taken up, although the individual or firm
undertaking them may not individually be better off. If one considers the cost effectiveness of
an energy efficiency measure solely in the context of greenhouse gas emissions abatement,
32 Energy efficiency measures indirectly affect the overall emissions constraint set as part of emissions trading
scheme to the extent that • policy makers take into account the expected cost of any constraint when setting it and energy efficiency
policies have an impact on the cost of abatement; and • political processes are influenced by the effects of the emissions constraint on sub-sectors or particular
regions of the economy (rather than purely informed by the net economic benefit across all economic sectors and Australia wide) and that energy efficiency measures can also affect the overall emissions constraint if they have distributional impacts.
33 Even in the absence of an emissions trading scheme, it is important to bear in mind that improved energy efficiency does not necessarily correlate directly with emissions reductions. The emissions reduction impact of an improvement in energy efficiency is highly dependent on the mix of energy generation technologies present in the economy. As energy generation technologies ‘de-carbonise’ (eg. through an increased use of renewable energy or through the implementation of technologies such as carbon capture and sequestration) the contribution of energy efficiency improvements to emissions abatement will be reduced.
34 TGET 2007 at 134
DEFINING A NATIONAL ENERGY EFFICIENCY STRATEGY – STAGE 1 REPORT
STAGE 1 REPORT PAGE 34
any energy efficiency improvement that reduces the net overall cost of achieving the
emissions target set under the proposed emissions trading scheme is socially cost-effective.
In a broader context that includes other non-greenhouse related benefits (co-benefits)
determining whether a measure is socially cost effective becomes more difficult and tends to
favour stronger interventions.
In this study, when we refer to cost-effective energy efficiency opportunities we mean energy
efficiency opportunities that reduce the total cost of achieving the emissions abatement target
that will be set under the proposed emissions trading scheme. Co-benefits of energy
efficiency measures, discussed further in Part 5, are an important but separate consideration
that may justify government interventions to mandate or encourage energy efficiency
improvements that are not cost effective within the greenhouse gas abatement paradigm.
As noted above, increases in the price of energy, resulting from the emissions trading scheme
(i.e. the removal of one of the primary market failures that previously prevented an efficient
level of energy efficiency), will lead to some of the socially cost effective improvements in
energy efficiency opportunities being taken up. However, there are also a range of significant
non-price market failures and other barriers to the development and uptake of socially cost
effective energy efficiency opportunities. The role for energy efficiency policies alongside
emissions trading is to address these market failures and other barriers. The remainder of this
section discusses the relevant market failures and barriers. These are then used to make a
case for the policy interventions this paper recommends in Section 6.
4.2 Information Failures
In making decisions regarding the energy efficiency characteristics of goods and services
purchased or of production and distribution systems, market participants have to obtain and
process a large amount of information. In this respect energy efficiency is in principle no
different to other areas of the economy – whole professions exist whose sole raison d’être is
to search out, package and interpret information for consumers and producers.
However, to the extent that information problems give rise to significant market failures, policy
interventions can be highly desirable and economic efficiency enhancing. In the context of
energy efficiency, difficulties in obtaining and interpreting information are related to the
existence of many of the market failures and barriers to the development and implementation
of cost-effective energy efficiency opportunities including transactions costs, incentive
misalignments, the public good nature of information and a host of limitations facing decision
makers such as bounded rationality, and other relevant behavioural barriers. The challenge
is to find policies that can ameliorate these market failures in net terms, i.e. after taking into
account all the costs that interventions impose in their own right.
The following subsections discuss transactions costs, incentive misalignment and public good
issues as well as behavioural and organisational barriers as they apply to energy efficiency.
DEFINING A NATIONAL ENERGY EFFICIENCY STRATEGY – STAGE 1 REPORT
_____________________________________________________________________________________________
PAGE 35 STAGE 1 REPORT
4.3 Transactions Costs
Transactions costs include the costs of obtaining and interpreting information as well as any
costs associated with implementing energy efficiency opportunities including the costs of
negotiating, implementing and enforcing contracts.
In the context of energy efficiency, the costs of obtaining and interpreting information can be
particularly problematic in sectors where energy is a small part of the overall budget and
items are purchased primarily for attributes other than their energy characteristics. For
example, when purchasing a TV consumers may be more interested in the quality and size of
the picture and the look and features of the appliance rather than in the standby power
consumption.
It may well be rational for consumers to act in this way in the sense that the costs to individual
consumers of obtaining and interpreting energy consumption information about an appliance
like a TV can be too high relative to the gains from purchasing an energy efficient appliance.
However, this leaves the door open for economic efficiency improving policy interventions.
For example, finding the energy consumption characteristics of washing machines may be
prohibitive for an individual consumer but may be cost effective if done once for each
appliance and published in the form of an energy label.
Transaction costs are less likely to prevent cost-effective decision making in sectors where
energy costs form a large or major part of the overall budget, such as in power generation or
energy intensive manufacturing since in such cases, investing in obtaining and interpreting
information can lead to large savings. The different impact of transaction costs on different
types of energy users suggests that measures that seek to address information failures in a
differentiated and targeted way are much more likely to deliver low abatement costs than
measures that apply equally to all energy users.
Implementing energy efficiency solutions also includes such 'hidden' transactions costs as
time taken to arrange and supervise work, disruptions while work is occurring and so on.
Such costs are easily ignored in analyses of the benefits from energy efficiency improvements
and can lead to an exaggeration of the expected net benefits from implementing energy
efficiency opportunities. On the other side of the ledger, indirect benefits in the form of
reduced exposure to price volatility, enhanced supply security and 'feel good' or reputational
benefits can easily be ignored too and may lead to underestimates of the benefits from
implementing energy efficiency opportunities.
The costs of administering energy efficiency programs for governments and market
participants can also be regarded as transactions costs. However this Section deals with
market failures and other barriers that apply to the development and uptake of energy

DEFINING A NATIONAL ENERGY EFFICIENCY STRATEGY – STAGE 1 REPORT
STAGE 1 REPORT PAGE 36
efficiency opportunities in the market without intervention. Such policy implementation costs
have to be considered when assessing the net costs of policy interventions.
4.4 Incentive Misalignments
Because information is costly to obtain and interpret one party can have more information
than another (asymmetric information) and seek to protect any information they can exploit to
their advantage even if it is to the detriment of other parties (and indeed more to the detriment
of other parties than to their own benefit). Where transactions costs in obtaining information
lead to asymmetric information and this is combined with incentive misalignments (the
adjustment of which can be costly to negotiate) market failures resulting from split incentives,
principal agent problems, moral hazard and adverse selection can occur.
4.4.1 Split Incentives
Split incentives arise when the party making a decision is not the one benefiting directly from
the fruits of that decision. A classic example in the context of energy efficiency is the
landlord-tenant problem in which landlords under-invest in the energy efficiency of their asset
because the benefits in savings on energy bills do not get passed on to a sufficient extent to
landlords in the form of rent premiums.
4.4.2 Principal Agent Problems
Principal agent problems arise when decisions are made by one party (the agent) on behalf of
another party (the principal) and the agent can benefit from acting in ways that are not in the
interest of the principal. In the context of energy efficiency, a classic example is the owner-
builder problem where the builder may use less energy efficient materials and building
techniques than the owner would have to save money and time in fixed price contract
situations or when the workmanship has energy efficiency impacts but is hard to verify once
installation has occurred (e.g. gaps in wall insulation).
4.4.3 Moral Hazard
Moral hazard is essentially the principal agent problem in reverse. It occurs in situations
where the purchaser can act in ways to derive benefits that are detrimental to the supplier and
are harmful to overall economic efficiency. An example in the context of energy efficiency is
the case where a landlord rents their house out inclusive of energy costs (perhaps to
internalise the energy efficiency investments they have made) and the tenant proceeds to
keep the thermostat on a higher setting than they would have were they liable for the energy
costs themselves (so by definition they are deriving a smaller benefit from the incremental
heat than the additional costs they are giving rise to – it is just that someone else is bearing
the costs).

DEFINING A NATIONAL ENERGY EFFICIENCY STRATEGY – STAGE 1 REPORT
_____________________________________________________________________________________________
PAGE 37 STAGE 1 REPORT
4.4.4 Adverse Selection
Adverse selection refers to situations where goods with the worst characteristics end up
dominating the market. It can occur if sellers are better informed than buyers about a
product’s energy efficiency. If sellers exploit this information asymmetry by promoting their
products as energy efficient when they are not, consumers may discount any energy
efficiency claims in purchasing decisions, making it difficult for suppliers to differentiate
efficient goods. This can lead to an under-supply of energy efficient goods.
Similarly, consumers may hold relevant private information that providers of goods and
services do not have, with the effect of hampering market solutions to the information failures
discussed above. For example, if a landlord offers their property for rent inclusive of energy
costs (as is common in more energy efficient housing stock in some European countries),
tenants with higher than average energy requirements will be particularly attracted and those
with low energy requirements will be put off. This implies that simply charging for average
energy use would not be sufficient to recoup costs, driving the price of energy inclusive
offerings up and further exacerbating the adverse selection incentives.
4.4.5 Repeat Purchasing as a Remedy to Information Asymmetries
In situations where goods have a short life span, consumers can quickly discover hidden
attributes of goods on the market and sample goods from different providers, discarding those
with negative attributes the seller is trying to hide. Thus, situations of ‘repeat purchasing’
make it harder for producers to exploit information asymmetries. However, often purchases
to which energy efficiency is relevant are large and infrequent (domestic appliances, houses,
industrial equipment), meaning that new and updated information must be obtained for each
purchase. In such cases trying different providers to learn about different implementations
and hidden characteristics is available to a much more limited extent.
4.5 Public Good Aspects of Information
Another form of information failure arises when information about the optimal course of action
is in itself missing. This type of failure is most likely to arise in the context of non-product
specific information which offers little opportunity for cost-recovery. In the energy efficiency
context this includes information on energy saving techniques or practices (such as solar
passive design principles). While firms may provide some of this information as an adjunct to
related product specific information, there is a risk that such information will be undersupplied
in the market.
Information about the optimal course of action may also be missing on specific products if
only firms with energy efficient products provide information, and firms with energy intensive

DEFINING A NATIONAL ENERGY EFFICIENCY STRATEGY – STAGE 1 REPORT
STAGE 1 REPORT PAGE 38
products provide no information, as this will prevent consumers from making accurate product
comparisons.
4.6 Public Good Aspects of RD&D
Research, development and deployment of new energy efficiency technologies and practices
can be both risky and costly and the results of such research have a significant public good
aspect. However, once useful information is created from RD&D effort, it can be hard to
extract payment for its use (that is information can be spread through channels that are
extremely low cost compared to the value of the information provided). This creates a barrier
to private firms undertaking socially beneficial research, development and deployment.
This is a problem common to research and development in all areas and the Australian
government has attempted to address this barrier through a range of general measures
including intellectual property laws, the direct funding of government research and
development activities (e.g through CSIRO and Universities), and tax incentives, competitive
grants and concessional loans to encourage private sector research and development. It is
important to ensure that energy efficiency related R&D can access these broader R&D
measures and is appropriately prioritised. Additional targeted energy efficiency R&D
measures may be warranted, especially in areas where the R&D relates to a better
understanding of thermal and other physical principles or involves design concepts rather
than technological breakthroughs that can be protected more easily.
Additional deployment measures may also be warranted to encourage positive spillovers from
learning by doing through the deployment of energy efficiency measures. For example, even
when new energy efficiency technologies and practices are available there is often some lag
to their adoption resulting from a reluctance of firms to take the risk of being the first movers,
with consequent ‘teething’ costs, when this will facilitate competitors adopting the measure
subsequently at lower cost. Government interventions that demonstrate the benefits of new
energy efficiency technologies and practices can help to overcome this deployment lag and
help the learning by doing benefits that bring down the cost of energy efficiency measures
over time.
4.7 Capital Constraints
Consumers and firms may be capital constrained. This applies particularly to low income
households who might find it difficult to finance the initial higher cost of more efficient
appliances and other energy efficiency improvements, even though this would lead to a lower
total cost to the household in the long term.
Budgeting practices can also lead to energy efficiency opportunities with high internal rates of
return going unexploited within firms. This is because operating and capital budgets are often
handled separately with ensuing persistent barriers to substitution between budget items.

DEFINING A NATIONAL ENERGY EFFICIENCY STRATEGY – STAGE 1 REPORT
_____________________________________________________________________________________________
PAGE 39 STAGE 1 REPORT
4.8 Behavioural and Organisational Barriers
As noted in the Stern Review,35 individuals and firms are not always able to make effective
decisions involving complex and uncertain outcomes.
Indeed, when faced with complexity, uncertainty or risk, the full understanding of which would
require significant investments of time and energy, individuals and firms may adopt simple
decision rules that lead to satisficing rather than optimising behaviour.36
In the context of energy efficiency opportunities such complexity, uncertainty or risk may arise
from factors such as difficulties in calculating the long-run value of energy savings,
determining appropriate responses to the risks and uncertainties around future energy costs
or a lack of understanding of new energy efficiency technologies.
The adoption of simple decision rules or rules of thumb is obviously most likely in situations
where a reasonable outcome is sufficient or the difference between a reasonable outcome
and an optimal outcome is not large (e.g. individuals purchasing household appliances where
energy efficiency is only amongst a number of relevant factors) as compared to situations
where energy efficiency is a primary consideration to the profitability of an enterprise (e.g.
energy generation companies). However, the use of simple decision rules that lead to non-
efficient outcomes has been documented even in the commercial sector.37
The decision rules adopted by individuals and firms will often be strongly influenced by social
and institutional norms. That is, there is a tendency for individuals and firms to continue to
take decisions in the same way they have taken such decisions in the past despite changed
circumstances (e.g. individuals and firms may continue to place little emphasis on energy
efficiency because they are accustomed to low energy prices even though it is clear that
energy prices will increase in the near future with the introduction of an emissions trading
scheme).38 Social and institutional norms are not static and will change over time. However,
there will often be a lag between changed circumstances and changing social and institutional
norms. This is one of the key justifications for awareness raising measures as well as a more
‘coercive’ set of interventions in the transition period to, and the early years of, emissions
trading.
Once the social and institutional norms – and as a result the decision rules – have had a
chance to adapt to the new circumstances (in this case a binding emissions constraint) the
case for more ‘coercive’ interventions is significantly reduced and information measures
become more adequate in addressing remaining behavioural and other non price barriers.
35 Stern 2006 at 380-381. 36 Productivity Commission 2005 at 55 37 See Produtivity Commission 2005 at 56. 38 Stern 2006 at 381.

DEFINING A NATIONAL ENERGY EFFICIENCY STRATEGY – STAGE 1 REPORT
STAGE 1 REPORT PAGE 40
Some commentators have also noted that within firm principle agent problems (organisational
barriers) may prevent the adoption of cost-effective energy efficiency measures by firms.
Managers may choose not to adopt a potentially cost-effective energy efficiency measure
because they perceive it to be risky and the personal consequences of failure are more costly
than the pay-off from success, or because their performance is assessed on a shorter time
frame than the energy efficiency measure will take to pay off. Coordination problems within
firms may also lead to a failure to realise cost-effective energy efficiency measures.39
39 Productivity Commission 2005 at 58-59.
DEFINING A NATIONAL ENERGY EFFICIENCY STRATEGY – STAGE 1 REPORT
_____________________________________________________________________________________________
PAGE 41 STAGE 1 REPORT
5. NON-GREENHOUSE GAS ABATEMENT RELATED BENEFITS OF ENERGY EFFICIENCY
In addition to assisting in reducing the cost to the economy of achieving greenhouse gas
emission reduction targets, increased energy efficiency can have a range of other social and
economic benefits (co-benefits). It is important to include such co-benefits in any evaluation of
the efficiency of government energy efficiency interventions.
The existence of such co-benefits may also warrant government intervention to mandate or
encourage increased energy efficiency even where the adoption of more energy efficient
practices does not reduce the cost of greenhouse gas abatement.
Co-benefits that have traditionally been considered to arise from increased energy efficiency
are discussed qualitatively below.
5.1 Other Environmental and Health Benefits
Environmental externalities caused by energy generation and use, particularly using fossil
fuels, extend beyond the emission of greenhouse gases. Other pollutants such as volatile
organic compounds, small particles and ozone precursors are also produced. Such
externalities are typically dealt with through standards and regulations. However, beyond the
regulatory thresholds, these externalities remain unpriced so that energy efficiency measures
can be expected to provide social benefits in the form of avoided costs of air pollution.
5.2 Increased National Competitiveness
The Energy White Paper concluded that increasing the uptake of commercial energy
efficiency opportunities could lead to a GDP increase of AUD 975 million a year.40 Analysis
undertaken by the National Framework for Energy Efficiency also concluded that a moderate
improvement in energy efficiency would result in an increase of real GDP of AUD 0.9 billion,
an increase of 0.1%.41
5.3 Improved Energy Security
While energy security is a less significant issue for Australia than for many other countries in
the context of electricity generation (due to its significant coal and gas resources), it is
becoming increasingly important in the oil sector as import reliance grows. In the past energy
efficiency – by reducing the amount of energy required to produce a unit of GDP – has been
an important tool in ensuring energy security and enhancing the resilience of economies to
energy price rises (price rises that can be caused by scarcity of the fossil fuel resource, rising
40 Australian Government Energy White Paper 2004, SecuringAustralia’s Energy Future. 41 See Energy Policies of IEA Countries: Australia: 2005 Review at 76.

DEFINING A NATIONAL ENERGY EFFICIENCY STRATEGY – STAGE 1 REPORT
STAGE 1 REPORT PAGE 42
infrastructure costs, competing demand from growing economies such as China and India or
by climate change related policies).
5.4 Infrastructure Savings and Ability to Take Better Advantage of New
Technologies
Increased energy efficiency can delay the need to build new power plants necessary to
provide energy to a growing economy (particularly in the context of peak energy needs) as
well as the need for energy distribution network infrastructure upgrades. This not only results
in reduced infrastructure costs but also allows for greater technology development before new
plants or distribution networks are built. This may for example mean that the construction of
new coal fired power plants can be delayed until cost-effective carbon capture and storage
technologies are developed. This in turn may allow further reductions in greenhouse gas
emissions caps at lower cost.
In light of the long life expectancy of energy infrastructure investments, even short delays that
allow the implementation of less greenhouse gas emission intensive technologies when new
power plants are built can have large impacts on the overall carbon intensity of energy
generation.42 Similarly, delays to the need for distribution network upgrades, in addition to
saving on depreciation and the interest costs, can allow distributed supply solutions to
become competitive and obviate altogether the need for some proportion of the distribution
network upgrades.
5.5 Ameliorating the Regressive Impacts of Higher Energy Prices
Caused by an Emission Trading Scheme
The introduction of emissions trading leads to higher energy prices and as a result, if not
addressed, leads to a disproportionate effect on lower income households. This is because
energy costs (including embodied energy) typically constitute a larger proportion of
expenditure by low income households than by high income households.
Energy efficiency measures, particularly in the residential sector, can be used to reduce the
negative impact that energy price rises could have on low income households.
42 See Energy Policies of IEA Countries: Australia: 2005 Review at 77-78.

DEFINING A NATIONAL ENERGY EFFICIENCY STRATEGY – STAGE 1 REPORT
_____________________________________________________________________________________________
PAGE 43 STAGE 1 REPORT
6. IDENTIFYING EFFICIENT AND EFFECTIVE INTERVENTIONS
A range of energy efficiency measures have been adopted in Australia and internationally and
many more have been proposed to deal with the market failures and other barriers discussed
in Section 4 (for a summary of the types of measures deployed or planned for Australia see
Box 6.1)
This section provides input into the policy debate about the appropriate mix of energy
efficiency measures in the context of moving toward an emissions trading scheme by 2010. It
qualitatively assesses the likely efficiency and effectiveness of interventions designed to
enhance the development and deployment of energy efficiency measures by reference to
whether they 1) reduce the cost of abatement by mandating or encouraging the uptake of
cost-effective energy efficiency measures; and 2) achieve other co-benefits such as those
discussed in Section 5. This will assist with the selection of measures to be quantified in
Stage 2 of this report. The interventions considered are of three main types: information
provision, regulation; and financing. Each type is discussed in separate subsections below.
In an appraisal of the rationale for public policies to promote energy efficiency Golove and Eto
stated that: 'When government intervention [in energy efficiency] is appropriate, it is unlikely
that there will be a single best policy solution (e.g. government minimum efficiency
standards). Instead, we believe multiple, complementary approaches tailored to particular
circumstances are more likely to succeed in overcoming [energy efficiency related] market
failures or reducing high transaction costs.'43
The recommendations in this section concur with this finding. Indeed, the concept of tailoring
interventions to the market failures and barriers at the appropriate scale is central to achieving
outcomes that improve welfare overall. Given that emissions trading will provide the market
with a price signal for the greenhouse gas emissions associated with energy production and
use, the interventions need to address the remaining non-price market failures and barriers to
be efficient. The challenge is to specify the interventions at a sufficiently detailed level to be
able to ameliorate the outcomes that remain affected by market imperfections after the
introduction of emissions trading while maintaining the maximum efficiency and flexibility
afforded by the market.
In addition to identifying an appropriate scale and scope for policy interventions, it is essential
to consider the differential administration and compliance costs of various government
interventions. A further consideration in assessing policy interventions is that they may be
more or less effective in achieving co-benefits.
43 Golove and Eto 1996, p.xii

DEFINING A NATIONAL ENERGY EFFICIENCY STRATEGY – STAGE 1 REPORT
STAGE 1 REPORT PAGE 44
Finally, when considering whether a government intervention is truly efficient, it is also worth
noting that making such a determination in a robust way may incur significant costs (i.e. the
identification and quantification of market failures is often a complex and fact intensive
process). In such circumstances, determining the efficiency of a measure based on rules of
thumb, or theoretical analysis may in fact be efficiency enhancing in the context of
government interventions as a whole, especially if set up in a way that allows monitoring and
adjustment over time.
All policy measures designed to enhance energy efficiency are based on the assumption that
energy generation and use continues to produce negative externalities. If energy production
in Australia were to be significantly ‘decarbonised’ this would remove much of the rationale for
government interventions to enhance energy efficiency.
Box 6.1: Existing and proposed national and state energy efficiency policies
There are currently a range of national and state energy efficiency policies in place to
promote energy efficiency. These principally involve the provision of information to
consumers, regulation of minimum standards, consumer awareness and capacity
building.
Coordination of government energy efficiency in Australia is undertaken through the
National Framework for Energy Efficiency (NFEE). This framework is developed through
the Energy Efficiency Working Group of the Ministerial Council on Energy established by
the Council of Australian Governments in June 2001.
Stage One of the NFEE, adopted by the Ministerial Council on Energy in its
Communiqué of 27 August 2004 is a set of nine integrated and inter-linked sectoral
policy packages which extend, or further develop, energy efficiency measures currently
being implemented in Australia. The Stage One policy packages are described in Table
6.1.
In December 2007, the Ministerial Council on Energy also agreed to a further five new
energy efficiency measures relating to expanding and enhancing the Minimum Energy
Performance Standards (MEPS) program; heating, ventilation and air conditioning high
efficiency systems strategy, the phase-out of inefficient incandescent lighting,
government leadership through green leases and the development of measures for a
national hot water strategy (including the phase-out of electric hot water heaters). The
precise form that these energy efficiency measures will take remains under consideration
by the Energy Efficiency Working Group. In June 2008, the MCE further committed to the
development of a consistent national framework for Smart Meters. Smart meters are to
be rolled-out in Victoria and NSW, with over 5 million smart meters expected to be
deployed before 2017. Queensland and some other states and territories will undertake
extensive pilots and business cases prior to a further national review of deployment

DEFINING A NATIONAL ENERGY EFFICIENCY STRATEGY – STAGE 1 REPORT
_____________________________________________________________________________________________
PAGE 45 STAGE 1 REPORT
timelines in 2012. Other measures announced by the Commonwealth government
include an insulation rebate for renters and green loans for households, as well as
rebates for solar hot water.
A detailed list of the major Commonwealth, State and Territory energy efficiency
programs implementing Stage One of the NFEE can be found in Appendix C of the
Productivity Commission’s 2005 Report into the Private Cost Effectiveness of Improving
Energy Efficiency.
It is clear that an evaluation of the costs and benefits of these existing measures could
play an important role in future policy development. However, the NFEE has found that
program outcomes are often not reported in a way that allows ready comparison or
captures the range of benefits/costs of improved energy efficiency, outside energy and
greenhouse savings. As a consequence the NFEE is currently developing a framework
that is intended to provide a nationally consistent approach to data collection, reporting
and evaluation for government energy efficient programs. This framework has not yet
been finalised or utilised.
Nonetheless, the Taskgroup on Emissions Trading reviewed the costs of selected energy
efficiency programs in its 2007 Report on Emissions Trading. It found the following
energy efficiency measures to have a low cost but significant potential for greenhouse
gas emissions reductions: standards for residential and commercial buildings,
implemented through the Building Code of Australia (reducing emissions by 3.7 Mt in
2010); minimum energy performance standards (MEPS) for electrical and gas-powered
domestic appliances, commercial products and industrial equipment, including the recent
commitment to phase out inefficient light bulbs (reducing emissions by 9 Mt in 2010);. the
Greenhouse House Challenge Plus Programme, which involves both voluntary, incentive
based and compulsory partnerships between the Australian Government and industry to
abate greenhouse gas emissions, including through efficiency standards (reducing
greenhouse gas emissions by 15 Mt in 2010).
Regulatory impact statements undertaken for a range of mandatory energy efficiency
labels and standards implemented in Australia (e.g. Australian Building Code Standards,
Victorian 5 Star Standard, and MEPS have also consistently shown positive benefit cost
ratios of between 1.2 and 6.2. There has however, been little ex post verification of these
predicted benefit-cost ratios.44
44 See Productivity Commission (2005) at 80, 231.

DEFINING A NATIONAL ENERGY EFFICIENCY STRATEGY – STAGE 1 REPORT
STAGE 1 REPORT PAGE 46
Table 6.1: NFEE policy proposals
Sector Policy Package
Residential buildings
To improve the energy performance of the residential building stock over time and to inform consumer decision making, the package encompasses: • nationally consistent minimum energy efficiency design standards for
new homes, units and apartments;. • minimum energy efficiency design standards for major renovations;
and • mandatory disclosure of the energy performance of homes, units and
apartments at the time of sale or lease.
Commercial buildings
To improve the energy performance of the commercial building stock over time and to inform owner and tenant decision making, the package will introduce: • nationally consistent minimum energy efficiency design standards for
new and refurbished buildings; and • mandatory disclosure of building energy performance at time of sale
or lease.
Commercial/ industrial energy efficiency
To raise the awareness of senior management and motivate action, and to improve the skill base to identify energy efficiency opportunities, this package includes: • the requirement for large energy consumers to undertake mandatory
energy assessments and report on the energy efficiency opportunities that these identify, as announced in the Australian Government's Energy White paper; and
• nationally coordinated training and accreditation for energy auditors and energy performance contractors in conjunction with programs and protocols already in place.
Government energy efficiency
To demonstrate leadership to the business sector and wider community, Governments will:
• develop nationally consistent standards for measuring and reporting on government energy efficiency programs;
• introduce public annual reporting by all jurisdictions on energy use and progress towards achieving the targets set for government agencies;
• establish minimum energy performance standards for government buildings; and
• develop best practice models for government departments to implement energy efficiency programs.
Appliance & equipment energy efficiency
To improve the energy efficiency of major energy using appliances and equipment, the National Appliance & Equipment Energy Efficiency Program (NAEEEP) for electrical products will be:
• broadened in scope to include mandatory minimum energy performance standards (MEPS) and labelling for gas products; and
• expanded through the introduction of new or more stringent MEPS for residential, commercial and industrial products, with a key focus on increasing the number of commercial and industrial products regulated.
Trade and professional training & accreditation
To develop the capacity of the relevant professions and trades to identify opportunities and implement energy efficient solutions, the package will:
• undertake a nationally coordinated effort to integrate energy efficiency concepts into the courses for the key trades and professions that influence energy efficiency outcomes; and
• develop training and accreditation courses for practicing tradespersons.

DEFINING A NATIONAL ENERGY EFFICIENCY STRATEGY – STAGE 1 REPORT
_____________________________________________________________________________________________
PAGE 47 STAGE 1 REPORT
Commercial / industrial sector capacity building
To demonstrate the benefits of energy efficiency, build industry capacity to deliver energy efficient solutions, and reduce energy efficiency investment risks, the package will: • develop a nationally coordinated program to generate highly visible
examples of energy efficient equipment or processes in key industrial sectors and new or refurbished commercial buildings;
• link industry and government to key centres for leading edge energy efficiency research and development; and
• establish nationally coordinated energy efficiency best practice networks.
General consumer awareness
To raise the awareness of general consumers (householders and small business) and motivate energy saving actions, the package comprises: • the requirement for energy retailers to provide benchmark data on
energy bills; • development of a nationally coordinated network to facilitate easy and
timely access to high quality and relevant information;
• targeted promotional campaigns for specific energy efficiency issues; and
• the integration of energy efficiency concepts into the school curriculum.
Finance sector awareness
To increase the type and availability of finance products for energy efficiency, government agencies will work with the finance sector to: • raise awareness of the opportunities for, and benefits of, energy
efficiency investments; and • provide tools for the valuation and risk assessment of proposals.

DEFINING A NATIONAL ENERGY EFFICIENCY STRATEGY – STAGE 1 REPORT
STAGE 1 REPORT PAGE 48
6.1 Information Related Interventions
In the long run, the most pronounced market failures and other barriers affecting the
development and uptake of cost-effective energy efficiency opportunities are information
related once emissions trading is introduced. As outlined in Section 4 these include costs in
obtaining and interpreting information, which together with incentive misalignments can lead
to split incentives, principal agent problems, moral hazard and adverse selection. In addition,
the public good nature of information can result in its undersupply.
Interventions that seek to address these barriers include labelling, certification, and
endorsement, as well as information provision including, for example through billing and
metering and sharing best practice information. As Sir Nicolas Stern has noted such
measures can:
• Provide people with a fuller picture of the economic and environmental
consequences of their actions;
• Stimulate and provide the framework for market innovation and competition in
environmentally friendly goods and services;
• Reduce the transaction costs associated with investments, by providing information
on the energy use characteristics of different products or processes;
• Prompt people to take responsible action, by informing them about the wider
implications of their choices and by highlighting public policy priorities. 45
The potential for these types of interventions to address the barriers to the development and
uptake of cost-effective energy efficiency measures is the least controversial in the current
energy efficiency policy debate.
We consider that information based interventions will be the foundation of the policy
response to the market failures and other barriers discussed in Part 4 in the long term.
However, the exact form that such interventions take is more controversial and requires
detailed assessment.
6.1.1 Labelling, Certification and Endorsement
Labelling, certification and endorsement (or disendorsement) schemes are the most direct
way of targeting information failures, and in particular in addressing asymmetry of information
and its follow-on problems.
So, for example, in the landlord tenant problem identified above, if it is mandatory to provide a
star rating on rental properties, then tenants are more likely to be aware of energy efficiency
when making rental choices. This will alleviate the split incentive problem described in Part 4
45 Stern 2006.

DEFINING A NATIONAL ENERGY EFFICIENCY STRATEGY – STAGE 1 REPORT
_____________________________________________________________________________________________
PAGE 49 STAGE 1 REPORT
above once tenants have adjusted their decision rules to the higher price of energy and new
social norms (if tenants are still operating under ‘old’ rules of thumb, energy performance
information may not lead to adequate consideration of that information and require more
‘coercive’ or financial intervention).
Requiring energy efficiency labelling, certification or endorsement/disendorsement appears
particularly warranted in the case of long lived assets such as appliances and buildings where
the consumer cannot gain information about product qualities through repeat purchasing.
Further in the case of appliances, energy efficiency may remain difficult to determine even
after purchase as electricity consumption is typically measured over the entire household.
It is important, however, to bear in mind that labelling, certification and endorsement/
disendorsement schemes can be cost intensive – there is a need to identify appropriate
measures of energy efficiency and to independently test and verify products – it is therefore
worth carefully considering whether the information failure is significant enough to warrant
imposing the cost. For example, households and firms with low energy intensity – where
energy bills are typically a small fraction of their budgets, and with little technical knowledge
about the energy performance of the products that they are buying – are likely to benefit most
from such interventions. In contrast, energy intensive firms are likely to need more
differentiated energy efficiency information than labelling, certification and endorsement can
provide. Therefore information schemes will not be of as much benefit in that context.
If well designed, labelling, certification and endorsement/disendorsement schemes may be
able to correct information failures relating to gathering information to a sufficient extent so
that additional more coercive government interventions are not required. However, as
discussed below, difficulties in interpreting energy efficiency information and other
behavioural barriers may warrant additional interventions, such as minimum performance
standards, at least in the period of transition to, and early years of, an emissions trading
scheme. This gives individuals and firms time to adjust to higher energy price rises and learn
to interpret energy efficiency information.
6.1.2 Billing and Metering
Requiring energy providers to include comparative information about energy use on bills (e.g.
comparisons to other users or through time), or mandating the provision of real time electricity
display and smart meters, have the potential to promote more energy efficient behaviour and
can indirectly spur investment in energy efficiency by creating demand.

DEFINING A NATIONAL ENERGY EFFICIENCY STRATEGY – STAGE 1 REPORT
STAGE 1 REPORT PAGE 50
Stern has noted that the deployment of real time electricity displays in the United Kingdom at
a cost of 2-6 pounds annually over 5 years has reduced the energy consumption of
households by an average of 6.5%.46
Smart meters in particular, especially if coupled with flexible energy pricing, have the potential
to reduce peak demand (trials in California, for example, indicated reductions in peak period
energy use by residential customers of between 8% and 17%), as well as provide privately
cost-effective energy efficiency enhancements.47 Real time and flexible energy pricing has the
additional benefit of enhancing efficiency in the electricity sector more generally by providing
a more accurate price signal.
6.1.3 Dissemination of Information About Energy Efficiency Best
Practice / Awareness Raising
Governments can play a key role in disseminating information about energy efficiency best
practices and in raising awareness about energy efficiency as a tool to reduce energy bills in
the face of rising energy prices. This information may be under-supplied by the private sector
where it has a public good aspect (i.e. it relates to energy use practices rather than to
purchasing more energy efficient appliances).
Government provision of such information can provide economies of scale and scope as well
as enhancing the credibility of the information provided (because Government is considered a
neutral source). However, it is important that the Government avoid spending funds on
providing information that is already available. In this sense the primary role of Government
may be to act as one-stop shop for access to information about energy efficiency best
practices.
This is particularly powerful if coupled with government demonstration projects.
6.2 Regulatory Measures
As Sir Nicolas Stern said in his report to the British Government: 'Regulatory measures are
less efficient and flexible than market mechanisms in the context of perfect markets, but can
be an efficient response to the challenge of irremovable or unavoidable imperfections.'48
Existing and proposed energy efficiency regulations range from broad based energy
efficiency targets to product or technology specific standards. The more specific regulations
are, the more likely they are to be able to target the specific market failures or barriers
affecting the product or service in question. At the same time, however, more specific
regulations tend to be more prescriptive and hence run the risk of slowing innovation and/or
46 Stern 2006. 47 Stern 2006 48 Stern 2006 at 381

DEFINING A NATIONAL ENERGY EFFICIENCY STRATEGY – STAGE 1 REPORT
_____________________________________________________________________________________________
PAGE 51 STAGE 1 REPORT
lead to higher cost impacts for the outcomes sought. An analysis of the advantages and
disadvantages of selected specific regulatory measures is set out below.
6.2.1 Mandatory Energy Efficiency Targets
The term energy efficiency target is used to refer to a variety of policy interventions designed
to reduce the amount of energy used per unit of output.
This can be achieved either by targeting energy use per unit of output directly (through an
energy production/use cap per unit of output) or by imposing an overall limit on energy use,
thus requiring an improvement in energy efficiency to the extent that output continues to grow.
Energy efficiency targets can be imposed at different levels from economy wide, to sector or
even sub-sector specific and may apply across all energy sources or be limited to specific
energy source (e.g. fossil fuels). Energy efficiency targets could also be applied to individual
products or product classes (e.g. washing machines, refrigerators, etc) but policy
interventions at this level are commonly implemented through mandatory energy performance
standards rather than performance targets. Mandatory performance standards are discussed
separately below.
Most proposals for energy efficiency targets incorporate a trading scheme (e.g. white
certificate schemes), thereby allowing the market to allocate energy to the most efficient uses.
Others specify the targets to apply to specific installations or entities, without the possibility of
trading excess energy requirements against excess energy savings amongst entities. Non-
traded (or partially traded) schemes have the advantage over traded schemes of allowing
policy makers to incentivise particular groups to provide energy efficiency improvements (eg
developers in the building sector) and can thereby be targeted to overcome non-price barriers
to the uptake of energy efficiency opportunities (e.g. principal agent problems in the building
sector). However, by denying the possibility of mutually beneficial trades non-traded schemes
have to be extremely well designed to avoid raising the social cost of achieving a given target.
Essentially, because they do not allow the cost of energy efficiency improvement
opportunities to be equalised through trade, non traded energy efficiency targets are liable to
inefficiently distort energy saving costs unless ‘perfectly’ calibrated.
Imposing a cap on energy use, or energy use per unit output, at an economy wide or sectoral
level would only be an effective government intervention if energy use itself was a cause of
negative externalities. However, this is not the case. Depending on the energy source, energy
use will give rise to more or less, and to different, externalities. For example, energy
generation using fossil fuels leads to greenhouse and other pollutant emission, whereas
energy generation using wind power does not. Targeting energy use in an undifferentiated
way will therefore lead to a less efficient outcome. Even within energy generated with the use
of fossil fuels, the associated greenhouse gas emissions are very different (e.g. gas heating
DEFINING A NATIONAL ENERGY EFFICIENCY STRATEGY – STAGE 1 REPORT
STAGE 1 REPORT PAGE 52
versus electric heating using electricity generated from brown coal). To overcome this
problem, some energy efficiency target proposals differentiate between energy sources,
providing more energy efficiency certificates for energy savings from high emissions sources
than for energy savings from low emissions sources. However, to target greenhouse gas
emissions most effectively, the energy efficiency target scheme would have to differentiate
between energy sources to perfectly mimic what an emissions trading scheme does, namely
to target the policy objective of reducing greenhouse gas emissions directly.
Similarly, remaining externalities such as air pollution are best targeted directly rather than by
using energy use/energy efficiency as a surrogate. That said in the absence of full pricing of
such externalities any energy efficiency measure implemented will give rise to additional
benefits by reducing such externalities.
An additional problem with seeking to achieve these co-benefits of energy efficiency
improvements through an economy wide or sectoral energy efficiency target is that it
interferes with the price signal provided by an emission trading scheme. This is because an
energy efficiency target biases the choice of abatement measures towards energy efficiency
and away from other abatement options such as renewable energy. To the extent that other
measures are not themselves creating a bias away from energy efficiency measures (such as
through cost ineffective low emissions technology deployment incentives) a mandatory
energy efficiency target is liable to reduce the efficiency of the emissions trading scheme.
Unless the energy efficiency target somehow only leads to the adoption of energy efficiency
opportunities that are lower cost than the alternatives.
The CIE argued that emissions trading is a supply side measure and that an energy efficiency
target (as implemented through a white certificate scheme) provides an economy-wide
demand side measure49 making the schemes seem complementary rather than interfering
with each other as described in the previous paragraph.
• However, emissions trading is a demand as well as a supply side measure. On the
supply side it provides incentives to develop and deploy low emissions technologies
in production to avoid the costs of carbon incurred as a result of the need to
purchase costly permits to emit. On the demand side it provides incentives to reduce
demand for emissions intensive goods and services so as to avoid the embodied
costs of carbon that emissions trading engenders.
• Moreover, energy efficiency targets can also be characterised as both supply and
demand side measures. To make this point it is important to note that demand for
energy is a derived demand in the sense that consumers buy energy not for its own
sake but rather to achieve desirable outcomes. For example, consumers buy
energy to control the temperature of their homes, cook and have light and not for the
49 CIE 2007 at 9 and 12

DEFINING A NATIONAL ENERGY EFFICIENCY STRATEGY – STAGE 1 REPORT
_____________________________________________________________________________________________
PAGE 53 STAGE 1 REPORT
sake of energy per se. On the supply side an energy efficiency target (say
implemented through a white certificates scheme) provides incentives to develop
and deploy low energy (and by correlation low emissions) technologies in producing
desired outcomes to take advantage of available certificates (such as for example
replacing inefficient incandescent light bulbs with more efficient compact fluorescent
ones). On the demand side it provides incentives to reduce demand for energy
intensive (and by correlation emissions intensive) goods and services to take
advantage of available certificates.
As discussed in Section 4 above, once greenhouse gas related externalities have been priced
through an emissions trading scheme, the main climate change related case for energy
efficiency policy is to remove persistent non-price barriers to the development and
deployment of energy efficiency such as information failures, incentive misalignments and
behavioural barriers. This is not achieved through an economy wide or sectoral energy
efficiency target which when combined with a trading scheme it itself a price mechanism.
Thus, unless the emissions reduction target set through an emissions trading scheme is
inadequate (ie not reflect the greenhouse gas externalities), the rationale for broadly based
energy efficiency targets seems very weak.
That said, less broadly based energy efficiency target proposals can contribute to overcoming
non-price barriers to the extent that they are narrowly targeted to specific parts of the supply
chain for goods and services where non-price related externalities apply. For example, a
white certificates scheme that applies to developers may help overcome principal agent
problems in the building sector because developers would have a direct stake in the energy
efficiency performance of the buildings they build. Similarly, allowing companies to claim
energy efficiency certificates for providing energy efficiency enhancing retrofitting solutions
(eg to existing building envelopes) and for the replacement of inefficient building plant
equipment could prove to provide low cost abatement that would not be harnessed to a
sufficient extent by emissions trading. However, applying a target to a specific and narrow
part of the supply chain (eg developers) would appear problematic from an equity as well as
efficiency perspective in that they only have partial control over the energy demand outcomes
that their customers’ buildings give rise to (including issues around the rebound effect and
occupant behaviour). Giving a narrow part of the supply chain access to permits does not
suffer from this problem but requires that others are subject to a constraint for the permits to
be worth anything. However, this brings back the objections that apply to more broadly based
energy efficiency target schemes. To the extent that the idea is simply to provide incentives
for particular narrow parts of the supply chain to incentivise them, providing minimum
standards or direct subsidies would be a better approach than to use an energy efficiency
target.

DEFINING A NATIONAL ENERGY EFFICIENCY STRATEGY – STAGE 1 REPORT
STAGE 1 REPORT PAGE 54
Finally, a broadly based energy efficiency target that includes trading will be cost intensive to
establish and administer. For instance it requires the allocation of energy use property rights,
the detailed and robust measurement of appropriate energy use categories, and the
development of systems to avoid double counting, ensure additionality and establish clear
boundaries between carbon credits and white certificates.
Overall, we do not consider that the adoption of mandatory energy efficiency targets
would be an efficient and effective policy intervention so long as the emissions
reduction target set through an ETS adequately prices the greenhouse gas emissions
externalities.
If the carbon constraint set as part of an ETS is too low, a mandatory energy efficiency target
that leads to deeper cuts may be justified. This would not be a desirable outcome as an
energy efficiency target could only lead to deeper cuts if it rendered the ETS target non
binding and would thus lead to more costly abatement than if the ETS target was set
adequately in the first place. However, to the extent that the ETS target is very weak or has
low and/or capped carbon price signals, a less efficient but more binding energy efficiency
target could be justified overall.
6.2.2 Mandatory Energy Performance Standards
As discussed above, we do not consider that mandatory and economy wide or sectoral
energy efficiency targets are an efficient and effective policy intervention. However, well
targeted mandatory efficiency targets for products, either performance or design based, are
likely to be valuable tools in reducing the cost of greenhouse gas emissions abatement in
Australia as well as in providing significant co-benefits in the circumstances discussed below.
Such product specific energy efficiency targets have indirectly been implemented in Australia
and elsewhere through mandatory energy performance standards (MEPS). Australian
examples include MEPS for domestic appliances and standards in the Building Code of
Australia for residential and commercial buildings.
In the absence of a greenhouse gas emission cap, mandatory energy performance standards
play an important role in mitigating externalities associated with greenhouse gas emissions.
However, once emissions trading commences, the role of mandatory energy performance
standards will be limited to ameliorating information failures (in particular asymmetric
information, and the consequent risk of adverse selection) and behavioural barriers to the
adoption of more energy efficient products. They do this by removing from the market the
most energy intensive products which, with normal use, would not be a cost-effective option
over the life of the product but, which due to information failures or other barriers consumers
may nonetheless purchase. They thus provide consumers with some level of assurance that
the products that they are purchasing are not excessively energy intensive and prevent

DEFINING A NATIONAL ENERGY EFFICIENCY STRATEGY – STAGE 1 REPORT
_____________________________________________________________________________________________
PAGE 55 STAGE 1 REPORT
consumers that have not yet adjusted their decision rules to higher energy prices and
changed norms from erroneously locking in sub-optimal energy intensive choices.
Once the market for emissions abatement is fully mature and consumer have adjusted their
decision rules to incorporate higher energy prices, one would expect an effective set of
labelling, certification or endorsement/disendorsement schemes to address the information
failures that currently prevent the uptake of cost-effective energy efficiency improvements.
However, in the transition period to, and the early years of, an emissions trading scheme
mandatory performance standards still have an important role to play in achieving least cost
abatements. This is because consumers will still be getting used to incorporating
considerations of the energy characteristics of their purchases into their decisions and
interpreting energy efficiency information (including from labelling, certification or
endorsement/disendorsement schemes), resulting in some lag in information schemes alone
overcoming the information failures and other barriers.
In the context of long lived assets such as building and domestic appliances, such a lag in the
uptake of energy efficiency improvements leads to the loss of significant low cost abatement
opportunities. As noted by McKinsey&Company: ‘Each year we delay producing energy
efficient buildings and motor vehicles, the greater the volume of negative cost opportunities
we lose. The cost of creating a new energy efficient asset is typically a fraction of the cost of
retrofitting it later, or retiring an asset before its useful life is over.’50
Further, where it is not possible to provide information about energy efficiency in a format that
is readily comprehensible, or where easy to incorporate technologies can save energy but are
difficult to incorporate into the relevant labelling information scheme (e.g. consumption effect
of power-down feature for domestic appliances), minimum energy performance standards
may remain the most efficient solution to information failures and behavioural barriers, even in
the context of a mature market for emissions abatement.
Mandatory performance standards, particularly design type standards (e.g. mandating or
prohibiting a particular technology) may slow innovation by precluding certain technological
innovations. Design standards may nonetheless be appropriate in circumstances where a
particular technological solution is clearly preferable, for example where it would not emerge
in a competitive market solution because market players cannot differentiate on the relevant
feature. This negative distortion can be partially addressed by keeping standards under
review.
50 McKinsey&Company 2008 at 20.

DEFINING A NATIONAL ENERGY EFFICIENCY STRATEGY – STAGE 1 REPORT
STAGE 1 REPORT PAGE 56
Conversely mandatory performance standards may stimulate innovation because requiring
market players to meet certain energy efficiency standards provides an incentive to meet the
challenge at least cost. It also provides players with greater certainty that any such
innovations will have a market.
Mandatory performance standards have the effect of curtailing consumer choice, which may
lead to non-efficient outcomes. For example, a standard that requires a specific level of
energy performance from air conditioning units may remove air conditioning systems with a
lower initial purchase price but high energy intensity in operation from the market. However
such a unit may be the rational and socially cost effective solution if it is very rarely used. In
addition, mandatory performance standards will impact more heavily on capital constrained
individuals by removing low capital cost products from the market. That said, more capital
constrained individual stand to suffer more from unwittingly purchasing more energy intensive
appliances then they would have had they understood the full implications. The overall effect
on low-income households is uncertain.
The key issue from a public policy perspective, when assessing whether a mandatory
performance standard is an efficient and effective policy tool is whether such a standard has
net benefits. This requires accounting for all the costs of the intervention, including set up,
administration and compliance costs to government and firms, the opportunity cost of having
curtailed choice and any increase in production costs, as well as its benefits, including
reduced operating costs, taking into account the carbon price.
It should be noted that set up, administration and compliance costs can be significantly
reduced by adopting minimum performance standards equivalent to those already adopted in
other jurisdictions (e.g. Europe and United States). It is also important to be aware of the
dynamic effects of the possibility of the introduction of performance standards, as this can
lead to considerable investment in lobbying to achieve regulatory outcomes that give
particular firms a competitive advantage (e.g. standards that create barriers to entry into their
industry).
Overall, we consider that mandatory performance standards – including in the building
and appliance sectors – are likely to provide a useful contribution to the energy
efficiency policy mix in the transition period to, and the early years of, an emissions
trading scheme. Once market participants have adjusted to the new relative price
environment, the role of mandatory energy performance standards should be limited to
(1) areas where it is not possible to provide information about energy efficiency in a
format that is readily comprehensible; and (2) where particular technologies are easy
to implement and can cost effectively save energy but are difficult to incorporate into
information based interventions.

DEFINING A NATIONAL ENERGY EFFICIENCY STRATEGY – STAGE 1 REPORT
_____________________________________________________________________________________________
PAGE 57 STAGE 1 REPORT
6.2.3 Other Government Interventions
Existing government interventions designed to achieve a variety of non energy related
outcomes, such as planning regulations, health and safety regulations, energy market
regulations, tax incentives and rebates as well as direct subsidies, can have a significant
impact on the energy efficiency of products and services. For example, land zoning and
building regulations affect energy use relevant characteristics such as allowable density,
orientation and building style (e.g. approval for thermally optimised external shading
structures can be difficult to obtain because regulatory authorities often have regard to
existing surrounding building style and many existing buildings have small to non-existent
external shading).
A review of existing regulations and government interventions to remove unnecessary
barriers to energy efficiency improvements and perverse incentives with respect to
energy use should be a high priority given significant recent and pending changes in
the energy prices.
6.2.4 Mandatory Energy Investment Audits
The Commonwealth Energy Efficiency Opportunity Assessment Act mandates that firms
using more than 0.5 petajoules of energy undertake energy use audits and publicly report the
results. This measure addresses behavioural and organisational barriers to the uptake of
cost-effective energy efficiency improvements by focusing attention on the energy
performance of installations at a time when the relative prices are changing rapidly and firms
are more likely to miss out on cost-effective energy efficiency improvements.
As such, we consider this measure to be a potentially useful tool in the transition to an
emissions trading scheme, particularly when coupled with the provision of information about
energy efficiency best practice.
6.3 Financial Interventions
Financial interventions can take many forms including direct rebates (e.g. for energy efficient
insulation in rental homes), low interest loans (e.g. for energy efficiency improvements in
homes), and tax incentives (e.g. proposal for green depreciation of capital expenditure by
building owners refurbishing buildings in an energy efficient way, which has the effect of
deferring taxation payable). 51
While it is relatively easy to target a financial incentive directly to the outcome being sought,
such measures have a number of drawbacks. These include the inevitability of directing at
least some funding to activities that would have taken place anyway, the marginal cost of
51 CIE 2007 at 12

DEFINING A NATIONAL ENERGY EFFICIENCY STRATEGY – STAGE 1 REPORT
STAGE 1 REPORT PAGE 58
funds (i.e. every dollar of tax revenue gives rise to additional costs in the economy), as well
as unintended and unavoidable behavioural changes by market participants to take
advantage of government programs. Such behavioural changes include the deferral of
planned energy efficiency measures until advantage can be taken of the financial intervention
for activities that would have taken place even in the absence of such assistance. They also
include opportunity costs related to the diversion of individual and firm time and effort towards
identifying opportunities for assistance.
Nonetheless, in our view financial interventions may be warranted to counter the regressive
effects of increased energy prices, for example by providing rebates to low income
households for retrofitting insulation and the purchase of energy efficient appliances. Low
income households are also more likely to face capital constraints so that subsidies are likely
to have bigger benefits.
Financial interventions may also be warranted to encourage RD&D. Tax rebates, as well as
sector specific subsidies are well established policy interventions for RD&D and are likely to
provide positive returns if systematically applied to the energy efficiency sphere.
One financial intervention that does not suffer from the drawbacks discussed above, but can
provide both cost-effective emissions abatement and significant incentives for the
development and deployment of energy efficiency improvements is public sector investment
in energy efficiency. This is achieved by creating demand for energy efficiency products and
through demonstrating the feasibility of particular energy efficiency solutions. The
demonstration effects can be particularly powerful if the energy efficiency measures are well
documented and accessible.
We consider that the introduction of rebates for the purchase of energy efficiency
improvements by low income households, subsidies for energy efficiency RD&D and
public sector investment in energy efficiency improvements are likely reduce the net
cost of emissions abatement in the economy and thus to be efficient and effective
policy interventions.

DEFINING A NATIONAL ENERGY EFFICIENCY STRATEGY – STAGE 1 REPORT
_____________________________________________________________________________________________
PAGE 59 STAGE 1 REPORT
7. REFERENCES Allen Consulting Group 2004a, Economic Impact Analysis of Improved Energy Efficiency: Phase 2 Report, Report to the Sustainable Energy Authority of Victoria, Melbourne
Australian Government Energy White Paper: Securing Australia’s Energy Future (2004) Department of Industry Science and Resources, 2000, Energy Efficiency Best Practices in the Australian Aluminium Industr, Canberra CIE, Capitalising on the building sector’s potential to lessen the coasts of a broad based GHG emissions cut, 2007 CIE, Building energy efficiency: The role played by white certificates to combat GHG emissions, 2007 CIE, Green Depreciation: A preliminary analysis 2007 EMET Consultants 2004a, Energy Efficiency Improvement in the Commercial Sub-Sectors, Report to the Sustainable Energy Authority of Victoria, Melbourne EMET Consultants 2004b, Energy Efficiency Improvement in the Residential Sector, Report to the Sustainable Energy Authority of Victoria, Melbourne Energetics 2004, NFEE: Energy Efficiency Improvement, Potential Case Studies —Industrial Sector, Report to the Sustainable Energy Authority of Victoria, Melbourne George Wilkenfeld and Associates, 2004b, NFEE — Energy Efficiency Improvement Potential Case Studies: Residential Water Heating, Report to the Sustainable Energy Authority of Victoria, Melbourne
Golove, W.H. and J.H. Eto. (1996): 'Market barriers to energy efficiency: a critical reappraisal
of the rationale for public policies to promote energy efficiency'. LBL-38059. Berkeley, CA:
Lawrence Berkeley National Laboratory.
Herring, H. 2006, Energy Efficiency – A Critical Review, Energy 31 (2006), 10-20, Elsevier,
International Energy Agency, Energy Technology Perspectives, 2006, Paris: OECD/IEA.
International Energy Agency, Energy Policies of IEA Countries, 2006 Review 2006, Paris:
OECD/IEA.
International Energy Agency, Energy Use in Australia in an International Perspective, 2001,
Paris: OECD/IEA.
International Energy Agency, Energy Use in the New Millennium, Trends in IEA Countries,
2007, Paris: OECD/IEA
International Energy Agency, IEA Energy Efficiency Policy Recommendations to the G8
Summit, Heilingdamm, June 2007
DEFINING A NATIONAL ENERGY EFFICIENCY STRATEGY – STAGE 1 REPORT
STAGE 1 REPORT PAGE 60
Lovins, A. (1992): 'Energy-efficient buildings: institutional barriers and opportunities'. Boulder,
CO: ESource, Inc.
McKinsey & Company An Australian Cost Curve for Greenhouse Gas Reduction, 2008 McNicol, I. 2004, Residential Sector EEI Potential, Presentation to the National Framework for Energy Efficiency Modelling Workshop, 22 April, Canberra Prindle, W.R., Shipley, A.M. & Elliott, R.N., 2006, Energy Efficiency’s Role in a Carbon Cap-and-Trade System: Modelling Results from the Regional Greenhouse Gas Initiative, American Council for an Energy-Efficient Economy, Report No. E064, <www.aceee.org/pubs/e064.htm>. Productivity Commission, The Private Cost Effectiveness of Improving Energy Efficiency (2005) Saddler, H., Diesendorf, M. and Denniss, R. 2004, A Clean Energy Future for Australia, A Study by Energy Strategies for the Clean Energy Future Group Sydney SEAV (Sustainable Energy Authority of Victoria), Armstrong, G. and Saturn Corporate Resources 2003, Preliminary Assessment of Demand-Side Energy Efficiency Improvement Potential and Costs, Melbourne Tedesco L and Thorpe S, 2003, Trends in Australian Energy Intensity, 1973-74 to 2000-01, ABARE
Stern, N., 2006, Stern Review: Report on the Economics of Climate Change, Cambridge
University Press