defining multiple criteria for meaningful outcome in routine outcome measurement using the health of...
TRANSCRIPT
ORIGINAL PAPER
Defining multiple criteria for meaningful outcome in routineoutcome measurement using the Health of the Nation OutcomeScales
Alberto Parabiaghi • Hans E. Kortrijk •
Cornelis L. Mulder
Received: 10 June 2013 / Accepted: 24 July 2013 / Published online: 6 August 2013
� Springer-Verlag Berlin Heidelberg 2013
Abstract
Purpose Using the reliable and clinically significant
change approach, we aimed to identify meaningful out-
come indicators for the Health of the Nation Outcome
Scales (HoNOS) and to combine them in a single model.
We applied these indicators to the 1-year outcome of two
large samples of people attending community mental
health services in Italy (cohort 1) and the Netherlands
(cohort 2).
Methods Data were drawn from two studies on routine
outcome assessment. The criteria for meaningful outcome
were defined on both study cohorts and both language
versions of the scale. The model combined (a) two criteria
for adequate change (at least 4 or 8 points change), (b) two
cut-offs for clinically significant change (a total score of 10
was the threshold between mild and moderate illness, 13
between moderate and severe illness), and (c) a method for
classifying stable subjects in three degrees of severity
(stable in mild, moderate or severe illness). Results were
compared with those given by the effect size (ES) and
analysis of variance and covariance (ANOVA and
ANCOVA).
Results For the proposed approach the outcome of cohort
1 was better than cohort 2, with 65–67 % of its subjects
showing a positive outcome compared to only 45–46 %.
The other reference methods (ES and ANOVA), however,
showed a greater improvement for cohort 2. ANCOVA
indicated that the differences were due to regression to the
mean (RTM) which showed opposite effects across the two
cohorts.
Conclusions The proposed approach proved valuable and
generalizable for interpreting outcome on HoNOS, scarcely
influenced by the RTM effect. Its introduction could benefit
outcome evaluation and management.
Keywords Meaningful outcome � Reliable change �Routine outcome measurement � Mental health �HoNOS � Regression to the mean
Introduction
The importance of routine outcome measurement (ROM)
in mental health care has been recognized worldwide. It
has been officially adopted in the UK, The Netherlands,
Australia and New Zealand and is being implemented in
many other countries [1–4]. A central feature of outcome
assessment is its ability to measure clinically significant
change over time [5–7]. The so-called pre-post design is
the simplest and most straightforward way to highlight
meaningful change. It requires at least two assessments,
usually at the start and at the end of treatment. Thus,
change is measured using the two assessments through the
so-called two-wave difference-score (d-score) approach.
Information on change can be delivered at the individual
and the group level [8]. Since the two levels are closely
linked, for most stakeholders information on both is of
A. Parabiaghi (&)
Laboratory of Epidemiology and Social Psychiatry, IRCCS
Istituto di Ricerche Farmacologiche Mario Negri, Via la Masa
19, 20156 Milan, Italy
e-mail: [email protected]
H. E. Kortrijk
Bavo-Europoort, Mental Healthcare Organization, Prins
Constantijnweg 48-54, 3066 TA Rotterdam, The Netherlands
C. L. Mulder
Department of Psychiatry, Epidemiological and Social
Psychiatric Research Institute, Erasmus MC, P.O. Box 2040,
3000 CA Rotterdam, The Netherlands
123
Soc Psychiatry Psychiatr Epidemiol (2014) 49:291–305
DOI 10.1007/s00127-013-0750-7
primary importance [8, 9]. Group data can be deductively
used to form criteria for assessing individual clinically
significant change, while individual data can be inductively
used to define meaningful change at the group level. Group
level results can inform interpretation at the individual
level, and vice versa [10].
While information on change at the group level is useful
for judging overall treatment effectiveness, there is an
overwhelming agreement on the inappropriateness of sta-
tistical significance alone to evaluate change in outcome
research [8]. Alternative methods may provide more infor-
mation on the degree of individual meaningful change
within groups of patients. The so-called ‘‘classify and
count’’ approaches can be adopted to quantify the proportion
of patients who gain d-score meaningful change at follow-
up. These approaches involve classifying severity based on
the number of individual items with a certain severity score
[6, 7]. Although preferable to statistical methods, which are
based on the likelihood of change, these methods are not
self-sufficient since they still need a statistical approach to
identify significant differences between groups. Moreover,
they depend on the availability of reliable, valid criteria to
classify individuals as clinically improved or worsened.
The criteria for meaningful change can be based on
anchor- or distribution-based approaches [5, 11, 12].
Anchor-based approaches require independent standards or
‘anchors’ and involve comparing groups that differ in
terms of some disease-related external criterion in order to
identify a cut-off for clinical significance. Three alterna-
tives for determining clinically significant (CS) change
have been proposed: (a) the patient’s score after clinical
intervention is two standard deviations (SD) or more from
the dysfunctional population mean in the functional
direction; (b) the patient’s score after clinical intervention
is within two SD of the functional population mean; (c) the
patient’s score after clinical intervention is closer to the
mean of the functional population than the mean of the
dysfunctional population [13–20]. Only the third criterion
for clinical significance, based on the greater likelihood of
the patient being in the normative than in a clinical dis-
tribution, is anchor-based [21].
Distribution-based approaches are based on the statisti-
cal characteristics of the sample. Three broad types of
distribution-based measures can be identified: based on
(a) statistical significance; (b) sample variability; and
(c) measurement precision [5, 11].
The four candidate approaches for interpreting individ-
ual meaningful change in mental health care are effect size
(ES), standard error of measurement (SEM), reliable
change (RC), and reliable and clinically significant change
(RCSC) [6–8]. Although they are distinct statistics, Bur-
gess et al. [22] showed that ES-medium and SEM gave the
same thresholds for change.
Cohen’s ES is a popular and recommended distribution-
based approach and relies on a measure of variability to
identify group-level meaningful change [23, 24]. The
techniques developed for using methods like ES to assess
change for individuals do not take individual test error into
account [6].
The SEM adopts a distribution-based criterion to iden-
tify minimal individual clinically significant change, but it
is too directly related to the reliability of the test [25]. The
RC approach is closely related to the SEM as they both
explicitly incorporate the reliability of the measure. How-
ever, the RC is more conservative because it also considers
whether the change is statistically reliable. Internal con-
sistency, Cronbach’s coefficient alpha (a), was mostly
adopted as a parameter of the reliability of measures for
calculating SEM and RC.
Jacobson and Truax [15] proposed combining RC with
clinically significant change (CSC) in order to identify
individual meaningful change [13, 14, 16, 17, 18, 19, 20].
This approach comprises two individual-level methods for
identifying meaningful change: a distribution-based
approach (i.e. RC) and an anchor-based approach (i.e.
CSC). The Jacobson and Truax (JT) method [13, 15] was
considered one of the most promising for establishing
clinically meaningful change and has been widely used to
identify individual clinical improvement with different
outcome scales and in various settings [26–32].
Many authors have criticized the original RCSC concept
focusing on regression toward the mean, which was not
taken into consideration, and on the fact that functional/
dysfunctional populations are likely to differ in many other
relevant variables besides the outcome considered [16, 18–
20, 33]. The discussion remarked on the importance of
baseline severity in determining clinically meaningful
change [12]. Several formula modifications in the RC
index, including changes in the formula for calculating RC
[16, 18–20], have been suggested to correct the estimates
for error-based regression to the mean, by adjusting the
pre-test score for regression to the mean [34], or by cor-
recting change scores according to the reliability of the
differences [18–20].
Despite all these criticisms the original JT approach is
sound, practical and easy to understand and can therefore
be considered the most appropriate method in the domain
of outcome assessment as a means for communicating with
patients, families and service providers [9]. However, its
low sensitivity to change still poses major limits to its use
in group-level outcome evaluation.
In previous reports on the application of RCSC in ROM,
the majority (70–90 %) of patients appeared stable across
time and this was attributed to the conservativeness of the
approach [30–32]. Too conservative an approach might fail
to adequately inform stakeholders on clinically meaningful
292 Soc Psychiatry Psychiatr Epidemiol (2014) 49:291–305
123
change as only a scant minority of patients would be clas-
sified as ‘‘improved’’ or ‘‘worsened’’ and the outcome of the
majority ‘‘unchanged’’ would be hard to interpret. One
solution is to adopt a combined model comprising multiple
criteria for change. Matthey et al. [29] proposed using the
RC index to detect improvement or deterioration and both
the RC index and CS change to establish recovery. Parab-
iaghi et al. [30] proposed adopting RC to indicate
improvement or deterioration and RC plus two different CS
cut-offs to establish clinical improvement or deterioration
(cut-off1) and remission or recurrence (cut-off2). Both
approaches took into account different degrees of change in
the direction of either improvement or worsening with the
result of conveying much more information about the
clinical relevance of group-level outcome [29, 30]. Infor-
mation on outcome should focus on meaningful change.
However, as ‘no change’ may be regarded as either a good
outcome or a disappointing one, the characteristics of
clinical stability should also be taken into account in
interpreting outcome in everyday mental health practice [8].
We aimed at identifying and validating a generalizable
model for assessing clinically meaningful outcome (MO)
in ROM which adopted both a distribution-based approach
(i.e. SEM or RC) and an anchor-based approach (CS cut-
offs), and which took account of different degrees of
individual change and of different levels of severity within
illness stability. The aims were (a) to calculate common
multiple criteria for meaningful outcome on the Italian and
the Dutch versions of the Health of the Nation Outcome
Scales (HoNOS); (b) to integrate those criteria in a single
model, creating a combined method for interpreting
meaningful outcome; (c) to apply the model to two large
cohorts of people attending community mental health ser-
vices in Italy and the Netherlands; (d) to calculate the
measure of agreement between the results obtained with
the proposed approach and those given by the calculation
of the individual ES; (e) to compare these outcome results
with those from other reference methods, ES, ANOVA and
ANCOVA.
Methods
Study samples
Italian data were drawn from three observational outcome
studies on ROM in a group of Italian community mental
health services (CMHSs) between 2003 and 2011 [30, 32].
Each of these studies selected a prevalence cohort of
people attending those services, followed up for 1 year in a
naturalistic fashion. We used baseline HoNOS data (Ho-
NOS total score, standard deviation and Cronbach’s alpha)
from patients in these studies to identify multiple criteria
for meaningful change. For empirical application of the
model, data were drawn only from the third Italian ROM
study. We used baseline and 1-year follow-up HoNOS
ratings of all complete cases (3,526; cohort 1).
Dutch data were obtained from seven Assertive Com-
munity Treatment (ACT) teams in the city of Rotterdam,
the Netherlands, as part of a ROM procedure [35, 36].
ROM assessments were planned every 6–12 months. The
ratings were completed by independent raters (mostly
psychologists), and were used in clinical practice to discuss
treatment progress with the patient. Criteria for treatment
by an ACT team were (1) age 18 or older, (2) having a
severe mental illness, usually a psychotic disorder, with or
without a co-morbid substance use disorder (SUD), and (3)
lack of motivation for regular treatment at the start of ACT
that made assertive outreach necessary. The first contact
with mental health services started about a decade before
entering ACT [35, 36]. For the empirical application of
model, we used baseline and 1-year follow-up data of
patients with complete cases (805; cohort 2).
Outcome data were collected as part of routine clinical
care and for purposes of quality improvement, thus no
specific written informed consent was obtained.
Instrument
The Health of the Nation Outcome Scales (HoNOS) was
developed as a standardized assessment tool for routine use
to evaluate treatment progress in mental health services
[37]. It consists of 12 clinician-rated scales, each using five
points ranging from 0 (no problem) to 4 (severe/very
severe), yielding a total score from 0 to 48. The HoNOS
covers the following domains: (1) overactive, aggressive,
disruptive or agitated behaviour, (2) non-accidental self-
harm, (3) problem drinking and drug-taking, (4) cognitive
problems, (5) physical illness and disability, (6) halluci-
nations and delusions, (7) depressed mood, (8) other psy-
chological symptoms, (9) relationship problems, (10)
problems with activities of daily living, (11) problems with
living conditions, and (12) problems with occupation and
activities. Independent studies have evaluated its reliabil-
ity, sub-scale structure, sensitivity to change and appro-
priateness for routine clinical use in busy psychiatric
services; see Pirkis et al. [38] for a review. The psycho-
metric properties of the English, Italian and Dutch HoNOS
versions have been found to be acceptable [37, 39–41]. The
Italian and Dutch versions of HoNOS were adopted for
cohorts 1 and 2 respectively [39–41].
Statistical methods
This study comprised two groups of patients (Italian and
Dutch). We started by calculating descriptive statistics and
Soc Psychiatry Psychiatr Epidemiol (2014) 49:291–305 293
123
examined normality plots of the data to ascertain that the
HoNOS ratings were normally distributed (normal Q–Q
Plot). Then we compared the two groups using Pearson’s
Chi-square tests (for categorical data) and independent
sample t tests (for non-categorical data).
The SEM, reliable change (RC index) and two cut-offs
for clinical significance were calculated to identify multiple
criteria for meaningful outcome for the HoNOS. We fol-
lowed a procedure similar to that described by Parabiaghi
et al. [30] and acknowledged by the Australian Mental
Health Outcomes & Classification Network [6, 22].
As both indicators of meaningful change take
account of the reliability and variability of measures
(i.e. Cronbach’s alpha and the standard deviation), we
first needed to find consensus and select parameters that
could be applied (a) to the two different language
versions of HoNOS and (b) to the two different cohorts
of service users. For this purpose we generated a series
of calculation tables displaying the SEM/RC indexes
obtained for a wide range of reliability and dispersion
characteristics (see ‘‘Appendix’’ for calculation formu-
las) which enabled us to select common multiple cri-
teria for meaningful change.
For the RC index alpha was set at 0.10 (two-tailed). This
means that change scores above the upper threshold were
considered as reliable improvement, and scores below the
lower threshold were considered as reliable deterioration
(with 90 % confidence). Because individual total scores
can only change in points (integers), the calculated
thresholds were rounded to the next integer.
The measure of agreement among RC, SEM and indi-
vidual ES (Es-ind) was evaluated on the aggregated sample
(i.e. both sites) using a 5 9 5 agreement table and Cohen’s
kappa.
A classify-and-count approach was applied to the
baseline assessments of cohorts 1 and 2 (See [9] and [32]
for details) for calculating the cut-offs for clinical signifi-
cance. We stratified our subjects into four categories of
severity: subclinical sample, clinical sample (mild), mod-
erately severe sample, very severe sample. As proposed by
Lelliott [42] a score of[2 in at least one item was adopted
to distinguish between severe and non-severe patients.
Severity was further distinguished by dividing the group of
severe subjects into those having more than one item’s
score of[2 (‘very severe’) and those with only one item’s
score [2 (‘moderately severe’). The non-severe patients
were further divided as ‘subclinical’ (score \ 2 in all
items) and ‘clinical/mild’ (at least one item’s score of 2).
Then, we calculated the cut-off points where the chance of
either distribution was the same (see ‘‘Appendix’’). Cut-
offs were calculated between ‘‘very severe’’ and the rest of
the sample (cut-off 1) and between ‘‘subclinical’’ and the
rest of the sample (cut-off 2). In addition to these
classifications we proposed to define ‘remission’ as: no
more than minimal to mild problems in psychosocial
functioning. Patients classified as mildly ill achieved
remission if all HoNOS items were scored B2 over a period
of 6 months or more.
Empirical evaluation of the proposed model involved
applying of the calculated criteria to the HoNOS assess-
ments of both study cohorts. Next, study outcomes of both
cohorts were calculated with classical statistical tests (two-
tailed paired t test, mixed-group factorial ANOVA) and
individual and group ES. To allow comparisons of the
‘clinical model’ with the other conventional methods we
created an ordinal variable ranging from -3 (worsened in/
to severe illness) to ?4 (stable in mild illness) based on the
RCSC index. The measure of agreement between the
RCSC index and individual ES was evaluated based on the
Spearman’s rho.
Subsequently, we examined the degree to which con-
clusions about outcomes generated by the different meth-
ods were comparable. For proper interpretation of the
results of this descriptive comparison (RCSC vs classical
approaches), we estimated the effect of the regression to
the mean (RTM) on outcome, based on the hypothetical
assumption that the subjects in the two cohorts were drawn
from the same population. Thus, the mean of the aggregate
sample (i.e. both sites) was used as an estimate of the
population ‘true mean’.
All the subjects were stratified on the baseline score: (1)
lower than average (scores \ 1SD); (2) average; (3) higher
than average (scores [ 1SD). Change-scores within each
strata were calculated to analyse whether the differences
between strata could be attributed to a RTM effect. The
effect was then estimated as described by Barnett et al. [43]
(see ‘‘Appendix’’ for formula) and the observed change
was corrected by subtraction (or by addition) of the esti-
mated RTM effects [44, 45].
RTM showed a substantial opposite effect across the
two cohorts. Therefore, we corrected the results of the
conventional statistical approaches by applying two
ANCOVA models. First, as described by Barnett et al. [43],
we used the following single regression equation to adjust
each subject’s outcome according to their baseline mea-
surement: follow-up = constant ? a (baseline - baseline
mean) ? b group ? error. In this equation, ‘baseline -
baseline mean’ represents the baseline assessment centred
on the ‘true mean’. Second, as the reliability of HoNOS
assessments (Cronbach’s alpha) differed across the two
sites (0.74 vs 0.56) a non-equivalent group analysis
approach was used to obtain reliability-corrected results
(see http://www.socialresearchmethods.net/kb/statnegd.
php for further explanation): follow-up = constant ? a
(reliability-corrected baseline - baseline mean) ? b
group ? error [46].
294 Soc Psychiatry Psychiatr Epidemiol (2014) 49:291–305
123
Results
The study cohorts
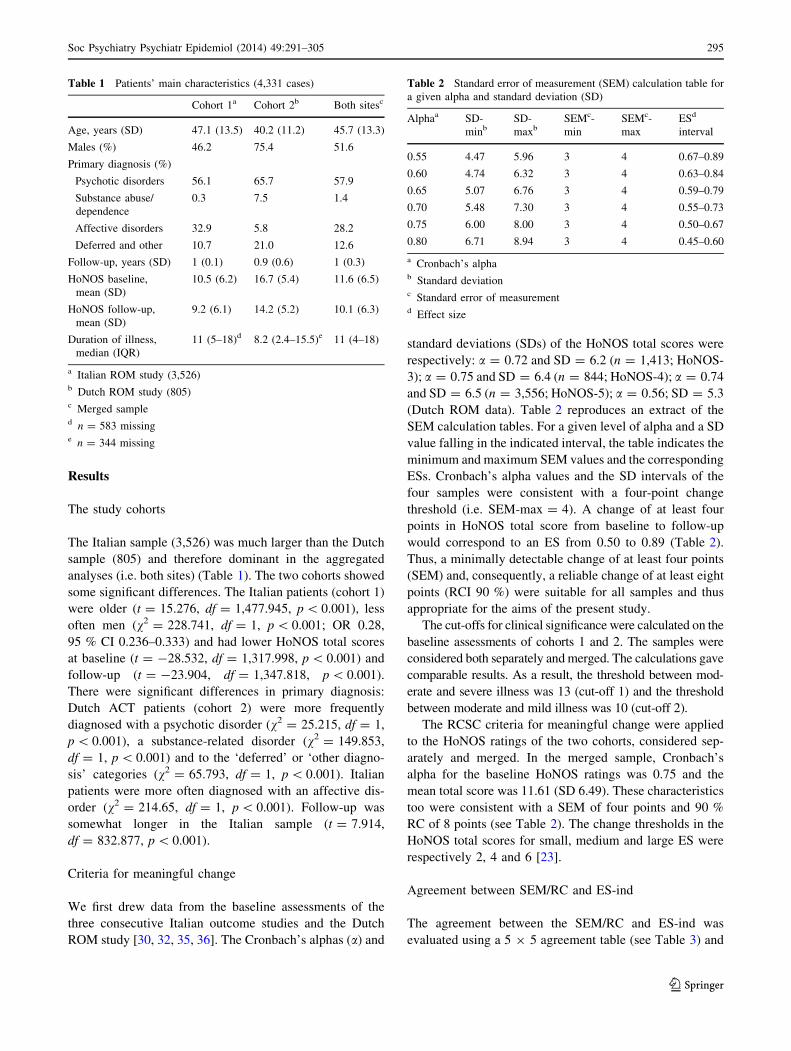
The Italian sample (3,526) was much larger than the Dutch
sample (805) and therefore dominant in the aggregated
analyses (i.e. both sites) (Table 1). The two cohorts showed
some significant differences. The Italian patients (cohort 1)
were older (t = 15.276, df = 1,477.945, p \ 0.001), less
often men (v2 = 228.741, df = 1, p \ 0.001; OR 0.28,
95 % CI 0.236–0.333) and had lower HoNOS total scores
at baseline (t = -28.532, df = 1,317.998, p \ 0.001) and
follow-up (t = -23.904, df = 1,347.818, p \ 0.001).
There were significant differences in primary diagnosis:
Dutch ACT patients (cohort 2) were more frequently
diagnosed with a psychotic disorder (v2 = 25.215, df = 1,
p \ 0.001), a substance-related disorder (v2 = 149.853,
df = 1, p \ 0.001) and to the ‘deferred’ or ‘other diagno-
sis’ categories (v2 = 65.793, df = 1, p \ 0.001). Italian
patients were more often diagnosed with an affective dis-
order (v2 = 214.65, df = 1, p \ 0.001). Follow-up was
somewhat longer in the Italian sample (t = 7.914,
df = 832.877, p \ 0.001).
Criteria for meaningful change
We first drew data from the baseline assessments of the
three consecutive Italian outcome studies and the Dutch
ROM study [30, 32, 35, 36]. The Cronbach’s alphas (a) and
standard deviations (SDs) of the HoNOS total scores were
respectively: a = 0.72 and SD = 6.2 (n = 1,413; HoNOS-
3); a = 0.75 and SD = 6.4 (n = 844; HoNOS-4); a = 0.74
and SD = 6.5 (n = 3,556; HoNOS-5); a = 0.56; SD = 5.3
(Dutch ROM data). Table 2 reproduces an extract of the
SEM calculation tables. For a given level of alpha and a SD
value falling in the indicated interval, the table indicates the
minimum and maximum SEM values and the corresponding
ESs. Cronbach’s alpha values and the SD intervals of the
four samples were consistent with a four-point change
threshold (i.e. SEM-max = 4). A change of at least four
points in HoNOS total score from baseline to follow-up
would correspond to an ES from 0.50 to 0.89 (Table 2).
Thus, a minimally detectable change of at least four points
(SEM) and, consequently, a reliable change of at least eight
points (RCI 90 %) were suitable for all samples and thus
appropriate for the aims of the present study.
The cut-offs for clinical significance were calculated on the
baseline assessments of cohorts 1 and 2. The samples were
considered both separately and merged. The calculations gave
comparable results. As a result, the threshold between mod-
erate and severe illness was 13 (cut-off 1) and the threshold
between moderate and mild illness was 10 (cut-off 2).
The RCSC criteria for meaningful change were applied
to the HoNOS ratings of the two cohorts, considered sep-
arately and merged. In the merged sample, Cronbach’s
alpha for the baseline HoNOS ratings was 0.75 and the
mean total score was 11.61 (SD 6.49). These characteristics
too were consistent with a SEM of four points and 90 %
RC of 8 points (see Table 2). The change thresholds in the
HoNOS total scores for small, medium and large ES were
respectively 2, 4 and 6 [23].
Agreement between SEM/RC and ES-ind
The agreement between the SEM/RC and ES-ind was
evaluated using a 5 9 5 agreement table (see Table 3) and
Table 1 Patients’ main characteristics (4,331 cases)
Cohort 1a Cohort 2b Both sitesc
Age, years (SD) 47.1 (13.5) 40.2 (11.2) 45.7 (13.3)
Males (%) 46.2 75.4 51.6
Primary diagnosis (%)
Psychotic disorders 56.1 65.7 57.9
Substance abuse/
dependence
0.3 7.5 1.4
Affective disorders 32.9 5.8 28.2
Deferred and other 10.7 21.0 12.6
Follow-up, years (SD) 1 (0.1) 0.9 (0.6) 1 (0.3)
HoNOS baseline,
mean (SD)
10.5 (6.2) 16.7 (5.4) 11.6 (6.5)
HoNOS follow-up,
mean (SD)
9.2 (6.1) 14.2 (5.2) 10.1 (6.3)
Duration of illness,
median (IQR)
11 (5–18)d 8.2 (2.4–15.5)e 11 (4–18)
a Italian ROM study (3,526)b Dutch ROM study (805)c Merged sampled n = 583 missinge n = 344 missing
Table 2 Standard error of measurement (SEM) calculation table for
a given alpha and standard deviation (SD)
Alphaa SD-
minbSD-
maxbSEMc-
min
SEMc-
max
ESd
interval
0.55 4.47 5.96 3 4 0.67–0.89
0.60 4.74 6.32 3 4 0.63–0.84
0.65 5.07 6.76 3 4 0.59–0.79
0.70 5.48 7.30 3 4 0.55–0.73
0.75 6.00 8.00 3 4 0.50–0.67
0.80 6.71 8.94 3 4 0.45–0.60
a Cronbach’s alphab Standard deviationc Standard error of measurementd Effect size
Soc Psychiatry Psychiatr Epidemiol (2014) 49:291–305 295
123
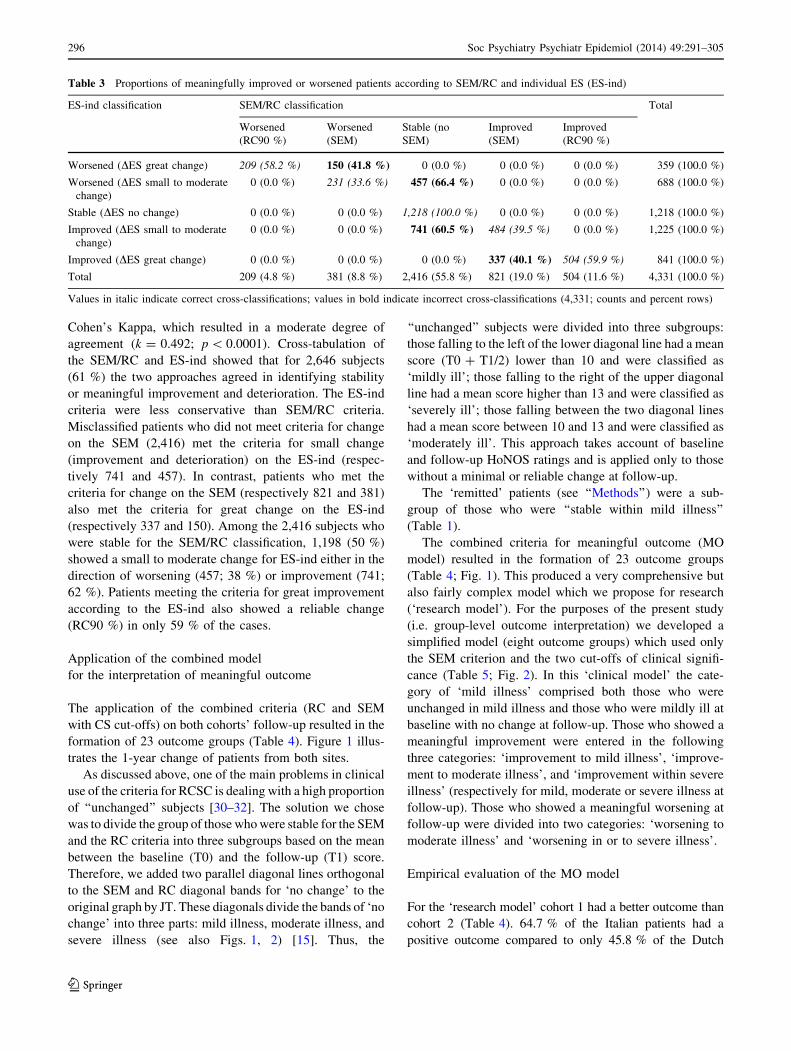
Cohen’s Kappa, which resulted in a moderate degree of
agreement (k = 0.492; p \ 0.0001). Cross-tabulation of
the SEM/RC and ES-ind showed that for 2,646 subjects
(61 %) the two approaches agreed in identifying stability
or meaningful improvement and deterioration. The ES-ind
criteria were less conservative than SEM/RC criteria.
Misclassified patients who did not meet criteria for change
on the SEM (2,416) met the criteria for small change
(improvement and deterioration) on the ES-ind (respec-
tively 741 and 457). In contrast, patients who met the
criteria for change on the SEM (respectively 821 and 381)
also met the criteria for great change on the ES-ind
(respectively 337 and 150). Among the 2,416 subjects who
were stable for the SEM/RC classification, 1,198 (50 %)
showed a small to moderate change for ES-ind either in the
direction of worsening (457; 38 %) or improvement (741;
62 %). Patients meeting the criteria for great improvement
according to the ES-ind also showed a reliable change
(RC90 %) in only 59 % of the cases.
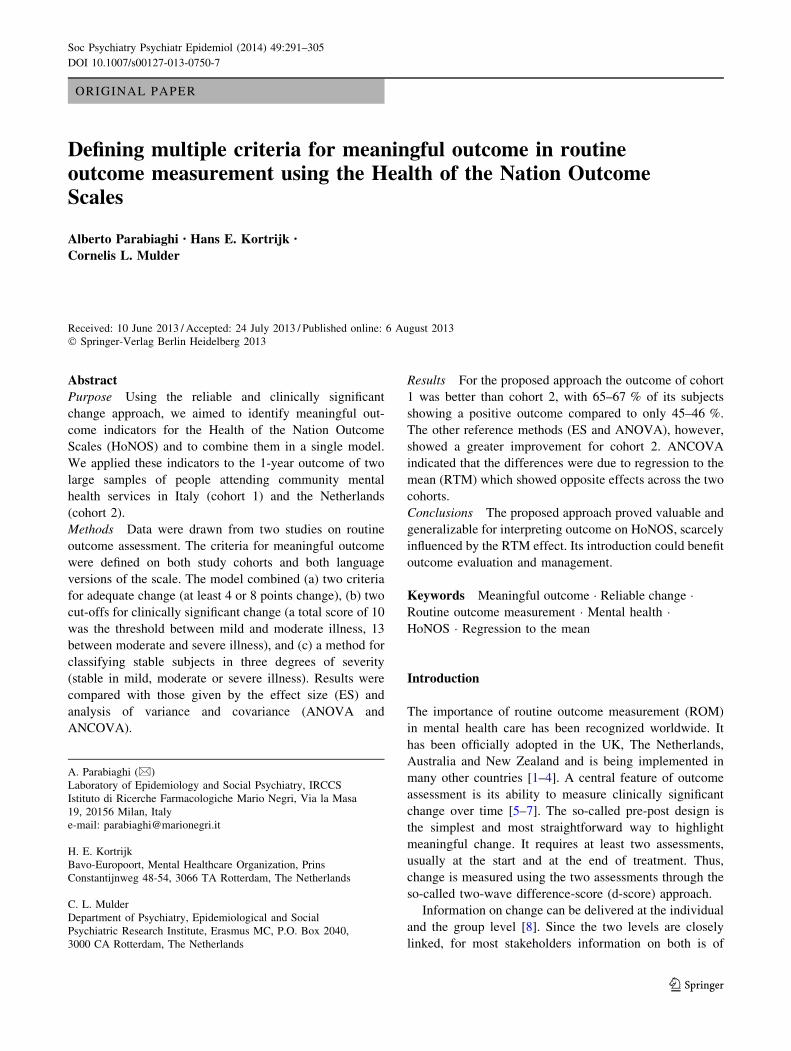
Application of the combined model
for the interpretation of meaningful outcome
The application of the combined criteria (RC and SEM
with CS cut-offs) on both cohorts’ follow-up resulted in the
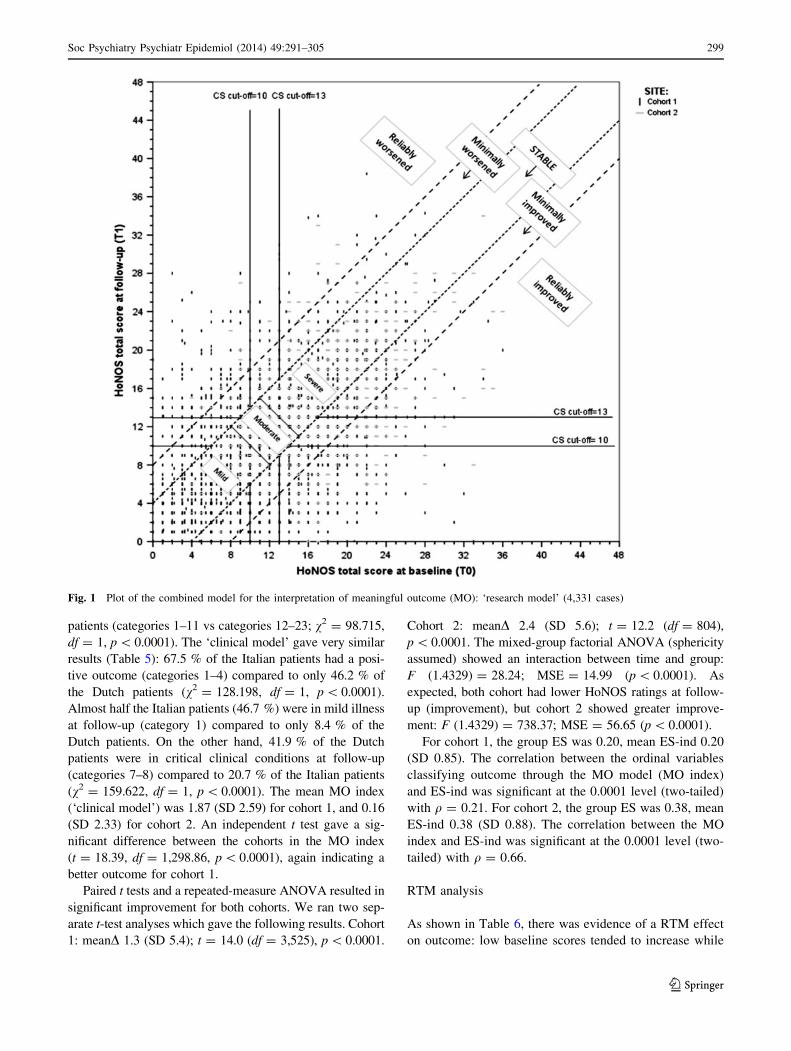
formation of 23 outcome groups (Table 4). Figure 1 illus-
trates the 1-year change of patients from both sites.
As discussed above, one of the main problems in clinical
use of the criteria for RCSC is dealing with a high proportion
of ‘‘unchanged’’ subjects [30–32]. The solution we chose
was to divide the group of those who were stable for the SEM
and the RC criteria into three subgroups based on the mean
between the baseline (T0) and the follow-up (T1) score.
Therefore, we added two parallel diagonal lines orthogonal
to the SEM and RC diagonal bands for ‘no change’ to the
original graph by JT. These diagonals divide the bands of ‘no
change’ into three parts: mild illness, moderate illness, and
severe illness (see also Figs. 1, 2) [15]. Thus, the
‘‘unchanged’’ subjects were divided into three subgroups:
those falling to the left of the lower diagonal line had a mean
score (T0 ? T1/2) lower than 10 and were classified as
‘mildly ill’; those falling to the right of the upper diagonal
line had a mean score higher than 13 and were classified as
‘severely ill’; those falling between the two diagonal lines
had a mean score between 10 and 13 and were classified as
‘moderately ill’. This approach takes account of baseline
and follow-up HoNOS ratings and is applied only to those
without a minimal or reliable change at follow-up.
The ‘remitted’ patients (see ‘‘Methods’’) were a sub-
group of those who were ‘‘stable within mild illness’’
(Table 1).
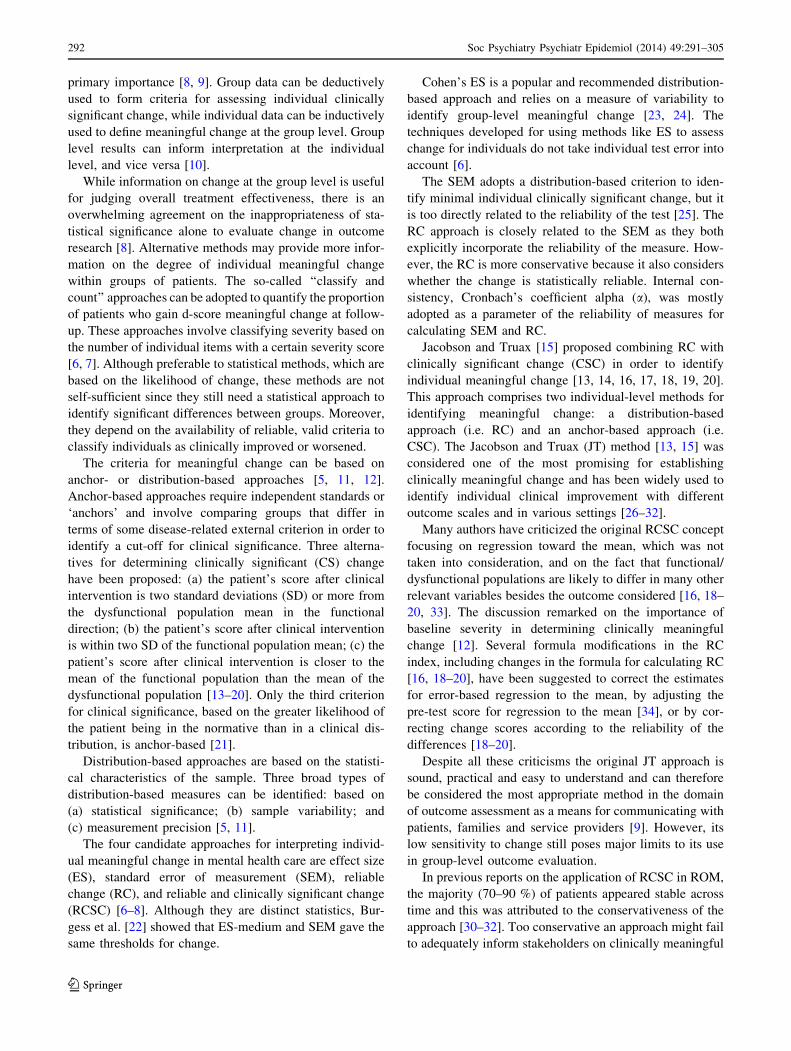
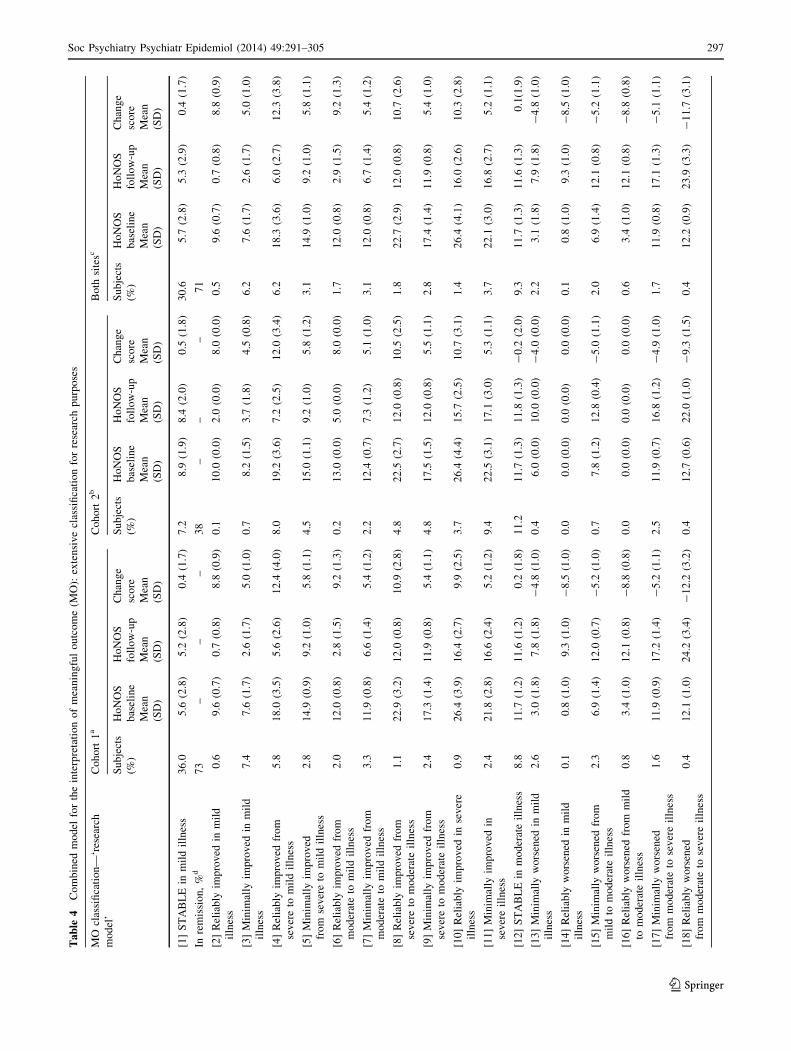
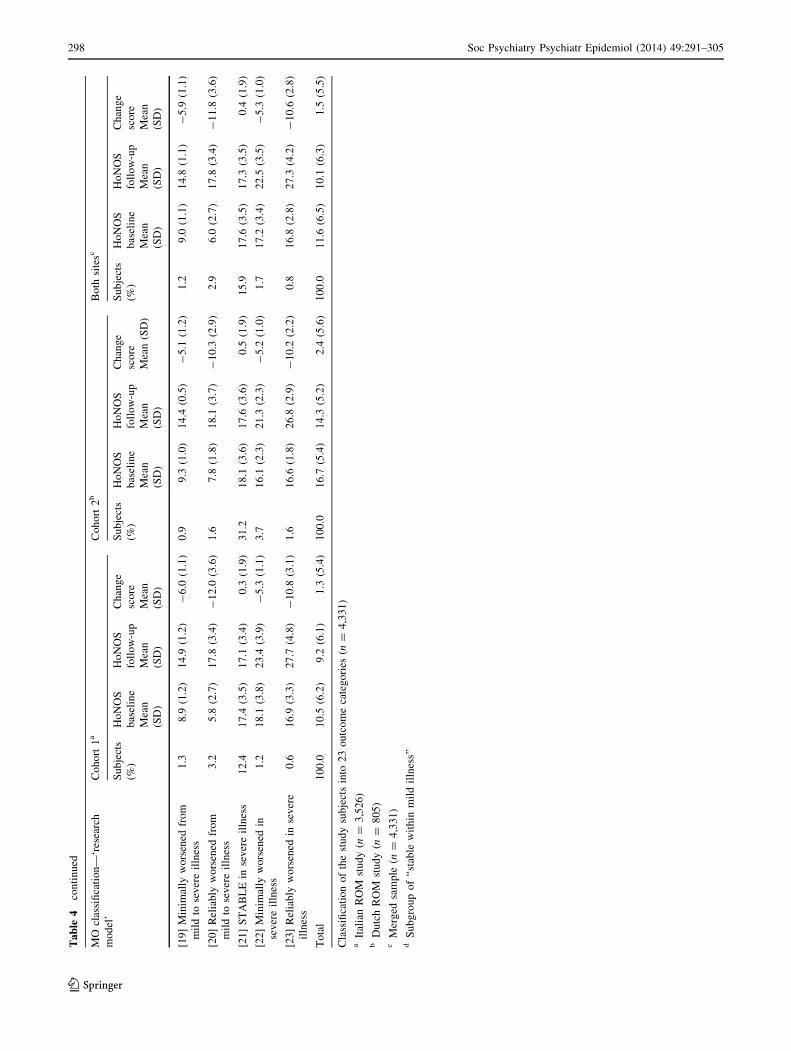
The combined criteria for meaningful outcome (MO
model) resulted in the formation of 23 outcome groups
(Table 4; Fig. 1). This produced a very comprehensive but
also fairly complex model which we propose for research
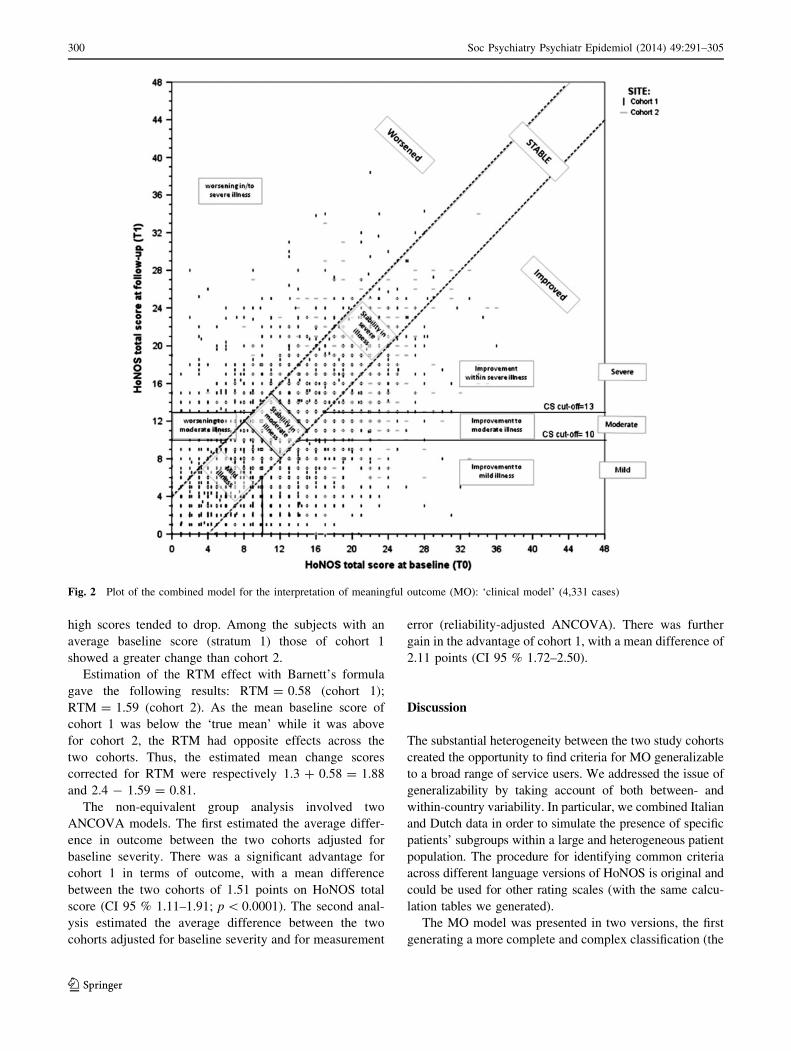
(‘research model’). For the purposes of the present study
(i.e. group-level outcome interpretation) we developed a
simplified model (eight outcome groups) which used only
the SEM criterion and the two cut-offs of clinical signifi-
cance (Table 5; Fig. 2). In this ‘clinical model’ the cate-
gory of ‘mild illness’ comprised both those who were
unchanged in mild illness and those who were mildly ill at
baseline with no change at follow-up. Those who showed a
meaningful improvement were entered in the following
three categories: ‘improvement to mild illness’, ‘improve-
ment to moderate illness’, and ‘improvement within severe
illness’ (respectively for mild, moderate or severe illness at
follow-up). Those who showed a meaningful worsening at
follow-up were divided into two categories: ‘worsening to
moderate illness’ and ‘worsening in or to severe illness’.
Empirical evaluation of the MO model
For the ‘research model’ cohort 1 had a better outcome than
cohort 2 (Table 4). 64.7 % of the Italian patients had a
positive outcome compared to only 45.8 % of the Dutch
Table 3 Proportions of meaningfully improved or worsened patients according to SEM/RC and individual ES (ES-ind)
ES-ind classification SEM/RC classification Total
Worsened
(RC90 %)
Worsened
(SEM)
Stable (no
SEM)
Improved
(SEM)
Improved
(RC90 %)
Worsened (DES great change) 209 (58.2 %) 150 (41.8 %) 0 (0.0 %) 0 (0.0 %) 0 (0.0 %) 359 (100.0 %)
Worsened (DES small to moderate
change)
0 (0.0 %) 231 (33.6 %) 457 (66.4 %) 0 (0.0 %) 0 (0.0 %) 688 (100.0 %)
Stable (DES no change) 0 (0.0 %) 0 (0.0 %) 1,218 (100.0 %) 0 (0.0 %) 0 (0.0 %) 1,218 (100.0 %)
Improved (DES small to moderate
change)
0 (0.0 %) 0 (0.0 %) 741 (60.5 %) 484 (39.5 %) 0 (0.0 %) 1,225 (100.0 %)
Improved (DES great change) 0 (0.0 %) 0 (0.0 %) 0 (0.0 %) 337 (40.1 %) 504 (59.9 %) 841 (100.0 %)
Total 209 (4.8 %) 381 (8.8 %) 2,416 (55.8 %) 821 (19.0 %) 504 (11.6 %) 4,331 (100.0 %)
Values in italic indicate correct cross-classifications; values in bold indicate incorrect cross-classifications (4,331; counts and percent rows)
296 Soc Psychiatry Psychiatr Epidemiol (2014) 49:291–305
123
Ta
ble
4C
om
bin
edm
od
elfo
rth
ein
terp
reta
tio
no
fm
ean
ing
ful
ou
tco
me
(MO
):ex
ten
siv
ecl
assi
fica
tio
nfo
rre
sear
chp
urp
ose
s
MO
clas
sifi
cati
on
—‘r
esea
rch
mo
del
’
Co
ho
rt1
aC
oh
ort
2b
Bo
thsi
tesc
Su
bje
cts
(%)
Ho
NO
S
bas
elin
e
Mea
n
(SD
)
Ho
NO
S
foll
ow
-up
Mea
n
(SD
)
Ch
ang
e
sco
re
Mea
n
(SD
)
Su
bje
cts
(%)
Ho
NO
S
bas
elin
e
Mea
n
(SD
)
Ho
NO
S
foll
ow
-up
Mea
n
(SD
)
Ch
ang
e
sco
re
Mea
n
(SD
)
Su
bje
cts
(%)
Ho
NO
S
bas
elin
e
Mea
n
(SD
)
Ho
NO
S
foll
ow
-up
Mea
n
(SD
)
Ch
ang
e
sco
re
Mea
n
(SD
)
[1]
ST
AB
LE
inm
ild
illn
ess
36
.05
.6(2
.8)
5.2
(2.8
)0
.4(1
.7)
7.2
8.9
(1.9
)8
.4(2
.0)
0.5
(1.8
)3
0.6
5.7
(2.8
)5
.3(2
.9)
0.4
(1.7
)
Inre
mis
sio
n,
%d
73
––
–3
8–
––
71
[2]
Rel
iab
lyim
pro
ved
inm
ild
illn
ess
0.6
9.6
(0.7
)0
.7(0
.8)
8.8
(0.9
)0
.11
0.0
(0.0
)2
.0(0
.0)
8.0
(0.0
)0
.59
.6(0
.7)
0.7
(0.8
)8
.8(0
.9)
[3]
Min
imal
lyim
pro
ved
inm
ild
illn
ess
7.4
7.6
(1.7
)2
.6(1
.7)
5.0
(1.0
)0
.78
.2(1
.5)
3.7
(1.8
)4
.5(0
.8)
6.2
7.6
(1.7
)2
.6(1
.7)
5.0
(1.0
)
[4]
Rel
iab
lyim
pro
ved
fro
m
sev
ere
tom
ild
illn
ess
5.8
18
.0(3
.5)
5.6
(2.6
)1
2.4
(4.0
)8
.01
9.2
(3.6
)7
.2(2
.5)
12
.0(3
.4)
6.2
18
.3(3
.6)
6.0
(2.7
)1
2.3
(3.8
)
[5]
Min
imal
lyim
pro
ved
fro
mse
ver
eto
mil
dil
lnes
s
2.8
14
.9(0
.9)
9.2
(1.0
)5
.8(1
.1)
4.5
15
.0(1
.1)
9.2
(1.0
)5
.8(1
.2)
3.1
14
.9(1
.0)
9.2
(1.0
)5
.8(1
.1)
[6]
Rel
iab
lyim
pro
ved
fro
m
mo
der
ate
tom
ild
illn
ess
2.0
12
.0(0
.8)
2.8
(1.5
)9
.2(1
.3)
0.2
13
.0(0
.0)
5.0
(0.0
)8
.0(0
.0)
1.7
12
.0(0
.8)
2.9
(1.5
)9
.2(1
.3)
[7]
Min
imal
lyim
pro
ved
fro
m
mo
der
ate
tom
ild
illn
ess
3.3
11
.9(0
.8)
6.6
(1.4
)5
.4(1
.2)
2.2
12
.4(0
.7)
7.3
(1.2
)5
.1(1
.0)
3.1
12
.0(0
.8)
6.7
(1.4
)5
.4(1
.2)
[8]
Rel
iab
lyim
pro
ved
fro
m
sev
ere
tom
od
erat
eil
lnes
s
1.1
22
.9(3
.2)
12
.0(0
.8)
10
.9(2
.8)
4.8
22
.5(2
.7)
12
.0(0
.8)
10
.5(2
.5)
1.8
22
.7(2
.9)
12
.0(0
.8)
10
.7(2
.6)
[9]
Min
imal
lyim
pro
ved
fro
m
sev
ere
tom
od
erat
eil
lnes
s
2.4
17
.3(1
.4)
11
.9(0
.8)
5.4
(1.1
)4
.81
7.5
(1.5
)1
2.0
(0.8
)5
.5(1
.1)
2.8
17
.4(1
.4)
11
.9(0
.8)
5.4
(1.0
)
[10
]R
elia
bly
imp
rov
edin
sev
ere
illn
ess
0.9
26
.4(3
.9)
16
.4(2
.7)
9.9
(2.5
)3
.72
6.4
(4.4
)1
5.7
(2.5
)1
0.7
(3.1
)1
.42
6.4
(4.1
)1
6.0
(2.6
)1
0.3
(2.8
)
[11
]M
inim
ally
imp
rov
edin
sev
ere
illn
ess
2.4
21
.8(2
.8)
16
.6(2
.4)
5.2
(1.2
)9
.42
2.5
(3.1
)1
7.1
(3.0
)5
.3(1
.1)
3.7
22
.1(3
.0)
16
.8(2
.7)
5.2
(1.1
)
[12
]S
TA
BL
Ein
mo
der
ate
illn
ess
8.8
11
.7(1
.2)
11
.6(1
.2)
0.2
(1.8
)1
1.2
11
.7(1
.3)
11
.8(1
.3)
-0
.2(2
.0)
9.3
11
.7(1
.3)
11
.6(1
.3)
0.1
(1.9
)
[13
]M
inim
ally
wo
rsen
edin
mil
d
illn
ess
2.6
3.0
(1.8
)7
.8(1
.8)
-4
.8(1
.0)
0.4
6.0
(0.0
)1
0.0
(0.0
)-
4.0
(0.0
)2
.23
.1(1
.8)
7.9
(1.8
)-
4.8
(1.0
)
[14
]R
elia
bly
wo
rsen
edin
mil
d
illn
ess
0.1
0.8
(1.0
)9
.3(1
.0)
-8
.5(1
.0)
0.0
0.0
(0.0
)0
.0(0
.0)
0.0
(0.0
)0
.10
.8(1
.0)
9.3
(1.0
)-
8.5
(1.0
)
[15
]M
inim
ally
wo
rsen
edfr
om
mil
dto
mo
der
ate
illn
ess
2.3
6.9
(1.4
)1
2.0
(0.7
)-
5.2
(1.0
)0
.77
.8(1
.2)
12
.8(0
.4)
-5
.0(1
.1)
2.0
6.9
(1.4
)1
2.1
(0.8
)-
5.2
(1.1
)
[16
]R
elia
bly
wo
rsen
edfr
om
mil
d
tom
od
erat
eil
lnes
s
0.8
3.4
(1.0
)1
2.1
(0.8
)-
8.8
(0.8
)0
.00
.0(0
.0)
0.0
(0.0
)0
.0(0
.0)
0.6
3.4
(1.0
)1
2.1
(0.8
)-
8.8
(0.8
)
[17
]M
inim
ally
wo
rsen
ed
fro
mm
od
erat
eto
sev
ere
illn
ess
1.6
11
.9(0
.9)
17
.2(1
.4)
-5
.2(1
.1)
2.5
11
.9(0
.7)
16
.8(1
.2)
-4
.9(1
.0)
1.7
11
.9(0
.8)
17
.1(1
.3)
-5
.1(1
.1)
[18
]R
elia
bly
wo
rsen
ed
fro
mm
od
erat
eto
sev
ere
illn
ess
0.4
12
.1(1
.0)
24
.2(3
.4)
-1
2.2
(3.2
)0
.41
2.7
(0.6
)2
2.0
(1.0
)-
9.3
(1.5
)0
.41
2.2
(0.9
)2
3.9
(3.3
)-
11
.7(3
.1)
Soc Psychiatry Psychiatr Epidemiol (2014) 49:291–305 297
123
Ta
ble
4co
nti
nu
ed
MO
clas
sifi
cati
on
—‘r
esea
rch
mo
del
’
Co
ho
rt1
aC
oh
ort
2b
Bo
thsi
tesc
Su
bje
cts
(%)
Ho
NO
S
bas
elin
e
Mea
n
(SD
)
Ho
NO
S
foll
ow
-up
Mea
n
(SD
)
Ch
ang
e
sco
re
Mea
n
(SD
)
Su
bje
cts
(%)
Ho
NO
S
bas
elin
e
Mea
n
(SD
)
Ho
NO
S
foll
ow
-up
Mea
n
(SD
)
Ch
ang
e
sco
re
Mea
n(S
D)
Su
bje
cts
(%)
Ho
NO
S
bas
elin
e
Mea
n
(SD
)
Ho
NO
S
foll
ow
-up
Mea
n
(SD
)
Ch
ang
e
sco
re
Mea
n
(SD
)
[19
]M
inim
ally
wo
rsen
edfr
om
mil
dto
sev
ere
illn
ess
1.3
8.9
(1.2
)1
4.9
(1.2
)-
6.0
(1.1
)0
.99
.3(1
.0)
14
.4(0
.5)
-5
.1(1
.2)
1.2
9.0
(1.1
)1
4.8
(1.1
)-
5.9
(1.1
)
[20
]R
elia
bly
wo
rsen
edfr
om
mil
dto
sev
ere
illn
ess
3.2
5.8
(2.7
)1
7.8
(3.4
)-
12
.0(3
.6)
1.6
7.8
(1.8
)1
8.1
(3.7
)-
10
.3(2
.9)
2.9
6.0
(2.7
)1
7.8
(3.4
)-
11
.8(3
.6)
[21
]S
TA
BL
Ein
sev
ere
illn
ess
12
.41
7.4
(3.5
)1
7.1
(3.4
)0
.3(1
.9)
31
.21
8.1
(3.6
)1
7.6
(3.6
)0
.5(1
.9)
15
.91
7.6
(3.5
)1
7.3
(3.5
)0
.4(1
.9)
[22
]M
inim
ally
wo
rsen
edin
sev
ere
illn
ess
1.2
18
.1(3
.8)
23
.4(3
.9)
-5
.3(1
.1)
3.7
16
.1(2
.3)
21
.3(2
.3)
-5
.2(1
.0)
1.7
17
.2(3
.4)
22
.5(3
.5)
-5
.3(1
.0)
[23
]R
elia
bly
wo
rsen
edin
sev
ere
illn
ess
0.6
16
.9(3
.3)
27
.7(4
.8)
-1
0.8
(3.1
)1
.61
6.6
(1.8
)2
6.8
(2.9
)-
10
.2(2
.2)
0.8
16
.8(2
.8)
27
.3(4
.2)
-1
0.6
(2.8
)
To
tal
10
0.0
10
.5(6
.2)
9.2
(6.1
)1
.3(5
.4)
10
0.0
16
.7(5
.4)
14
.3(5
.2)
2.4
(5.6
)1
00
.01
1.6
(6.5
)1
0.1
(6.3
)1
.5(5
.5)
Cla
ssifi
cati
on
of
the
stu
dy
sub
ject
sin
to2
3o
utc
om
eca
teg
ori
es(n
=4
,33
1)
aIt
alia
nR
OM
stu
dy
(n=
3,5
26
)b
Du
tch
RO
Mst
ud
y(n
=8
05
)c
Mer
ged
sam
ple
(n=
4,3
31
)d
Su
bg
rou
po
f‘‘
stab
lew
ith
inm
ild
illn
ess’
’
298 Soc Psychiatry Psychiatr Epidemiol (2014) 49:291–305
123
patients (categories 1–11 vs categories 12–23; v2 = 98.715,
df = 1, p \ 0.0001). The ‘clinical model’ gave very similar
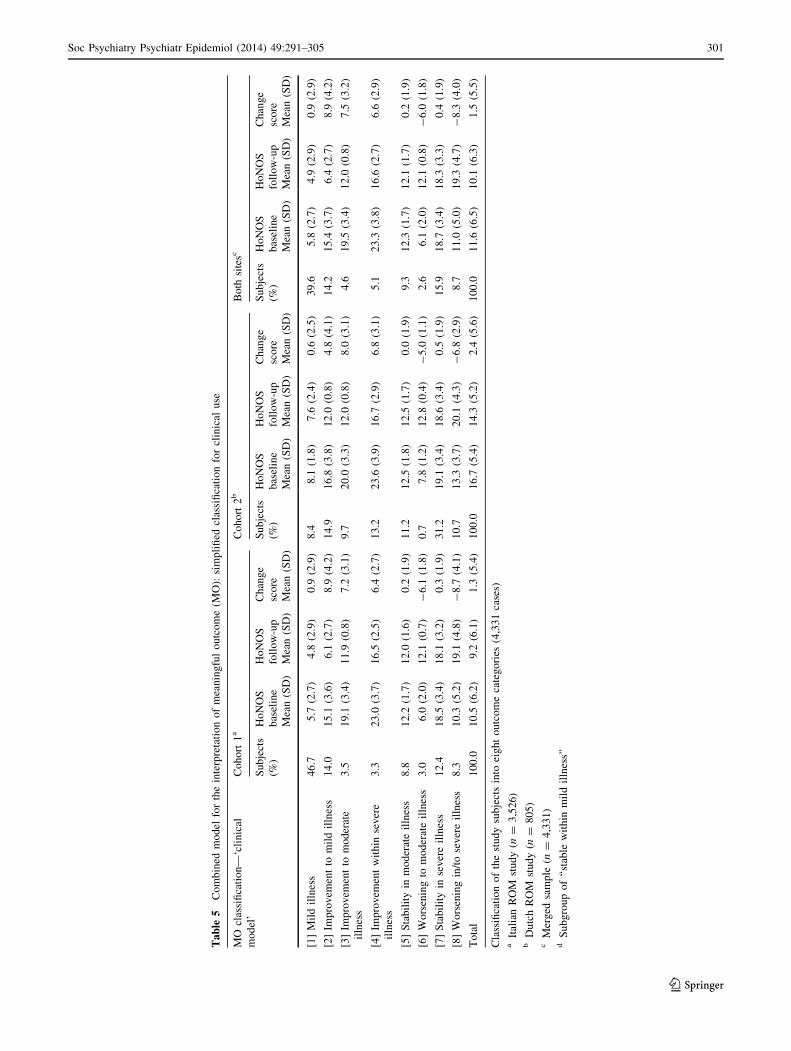
results (Table 5): 67.5 % of the Italian patients had a posi-
tive outcome (categories 1–4) compared to only 46.2 % of
the Dutch patients (v2 = 128.198, df = 1, p \ 0.0001).
Almost half the Italian patients (46.7 %) were in mild illness
at follow-up (category 1) compared to only 8.4 % of the
Dutch patients. On the other hand, 41.9 % of the Dutch
patients were in critical clinical conditions at follow-up
(categories 7–8) compared to 20.7 % of the Italian patients
(v2 = 159.622, df = 1, p \ 0.0001). The mean MO index
(‘clinical model’) was 1.87 (SD 2.59) for cohort 1, and 0.16
(SD 2.33) for cohort 2. An independent t test gave a sig-
nificant difference between the cohorts in the MO index
(t = 18.39, df = 1,298.86, p \ 0.0001), again indicating a
better outcome for cohort 1.
Paired t tests and a repeated-measure ANOVA resulted in
significant improvement for both cohorts. We ran two sep-
arate t-test analyses which gave the following results. Cohort
1: meanD 1.3 (SD 5.4); t = 14.0 (df = 3,525), p \ 0.0001.
Cohort 2: meanD 2.4 (SD 5.6); t = 12.2 (df = 804),
p \ 0.0001. The mixed-group factorial ANOVA (sphericity
assumed) showed an interaction between time and group:
F (1.4329) = 28.24; MSE = 14.99 (p \ 0.0001). As
expected, both cohort had lower HoNOS ratings at follow-
up (improvement), but cohort 2 showed greater improve-
ment: F (1.4329) = 738.37; MSE = 56.65 (p \ 0.0001).
For cohort 1, the group ES was 0.20, mean ES-ind 0.20
(SD 0.85). The correlation between the ordinal variables
classifying outcome through the MO model (MO index)
and ES-ind was significant at the 0.0001 level (two-tailed)
with q = 0.21. For cohort 2, the group ES was 0.38, mean
ES-ind 0.38 (SD 0.88). The correlation between the MO
index and ES-ind was significant at the 0.0001 level (two-
tailed) with q = 0.66.
RTM analysis
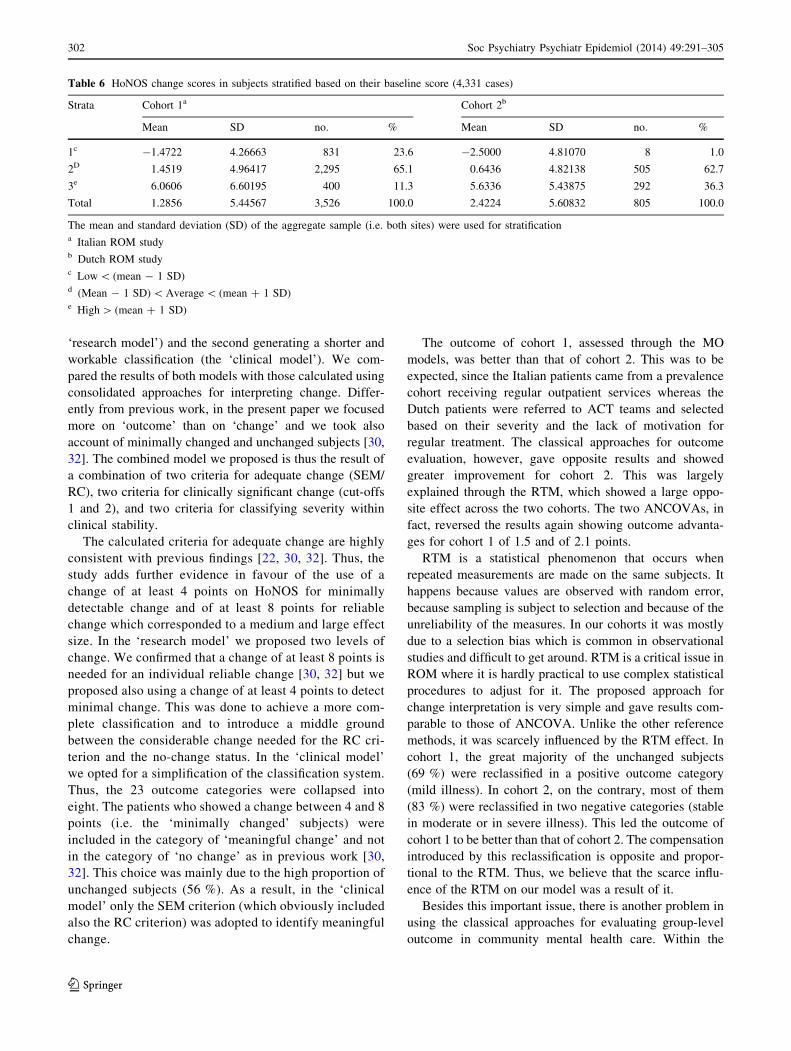
As shown in Table 6, there was evidence of a RTM effect
on outcome: low baseline scores tended to increase while
Fig. 1 Plot of the combined model for the interpretation of meaningful outcome (MO): ‘research model’ (4,331 cases)
Soc Psychiatry Psychiatr Epidemiol (2014) 49:291–305 299
123
high scores tended to drop. Among the subjects with an
average baseline score (stratum 1) those of cohort 1
showed a greater change than cohort 2.
Estimation of the RTM effect with Barnett’s formula
gave the following results: RTM = 0.58 (cohort 1);
RTM = 1.59 (cohort 2). As the mean baseline score of
cohort 1 was below the ‘true mean’ while it was above
for cohort 2, the RTM had opposite effects across the
two cohorts. Thus, the estimated mean change scores
corrected for RTM were respectively 1.3 ? 0.58 = 1.88
and 2.4 - 1.59 = 0.81.
The non-equivalent group analysis involved two
ANCOVA models. The first estimated the average differ-
ence in outcome between the two cohorts adjusted for
baseline severity. There was a significant advantage for
cohort 1 in terms of outcome, with a mean difference
between the two cohorts of 1.51 points on HoNOS total
score (CI 95 % 1.11–1.91; p \ 0.0001). The second anal-
ysis estimated the average difference between the two
cohorts adjusted for baseline severity and for measurement
error (reliability-adjusted ANCOVA). There was further
gain in the advantage of cohort 1, with a mean difference of
2.11 points (CI 95 % 1.72–2.50).
Discussion
The substantial heterogeneity between the two study cohorts
created the opportunity to find criteria for MO generalizable
to a broad range of service users. We addressed the issue of
generalizability by taking account of both between- and
within-country variability. In particular, we combined Italian
and Dutch data in order to simulate the presence of specific
patients’ subgroups within a large and heterogeneous patient
population. The procedure for identifying common criteria
across different language versions of HoNOS is original and
could be used for other rating scales (with the same calcu-
lation tables we generated).
The MO model was presented in two versions, the first
generating a more complete and complex classification (the
Fig. 2 Plot of the combined model for the interpretation of meaningful outcome (MO): ‘clinical model’ (4,331 cases)
300 Soc Psychiatry Psychiatr Epidemiol (2014) 49:291–305
123
Ta
ble
5C
om
bin
edm
od
elfo
rth
ein
terp
reta
tio
no
fm
ean
ing
ful
ou
tco
me
(MO
):si
mp
lifi
edcl
assi
fica
tio
nfo
rcl
inic
alu
se
MO
clas
sifi
cati
on
—‘c
lin
ical
mo
del
’
Co
ho
rt1
aC
oh
ort
2b
Bo
thsi
tesc
Su
bje
cts
(%)
Ho
NO
S
bas
elin
e
Mea
n(S
D)
Ho
NO
S
foll
ow
-up
Mea
n(S
D)
Ch
ang
e
sco
re
Mea
n(S
D)
Su
bje
cts
(%)
Ho
NO
S
bas
elin
e
Mea
n(S
D)
Ho
NO
S
foll
ow
-up
Mea
n(S
D)
Ch
ang
e
sco
re
Mea
n(S
D)
Su
bje
cts
(%)
Ho
NO
S
bas
elin
e
Mea
n(S
D)
Ho
NO
S
foll
ow
-up
Mea
n(S
D)
Ch
ang
e
sco
re
Mea
n(S
D)
[1]
Mil
dil
lnes
s4
6.7
5.7
(2.7
)4
.8(2
.9)
0.9
(2.9
)8
.48
.1(1
.8)
7.6
(2.4
)0
.6(2
.5)
39
.65
.8(2
.7)
4.9
(2.9
)0
.9(2
.9)
[2]
Imp
rov
emen
tto
mil
dil
lnes
s1
4.0
15
.1(3
.6)
6.1
(2.7
)8
.9(4
.2)
14
.91
6.8
(3.8
)1
2.0
(0.8
)4
.8(4
.1)
14
.21
5.4
(3.7
)6
.4(2
.7)
8.9
(4.2
)
[3]
Imp
rov
emen
tto
mo
der
ate
illn
ess
3.5
19
.1(3
.4)
11
.9(0
.8)
7.2
(3.1
)9
.72
0.0
(3.3
)1
2.0
(0.8
)8
.0(3
.1)
4.6
19
.5(3
.4)
12
.0(0
.8)
7.5
(3.2
)
[4]
Imp
rov
emen
tw
ith
inse
ver
e
illn
ess
3.3
23
.0(3
.7)
16
.5(2
.5)
6.4
(2.7
)1
3.2
23
.6(3
.9)
16
.7(2
.9)
6.8
(3.1
)5
.12
3.3
(3.8
)1
6.6
(2.7
)6
.6(2
.9)
[5]
Sta
bil
ity
inm
od
erat
eil
lnes
s8
.81
2.2
(1.7
)1
2.0
(1.6
)0
.2(1
.9)
11
.21
2.5
(1.8
)1
2.5
(1.7
)0
.0(1
.9)
9.3
12
.3(1
.7)
12
.1(1
.7)
0.2
(1.9
)
[6]
Wo
rsen
ing
tom
od
erat
eil
lnes
s3
.06
.0(2
.0)
12
.1(0
.7)
-6
.1(1
.8)
0.7
7.8
(1.2
)1
2.8
(0.4
)-
5.0
(1.1
)2
.66
.1(2
.0)
12
.1(0
.8)
-6
.0(1
.8)
[7]
Sta
bil
ity
inse
ver
eil
lnes
s1
2.4
18
.5(3
.4)
18
.1(3
.2)
0.3
(1.9
)3
1.2
19
.1(3
.4)
18
.6(3
.4)
0.5
(1.9
)1
5.9
18
.7(3
.4)
18
.3(3
.3)
0.4
(1.9
)
[8]
Wo
rsen
ing
in/t
ose
ver
eil
lnes
s8
.31
0.3
(5.2
)1
9.1
(4.8
)-
8.7
(4.1
)1
0.7
13
.3(3
.7)
20
.1(4
.3)
-6
.8(2
.9)
8.7
11
.0(5
.0)
19
.3(4
.7)
-8
.3(4
.0)
To
tal
10
0.0
10
.5(6
.2)
9.2
(6.1
)1
.3(5
.4)
10
0.0
16
.7(5
.4)
14
.3(5
.2)
2.4
(5.6
)1
00
.01
1.6
(6.5
)1
0.1
(6.3
)1
.5(5
.5)
Cla
ssifi
cati
on
of
the
stu
dy
sub
ject
sin
toei
gh
to
utc
om
eca
teg
ori
es(4
,33
1ca
ses)
aIt
alia
nR
OM
stu
dy
(n=
3,5
26
)b
Du
tch
RO
Mst
ud
y(n
=8
05
)c
Mer
ged
sam
ple
(n=
4,3
31
)d
Su
bg
rou
po
f‘‘
stab
lew
ith
inm
ild
illn
ess’
’
Soc Psychiatry Psychiatr Epidemiol (2014) 49:291–305 301
123
‘research model’) and the second generating a shorter and
workable classification (the ‘clinical model’). We com-
pared the results of both models with those calculated using
consolidated approaches for interpreting change. Differ-
ently from previous work, in the present paper we focused
more on ‘outcome’ than on ‘change’ and we took also
account of minimally changed and unchanged subjects [30,
32]. The combined model we proposed is thus the result of
a combination of two criteria for adequate change (SEM/
RC), two criteria for clinically significant change (cut-offs
1 and 2), and two criteria for classifying severity within
clinical stability.
The calculated criteria for adequate change are highly
consistent with previous findings [22, 30, 32]. Thus, the
study adds further evidence in favour of the use of a
change of at least 4 points on HoNOS for minimally
detectable change and of at least 8 points for reliable
change which corresponded to a medium and large effect
size. In the ‘research model’ we proposed two levels of
change. We confirmed that a change of at least 8 points is
needed for an individual reliable change [30, 32] but we
proposed also using a change of at least 4 points to detect
minimal change. This was done to achieve a more com-
plete classification and to introduce a middle ground
between the considerable change needed for the RC cri-
terion and the no-change status. In the ‘clinical model’
we opted for a simplification of the classification system.
Thus, the 23 outcome categories were collapsed into
eight. The patients who showed a change between 4 and 8
points (i.e. the ‘minimally changed’ subjects) were
included in the category of ‘meaningful change’ and not
in the category of ‘no change’ as in previous work [30,
32]. This choice was mainly due to the high proportion of
unchanged subjects (56 %). As a result, in the ‘clinical
model’ only the SEM criterion (which obviously included
also the RC criterion) was adopted to identify meaningful
change.
The outcome of cohort 1, assessed through the MO
models, was better than that of cohort 2. This was to be
expected, since the Italian patients came from a prevalence
cohort receiving regular outpatient services whereas the
Dutch patients were referred to ACT teams and selected
based on their severity and the lack of motivation for
regular treatment. The classical approaches for outcome
evaluation, however, gave opposite results and showed
greater improvement for cohort 2. This was largely
explained through the RTM, which showed a large oppo-
site effect across the two cohorts. The two ANCOVAs, in
fact, reversed the results again showing outcome advanta-
ges for cohort 1 of 1.5 and of 2.1 points.
RTM is a statistical phenomenon that occurs when
repeated measurements are made on the same subjects. It
happens because values are observed with random error,
because sampling is subject to selection and because of the
unreliability of the measures. In our cohorts it was mostly
due to a selection bias which is common in observational
studies and difficult to get around. RTM is a critical issue in
ROM where it is hardly practical to use complex statistical
procedures to adjust for it. The proposed approach for
change interpretation is very simple and gave results com-
parable to those of ANCOVA. Unlike the other reference
methods, it was scarcely influenced by the RTM effect. In
cohort 1, the great majority of the unchanged subjects
(69 %) were reclassified in a positive outcome category
(mild illness). In cohort 2, on the contrary, most of them
(83 %) were reclassified in two negative categories (stable
in moderate or in severe illness). This led the outcome of
cohort 1 to be better than that of cohort 2. The compensation
introduced by this reclassification is opposite and propor-
tional to the RTM. Thus, we believe that the scarce influ-
ence of the RTM on our model was a result of it.
Besides this important issue, there is another problem in
using the classical approaches for evaluating group-level
outcome in community mental health care. Within the
Table 6 HoNOS change scores in subjects stratified based on their baseline score (4,331 cases)
Strata Cohort 1a Cohort 2b
Mean SD no. % Mean SD no. %
1c -1.4722 4.26663 831 23.6 -2.5000 4.81070 8 1.0
2D 1.4519 4.96417 2,295 65.1 0.6436 4.82138 505 62.7
3e 6.0606 6.60195 400 11.3 5.6336 5.43875 292 36.3
Total 1.2856 5.44567 3,526 100.0 2.4224 5.60832 805 100.0
The mean and standard deviation (SD) of the aggregate sample (i.e. both sites) were used for stratificationa Italian ROM studyb Dutch ROM studyc Low \ (mean - 1 SD)d (Mean - 1 SD) \ Average \ (mean ? 1 SD)e High [ (mean ? 1 SD)
302 Soc Psychiatry Psychiatr Epidemiol (2014) 49:291–305
123
wider groups of routine patients there are substantial sub-
groups suffering from chronic conditions for whom the
maintenance of a non-severe, stable health status remains a
valid therapeutic goal [8]. In such cases the statistical
significance of improvement can only be a function of
sample size and not of change size. On the other hand, the
more conservative methods based on individual meaning-
ful difference (i.e. RC, SEM or ES) inevitably show no
measurable change in those subgroups and are thus
impossible to interpret (as classification is lacking). The
advocated MO approach gave a better description of the
outcomes assessed by HoNOS and allowed a more ade-
quate comparison of the two quite different cohorts of
patients.
Limitations
The present study suffers several limitations. First,
although it is acknowledged by the Australian Mental
Health Outcomes & Classification Network the classify-
and-count approach adopted is based on an arbitrary clas-
sification [6, 30]. However, the two resulting CS cut-offs
are consistent with previous results [30, 32]. In particular,
the cut-off of 10 separating moderate from mild illness is
consistent with the results of a recent study that calculated
the CS threshold through a more valid and acceptable
approach [32]. Thus, our results can anyway be considered
valid and generalizable.
Second, the positions of the three subgroups of stable
patients in the classification hierarchy are also the result of
an arbitrary choice. Third, there are no reference data on
HoNOS rating scores, i.e. how severely mentally ill
patients progress over time. So the reference (whether the
outcome is positive or not) currently involves the clini-
cian’s judgment and the patient’s treatment goals. Fourth,
the MO approach, as conceived in this study, is only
applicable to HoNOS total scores. Thus, information on
changes in the individual items or subscales is lost.
Fifth, the patients to whom the model was applied were
all outpatients. It is therefore unknown whether our find-
ings could be applicable to inpatients or to residential
services. In the first case, as patients in community-based
mental health services are usually admitted to hospital in
the acute phase we would expect to select subjects at their
worst. Their margin for improvement should therefore be
wider and the RTM dramatically more evident. In the
second case, on the contrary, we would expect to recruit
stabilized patients whose clinical assessment would likely
be affected by floor effect. In both cases the application of
our model could produce different results.
Sixth, as we aggregated data across two very different
clinical samples, from different countries, with different
outcome measurement traditions, and as the non-equivalent
group analysis approach could deal only with a defined set
of non-equivalences, we are not able to know to what
extent our model is able to cope with the differences we
could not account for.
Implications
It is not sufficient to look at the ES or at the change scores for
proper interpretation of pre-post HoNOS data. The proposed
approach proved valuable for interpreting outcome on the
group level. It is simple and practical, so, it could be adopted
for routine outcome evaluation and management. On the
patient level the ‘clinical model’ could be used to measure
and monitor treatment effect and guide progress. It could also
serve as feedback information for clinicians and patients.
Clinicians could be trained to use this evidence-based
information to take clinical decisions, to help decide whether
to continue a treatment as it is or even to end it if appropriate
(when a patient shows prolonged stability in mild illness).
When the outcome is negative (stable in severe illness) cli-
nicians could consider changing the treatment plan [47]. This
very simple and practical approach may not only help in
tailoring interventions, but may also improve communication
between patients and clinicians and discussion about treat-
ment and its progress [48].
Conflict of interest The authors declare no conflict of interest.
Appendix
The standard error of a measurement (SEM) was calculated
as:SEM ¼ SD1�pð1� aÞ (where SD1 is the standard
deviation of the baseline observations and a is Cronbach’s
coefficient).
SEM difference = sqrt (2 9 (SEM 9 SEM))
The RC index was calculated as:
RC 90 % = 1.65 9 SEM diff
Effect size (ES): Cohen’s d was calculated as the dif-
ference between two means divided by a pooled standard
deviation.
ES ¼ �x1 � �x2
Spooled
The original standard deviations for the two means
(baseline = 1; follow-up = 2) are used to compute the
pooled standard deviation.
Spooled ¼p ðn1 � 1Þs2
1 þ ðn2 � 1Þs22
n1 þ n2
Cohen’s rule of thumb was used to interpret results:
ES\0:2! no change; 0:5\ES\0:8!moderate change;
Soc Psychiatry Psychiatr Epidemiol (2014) 49:291–305 303
123
0:2\ES\0:5! small change; ES [ 0:8! great change:
We considered: �x1� �x2 ¼DES(where D is the degree of
change needed to classify change as small, moderate or great
according to ES) and we calculated:
DESsmallchange ¼ 0:2� Spooled
DESmoderatechange ¼ 0:5� Spooled
DESgreatchange ¼ 0:8� Spooled
The individual effect size was calculated as the
difference between baseline and follow-up scores of each
individual divided by the pooled standard deviation.
ES ¼ x1 � x2
Spooled
According to the results of this calculation subjects were
classified as ‘‘unchanged’’ (indES \ 0.2); ‘‘weakly
changed’’ (0.2 \ indES \ 0.5). ‘‘moderately changed’’
(0.5 \ indES \ 0.8), and ‘‘greatly changed’’ (indES [0.8). This classification was applied in the directions of
improvement and worsening.
The CS cut-off for clinical significance was calculated
as:
CS cut - off ¼ meanclin � SDnormð Þ þ meannorm � SDclinð ÞSDnorm + SDclin
(where meanclin and meannorm are the mean scores of the
‘dysfunctional population’ and the ‘functional population’,
respectively, and SDnorm and SDclin are the standard
deviations of the scores in these two groups)
RTM effect ¼ r2wpðr2wþ r2bÞCðzÞ ¼ rtð1� qÞCðzÞ;
� 1� q� 1
The total variance is r2t ¼ r2
w þ r2b; the within-subject
variance is r2w ¼ ð1� qÞ r2
t , the between-subject variance
is r2b ¼ qr2
t and q is the correlation between the two
measurements.
CðzÞ ¼ /ðzÞ=UðzÞ
The terms /(z) and U(z) are respectively the probability
density and the cumulative distribution functions of the
standard normal distribution. z = (C - l)/rt if the subjects
are selected using a baseline measurement greater than C,
and z = (l - C)/rt if the subjects are selected using a
baseline measurement less than C; l is the population
mean.1
References
1. Department of Health (2001) Mental health information strategy.
Department of Health, London
2. Commonwealth Department of Health and Ageing (2002)
National outcome and casemix collection: overview of clinical
measures and data items. Commonwealth Department of Health
and Ageing, Canberra
3. Ministry of Health (2005) National mental health information
strategy 2005–2010. Ministry of Health, Wellington
4. Trauer T (2010) Outcome measurement around the world. In:
Trauer T (ed) Outcome measurement in mental health. Cam-
bridge University Press, Cambridge, pp 13–101
5. Norman GR, Sridhar FG, Guyatt GH (2001) Relation of distri-
bution- and anchor-based approaches in interpretation of changes
in health-related quality of life. Med Care 39:1039–1047
6. Burgess P, Pirkis J (2008) Key performance indicators for Aus-
tralian Public Mental Health Services—potential contributions of
MH-NOCC data: developing indicators of effectiveness Version
2.0, Brisbane, Queensland
7. Eisen SV, Ranganathan G, Seal P, Spiro A 3rd (2007) Measuring
clinically meaningful change following mental health treatment.
J Behav Health Serv Res 34:272–289
8. Trauer T (2010) Assessment of change in outcome measurement.
In: Trauer T (ed) Outcome measurement in mental health.
Cambridge University Press, Cambridge, pp 206–218
9. Speer DC (1999) What is the role of two-wave designs in clinical
research? Comment on Hageman and Arrindell. Behav Res Ther
37:1203–1210
10. Cella D, Bullinger M, Scott C, Barofsky I et al (2002) Group vs
individual approaches to understanding the clinical significance
of differences or changes in quality of life. Mayo Clin Proc
77:384–392
11. Lydick E, Epstein RS (1993) Interpretation of quality of life
changes. Qual Life Res 2:221–226
12. Crosby RD, Kolotkin RL, Williams GR (2003) Defining clini-
cally meaningful change in health-related quality of life. J Clin
Epidemiol 56:395–407
13. Jacobson NS, Follette WC, Revenstorf D, Baucom DH et al
(1984) Variability in outcome and clinical significance of
behavioral marital therapy: a reanalysis of outcome data. J Con-
sult Clin Psychol 52:497–504
14. Christensen L, Mendoza JL (1986) A method of assessing change
in a single subject: an alteration of the RC index. Behav Therapy
17:305–308
15. Jacobson NS, Truax P (1991) Clinical significance: a statistical
approach to defining meaningful change in psychotherapy
research. J Consult Clin Psychol 59:12–19
16. Hageman WJ, Arrindell WA (1993) A further refinement of the
reliable change (RC) index by improving the pre-post difference
score: introducing RCID. Behav Res Ther 31:693–700
17. Evans C, Margison F, Barkham M (1998) The contribution of
reliable and clinically significant change methods to evidence-
based mental health. Evid Based Ment Health 1:70–72
18. Hageman WJ, Arrindell WA (1999) Establishing clinically sig-
nificant change: increment of precision and the distinction
between individual and group level of analysis. Behav Res Ther
37:1169–1193
19. Hsu LM (1999) A comparison of three methods of identifying
reliable and clinically significant client changes: commentary on
Hageman and Arrindell. Behav Res Ther 37:1195–1202
20. Hageman WJ, Arrindell WA (1999) Clinically significant and
practical! Enhancing precision does make a difference. Reply to
McGlinchey and Jacobson, Hsu, and Speer. Behav Res Ther
37:1219–1233
1 The population mean should be a known true mean in a population.
In the present study, the mean of the aggregate sample (i.e. both sites)
was used as an estimate of l.
304 Soc Psychiatry Psychiatr Epidemiol (2014) 49:291–305
123
21. McGlinchey JB, Atkins DC, Jacobson NS (2002) Clinical sig-
nificance methods: which one to use and how useful are they?
Behav Ther 33:529–550
22. Burgess P, Pirkis J, Coombs T (2009) Modelling candidate
effectiveness indicators for mental health services. Aust N Z J
Psychiatry 43:531–538
23. Cohen J (1969) Statistical power analysis for the behavioural
sciences. Academic Press, London
24. Kazis LE, Anderson JJ, Meenan RF (1989) Effect sizes for
interpreting changes in health status. Med Care 27(Suppl
3):178–189
25. McHorney CA, Tarlov AR (1995) Individual-patient monitoring
in clinical practice: are available health status surveys adequate?
Qual Life Res 4:293–307
26. Grundy CT, Lambert MJ, Grundy EM (1996) Assessing clinical
significance: application to the Hamilton Rating Scale for
depression. J Ment Health 5:25–33
27. Hafkenscheid A (2000) Psychometric measures of individual
change: an empirical comparison with the Brief Psychiatric
Rating Scale (BPRS). Acta Psychiatr Scand 101:235–242
28. Audin K, Margison FR, Clark JM, Barkham M (2001) Value of
HoNOS in assessing patient change in NHS psychotherapy and
psychological treatment services. Br J Psychiatry 178:561–566
29. Matthey S (2004) Calculating clinically significant change in
postnatal depression studies using the Edinburgh Postnatal
Depression Scale. J Affect Disord 78:269–272
30. Parabiaghi A, Barbato A, D’Avanzo B, Erlicher A et al (2005)
Assessing reliable and clinically significant change on Health of
the Nation Outcome Scales: method for displaying longitudinal
data. Aust N Z J Psychiatry 39:719–725
31. Barbato A, Parabiaghi A, Panicali F, Battino N et al (2011) Do
patients improve after short psychiatric admission? A cohort
study in Italy. Nord J Psychiatry 65:251–258
32. Parabiaghi A, Rapisarda F, D’Avanzo B, Erlicher A et al (2011)
Measuring clinical change in routine mental health care: differ-
ences between first time and longer term service users. Aust N Z J
Psychiatry 45:558–568
33. Bauer S, Lambert MJ, Nielsen SL (2003) Clinical significance
methods: a comparison of statistical techniques. J Pers Assess
82:60–70
34. Speer DC (1992) Clinically significant change: jacobson & Truax
(1991) revisited. J Consult Clin Psych 60:402–408
35. Kortrijk HE, Staring AB, van Baars AW, Mulder CL (2010)
Involuntary admission may support treatment outcome and
motivation in patients receiving assertive community treatment.
Soc Psychiatry Psychiatr Epidemiol 45:245–252
36. Kortrijk HE, Mulder CL, Drukker M, Wiersma D, Duivenvoor-
den HJ (2012) Duration of assertive community treatment and the
interpretation of routine outcome data. Aust N Z J Psychiatry
46:240–248
37. Wing JK, Beevor AS, Curtis RH, Park SB, Hadden S, Burns A
(1998) Health of the Nation Outcome Scales (HoNOS). Research
and development. Br J Psychiatry 172:11–18
38. Pirkis JE, Burgess PM, Kirk PK, Dodson S, Coombs TJ, Wil-
liamson MK (2005) A review of the psychometric properties of
the Health of the Nation Outcome Scales (HoNOS) family of
measures. Health Qual Life Outcomes 3:76
39. Rossi R, Blaco R, Castelli C, Civenti G et al (1999) Il costo dei
pazienti psichiatrici per classi di gravita. Epidemiol Psichiatr Soc
7:198–208
40. Lora A, Bai G, Bianchi S, Bolongaro G et al (2001) La versione
italiana della HoNOS (Health of the Nation Outcome Scales), una
scala per la valutazione della gravita e dell’esito nei servizi di
salute mentale. Epidemiol Psichiatr Soc 10:198–212
41. Mulder CL, Staring ABP, Loos J, Buwalda V et al (2004) De
Health of the Nations Outcome Scales (HoNOS) als instrument
voor routine outcome assessment. Tijdschr Psychiatr 46:273–285
42. Lelliott P (1999) Definition of severe mental illness. In: Charl-
wood P, Mason A, Goldacre M, Cleary R, Wilkinson E (eds)
Health outcome indicators: severe mental illness. Report of a
working group to the Department of Health. National Centre for
Health Outcomes Development, Oxford, pp 87–93
43. Barnett AG, Van Der Pols JC, Dobson AJ (2005) Regression to
the mean: what it is and how to deal with it. Int J Epidemiol
34:215–220
44. Gardner MJ, Heady JA (1973) Some effects of within-person
variability. J Chronic Dis 26:781–795
45. Davis CE (1976) The effect of regression to the mean in epide-
miologic and clinical studies. Am J Epidemiol 104:493–498
46. http://www.socialresearchmethods.net/kb/regrmean.php. Acces-
sed on April 2013
47. Harmon C, Hawkins EJ, Lambert MJ, Slade K, Whipple JS
(2005) Improving outcomes for poorly responding clients: the use
of clinical support tools and feedback to clients. J Clin Psychol
61:175–185
48. Drukker M, Bak M, a Campo J, Driessen G, van Os J, Delespaul
P (2010) The cumulative needs for care monitor: a unique
monitoring system in the south of the Netherlands. Soc Psychi-
atry Psychiatr Epidemiol 45:475–485
Soc Psychiatry Psychiatr Epidemiol (2014) 49:291–305 305
123