defining super-enhancer landscape in triple-negative
TRANSCRIPT

Defining super-enhancer landscape in triple-negative breast cancer by multiomic profiling
Huang, Hao; Hu, Jianyang; Maryam, Alishba; Huang, Qinghua; Zhang, Yuchen;Ramakrishnan, Saravanan; Li, Jingyu; Ma, Haiying; Ma, Victor W. S.; Cheuk, Wah; So, GraceY. K.; Wang, Wei; Cho, William C. S.; Zhang, Liang; Chan, Kui Ming; Wang, Xin; Chin, Y.RebeccaPublished in:Nature Communications
Published: 01/01/2021
Document Version:Final Published version, also known as Publisher’s PDF, Publisher’s Final version or Version of Record
License:CC BY
Publication record in CityU Scholars:Go to record
Published version (DOI):10.1038/s41467-021-22445-0
Publication details:Huang, H., Hu, J., Maryam, A., Huang, Q., Zhang, Y., Ramakrishnan, S., Li, J., Ma, H., Ma, V. W. S., Cheuk, W.,So, G. Y. K., Wang, W., Cho, W. C. S., Zhang, L., Chan, K. M., Wang, X., & Chin, Y. R. (2021). Defining super-enhancer landscape in triple-negative breast cancer by multiomic profiling. Nature Communications, 12, [2242].https://doi.org/10.1038/s41467-021-22445-0
Citing this paperPlease note that where the full-text provided on CityU Scholars is the Post-print version (also known as Accepted AuthorManuscript, Peer-reviewed or Author Final version), it may differ from the Final Published version. When citing, ensure thatyou check and use the publisher's definitive version for pagination and other details.
General rightsCopyright for the publications made accessible via the CityU Scholars portal is retained by the author(s) and/or othercopyright owners and it is a condition of accessing these publications that users recognise and abide by the legalrequirements associated with these rights. Users may not further distribute the material or use it for any profit-making activityor commercial gain.Publisher permissionPermission for previously published items are in accordance with publisher's copyright policies sourced from the SHERPARoMEO database. Links to full text versions (either Published or Post-print) are only available if corresponding publishersallow open access.
Take down policyContact [email protected] if you believe that this document breaches copyright and provide us with details. We willremove access to the work immediately and investigate your claim.
Download date: 15/02/2022

ARTICLE
Defining super-enhancer landscape intriple-negative breast cancer by multiomic profilingHao Huang1,6, Jianyang Hu1,2,6, Alishba Maryam1, Qinghua Huang3, Yuchen Zhang1, Saravanan Ramakrishnan1,
Jingyu Li 1,2, Haiying Ma 1,2, Victor W. S. Ma4, Wah Cheuk5, Grace Y. K. So5, Wei Wang1,
William C. S. Cho 4, Liang Zhang 1,2, Kui Ming Chan 1,2, Xin Wang 1,2✉ & Y. Rebecca Chin 1,2✉
Breast cancer is a heterogeneous disease, affecting over 3.5 million women worldwide, yet
the functional role of cis-regulatory elements including super-enhancers in different breast
cancer subtypes remains poorly characterized. Triple-negative breast cancer (TNBC) is an
aggressive subtype of breast cancer with a poor prognosis. Here we apply integrated epi-
genomic and transcriptomic profiling to uncover super-enhancer heterogeneity between
breast cancer subtypes, and provide clinically relevant biological insights towards TNBC.
Using CRISPR/Cas9-mediated gene editing, we identify genes that are specifically regulated
by TNBC-specific super-enhancers, including FOXC1 and MET, thereby unveiling a
mechanism for specific overexpression of the key oncogenes in TNBC. We also identify
ANLN as a TNBC-specific gene regulated by super-enhancer. Our studies reveal a TNBC-
specific epigenomic landscape, contributing to the dysregulated oncogene expression in
breast tumorigenesis.
https://doi.org/10.1038/s41467-021-22445-0 OPEN
1 Department of Biomedical Sciences, City University of Hong Kong, Kowloon, Hong Kong. 2 Key Laboratory of Biochip Technology, Biotech and Health Centre,Shenzhen Research Institute, City University of Hong Kong, Shenzhen, China. 3Department of Breast Surgery, The Affiliate Tumor Hospital, Guangxi MedicalUniversity, Nanning, China. 4 Department of Clinical Oncology, Queen Elizabeth Hospital, Kowloon, Hong Kong. 5 Department of Pathology, Queen ElizabethHospital, Kowloon, Hong Kong. 6These authors contributed equally: Hao Huang, Jianyang Hu. ✉email: [email protected]; [email protected]
NATURE COMMUNICATIONS | (2021) 12:2242 | https://doi.org/10.1038/s41467-021-22445-0 | www.nature.com/naturecommunications 1
1234
5678
90():,;

Breast cancer is the most common cancer and the leadingcause of cancer death among women worldwide1. Mole-cular studies based on gene expression profiles have
revealed different breast cancer subtypes: luminal, HER2+/ER−,and basal like. The majority of basal-like tumors (~70%) aretriple-negative (ER-/PR-/HER2-)2,3. Chemotherapy, usually withhigh toxicity, is the main treatment option for triple-negativebreast cancer (TNBC), thus underscoring the clinical need foridentifying novel therapeutic targets for this aggressive subtype.Key genomic alterations associated with different subtypes ofbreast cancer, including PTEN, PIK3CA, HER2, BRCA, andTP53, have been comprehensively characterized. However, thelack of common genetic alternations in TNBC has limitedthe development of targeted therapies for this malignancy. On theother hand, the knowledge of deregulation of breast cancer epi-genome in different subtypes that leads to various phenotypicoutcomes remains poorly understood.
Transcriptome reprogramming is one of the critical features ofcancer, where aberrant oncogene or tumor suppressor expressioncontributes to tumor initiation, progression, and metastasis. Itcan be due to genetic changes such as copy numbers, chromo-somal rearrangement, and somatic mutations of protein-codinggenes. Gene expression alteration could also be caused by cis-element changes in noncoding genomic regions where tran-scription factors (TFs) or other regulators bind to4,5. Alteration ofthese epigenomic marks has been shown to play important rolesin the development of different diseases including cancers. Forexample, cryptic promoters with modified histone marks wereidentified to drive gastric malignancy6.
Enhancers are noncoding regions of the genome that harborcis-regulatory elements and promote transcription of a targetgene. They are characterized by histone modifications such asacetylation of histone H3 at lysine 27 (H3K27ac) and binding ofcoactivators such as p3007. Super-enhancers (SEs) are largeclusters of enhancers that drive specific expression programs thatdefine cellular identity8. They have been associated with differentdisease states such as the enrichment of enhancer clusters inpancreatic islet cells of Type 2 diabetes individuals9. It has beenshown recently that SEs also play a critical role in upregulatingthe expression of cancer driver genes10,11. For example, focalamplifications of SEs that drive MYC expression have beenidentified in multiple epithelial cancers7. In gastric cancer,reprogramming and heterogeneity of SEs are observed duringtumorigenesis, underpinning TF occupancy, and diseaseoutcome12. Recently, CD47 and ERG are shown to be upregulatedby SEs in breast and prostate cancer, respectively13,14. It has alsobeen demonstrated that in neuroblastoma, expression of PRRX1alters the SE and mRNA landscapes toward a mesenchymalstate15. Epigenomic profiling has been done in various solidtumors, including medulloblastoma16 and colon cancer17, foridentifying subgroup-specific SEs. However, comprehensive cat-alogs of SEs in different subtypes of breast cancer, and theirfunctional importance in tumorigenesis, are not published yet.
In this study, we aim at characterizing the SE landscape inbreast cancer. To dissect the heterogeneity of SEs in TNBC andnon-TNBC subtypes, we perform integrative transcriptomic andepigenomic analyses, and provide evidence that SEs play animportant role in characterizing subtype-specific identity. We alsoidentify corresponding targeting genes of TNBC-specific SEs,including FOXC1, MET, and ANLN. The critical function of TFFOXC1 in breast cancer growth and its clinical relevance has beendetermined18,19. Phenotypically, overexpression of FOXC1 resultsin increased tumor growth and migration. However, very fewstudies have addressed the regulatory network of FOXC1. Here,our network biology analysis defines FOXC1 as the major node inregulating the expression of invasion and metastasis signature
genes. Using CRISPR/Cas9 genomic editing, we delete theFOXC1-associated SE, and find a significant reduction of FOXC1expression, as well as impairment of spheroid and clonogenicgrowth, consistent with its oncogenic properties. In addition, weidentify ANLN as a TNBC-specific gene regulated by SE, con-tributing to TNBC tumorigenicity. Taken together, our multiomicanalysis has revealed breast cancer subtype-specific SE regulatorymechanisms, and we have characterized the critical function ofSEs in the specific oncogenic signaling of TNBC.
ResultsA landscape of putative distal super-enhancers of breast cancercell lines. Through high-throughput cis-regulatory elementmapping, epigenomic dysregulation including SE heterogeneity,has emerged to play critical roles in the pathogenesis of variouscancer types12,16. In breast cancer, it has been demonstrated thatenhancer transcription can be used to improve the fidelity offunctional enhancer identification20. However, the knowledge forsubtype-dependent heterogeneity of breast cancer is lacking.Here, we collected the ChIP-seq data of 17 public breast cancercell lines and two triple-negative (TN), immortalized breast celllines (Supplementary Table 1), genome-widely identified andprofiled the landscapes of SEs for different subtypes of breastcancer.
We annotated genome-wide cis-regulatory elements based onchromatin profiles identified by H3K27ac ChIP-seq signals,previously shown to mark active enhancers and other regulatoryregions21. We focused on regions enriched with H3K27ac signalsand located distant from transcriptional start sites (TSSs) of genes(up/downstream of 2.5 kb of TSSs), which were demonstrated byprevious studies to be enhancer regions12. Next, SEs wereidentified from predicted active enhancers by fitting the sizedistribution of enhancers and identification of the inflectionpoints (slope 1) using LOESS regression in the nineteen breastlines (Fig. 1a, Supplementary Table 2). For predicted SEs andtypical enhancers, higher enrichment of H3K27ac andH3K4me1 signals (active markers in enhancer regions) and lowerH3K4me3 signals (active markers in TSS) were observed, whichwere also consistent with the previous findings22,23. To explorethe subtype-dependent heterogeneity of breast cancer, we firstcompared the degree of co-occurrence of SEs between TNBC andnon-TNBC cell lines. We found that the average of within-clusterSE similarity scores (TNBC: 0.265; non-TNBC: 0.291) issignificantly higher than the average of between-cluster similarityscore (0.150) (both P < 0.001, Wilcoxon signed-rank tests),indicating that cell lines belong to the same subtype showed ahigher degree of SE similarity (Fig. 1b). In addition, agreeing withprevious gene expression profiling and enhancer studies20, thetwo TN, immortalized breast lines (MCF-10A, 76NF2V) showstrong SE similarities with TNBC lines. Interestingly, TNBC cellline MDA-MB-468 showed a higher cross-subtype similarity withnon-TNBC cell lines. By comparing the genome-wide loci of SEsand taking their union regions, we detected 6284 union-non-TNBC SEs and 9996 union-TNBC SEs, of which 7333 are TNBCspecific (Fig. 1c). The distributions of TNBC and non-TNBC SEsin the genome are similar (Fig. 1d). The majority of SEs werelocated in the distal intergenic and intron regions, which patternsare also found in other tumor types24,25.
To further explore the heterogeneity of genome-wide SEprofiles in different subtypes of breast cancer, we employed anetwork-based approach to investigate the association of 19 celllines (Fig. 1e). More specifically, we built a network of SEsimilarities, where nodes represent cell lines, and weighted edgesencoded Jaccard similarity coefficients quantifying the co-occurrence of SEs between cell lines. Using the cutoffs on the
ARTICLE NATURE COMMUNICATIONS | https://doi.org/10.1038/s41467-021-22445-0
2 NATURE COMMUNICATIONS | (2021) 12:2242 | https://doi.org/10.1038/s41467-021-22445-0 | www.nature.com/naturecommunications

degree of SE co-occurrence (Jaccard similarity coefficient > 0.1)and statistical significance (BH-adjusted P < 0.001, Hypergeo-metric tests), only significant associations were retained to buildthe network (Supplementary Data 1). Markov cluster algorithm(MCL)26,27 was employed to detect the presence of networkclusters that would indicate subtype patterns. Consequently,two clusters were detected based on SE properties: cluster 1
encompasses 6 TNBC lines and 2 TN, immortalized breast lines,whereas cluster 2 consists of 8 non-TNBC cell lines and 1 TNBCcell line. Because the intersection of the cell lines MCF7 andCAL51 with others was relatively small, and the fact that theydid not meet the thresholding conditions of our network(Supplementary Data 1, Jaccard similarity coefficient > 0.1 andHypergeometric test BH-adjusted P < 0.001), these two cell lines
a
c d
e
b
Subtype typeTN, immortalizedTN, basal likeLuminal ALuminal BHER2+
0.40.20.1
Source type
Jaccard index
No. of super-enhancers
Mammary Gland, FibrocysticAdenocarcinomaDuctal CarcinomaInvasive Ductal CarcinomaMammary Breast Epithelium
1000 2000 3000
Cluster 1 Cluster 2
HCC1937
BT-549
MDA-MB-231
SUM159
SUM149
MDA-MB-436
MCF-10A
76NF2V
HCC1954
MDA-MB-361
AU565
BT-474SKBR3
UACC812
ZR-75-1
MDA-MB-468
T-47-D
TNBC super-enhancers non-TNBC super-enhancers
7333 36212663
5' UTR3' UTR Exon
Intron Downstream (<= 300)Distal Intergenic
3.98%6.98%
12.95%
30.01%0.96%
45.12% 44.29%
4.76%8.83%
13.49%
27.74%0.89%
CAL51
BT549
MC
F-10A
76NF2V
HC
C1937
MD A-M
B-436
MDA-M
B-231
SUM
149
SUM
159
MDA-M
B-468
HC
C1954
SKBR3
A U565
U ACC
812
ZR-75-1
MD A-M
B-361
BT474
T-47-D
MC
F-7
CAL51
BT549
MCF-10A
76NF2V
HCC1937
MDA-MB-436
MDA-MB-231
SUM149
SUM159
MDA-MB-468
HCC1954
SKBR3
AU565
UACC812
ZR-75-1
MDA-MB-361
BT474
T-47-D
MCF-7
0
0.2
0.4
0.6
0.8
1
% s
uper
-enh
ance
rs o
verla
pped
0
010
000
2000
030
000
5000
040
000
enhancer rank
enha
ncer
siz
e (b
p)
supe
r-enh
ance
rs
10000 20000 30000 40000
typical-enhancers
H3K27acH3K4me1H3K4me3
0.0
0.1
0.2
0.3
0.4
0.5
typical-enhancers super-enhancers
CPM
TNBC non-TNBC
NATURE COMMUNICATIONS | https://doi.org/10.1038/s41467-021-22445-0 ARTICLE
NATURE COMMUNICATIONS | (2021) 12:2242 | https://doi.org/10.1038/s41467-021-22445-0 | www.nature.com/naturecommunications 3

were excluded from the network and downstream analyses. Ournetwork-based approach revealed that the clustering of SEs issufficient to characterize the subtype identity (TNBC vs. non-TNBC), without prior knowledge of the transcriptomes ormarkers.
Multiomic characterizations of TNBC-specific super-enhan-cers. For more comprehensive characterizations at multiomiclevels, we focused on SEs that are significantly enriched ordepleted for H3K27ac signal in TNBC cell lines compared to non-TNBC cell lines (|log2 fold enrichment|> 1 & BH-adjusted P <0.05, Wilcoxon signed-rank tests). As a result, the 3035 TNBC-specific and 1765 non-TNBC-specific SEs showed distinct pat-terns of H3K27ac enrichment, and many oncogenes (e.g. FOXC1,MET, and MYC) are associated with the predicted TNBC-specificSEs (Fig. 2a, b). For example, MET, a receptor tyrosine kinasefrequently altered in solid cancers28, was found to be located neara highly active SE in the TNBC lines (Fig. 2c).
As the subtype-specific SEs were detected based on H3K27acsignals, we next confirmed if other active or suppressiveepigenetic markers also displayed different patterns in thesubtype-specific SEs. As expected, signal of H3K4me1, a knownactive enhancer marker, was more highly enriched in the TNBC-specific SEs in the TNBC cell lines than the non-TNBClines, and the opposite pattern was observed in the non-TNBC-specific SEs (Fig. 2d, Supplementary Fig. 1a, P < 0.001, Wilcoxonsigned-rank test). On the other hand, H3K27me3 signal,known as a suppressive marker, was depleted in the TNBC-specific SEs in the TNBC cell lines (Fig. 2d, SupplementaryFig. 1b, P < 0.001, Wilcoxon signed-rank test). These dataagree with histone modification profiles reported in previousstudies12,16, and further confirmed the specificity of identifiedsubtype-specific SEs.
Next, we integrated H3K27ac, H3K4me1, H3K4me3,H3K27me3 ChIP-seq data, DNA methylation and gene expres-sion data to investigate potential associations in the SEs andcorresponding genes (promoters). Using gene expression profilesof 15 cell lines obtained from CCLE, we specifically focused oncancer-related genes (obtained from Cancer Gene Census, https://cancer.sanger.ac.uk/census, |log2 fold change| > 0.5 & BH-adjusted P < 0.05) that were differentially expressed between theTNBC and non-TNBC cell lines, and predicted their potentialregulatory SEs within 500 kb of upstream region. Consequently,we identified 29 upregulated cancer-related genes in TNBC celllines and 13 upregulated cancer-related genes in non-TNBC celllines. Using unsupervised classification of active markers,including H3K27ac, H3K4me1, and H3K4me3, in SEs orpromoters of the target genes, we observed similar patternsacross cell lines of the same subtype (Fig. 2e). As expected, thesuppressive marker H3K27me3 was highly enriched in SEs andpromoters of the non-TNBC cell lines. In contrast to histonemodifications and gene expression, DNA methylation did notshow clear differences between the TNBC and non-TNBC cell
lines. These results highlight the dysregulation of cancer-relatedgenes in TNBC governed by histone modifications and theimplication of SEs in these processes.
Integrative network analysis identified a SE-driven masterregulator of invasion and metastasis in TNBC. Previous studieshave shown that cancer cells acquired cancer-specific SEs at geneswhose functions were associated with hallmark biological cap-abilities (or cancer hallmarks) during tumor development10,29. Toelucidate the regulatory role of SEs in cancer hallmarks, we per-formed integrative analysis of the TNBC-specific SEs and geneexpression profiles. Using the TCGA-BRCA dataset, we firstidentified 4501 genes differentially expressed (|log2 fold change | >0.5 & BH-adjusted P < 0.05) between TNBC (n= 115) and non-TNBC samples (n= 605). To explore the functional relevance, weperformed hypergeometric tests to evaluate overrepresentation ofthe differentially expressed genes in 10 cancer hallmark genesetscollected from a previous study10. As a result, we identified threestatistically significant genesets (BH-adjusted P < 0.05) associatedwith cancer hallmarks of “activating invasion and metastasis”,“sustaining proliferative signaling”, and “evading growth sup-pressors” (Supplementary Fig. 2a). To investigate whether SEs areinvolved in the regulation of genes in the dysregulated cancerhallmarks in TNBC, we looked for TNBC-specific SEs 500 kbupstream of genes upregulated in the TNBC samples. Conse-quently, we obtained 331 TNBC-specific SE-target-gene pairs(Supplementary Data 2), significantly associated with cancerhallmarks such as “evading growth suppressors” and “activatinginvasion and metastasis” (Supplementary Fig. 2b). For validation,we analyzed gene expression datasets of cell lines and nine inde-pendent cohorts of patient samples (Supplementary Table 1).Gene set enrichment analysis (GSEA) on these 10 datasets allconfirmed the higher expression of these SE-target genes in TNBC(all P < 1 ×10⁻⁴, Supplementary Fig. 3–5).
It has been shown that the transcriptional program of TNBC isrelatively uniform30, we thereby inferred a SE-based regulatorynetwork using the TCGA-BRCA dataset to elucidate theregulation of cancer-related processes by TNBC-specific TFs.From the TNBC-specific SE-target genes, nine were identified asTFs (with log2 fold change > 1, Fig. 3a) and selected as potentialregulators. 1785 upregulated genes in TNBC (log2 fold change >0.5, BH-adjusted P < 0.05) were selected as potential target genesof the nine TFs. Integrating the gene expression levels of theseTFs and potential target genes, we inferred a regulatory networkbased on the ARACNE algorithm31–33 (details in Methods)(Fig. 3b). To identify putative master regulators for TNBC, weperformed master regulator analysis33, which tests for over-representation of each TF’s regulon for signature genes involvedin a particular biological process. Using this strategy, we identifiedFOXC1 as the only statistically significant master regulator (BH-adjusted P < 0.05, a hypergeometric test, Supplementary Fig. 2c)of the cancer hallmark “activating invasion and metastasis”dysregulated in TNBC. FOXC1, belonging to the forkhead
Fig. 1 Epigenomic profiling identifies putative distal super-enhancers in breast cancer subtypes. a SEs were distinguished from typical enhancers usingLOESS regression, fitting the size distribution of the enhancers followed by identification of the inflection point (slope= 1). Using AU565 cell line as anexample, the identified SEs were enriched for higher H3K27ac and H3K4me1 signals, and lower H3K4me3 signals. b Cell lines belonging to the samesubtype showed a higher degree of co-occurrence of SEs. The matrix shows pair-wise similarity of SEs detected in different cell types. The degree ofsimilarity is colored in proportion to the overlap percentage. The top left part (orange rectangle) represents the TN cell lines, the bottom right part (bluerectangle) represents the non-TNBC cell lines. c Venn diagram shows the number of SEs uniquely found in at least one TNBC and non-TNBC cell lines,respectively, as well as those found both in TNBC and non-TNBC cell lines. d Genome-wide annotations of SEs detected in TNBC and non-TNBC cell lines,respectively. e A network of SE similarities between breast cancer cell lines. Each node represents a cell line and edge width corresponds to the significantJaccard similarity coefficient (BH-adjusted P < 0.001, one-sided hypergeometric test). Based on network partition, two clusters of cell lines were identified,which recapitulates the subtype identify (TNBC vs. non-TNBC).
ARTICLE NATURE COMMUNICATIONS | https://doi.org/10.1038/s41467-021-22445-0
4 NATURE COMMUNICATIONS | (2021) 12:2242 | https://doi.org/10.1038/s41467-021-22445-0 | www.nature.com/naturecommunications

a b
c d
e
MCF10A
RefSeq Genes
76NF2V
HCC1937
BT-549
MDA-MB-436
MDA-MB-231
SUM149
SUM159
MDA-MB-468
SKBR3
AU565
HCC1954
T47D
UACC812
ZR-75-1
MDA-MB-361
BT-474
TNBC
clu
ster
H3K
27ac
sig
nal
non-
TNBC
clu
ster
H3K
27ac
sig
nal
[0-2.00]
MET
TNBC-specific SE
[0-2.00]
[0-2.00]
[0-2.00]
[0-2.00]
[0-2.00]
[0-2.00]
[0-2.00]
[0-2.00]
[0-2.00]
[0-2.00]
[0-2.00]
[0-2.00]
[0-2.00]
[0-2.00]
[0-2.00]
[0-2.00]
50 kb
MCF-10A
76NF2VHCC1937
BT-549MDA-MB-436
MDA-MB-231
SUM149SUM159
MDA-MB-468
SKBR3AU565
HCC1954
T-47-DUACC812
ZR-75-1MDA-MB-361
BT-474
TNBC
-spe
cific
SEs
non-
TNBC
-spe
cific
SEs
chr1chr2chr3chr4chr5chr6chr7chr8chr9chr10chr11chr12chr13chr14chr15chr16chr17chr18chr19chr20chr21chr22chrXchrY
FOXC1
MET
-2.5kb 2.5kb
0.00
0.05
0.10
0.15
0.20
0.25
0.30MCF-10A76NF2VHCC1937MDA-MB-436MDA-MB-231SUM159
MDA-MB-468SKBR3AU565HCC1954T-47-DUACC812ZR-75-1MDA-MB-361
-2.5kb +2.5kb
CPM
CPM
-2.5kb +2.5kb
0.005
0.010
0.015
0.020
0.025
0.030
0.035
0.040
-2.5kb +2.5kb
H3K4me1
H3K27me3
TNBC-speicific SEs
TNBC-speicific SEs non-TNBC-speicific SEs
non-TNBC-speicific SEs
ANLN
MYC
SUM
149M
DA-MB-436
HC
C1937
76NF2V
BT549M
CF10A
MDA-M
B-231SKBR
3AU
565UAC
C812
ZR-75-1
MDA-M
B-361T-47-DBT474M
DA-MB-468
HC
C1954
1.510.50-0.5-1-1.5 1.510.50-0.5-1-1.5
MD
A-MB-436
SUM
159M
CF10A
MD
A-MB-231
76NF2V
HC
C1937
T-47-DSKBR
3AU
565U
ACC
812ZR
-75-1M
DA-M
B-361M
DA-M
B-468H
CC
1954SU
M159
MD
A-MB-436
HC
C1937
MD
A-MB-231
MC
F10A76N
F2VM
DA-M
B-468H
CC
1954SKBR
3AU
565U
ACC
812ZR
-75-1M
DA-M
B-361
UAC
C812
ZR-75-1
MD
A-MB-361
T-47-DSKBR
3AU
565
MD
A-MB-468
MD
A-MB-436
HC
C1954
HC
C1937
76NF2V
MC
F10AM
DA-M
B-231
1.510.50-0.5-1-1.5
BT549C
AL51M
DA-M
B-231AU
565M
DA-M
B-468BT474H
CC
1954U
ACC
812M
CF7
MD
A-MB-361
ZR-75-1
SKBR3
MD
A-MB-436
HC
C1937
T-47-D
10.80.60.40.20
MD
A-MB-468
HC
C1937
SUM
159M
DA-M
B-436M
DA-M
B-231M
CF10A
76NF2V
HC
C1954
AU565
UAC
C812
SKBR3
ZR-75-1
MD
A-MB-361
T-47-D
210-1-2
MD
A-MB-468
ZR-75-1
T-47-DSU
M159
HC
C1937
SKBR3
AU565
MC
F10AM
DA-M
B-23176N
F2VM
DA-M
B-436M
DA-M
B-361U
ACC
812H
CC
1954
210-1-2
UAC
C812
SKBR3
AU565
ZR-75-1
MD
A-MB-361
MD
A-MB-468
HC
C1937
SUM
159
HC
C1954
MD
A-MB-231
MD
A-MB-436
MC
F10A76N
F2V
210-1-2
SKBR3
AU565
T-47-DH
CC
1954M
DA-M
B-231M
DA-M
B-468H
CC
1937M
DA-M
B-361M
DA-M
B-43676N
F2VM
CF10A
ZR-75-1
UAC
C812
1.510.50-0.5-1-1.5
AU565
MD
A-MB-231
MC
F7H
CC
1937M
DA-M
B-468M
DA-M
B-436ZR
-75-1H
CC
1954M
DA-M
B-361BT549C
AL51BT474U
ACC
812SKBR
3T-47-D
10.80.60.40.20
HMGA2FAT4ZEB1ANK1EBF1PAX8
DDR2HOXA11TNFAIP3CARD11PDGFRA
GLI1KDR
SGK1PRDM1
PDGFRBBIRC3
PIM1FLNA
MALT1ARHGAP26
SMAD3ITGAV
TECPPFIBP1
PMLPICALM
MSH6PMS1
PRKAR1ACCDC6LZTR1
RNF213MYH11
IDH2MLLT6RARACCR7
FOXA1RHOH
ERBB2RET
210-1-21.510.50-0.5-1-1.51.510.50-0.5-1-1.5
H3K27ac H3K4me1 H3K4me3 H3K27me3 methylation H3K27ac H3K4me1 H3K4me3 H3K27me3 methylation expression
BT549C
AL51H
CC
1937
MD
A-MB-468
MD
A-MB-436
MD
A-MB-231
HC
C1954
MC
F7M
DA-M
B-361U
ACC
812BT474T-47-DZR
-75-1SKBR
3AU
565
super-enhancer target gene
Fig. 2 Multiomic characterization of subtype-specific super-enhancers. a Heatmap compares H3K27ac enrichment patterns between TNBC-specific SEsand non-TNBC-specific SEs across TNBC and non-TNBC cell lines. b A genome-wide overview of the loci and co-occurrence frequencies of identifiedTNBC-specific SEs in TNBC cell lines. Oncogenes FOXC1, MET and MYC were indicated. c Genome browser plot illustrates TNBC-specific SE detected inthe upstream region of MET. d Higher enrichment of H3K4me1 signals was observed in TNBC-specific SEs in TNBC cell lines than non-TNBC cell lines,whereas H3K27me3 signals were depleted in TNBC-specific SEs in TNBC cell lines. e Heatmaps illustrate gene expression, DNA methylation, H3K27ac,H3K4me1, H3K4me3, H3K27me3 patterns of cancer-related genes in TNBC cell lines compared to non-TNBC cell lines. In each heatmap, the cell lines wereorganized by hierarchical clustering, with labels colored in orange and blue highlighting TN lines and non-TNBC lines, respectively.
NATURE COMMUNICATIONS | https://doi.org/10.1038/s41467-021-22445-0 ARTICLE
NATURE COMMUNICATIONS | (2021) 12:2242 | https://doi.org/10.1038/s41467-021-22445-0 | www.nature.com/naturecommunications 5

family of TFs which is characterized by a distinct DNA-bindingforkhead domain, is associated with an activated TNBC-specificSE nearby (Fig. 3c). It was noted that a strong CTCF peak wasobserved right upstream of the promoter region of FOXC1 innon-TNBC-subtype cell line MCF-7 but not in TN, immortalizedbreast line MCF-10A, suggesting the potential insulator functionin blocking the transcription of FOXC1 in non-TNBC. These
results suggest that the subtype-dependent SE potentiallyregulates the expression of FOXC1, which plays a central rolein the transcription reprogramming of invasion and metastasis inTNBC.
TNBC-specific FOXC1 super-enhancer is required for tumorspheroid growth and invasion. The clinical significance of
a
[0 - 5.00]
FOXC1[0 - 2.00]
TNBC-specific SE
MCF-10A CTCF
MCF-7 CTCF
MCF-10A
76NF2V
HCC1937
BT-549
MDA-MB-436
MDA-MB-231
SUM149
SUM159
MDA-MB-468
SKBR3
AU565
HCC1954
T-47-D
UACC812
ZR-75-1
MDA-MB-361
BT-474
20 kb
XXX
TNBC
clu
ster
H3K
27ac
sig
nal
non-
TNBC
clu
ster
H3K
27ac
sig
nal
CTC
F
c d
f
ih
e
b
BARX1
ELF5
EN1
ETV4FOXC1
FOXM1
OSR1SOX9
TFCP2L1
0.0
1.0
2.0
3.0
4.0
5.0
6.0
7.0
8.0
0.0 0.5 1.0 1.5 2.0 2.5 3.0 3.5gene expression
H3K
27ac
sig
nal
transcription factorsignature geneother geneup-regulationdown-regulation
0
TF expression
4
0
gene expression
4
BARX1
ELF5 EN1
ETV4FOXC1
FOXM1
OSR1
SOX9
TFCP2L1
2.2 x 10-162.2 x 10⁻¹⁶
2.2 x 10⁻¹⁶
2.2 x 10⁻¹⁶
6
8
10
12
14
16
TNBCHer2
LumA
LumB
Normal
FOXC
1 ex
pres
sion
+++++++++++++++++++++++++++++++++++++++++++++++++++++++++++++++++++++++++++++++++++++++++++++++++++++++++++++++++++++++++++++++++++++++++++++++++++++++++++++++++++++++++++++++++++++++++++++++++++++++++++++++++++++++++++++++++++++++++++++++++++++++++++++++++++++++++++++++++++++++++++++++++++++++++++++++++++++++++++++++++++++++++++++++++++++++++++++++++++++++++++++++++++++++++
++ +++
+++
++++ ++++++++ ++ +++++
++
++0
0.25
0.50
0.75
1.00
0 25 50 75 100
OS
(pro
b.)
+ +FOXC1 low FOXC1 high
P = 3.38 x 10⁻⁶
HR = 1.75 (1.38 - 2.22)
Follow up (months)g
TNBC
non-
TNBC
Actin
FOXC1
T47D
MCF
-7ZR
-75-
1BT
474
MDA
-MB-
468
HCC-
38HC
C-11
43HC
C-70
HCC-
1806
BT-5
49Hs
578T
SUM
159-
PTM
DA-M
B-23
1M
DA-M
B-43
6M
CF10
-DCI
SLuminal Her2+++
TNBC4
3
2
1
0
FOXC
1 st
aini
ng in
sten
sity
sco
re
P < 0.0001
TNBC
non-TNBC
4
3
2
1
0
FOXC
1 st
aini
ng in
sten
sity
sco
re
TNBC
non-TNBC
P < 0.0001
70 KDa
35 KDa
55 KDa
100 KDa
100 μm
ARTICLE NATURE COMMUNICATIONS | https://doi.org/10.1038/s41467-021-22445-0
6 NATURE COMMUNICATIONS | (2021) 12:2242 | https://doi.org/10.1038/s41467-021-22445-0 | www.nature.com/naturecommunications

FOXC1 in TNBC has been well established. Using an indepen-dent clinically annotated breast cancer gene expression dataset,we confirmed the significant upregulation of FOXC1 in TNBCcompared to non-TNBC in METABRIC cohort (Fig. 3d), andhigher expression of FOXC1 correlates with poor overall survivalof breast cancer patients (Fig. 3e). These observations were fur-ther validated by immunohistochemistry in 38 FFPE surgicalbreast tumor samples and 150 samples on tissue microarray(Fig. 3f–h, Supplementary Table 3), in which FOXC1 upregula-tion in TNBC was significantly associated with higher grade (P=9.72 × 10⁻⁵, Chi-square test), Ki67 (P= 6.14 × 10⁻⁴, Chi-squaretest) and tumor-infiltrating lymphocytes (P= 1.54 × 10⁻⁶, Chi-square test). Overexpression of FOXC1 was also observed in apanel of TNBC lines (Fig. 3i). The molecular mechanism bywhich this well-known oncogene is regulated, however, is poorlyunderstood. DNase I hypersensitivity often coincides withenhancer activation. To determine experimentally if an SEmapping approximately 128 kb upstream of FOXC1 drivesFOXC1 expression and tumorigenesis, we focused on two (e1, e2)of the five constituent enhancers within the SE region. e1 and e2regions were chosen based on their greatest sensitivity to DNase Iamong the five constituent enhancers in TNBC cells (Fig. 4a).Using the CRISPR/Cas9 system, we deleted e1 or e2 in threeTNBC lines, and verified deletion with PCR (Fig. 4a). Deletion ofe1 or e2 resulted in marked decrease of FOXC1 expression in allthree lines, demonstrating that FOXC1 is a target gene of theFOXC1 SE (Fig. 4b). Furthermore, deletion of e1 or e2 led to asignificant reduction of clonogenic formation ability, spheroidsize, and tumor growth (Fig. 4c–e), indicating the functionalimportance of FOXC1 SE in TNBC tumorigenicity. MDA-MB-231 cells exhibit an invasive phenotype in 3D culture, whereinvasiveness was reduced upon deletion of e1 or e2 (Fig. 4d),agreeing with the vital role of FOXC1 in TNBC invasion andmetastasis (Fig. 3b)34,35. Indeed, knockdown of FOXC1 byshRNA resulted in morphology changes of TNBC cells, fromspindle-shaped to cuboidal (Supplementary Fig. 6a, Supplemen-tary Fig. 6b). Depletion of FOXC1 also significantly inhibitedspheroid growth, accompanied with decreased invasive pheno-type (Supplementary Fig. 6c). Furthermore, impaired clonogenicformation ability and xenograft growth were observed uponFOXC1 knockdown (Supplementary Fig. 6d, SupplementaryFig. 6e). Overexpression of FOXC1 promoted clonogenic growthof TNBC cells (Supplementary Fig. 6f). Importantly, inhibition ofspheroid growth and invasiveness by FOXC1-SE deletion couldbe rescued by overexpression of FOXC1 (Fig. 4f, SupplementaryFig. 6g). These data point to the critical function of SE in upre-gulating FOXC1 for TNBC development.
By targeting epigenetic regulation, BET inhibitors such as JQ1have shown promising anticancer potential in various types ofcancer including TNBC36. As a first step to characterize the effectof JQ1 on TNBC-specific SEs, ChIP-seq profiles for BRD4 in apanel of JQ1 or DMSO treated breast tumor lines were analyzed(Supplementary Table 1). JQ1 inhibits the binding of BRD4 toTNBC-specific SEs in TNBC lines (Fig. 5a). In contrast, there is aminimal binding of BRD4 to TNBC-specific SEs in the luminalline T47D, in the presence or absence of JQ1. As expected, JQ1has no effect on the levels of H3K27ac in TNBC-specific SEs(Fig. 5b). To validate the enrichment of H3K27ac as well as theeffect of JQ1 on binding of BRD4 and p300 on FOXC1 SE, weperformed ChIP-qPCR on the SE region proximal to the FOXC1gene. We observed significant enrichment of H3K27ac in e1 ande2 regions of TNBC but not luminal cells (Fig. 5c; SupplementaryFig. 7a). Furthermore, treatment of TNBC cells with JQ1 potentlyreduced the binding of BRD4 (Fig. 5d, Supplementary Fig. 7b)and p300 (Fig. 5e, Supplementary Fig. 7c) to the SE. As expected,H3K27ac levels were not affected by JQ1 (Fig. 5c). In line with thefunctional role of SE in regulating FOXC1 expression, JQ1treatment reduced FOXC1 protein and mRNA levels in TNBClines (Fig. 5f, Supplementary Fig. 7d). JQ1 treatment alsosignificantly inhibited TNBC clonogenic and spheroid growth(Fig. 5g, Supplementary Fig. 7e). Extending these analyses topatient samples, we observed a significant enrichment of H3K27acon the FOXC1 SE in TNBC samples as compared to non-TNBCtumors (Fig. 5h), agreeing with the upregulation of FOXC1expression in the majority of TNBC cases (Figs. 3d, f, g, h). Wethen performed luciferase reporter assays for constituent enhan-cers e1–e4 (Fig. 4a). Agreeing with its greatest sensitivity to DNaseI, e1 was found to have the strongest, orientation-independentactivity (Fig. 5i), confirming it as the predominant regulatoryelement in the SE of FOXC1. Finally, we explored TFs associatedwith the constituent enhancer e1 of FOXC1 SE. Interrogating thenucleosome-free regions (NFR) defined by DNase-seq and knownTF binding sites obtained from the JASPAR database (http://jaspar.genereg.net/)37, we discovered 96 candidate TFs binding toconstituent enhancer e1 of SSE245 (Supplementary Data 3). Wefurther performed DNA-pull-down assay followed by massspectrometry analysis, and identified 55 candidate TFs bindingto e1 (Supplementary Fig. 8, Supplementary Data 4), 11 of whichoverlapped with the ones predicted by TFs binding predictionanalysis (Fig. 5j). Of the 11 candidates, eight and three TFs havebeen shown to be associated with transcription activating andrepressing activities, respectively. Transcription activator HIF-1αhas been reported to bind to FOXC1 promoter and enhance itsexpression in hepatocellular carcinoma38. Utilizing the ENCODE
Fig. 3 Identification of FOXC1 as a super-enhancer-driven master regulator of invasion and metastasis in TNBC. a Prediction of potential target genes ofTNBC-specific SEs. The X-axis represents log2 fold change of gene expression between TNBC and non-TNBC samples in the TCGA-BRCA cohort. Y-axisrepresents log2 fold enrichment of H3K27ac signal of TNBC-specific SEs between TNBC and non-TNBC cell lines. Among all predicted target genes, ninetranscription factors were identified and highlighted. b A regulatory network was inferred by integrative analysis of SE-regulated TFs and gene expressiondata in the TCGA-BRCA dataset. FOXC1 was identified as a master regulator of activating invasion and metastasis in TNBC. Predicted genes regulated bythe nine TFs were colored in proportion to their differential expression levels between TNBC and non-TNBC samples. c Genome browser plot shows higherenrichment of H3K27ac signal in the SEs proximal to FOXC1 in the TNBC cell lines than the non-TNBC cell lines. d FOXC1 showed significantly higherexpression in TNBC samples (n= 327) than those classified to the other subtypes (Her2 n= 237, LumA n= 706, LumB n= 484, and Normal-like n= 199)in the METABRIC cohort (two-sided Wilcoxon signed-rank tests). The boxes represent the 25th percentile, median, and 75th percentile, whiskers wereextended to the furthest value that is no more than 1.5 times the inter-quartile range. e Kaplan–Meier plot shows that breast cancer patients with highexpression of FOXC1 (top 10%) showed significantly poorer overall survival than the others in the METABRIC cohort. The statistical significance wascalculated by a log-rank test (one-sided). (f, g) Immunohistochemistry of FOXC1 expression in 38 surgical breast cancer samples (18 TNBC, 20 non-TNBC). Representative FOXC1 staining images are shown. The bar graph shows the mean staining intensity score of FOXC1 in the surgical samples.(h) The mean staining intensity score of FOXC1 in tissue microarray samples of TNBC (n= 48) and non-TNBC (n= 102). i Immunoblotting detection ofFOXC1 expression in a panel of breast cancer cell lines, repeated independently twice with similar results. Data are represented as mean ± SEM in (g) and(h). P-values were calculated by two-sided Student’s t test in (g) and (h). Source data are provided as a Source Data file.
NATURE COMMUNICATIONS | https://doi.org/10.1038/s41467-021-22445-0 ARTICLE
NATURE COMMUNICATIONS | (2021) 12:2242 | https://doi.org/10.1038/s41467-021-22445-0 | www.nature.com/naturecommunications 7

TF targets database, we also found SP1 and YY1 binding sites inFOXC1 promoter region. These three candidates will beprioritized for testing their role in SE-mediated overexpressionof FOXC1 in future studies.
To further illustrate the feasibility of using our integrativeapproach to elucidate mechanisms by which oncogenes arespecifically upregulated in TNBC, a parallel set of CRISPR/
Cas9 studies was performed for MET, another oncogene highlyexpressed in TNBC and associated with worse clinical outcomes(Supplementary Fig. 9a–c). Similar to FOXC1, SE proximal toMET is enriched in H3K27ac and binding of Brd4 as well as p300in TNBC lines (Supplementary Fig. 9d–f). In addition, JQ1inhibited binding of Brd4 and p300 to the SE, and reduced METexpression in TNBC cells (Supplementary Fig. 9d–g). The
ca
FOXC1
Actin
BT-5
49
BT54
9 FOXC1
Actin
b
CTL
gRNA-e1
gRNA-e2
125100
7550250
Rel
ativ
e gr
owth
P < 0.0001P = 0.0384
CTL
gRNA-e1
gRNA-e2
125100
7550250R
elat
ive
grow
th
P = 0.0105P = 0.004
CTL
gRNA-e1
gRNA-e2
125100
7550250
Rel
ativ
e gr
owth
MC
F10-
DC
IS
MC
F10-
DC
IS
CTL gRNA-e1 gRNA-e2
CTL gRNA-e1 gRNA-e2
CTL gRNA-e1 gRNA-e2
CTL gRNA-e1 gRNA-e2
CTL
CTL
gRNA
-e1
gRNA
-e2
CTL
gRNA
-e1
gRNA
-e2
CTL
gRNA
-e1
gRNA
-e2
CTL gRNA-e1 gRNA-e2
CTL gRNA-e1 gRNA-e2
MC
F10D
CIS
BT54
9
Hoechst Phalloidin
Hoechst Phalloidin
Hoechst Phalloidin
MD
A-M
B-23
1
CTL
gRNA-e1
gRNA-e2Rel
ativ
e sp
hero
id s
ize
1.00
1.25
0.75
0.50
0.25
0
P = 0.0014P = 0.0052
CTL
gRNA-e1
gRNA-e2Rel
ativ
e sp
hero
id s
ize
1.00
1.25
0.75
0.50
0.250
P < 0.0001P = 0.0004
CTL
gRNA-e1
gRNA-e2Rel
ativ
e sp
hero
id s
ize
1.00
1.25
0.75
0.500.25
0
P < 0.0001
P < 0.0001
P < 0.0001
P = 0.0001
4
3
2
1
0
Rel
ativ
e sp
hero
id s
ize
5
CTL gR
NA, vec
tor
CTL gR
NA, FOXC1
gRNA-e1
, vec
tor
gRNA-e1
, FOXC1
gRNA-e2
, vec
tor
gRNA-e2
, FOXC1
P = 0.004
P = 0.003
Actin
FOXC1
MD
A-M
B-23
1
MD
A-M
B-23
1
d
FOXC1SSE245
MCF-10A76NF2VHCC1937BT-549MDA-MB-436MDA-MB-231SUM149SUM159super-enhancer
DNase I
SSE245
e1 e2e3 e4 e5
MCF10-DCIS
gRNA
-e1
gRNA
-e2
CTL
CTL
gRNA
-e1
gRNA
-e2
CTL
CTL
gRNA
-e1
gRNA
-e2
CTL
CTL
BT549
MDA-MB-231
2.0 kb
0.5 kb
2.0 kb
0.5 kb
2.0 kb
0.5 kb
2.0 kb
0.5 kb
2.0 kb
0.5 kb
2.0 kb
0.5 kb
eCTL gRNA-e1 gRNA-e2
Vect
orFO
XC1
50 μm
f
CTLgRNA-e1gRNA-e2
Tum
or v
olum
e (m
m3 )
200
300
400
500
100
00 10 3020 40 50
day post injection
P=
0.03
29
P=
0.04
09
100 μm
100 μm
70 KDa
35 KDa
55 KDa
100 KDa
70 KDa
35 KDa
55 KDa
100 KDa
70 KDa
35 KDa
55 KDa
100 KDa
100 μm
ARTICLE NATURE COMMUNICATIONS | https://doi.org/10.1038/s41467-021-22445-0
8 NATURE COMMUNICATIONS | (2021) 12:2242 | https://doi.org/10.1038/s41467-021-22445-0 | www.nature.com/naturecommunications

functional significance of SE was demonstrated by the reductionof MET expression, colony formation, spheroid growth andinvasiveness upon SE deletion in MDA-MB-231 and BT549 cells(Supplementary Fig. 9h–k). In MCF-10-DCIS cells, dCas9-Krabsystem39 was employed to inactivate the SE, which also led toreduced MET expression and colony forming ability (Supple-mentary Fig. 9l, m). These results substantiate our highlyintegrative approach in identifying TNBC-specific SEs and theoncogenes that they regulate.
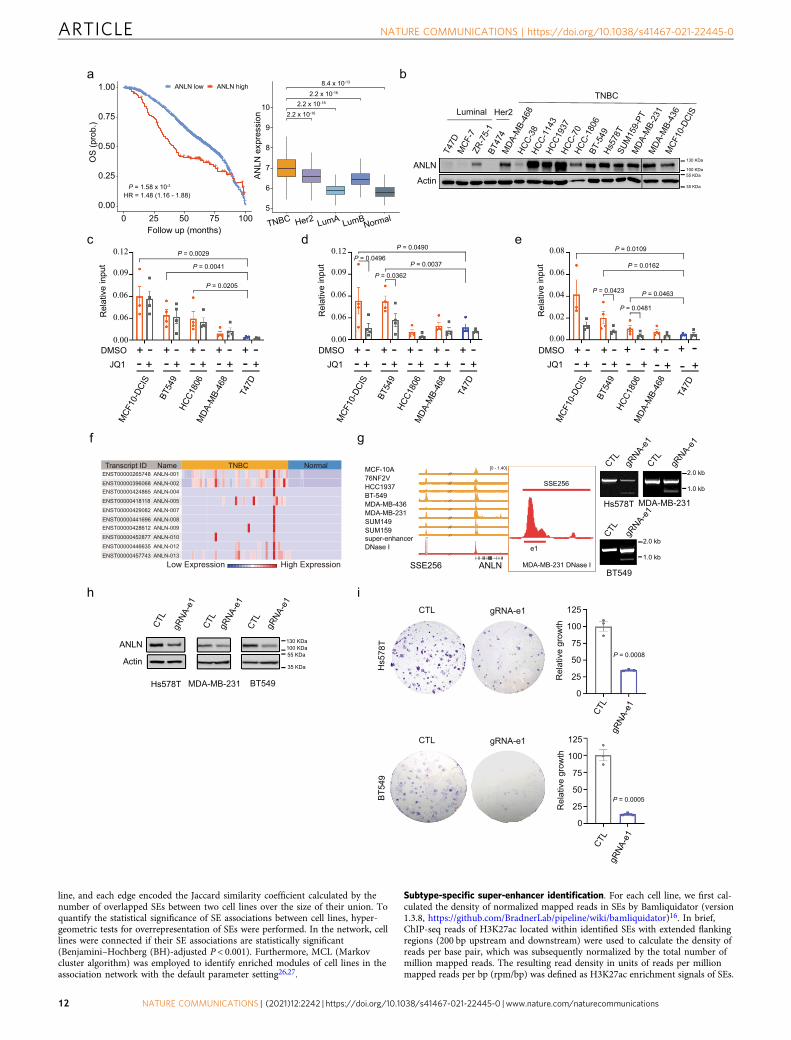
Cas9-mediated deletion of ANLN super-enhancer identifies itsfunctional importance in TNBC clonogenicity. The functionalrole of FOXC1 and MET in TNBC has been well established.However, the biological significance of several other top hits fromour SE target gene analysis (Supplementary Data 2) in TNBCremain elusive. To test if our integrative approach can also beapplied to identify novel TNBC-specific genes driven by SEs, wefocused on one of the top hits, ANLN, as its high expression inbreast cancer patients has been shown to be significantly corre-lated to recurrence, expression of proliferation genes (all 17 testedin ref. 40), as well as poor overall survival (Fig. 6a;41). The specificfunction and regulation of ANLN in TNBC, however, are lessinvestigated. The expression of ANLN was initially examined.Using clinically annotated breast cancer gene expression datasets,we found that the percentage of cases with ANLN mRNA upre-gulation is significantly higher in TNBC as compared to luminalbreast tumors (Fig. 6a). In addition, in a panel of breast tumorlines, protein expression levels of ANLN are higher in TNBC linesas compared to luminal or Her2-overexpressed lines (Fig. 6b).This is in line with our bioinformatic prediction (SupplementaryData 2) and ChIP-PCR data (Fig. 6c–e) that ANLN is a potentialtarget of SE enriched in TNBC. Importantly, ANLN is minimallyexpressed in normal breast tissues (42 TNBC tumors compared to21 adjacent normal samples, http://syslab4.nchu.edu.tw/;42,Fig. 6f), suggesting the potential of targeting ANLN for ther-apeutic purposes. To investigate the functional role of ANLN SE,we used the CRISPR/Cas9 system to delete the peak of SSE256(Fig. 6g). ANLN levels and clonogenicity were reduced sig-nificantly upon deletion of SE (Fig. 6h, i), indicating that the SEdrives ANLN expression and TNBC progeny producing cap-ability. Taken together, our results show that SE-based epige-nomic characteristics can distinguish TNBC from non-TNBCsubtypes, and identify TNBC-specific genes that determine thephenotypic outcomes. Our study identified a mechanism forupregulating FOXC1 and MET expression specifically in TNBC.Furthermore, our analysis uncovered ANLN as a TNBC-specificoncogene regulated by SE.
DiscussionAlthough genetic abnormalities in breast cancer have been wellstudied and described, genomic-guided therapeutic strategies arelacking for TNBC patients. The high degree of genomic
heterogeneity of TNBCs further limit the mutational-targetedtherapies. Recent studies strongly suggest that deregulation ofepigenome plays a crucial role in the pathogenesis of breastcancer20,43. However, how epigenetic changes influence subtype-specific SEs and the transcriptional program are not wellunderstood. Our study was motivated by recent findings in othercancer types highlighting the significance of epigenetic circuitry,with the potential in yielding novel insights into mechanisms oftumorigenesis and identifying targets for therapeutic intervention.For example, subgroup-specific SEs have been identified formedulloblastoma16, providing a regulatory explanation for sub-groups’ transcriptional diversity and clinical behaviors. In addi-tion, chimeric TF PAX-FOXO1 was found to induce de novo SEin a specific subtype of rhabdomyosarcoma, thereby conferringselective therapeutic vulnerability to JQ123. Although very little isknown about SE in breast cancer, Franco et. al. has recentlydeveloped a computational pipeline to identify transcribedenhancers in different subtypes, and demonstrated that TFsincluding FOSL1 and PLAG1 play a key role in enhancer for-mation and the biology of TNBC cells20. Therapeutically, CDK7inhibitors have been demonstrated to block tumor growth inpatient-derived xenografts of TNBC, given the dependence of acluster of key genes potentially driven by TNBC-specific SEs30. Byperforming ChIP-Seq and CRISPR-based screening, a recentstudy identified BAMBI as a SE-driven gene which regulates thegrowth of TNBC cells but not normal breast cells44. These studiesunderscore the importance of identifying and characterizing SEsto refine our understanding of epigenetic processes underlyingTNBC tumorigenesis.
To obtain a genome-wide landscape of SEs in breast cancer, weperformed ChIP-seq analysis for active enhancers (H3K27ac) in19 established cell lines. Notably, unsupervised classification andnetwork analysis discovered previously unrecognized SE hetero-geneity in breast cancer, where genome-wide SE profiling issufficient to characterize the subtype identity (TNBC vs. non-TNBC). We further identified 3035 TNBC-specific and 1765 non-TNBC-specific SEs and proved their specificity with multipleactive and suppressive histone modification marks. By multiomicprofiling of putative cancer-related genes with their correspond-ing regulatory SEs, we highlight the implication of SEs in gov-erning the epigenetic regulation of TNBC pathogenesis viahistone modifications instead of DNA methylation. One potentiallimitation of this analysis is the use of RRBS data covering onlyDNA methylation-enriched genome loci, which may notencompass the entire regions of SEs and promoters. Thus, itremains to be confirmed in the future if this finding is supportedby DNA methylation data with a higher resolution (e.g., whole-genome bisulfite sequencing). Given the known relatively uni-form transcriptional program of TNBC, we performed networkbiology analysis in breast cancer patient datasets to identify SE-driven TFs that act as master regulators of different cellularprocesses. Our analyses showed that a large proportion of TNBC-specific target genes are associated with multiple cancer
Fig. 4 Deletion of FOXC1 SE reduces TNBC spheroid growth and invasion. a Schematic of FOXC1 SE (SSE245) and PCR detection of CRISPR/Cas9-mediated deletion of e1 and e2. Inset shows 5 constituent enhancers (e1–e5) within SSE245 and their sensitivities to DNase I in MDA-MB-231 cells. 1203and 907 base pairs of e1 and e2 were deleted, respectively. b Immunoblotting of FOXC1 in BT549, MDA-MB-231, and MCF10-DCIS upon deletion of e1 ore2 of SSE245. Experiments in (a) and (b) were repeated twice independently with similar results. c Clonogenic assay of BT549, MDA-MB-231, and MCF10-DCIS with or without deletion of e1 or e2. Bar graphs show the quantification of clonogenic proliferation, n= 3 independent experiments for BT549 andMDA-MB-231, n= 2 for MCF10-DCIS. d Phalloidin and Hoechst staining of BT549, MDA-MB-231 and MCF10DCIS spheroids. Bar graphs show thequantification of spheroid size. n= 3 independent experiments. e Tumor volume of MDA-MB-231 xenografts with or without e1, e2 deletion. Tumornumber of each group n= 7. f Growth of MDA-MB-231 spheroids with or without e1, e2 deletion in the presence of FOXC1 overexpression. Right panel,quantification of spheroid size. n= 98, 81, 87, 93, 99, 60 spheroids (from left to right) examined over 3 independent experiments. Data are represented asmean ± SEM in (c–f). P-values were calculated by two-sided Student’s t test in (c–f). Source data are provided as a Source Data file.
NATURE COMMUNICATIONS | https://doi.org/10.1038/s41467-021-22445-0 ARTICLE
NATURE COMMUNICATIONS | (2021) 12:2242 | https://doi.org/10.1038/s41467-021-22445-0 | www.nature.com/naturecommunications 9

hallmarks, and we were intrigued to uncover FOXC1 as the mostsignificant regulator of activating invasion and metastasis. In thisstudy, we predicted the SE target genes by searching for SEswithin 500 kb upstream of genes that were upregulated in theTNBC samples. We further employed a public dataset
(Supplementary Table 1) with Hi-C data for TN line MCF-10Aand non-TNBC line MCF7 to investigate whether the SEs arelooping to the promoters of their putative target genes. As thedata are too sparse (MCF-10A: 169,655,013 contacts; MCF7:165,433,519 contacts), we could not identify any significant loops
0.25
0.50
0.75SUM159
VehicleJQ1 treated
H3K
27ac
H3K
27ac
0.2
0.4SUM149
Actin
FOXC1
DCIS
DMSO
JQ
1
MDA-MB-231
DMSO
JQ
1
DMSO
JQ
1
T47D BT549
DMSO
JQ
1
igG C
TLno
n-TNBC
TNBC
3
2
1
0
Rel
ativ
e H
3K27
enric
hmen
t
4 P = 0.0495
10
0
2
4
6
8
CTL
(+) e
1(-)
e1
(+) e
2(-)
e2
(+) e
3(-)
e3
(-) e
4
(+) e
4
Rel
ativ
e lu
min
ecen
ce
(fi
refly
/reni
lla)
P = 0.0045
P = 0.0003
P = 0.0008
P = 0.0139
P = 0.0119
P = 0.0281
P = 0.0246
P = 0.0023
70 KDa
35 KDa
55 KDa
100 KDa
jg
e
f h i
b
0.100.200.30
HCC1395VehicleJQ1 treated
0.05
0.10MDA-MB-436
0.05
0.10
SUM149
0.05
0.10
0.15SUM159
0.10
0.20SUM1315
0.040
0.045
T-47-D
TNBC-specific super-enhancersTNBC-specific super-enhancers
BRD
4BR
D4
BRD
4
BRD
4BR
D4
BRD
4
TNBC-specific super-enhancers
PBX1HIF1A
SP3
NR2C1
YY1SP1
ESRRA
ZNF148 NFYB
RBPJTFE3
Prediction
Mass spectrometry
c d
BT54
9M
DA-
MB-
231
DMSO JQ1
MC
F10-
DC
IS
125100
7550250
Rel
ativ
e gr
owth
DMSO JQ1
P = 0.0009
125100
7550250
Rel
ativ
e gr
owth
DMSO JQ1
P = 0.0013
125100
7550250
Rel
ativ
e gr
owth
DMSO JQ1
P = 0.0003
0.08
0.06
0.04
0.02
0.00
MCF10-D
CIS
BT549
MDA-MB-23
1
DMSO
T47D
Rel
ativ
e to
inpu
t
JQ1-+
- + - + - +- +-+ -+ -+
P = 0.0115
P = 0 .025
P = 0.0351
0.25
0.20
0.15
0.10
0.05
0.00
MCF10-D
CIS
BT549
MDA-MB-23
1
T47D
Rel
ativ
e to
inpu
tDMSO
JQ1-+
- + - + - +- +-+ -+ -+
P = 0.0169
P = 0.0223
P = 0.0171
P = 0.0154
P = 0.0440 0.15
0.10
0.05
0.00
MCF10-D
CIS
BT549
MDA-MB-23
1
T47D
Rel
ativ
e to
inpu
t
DMSOJQ1
-+- + - + - +- +
-+ -+ -+
P = 0.0112
P = 0.0092
P = 0.0425
P = 0.0110
a
ARTICLE NATURE COMMUNICATIONS | https://doi.org/10.1038/s41467-021-22445-0
10 NATURE COMMUNICATIONS | (2021) 12:2242 | https://doi.org/10.1038/s41467-021-22445-0 | www.nature.com/naturecommunications

across the entire genome. However, we found that contacts didexist between the SEs and the promoters of FOXC1 (Supple-mentary Fig. 10a), MET (Supplementary Fig. 10b) and ANLN(Supplementary Fig. 10c) in MCF-10A but not in MCF7,demonstrating that SE-promoter interactions are specificto TNBC.
Despite the well-studied functions and clinical significance ofFOXC1 in breast cancer pathogenesis, little is known regarding itsregulatory mechanisms. BMP4-SMAD signaling was shown topromote FOXC1 expression and osteogenic differentiation inmyoblasts45, whereas canonical Wnt signaling was demonstratedto activate FOXC1 transcription in P19 embryonal carcinomacells46. In basal-like breast cancer, p65 and GATA3 were shownto promote and inhibit FOXC1 expression, respectively47,48. Inour study, to directly examine the functional role of SE in reg-ulating FOXC1 expression, we deleted the associated SE byCRISPR/Cas9, and resulted in decreased expression of FOXC1and TNBC spheroid growth and invasiveness, phenocopyingdownregulation of the gene. In clinical samples, we foundH3K27ac enrichment at FOXC1 SE in TNBC tumors. We furthershowed that BRD4 and p300 enrichment at FOXC1 SE are sen-sitive to JQ1. Although JQ1 has recently shown efficacy in TNBCpatients36, a mechanistic connection is yet to be demonstratedbetween BRD4 and SE. Our findings, therefore, not only illumi-nate the functional and clinical significance of TNBC-specific SEs,but also provide a mechanism for the specific overexpression ofFOXC1 in TNBC. In lung adenocarcinoma and endometrialcarcinoma, MYC overexpression was driven by focally amplifiedSE, which could be a potential common mechanism for upre-gulating oncogene expression in epithelial cancers7. We did not,however, observed FOXC1 SE focal amplification in our genomicanalysis. To search for molecular mechanisms by which FOXC1SE is selectively active in TNBC cells, we performed TFs bindingprediction and mass spectrometry studies of enhancer e1 inSSE245, and identified 11 potential TFs associated with theFOXC1 SE. Among these TFs, HIF-1α has been implicated in theregulation of FOXC1 expression in solid tumors. In lung cancer,it was demonstrated that HIF-1α binds to the hypoxia-element inthe FOXC1 promoter and drives FOXC1 transcription, resulted inenhanced tumor progression49. It would be interesting to test ifHIF-1α mediates the SE-driven overexpression of FOXC1 inTNBC. Additionally, 162, 66, 45, and 39 TFs were also predictedto bind to the other four constituent enhancers e2, e3, e4, and e5of SSE245, respectively (Supplementary Data 3). Among theseTFs, FOXC1 was predicted to bind to two loci in e3, suggestingthat FOXC1 potentially auto-regulates itself and interplays withother TFs as the core transcriptional regulatory circuitry inTNBC. Another central question relating to oncogenic SEs is howare they being acquired and formed. It has been demonstratedthat tumor cells acquire SEs through a variety of mechanisms,including DNA mutation or indels at SE to generate de novo TFbinding sites, chromosomal rearrangements, and changes in
elements that define topologically associating domains50.In our study, we did not observe focal amplification ofFOXC1 SE. The structural or DNA changes responsible for theformation of our newly identified TNBC-specific SEs remain tobe investigated.
Through the multiomic analysis and deletion of SE peak, weidentified ANLN, a gene involved in cytokinesis, as a target ofTNBC-specific SE51,52. Unlike FOXC1 and MET, the functionalrole of ANLN in breast cancer has not been studied extensively.An association between ANLN expression and cancer suscept-ibility has been mainly inferred by gene expression studies. Forexample, the upregulation of ANLN is observed in various can-cers including ovarian, lung, hepatic, pancreatic, colorectal, andbreast cancer41,53. The oncogenic effect of ANLN has beenattributed to its function in regulating cell cycle. In non-smalllung cancer and breast cancer lines, cell proliferation is sup-pressed and large-sized polynucleated cells form upon ANLNdepletion41,54,55. Recently, ANLN was shown to regulate breastcancer cell migration and stemness56. Given the migratory andinvasive functions of FOXC1 and MET in breast cancer, it wouldbe interesting to examine if there is coordinating upregulation ofthese three genes by SEs in driving the metastatic program ofTNBC. Here, we identified a mechanism by which ANLN isupregulated in TNBC, these studies further suggest the clinicaland biological significance of ANLN SE in TNBC tumorigenesiswhich warrants future investigations.
In summary, we have discovered distinct SE landscapesbetween TNBC and non-TNBC cells. Our studies highlight thefunctional significance of TNBC-specific SE in determining bio-logical outcomes, and provide mechanisms by which key onco-genes specifically overexpressed in TNBC. We also demonstratethe utility of our multiomic platform in dissecting the regulatorycircuits of gene expression and biology of different subtypes ofbreast cancer, further advocate for elucidating epigenetic dysre-gulation to provide insights for novel therapeutic interventions.
MethodsChIP-seq data analysis. H3K27ac, H3K4me1, H3K4me3, H3K27me3, CTCF andBRD4 ChIP-seq reads were mapped to the human reference genome (UCSC hg19genome build) using Bowtie (version 1.2.2)57, retaining only uniquely mappedreads for downstream analyses. For each mark, coverage tracks were generatedusing “deeptools” (version 3.3.0) and enrichment signals of histone modificationswere scaled by Counts Per Million (or CPM) mapped reads58.
Super-enhancer identification. For each cell type, H3K27ac enrichment regionswere first identified using a two-state hidden Markov model (ChromHMM, version1.17)59. H3K27ac enrichment regions located at gene promoters (within ±2.5 kb ofTSS) were filtered out, retaining regions as predicted enhancers. For each cell line,super-enhancers were subsequently distinguished from typical enhancers based onLOESS regression by fitting the size distribution of the enhancers, followed byidentification of the inflection point (slope 1).
Association network analysis of super-enhancers. To study the associationsbetween identified SEs in different cell lines, we employed a network-basedapproach. Each node in the association network encoded the number SEs in a cell
Fig. 5 Epigenetic regulation of FOXC1 expression in TNBC. a ChIP-seq profiles for BRD4 in a panel of JQ1 or DMSO (vehicle control) treated breast tumorlines. b H3K27ac enrichment at TNBC-specific SEs with or without JQ1 treatment. c–e H3K27ac (c), Brd4 (d), and P300 (e) ChIP-qPCR of indicated celllines using primer amplifying e1 of FOXC1 SE. n= 3 independent experiments. f Immunoblotting detection of FOXC1 expression in cells treated with JQ1 orDMSO, repeated independently twice with similar results. g Clonogenic growth of indicated cells with or without 0.3 µM JQ1 treatment. n= 3 independentexperiments. h H3K27ac ChIP-qPCR of clinical breast cancer samples using primer amplifying e1 of FOXC1 SE. Four TNBC and four non-TNBC freshfrozen samples were tested. i Activity of constituent enhancers of FOXC1 SE measured in BT-549 cells by Dual-Luciferase reporter assay. n= 3independent experiments. (j) Venn diagram shows TFs potentially binding to the SE region identified by prediction and mass spectrometry. The size of TFsuniquely found by prediction was proportionate to -log10 transformed p-value, and the size of TFs found by mass spectrometry only was in proportion to-log10 transformed BH-adjusted p-value. Data are represented as mean ± SEM in (c–e) and (g–i). P-values were calculated by two-sided Student’s t test in(c–e) and (g–i). Source data are provided as a Source Data file.
NATURE COMMUNICATIONS | https://doi.org/10.1038/s41467-021-22445-0 ARTICLE
NATURE COMMUNICATIONS | (2021) 12:2242 | https://doi.org/10.1038/s41467-021-22445-0 | www.nature.com/naturecommunications 11
line, and each edge encoded the Jaccard similarity coefficient calculated by thenumber of overlapped SEs between two cell lines over the size of their union. Toquantify the statistical significance of SE associations between cell lines, hyper-geometric tests for overrepresentation of SEs were performed. In the network, celllines were connected if their SE associations are statistically significant(Benjamini–Hochberg (BH)-adjusted P < 0.001). Furthermore, MCL (Markovcluster algorithm) was employed to identify enriched modules of cell lines in theassociation network with the default parameter setting26,27.
Subtype-specific super-enhancer identification. For each cell line, we first cal-culated the density of normalized mapped reads in SEs by Bamliquidator (version1.3.8, https://github.com/BradnerLab/pipeline/wiki/bamliquidator)16. In brief,ChIP-seq reads of H3K27ac located within identified SEs with extended flankingregions (200 bp upstream and downstream) were used to calculate the density ofreads per base pair, which was subsequently normalized by the total number ofmillion mapped reads. The resulting read density in units of reads per millionmapped reads per bp (rpm/bp) was defined as H3K27ac enrichment signals of SEs.
ANLN
Actin
T47D
MCF
-7ZR
-75-
1BT
474
MDA
-MB-
468
HCC-
38HC
C-11
43HC
C193
7HC
C-70
HCC-
1806
BT-5
49Hs
578T
SUM
159-
PTM
DA-M
B-23
1M
DA-M
B-43
6M
CF10
-DCI
SLuminal Her2
TNBC
a
c d e
b
Low Expression High Expression
TNBC NormalANLN-001ANLN-002ANLN-004ANLN-005ANLN-007ANLN-008ANLN-009ANLN-010ANLN-012ANLN-013
ENST00000265748ENST00000396068ENST00000424865ENST00000418118ENST00000429082ENST00000441696ENST00000428612ENST00000452877ENST00000446635ENST00000457743
Transcript ID Name
f g
h i
CTL gRNA-e1
CTL
gRNA-e1
CTL gRNA-e1
Hs578T MDA-MB-231
BT549
MCF-10A76NF2VHCC1937BT-549MDA-MB-436MDA-MB-231SUM149SUM159super-enhancerDNase I e1
ANLNSSE256 MDA-MB-231 DNase I
SSE256
CTL
gRNA
-e1
ANLN
Actin
Hs578T
CTL
gRNA
-e1
CTL
gRNA
-e1
MDA-MB-231 BT549
Hs5
78T
CTL gRNA-e1
CTL gRNA-e1
BT54
9
[0 - 1.40]
2.2 x 10⁻¹⁶
2.2 x 10⁻¹⁶
2.2 x 10⁻¹⁶
8.4 x 10⁻¹³
5
6
7
8
9
10
ANLN
exp
ress
ion
TNBC Her2 LumA LumBNormal
+++++++++++++++++++++++++++++++++++++++++++++++++++++++++++++++++++++++++++++++++++++++++++++++++++++++++++++++++++++++++++++++++++++++++++++++++++++++++++++++++++++++++++++++++++++++++++++++++++++++++++++++++++++++++++++++++++++++++++++++++++++++++++++++++++++++++++++++++++++++++++++++++++++++++++++++++++++++++++++++++++++++++++++++++++++++++++++++++++++++++++++++++++++
+ +
+
+++++++++++++++++++ ++ ++++++++
0.00
0.25
0.50
0.75
1.00
0 25 50 75 100
OS
(pro
b.)
+ +ANLN low ANLN high
Follow up (months)
P = 1.58 x 10⁻³
HR = 1.48 (1.16 - 1.88)
MCF
10-D
CIS
BT54
9HC
C180
6M
DA-M
B-46
8
T47D
0.12
0.09
0.06
0.06
0.00
Rel
ativ
e in
put
DMSOJQ1
-+- + - + - +- +
-+ -+ -+- +
-+
P = 0.0029
P = 0.0041
P = 0.0205
MCF
10-D
CIS
BT54
9HC
C180
6M
DA-M
B-46
8
T47D
0.12
0.09
0.06
0.06
0.00
Rel
ativ
e in
put
DMSOJQ1
-+- + - + - +- +
-+ -+ -+- +
-+
P = 0.0037
P = 0.0490P = 0.0496
P = 0.0362
MCF
10-D
CIS
BT54
9HC
C180
6M
DA-M
B-46
8
T47D
0.06
0.08
0.04
0.02
0.00
Rel
ativ
e in
put
DMSOJQ1
-+- + - + -
+- +
-+ -+-
+-+-
+
P = 0.0109
P = 0.0162
P = 0.0423
P = 0.0481
P = 0.0463
0
25
50
75
100
125
Rel
ativ
e gr
owth
CTL
gRNA
-e1
P = 0.0008
0
25
50
75
100
125
Rel
ativ
e gr
owth
CTL
gRNA
-e1
P = 0.0005
130 KDa
35 KDa
55 KDa100 KDa
2.0 kb
1.0 kb
2.0 kb
1.0 kb
130 KDa
35 KDa
55 KDa100 KDa
ARTICLE NATURE COMMUNICATIONS | https://doi.org/10.1038/s41467-021-22445-0
12 NATURE COMMUNICATIONS | (2021) 12:2242 | https://doi.org/10.1038/s41467-021-22445-0 | www.nature.com/naturecommunications

For each SE, a Wilcoxon signed-rank test was used to assess whether H3K27acenrichment signal is significantly differential between TNBC and non-TNBC celllines. Log2 fold enrichment (or FE) of H3K27ac was calculated for each SE by theaverage signal in the TNBC cell lines over the counterpart in the non-TNBC celllines. Differentially enriched SEs were defined by SEs with BH-adjusted P < 0.05and |log2FE| > 1. More specifically, SEs with log2FE > 1 were identified as TNBC-specific SEs, and those with log2FE <−1 were non-TNBC specific.
Reduced representation bisulfite sequencing data analysis. Reduced repre-sentation bisulfite sequencing (RRBS) raw reads were aligned to the humanreference genome (UCSC hg19 assembly) using Bismark v0.2060, powered bybowtie2 (version 2.3.5)61, with default parameters. Based on the resulting BAMfiles, DNA methylation levels of SEs and promoter (±2.5 kb of TSS) regions ofcorresponding genes were calculated using the R package “methylKit” (version1.2.10)62.
Quantification of gene expression. The Cancer Genome Atlas (TCGA) level-3gene expression data for 605 non-TNBC and 115 TNBC tissue samples (termed“TCGA-BRCA” dataset hereafter) were downloaded from Firehose Broad GDACportal (https://gdac.broadinstitute.org/). The gene expression levels measured byRSEM (scaled estimates in the gene-level) were converted to TPM (transcripts permillion) values by multiplying by 106, followed by log2-transformation for thesubsequent analyses. ‘limma’ (R package, version 3.32.2)63 was employed toidentify genes that are significantly upregulated (log2 fold change > 0.5, BH-adjusted P < 0.05) in TNBC samples, compared to non-TNBC samples.
Fifteen cell lines in CCLE were analyzed in the project, for which RNA-seq rawdata were downloaded from Sequence Read Archive (https://www.ncbi.nlm.nih.gov/sra, PRJNA523380). Sequencing reads were mapped to the human referencegenome (UCSC hg19 assembly) using STAR (version 2.7.1a)64, where onlyuniquely mapped reads were retained for the subsequent analyses. Differential geneexpression analysis was performed using the R package ‘DESeq2’ (version 1.26.0)5
between TNBC and non-TNBC cell lines.
Prediction of potential TFs at SEs. MDA-MB-231 DNase-seq reads were alignedto the human reference genome (UCSC hg19 assembly) using Bowtie (version1.2.2)57, retaining only uniquely mapped reads for downstream analyses. Bindingpeaks (P < 1 × 10⁻⁵) were identified using MACS software (version 2.1.0)65. ThreeDNase peaks, also called NFRs, were identified in SE of FOXC1 and furtheremployed for identification of TFs that potentially bind to the SE. The potentialbinding sites for 746 TFs were detected at the NFRs using FIMO66 with defaultparameters (P < 1 × 10⁻⁴), using position frequency matrices from JASPARdatabase (http://jaspar.genereg.net/)37.
Regulatory network inference and master regulator analysis. A regulatorynetwork was inferred by integrative analysis of gene expression profiles of 720breast cancer patient samples in the TCGA-BRCA dataset to investigate the rela-tionships between SE-regulated TFs and potential targets. Nine TFs regulated byTNBC-specific SEs that are notably upregulated (H3K27ac log2 fold enrichment >1, BH-adjusted P < 0.05 & gene expression log2 fold change > 1, BH-adjustedP < 0.05) in TNBC-subtype patients compared to the others, were identified aspotential regulators. 1785 genes differentially expressed between TNBC and non-TNBC tumors (log2 fold change > 0.5, BH-adjusted P < 0.05) were considered aspotential targets of the nine TFs. The gene expression data for the TFs andpotential targets were integrated for network inference using the ‘RTN’ package(version 1.12.0)32,33. Master regulator analysis for a specific gene signature, cancerhallmark of ‘activating invasion and metastasis’, was performed with a hypergeo-metric test of overrepresentation of each TF’s predicted targets. FOXC1 wasidentified as the most statistically significant master regulator (BH-adjustedP < 0.05) in the TNBC subtype.
Cell Culture. T47D, BT474, MCF-7, MDA-MB-436, MDA-MB-468, MDA-MB-231, Hs578T, ZR-75-1, HCC38, HCC1143, HCC70, HCC1806, BT-549 andHEK293T cells were obtained from ATCC. MCF10-DCIS and SUM159-PT cellswere obtained from Kornelia Polyak (Harvard Medical School, USA). T47D,MCF-7, MDA-MB-468, MDA-MB-231 and HEK293T cells were maintained inDulbecco’s modified Eagle medium (DMEM; Gibco) supplemented with 10% tetsystem-approved Fetal Bovine Serum (FBS; Clontech). ZR-75-1, HCC38, HCC1143,HCC70, HCC1806, BT-549 cells were cultured in RPMI 1640 medium (Gibco)supplemented with 10% FBS. BT474 was maintained in RPMI 1640 medium sup-plemented with 10% FBS and 10 µg/ml Insulin. Hs578T and MDA-MB-436 cellswere maintained in DMEM supplemented with 10% FBS and 10 µg/ml Insulin.SUM159-PT cells were maintained in Ham’s F12 Medium (Lonza) supplementedwith 5% FBS, 5 µg/ml Insulin and 500 ng/ml hydrocortisone. MCF10-DCIS cells67
were maintained in DMEM/F-12 (Gibco) supplemented with 5% horse serum,20 ng/ml EGF, 10 μg/ml Insulin, 100 ng/ml cholera toxin and 500 ng/ml hydro-cortisone. All cell lines obtained from the cell banks listed above were tested forauthentication using short tandem repeat (STR) profiling and passaged for fewerthan 6 months, and routinely assayed for Mycoplasma contamination.
3D cultures. 3D cultures were prepared as previously described68. Briefly, 96-wellplates were coated with growth factor-reduced Matrigel (BD Biosciences) andallowed to solidify for 30 min. Cells (2000–4000) in assay medium were seeded perwell. Assay medium contained DMEM or RPMI 1640 supplemented with 10% FBSand 2% Matrigel. The assay medium was replaced every 3–4 days. After 6–7 daysculture in 3D, spheroid number and cell number per spheroid were determined.Spheroids were fixed by 4% Formaldehyde for 20 min in room temperature andthen permeabilized by 0.5%Triton-X/PBS for 3-4 min. Spheroids were then stainedwith 5.4 μM Hoechst 33342 and 0.165 μM AlexFluor-488 phalloidin for 45 min.CellInsight CX7 high-content screening platform (Thermofisher) was used tocapture the signal of Hoechst 33342 and AlexFluor-488 phalloidin. 25 sequentialfields per well were captured (×10 objectives). A z-stack range of 210 µm wasacquired with a series of 35 z-slices separated by 6 µm. Maximum projection imageof each z-stack was saved for spheroid number and cell number per spheroidanalyses. To determined spheroid growth, CellTiter-Glo® 3D cell viability assay wasperformed according to the manufacturer’s protocol (Promega # G9682).
Clonogenic growth assays. 800 cells were seeded to 6-well plate and cultured for12 days. Medium was changed every 4 days. After 12 days, cells were fixed with 4%formaldehyde for 15 min at room temperature. 0.1% crystal violet in ethanol wasthen used to stain colonies for 40 min followed by PBS wash. To quantify cellproliferation, wells were destained in 10% acetic acid, followed by reading the ODvalue of the samples at 595 nm with a spectrophotometer7.
Antibodies. Anti-FOXC1 (#8758s) and anti-MET (#3127s) antibodies wereobtained from Cell Signaling Technology. Anti-β-actin antibody was purchasedfrom Sigma-Aldrich. Horseradish peroxidase-conjugated anti-mouse and anti-rabbit immunoglobulin G antibodies (AP307P, AP308P) were purchased fromMillipore. For immunohistochemistry staining, anti-FOXC1 (# ab223850) antibodywas purchased from Abcam. Anti-Brd4 (Bethyl Laboratories, #A301-985a100),anti-P300 (Bethyl Laboratories, #A300-358a), and anti-H3K27ac (Active motif,#39685) antibodies were used for Chip-qPCR. All primary and secondary anti-bodies for immunoblotting were used at 1:1000 and 1:5000 dilution, respectively.For immunohistochemistry, FOXC1 antibody was diluted at 1:500. For ChIP-qPCR, 3 µg of anti-H3K27ac was used per sample, 5 µg of anti-P300 and anti-BRD4 were used per sample.
Plasmids. For deleting a peak of SE by CRISPR/Cas9 editing, a pair of gRNAsfranking the peak were designed using http://crispr.mit.edu/. The pair of gRNAs(Supplementary Table 4) were then sequentially inserted into BsaI and BbsIrestriction sites of px333 vector (Addgene 64073), which encodes spCas9 and2 sgRNA cassettes. For deleting the SE peak with a lentiviral vector, FgH1tUTG
Fig. 6 Functional importance of ANLN super-enhancer in TNBC clonogenicity. a Higher expression of ANLN is associated with poor prognosis of breastcancer patients in the METABRIC cohort. The statistical significance was calculated by a log-rank test (one-sided). Increased expression of ANLN in TNBCsamples (n= 327), compared to other subtypes (Her2 n= 237, LumA n= 706, LumB n= 484, and Normal-like n= 199; two-sided Wilcoxon signed-ranktests). The boxes represent the 25th percentile, median, and 75th percentile, whiskers were extended to the furthest value that is no more than 1.5 timesthe inter-quartile range. b Immunoblotting detection of ANLN expression in a panel of breast cancer cell lines, repeated independently twice with similarresults. c–e H3K27ac (c), Brd4 (d), and P300 (e) ChIP-qPCR of indicated cell lines using primer amplifying e1 of ANLN SE. n of independent experiments isindicated by scatter dots. f mRNA expression levels of ANLN, data from Cancer RNA-seq Nexus. TNBC n= 42 samples, Normal tissue n= 21 samplesadjacent to TNBC. g Schematic of ANLN SE (SSE256) and detection of e1 deletion of ANLN SE by PCR in Hs578T, MDA-MB-231 and BT549 cells, repeatedindependently twice with similar results. h Immunoblotting detection of ANLN upon deletion of SSE256 e1 region, repeated independently twice withsimilar results. i Clonogenic assay of Hs578t and BT549 cells with or without deletion of SSE256 e1. n= 3 independent experiments. Data are representedas mean ± SEM in (c–e) and (i). P-values were calculated by one-sided Student’s t test in (c–e). P-values were calculated by two-sided Student’s t testin (i). Source data are provided as a Source Data file.
NATURE COMMUNICATIONS | https://doi.org/10.1038/s41467-021-22445-0 ARTICLE
NATURE COMMUNICATIONS | (2021) 12:2242 | https://doi.org/10.1038/s41467-021-22445-0 | www.nature.com/naturecommunications 13

(Addgene #70183) was used. The sequence of hU6 promoter-sgRNA-hU6promoter-sgRNA was amplified by PCR and then cloned into PacI digestedFgH1tUTG (to remove the H1t promoter and gRNA scaffold). shRNAs werecloned into pLKO.1 vector (Addgene 8453) or Tet-pLKO-puro (Addgene 21915)digested by AgeI and EcoRI. FOXC1 CDS was cloned into the CD532A-1 vector byGenewiz company.
Transfection and lentiviral infection. To delete SE peak in MCF10-DCIS andBT549 cells, px333 was cotransfected with pBABE-puro vector using lipofectamine3000 (Invitrogen). 48 h post-transfection, cells were treated with 1 µg/ml pur-omycin for 48 h, followed by collecting samples for PCR and other assays.
To produce lentiviral supernatants, 293 T cells were cotransfected with gRNA/Cas9-containing vectors, VSVG and psPAX2 for 60 h. Breast cancer cells were theninfected with filtered lentiviral supernatants for 48–72 h.
PCR. Genomic DNA was extracted using QIAamp DNAMini Kit (Qiagen #51304).PCR was performed with Quick-Load® Taq 2X Master Mix (NEB M0270L) using aThermal Cycler (BioRad, C1000 TouchTM). Primers flanking the deleted regionwere designed using Primer-blast and synthesized by Integrated DNA Technolo-gies company (Supplementary Table 4). PCR products were resolved on a 1.3%agarose gel.
ChIP-qPCR. Cells were cross-linked with 1% PFA at room temperature for 5 minand then quenched with 125 mM glycine at room temperature for 5 min. Cells werewashed twice with 1X TBS and harvested by scraping in 1 ml ChIP lysis buffer (50mM HEPES, pH7.5, 140 mM NaCl, 1 mM EDTA, 1% Triton, 0.1% Na-deox-ycholate, 1× proteinase inhibitor cocktail) and incubated on ice for 15 min. Toshear the chromatin, cells were sonicated using Bioruptor Plus (Diagenode, UCD-300 TM) for 30 cycles (30 s ON and 30 s OFF at high power). Soluble chromatinwas collected after two sequential high-speed centrifugations of the sonicated lysate(10,000g for 5 min and 15 min at 4 °C). 5% of the lysate was taken as input and theremaining lysate was incubated with specific antibodies at 4 °C for overnight. 30ulof pre-washed Protein G Sepharose (GE Healthcare, 17061802) were added to eachsample and incubated at 4 °C for 1–2 h. The beads were washed with differentbuffers, once with ChIP lysis buffer, once with lysis buffer with 0.5 M NaCl, oncewith Tris/LiCl buffer (10 mM Tris, pH8.0, 0.25M LiCl, 0.5% NP-40, 0.5% Na-deocycholate, 1 mM EDTA) and twice with Tris/EDTA buffer (50 mM Tris, pH8.0,10 mM EDTA). After washing, 100ul of 10% chelex (Bio-Rad, cat. no. 142-1253)was added to the washed protein-G beads and boiled at 95 °C for 10 min and then5 µl of 20 mg/ml Proteinase K (NEB, P8107S) were added and incubated at 37 °Cfor 30 min. Samples were boiled again for 10 min to inactivate proteinase K andcentrifuged to collect the supernatant. 100 µl of 20 mM Tris, pH 8.0 was added tothe pellet and centrifuged again to collect the supernatant. The supernatants werecombined and it was used as a template for qPCR reaction. qPCR was performedusing Applied Biosystems QuantStudio 3 Real-Time PCR System.
Immunoblotting. Cells were lysed in EBC buffer (50 mM Tris-HCl, pH 7.4,120 mM NaCl, 0.5% NP-40, 50 nM calyculin, 1 mM sodium pyrophosphate,20 mM sodium fluoride, 2 mM EDTA, 2 mM EGTA) containing proteinase inhi-bitor cocktail. Protein concentration was determined using the Bio-Rad proteinassay reagent. 20–40 µg lysates were separated by SDS-PAGE and detected with theindicated antibodies.
Immunohistochemistry of clinical breast cancer samples. Breast tissue sampleswere obtained from breast cancer patients who underwent biopsy or surgery forresection at Queen Elizabeth Hospital. 5 µm formalin-fixed paraffin-embeddedbreast tissue sections were prepared, dewaxed in xylene, rehydrated in serial down-graded alcohols (100%, 95%, 70%) and brought down to water. Antigen retrievalwas conducted by immersing the sections in pre-heated 90–95 °C Envision FlexTarget Retrieval Solution of high pH (DAKO, Denmark, K8004) and microwavedfor further 15 min. Sections were allowed to cool down in the retrieval solution forat least 20 min at room temperature. Rabbit anti-FOXC1 antibody (Abcam, USA,ab223850, dilution 1:500) was then applied on sections and incubated for 30 min atroom temperature after blocking of endogenous peroxidase by EnVision FLEXPeroxidase-Blocking Reagent (DAKO, Denmark, SM801). Signal detection wasfacilitated by the addition of REAL EnVision Detection System and DAB chro-mogenic substrate (DAKO, Denmark, K5007) for 30 min and 2 min, respectively,at room temperature. Hematoxylin was used for nuclei counterstain. The stainedsections were semi-quantitatively scored according to their staining intensity withnegative/weak staining scored as grade 0/1, moderately strong staining scored asgrade 2, and strong staining scored as grade 3. The procedures were approved bythe Human Subjects Ethics Committees at City University of Hong Kong, andconformed to the government regulations for research involving human partici-pants. Informed consent was obtained from the breast cancer patients.
DNA-pull-down assay. DNA sequence of peak e1 of FOXC1 SE was synthesizedby Ruibiotech company. Biotinated DNA sequence was generated by PCR using5′-biotinated forward primer (Supplementary Table 4). PCR product was purified
by QIAquick Gel extraction kit (Qiagen #28706). Cells were lysed in TNTE buffer(50 mM Tris/HCl (pH 7.6), 150 mM NaCl, 0.5% Triton X-100, 1 mM EDTA,protease and phosphatase inhibitors). Lysate was centrifuged at 13,000g for 10 minat 4 °C. Streptavidin-Agarose beads (Thermo Scientific) were washed with 1× B/Wbuffer (5 mM Tris-HCL (pH 7.5), 0.5 mM EDTA, 1 M NaCl), and then incubatedwith biotinylated PCR product in binding buffer (20 mM HEPES (pH 7.5), 2.5 mMKCl, 1 mM DTT, 20% glycerol, 0.02% NP40) for 30 min at room temperature,followed by wash once. Lysate was added to above prepared beads-biotinylatedDNA complex, with or without 10 µg poly-dIdC(Sigma), in a total volume of1.4 ml, and incubated for 6 h at 4 °C. For samples subjected to SDS-PAGE, com-plexes were washed 3 times with binding buffer. For samples subjected to massspectrometry analysis, complexes were washed twice with binding buffer and thenthree times with 50 mM ammonium bicarbonate.
Liquid chromatography with tandem mass spectrometry (LC-MS/MS). Proteinbands of interest were excised after DNA-pull down and SDS-PAGE. Bands werewashed with 25 mM NH4HCO3/50% acetonitrile followed by dehydration withacetonitrile and reduction with 0.1 M NH4HCO3/10 mM TCEP solution at 55 °Cfor 45 min. Then samples were incubated with 0.1 M NH4HCO3/55 mM iodoa-cetamide solution at room temperature in dark for 45 min followed by wash,dehydration and dry by a vacuum centrifuge. For digestion, gel fragments wererehydrated by incubating with 20 ng/µl sequencing grade trypsin in 0.1 MNH4HCO3 on ice for 45 min followed by overnight incubation at 37 °C. Digestedpeptides were extracted and desalted using C18 tips (ThermoFisher, Cat# 87782)following manufacturer’s instruction and resuspended in 20 μL 0.1% FA buffer.
The LC-MS/MS analysis was done by an Easy-nLC 1200 system coupled to a QExactive HF mass spectrometry (Thermo Scientific). 6 µL of samples were injectedinto a reverse phase C18 column (Thermo Scientific Cat#164568) at a flow rate of250 nL/min. A linear gradient of 7–25% of buffer B (0.1% formic acid in 80%acetonitrile) was run over a 50-min period by mixing mobile phase A (0.1% formicacid in ultrapure water) with eluting buffer mobile phase B. The electrospray voltagefor ionization on the mass spectrometer was set at 2.3 kV. Positive ion mode wasused for acquisition at a resolution of 120,000, with a full MS spectrum (m/z= 350-1800) using an automatic gain control (AGC) target of 3×10⁶. Top 12 most intenseions were selected for higher-energy collisional dissociation (HCD) fragmentation(normalized collision energy 27) and MS/MS spectra were generated with an AGCtarget of 1 × 10⁵ at a resolution of 30,000, with a dynamic exclusion time of 30 s.
All raw files produced by XCalibur 4.0.27 (Thermo Scientific) software wereanalyzed together using the Proteome Discoverer 2.2 software (ThermoFisher)against UniProt human protein database. The precursor and fragment masstolerances were set to 10 ppm and 0.02 Da. A maximum of two missed cleavagesites of trypsin was allowed. Carbamidomethylation (C) was set as staticmodification. Oxidation (M) and acetyl (protein N-terminal) were set as dynamicmodifications. False discovery rate (FDR) of peptide spectrum matches (PSMs) andpeptide identification were determined using the Percolator algorithm at 1% basedon q-value. For label-free quantification (LFQ), the Minora Feature Detector nodein the processing workflow was used together with the Precursor Ions Quantifiernode and the Feature Mapper node in the consensus workflow.
Dual-Luciferase reporter assay. Fragments containing enhancer e1, e2, e3, or e4of FOXC1-SE were first amplified from genomic DNA of BT-549 by PCR. Thefragments obtained above were used as templates to amplified enhancer e1, e2, e3,and e4. Primers used for cloning are listed in Supplementary Table 4. Fireflyluciferase reporter vector pGL3-Promoter (Promega, #E1761) was used for cloningof enhancer regions. The enhancers of FOXC1-SE were cloned upstream of thepromoter-luc+ transcriptional unit of pGL3-Promoter vector using MluI and XhoIrestriction enzyme sites. Enhancers were cloned in both orientations (+) and (-).The enhancer luciferase constructs were then cotransfected with pRL-TK vector(Promega, #E2241) into BT-549 cells using FuGENE 6 (Promega, #2693). pRL-TKvector was used as an internal control reporter vector. 48 h post-transfection,luminescence signal was read according to the manual of Dual-Glo® LuciferaseAssay System kit (Promega, #E2920). The firefly luciferase signal was first nor-malized to the Renilla luciferase signal and then normalized to the signal from theempty pGL3-promoter plasmid.
Xenograft studies. Female nude mice (6–8-week old) were purchased from thelaboratory animal services center, Chinese University of Hong Kong. All proce-dures were approved by the Animal Ethics Committees at City University of HongKong, and conformed to the government guidelines for the care and maintenanceof laboratory animals. Mice were housed in room temperature of 20–24 °C, withhumidity of 30–70% and light/dark cycle of 12 h/12 h. 5×10⁶ cells resuspended in50% Matrigel were injected into mammary fat pats (MFPs) of the female nudemice. Tumor size was examined every 4 days for the duration of the experiment.Tumor volumes were calculated using the formula V= (W2 × L)/2, where V is thetumor volume, W is the tumor width, and L is the tumor length. To knockdownFOXC1 expression in MDA-MB-231 tumor, tet-on-pLKO-puro vector was usedand drinking water containing 20 g/L sucrose and 1 g/L doxycycline was admi-nistered to induced the expression of FOXC1 shRNA. Drinking water was changedevery week.
ARTICLE NATURE COMMUNICATIONS | https://doi.org/10.1038/s41467-021-22445-0
14 NATURE COMMUNICATIONS | (2021) 12:2242 | https://doi.org/10.1038/s41467-021-22445-0 | www.nature.com/naturecommunications

Statistical analysis. Wilcoxon signed-rank tests were used to compare FOXC1expression levels and H3K27ac enrichment signals between TNBC and non-TNBCcell lines. The Benjamini-Hochberg method was used to correct for multiplehypotheses testing. Hypergeometric tests for overrepresentation were performed toidentify functional genesets associated with genes by R package ‘HTSanalyzeR2’69.Kaplan–Meier analysis with a log-rank test was performed to evaluate the statisticalassociation between predicted target gene expression and overall survival. Statisticalsignificance of correlation between FOXC1 expression levels and clinicopathologyparameters was evaluated by Chi-square tests. All statistical analyses were per-formed using R (version 3.4.3, www.r-project.org).
Reporting summary. Further information on research design is available in the NatureResearch Reporting Summary linked to this article.
Data availabilityChIP-seq data (with corresponding input data) for H3K27ac (19 cell lines), H3K4me1(15 cell lines), H3K4me3 (15 cell lines), H3K27me3 (14 cell lines), CTCF (2 cell lines)and BRD4 (5 cell lines, before and after JQ1 treated) markers, DNase-seq (2 cell lines)used in this study are available in Gene Expression Omnibus (GEO) and EMBL-EBIArrayExpress under accession code GSE69107, GSE38548, GSE85158, GSE63584,GSE87424, GSE46073, GSE26831, GSE80592, GSE63109, GSE84579, GSE98551,GSE70764 and PRJEB9547. RNA-seq and reduced representation bisulfite sequencing(RRBS) data of 15 cell lines used in this study are available in EMBL-EBI ArrayExpressunder accession code PRJNA523380. Hi-C data of MCF-10A and MCF-7 used in thisstudy are available in GEO under accession code GSE66733. Gene expression profiles forprimary breast cancer samples, together with molecular subtyping labels andcorresponding clinical information used in this study are available in Firehose BroadGDAC portal (https://gdac.broadinstitute.org/, n= 720), Molecular Taxonomy of BreastCancer International Consortium (METABRIC, https://www.cbioportal.org/, n= 1953)and GEO under accession code GSE5327, GSE1456, GSE2034, GSE2990, GSE11121,GSE3494, GSE7390, and GSE12276.Mass spectrometry data generated in this study is available in iPRoX, with project ID:
IPX0002865000 and PXD number: PXD024505. More details about the data availabilityand curation were summarized in Supplementary Table 1. Source data are available as aSource Data file. The remaining data are available within the Article, SupplementaryInformation or available from the authors upon request. Source data are provided withthis paper.
Code availabilityThe code used for the entire data analysis process is freely available on github (https://github.com/CityUHK-CompBio/TNBCSE_code).
Received: 21 August 2020; Accepted: 9 March 2021;
References1. Bray, F. et al. Global cancer statistics 2018: GLOBOCAN estimates of
incidence and mortality worldwide for 36 cancers in 185 countries. CA: CancerJ. Clinicians 68, 394–424 (2018).
2. Lehmann, B. D. et al. Identification of human triple-negative breast cancersubtypes and preclinical models for selection of targeted therapies. J. Clin.Investig. 121, 2750–2767 (2011).
3. Cancer Genome Atlas N. Comprehensive molecular portraits of human breasttumours. Nature 490, 61–70 (2012).
4. Mansour, M. R. et al. Oncogene regulation. An oncogenic super-enhancerformed through somatic mutation of a noncoding intergenic element. Science346, 1373–1377 (2014).
5. Loven, J. et al. Selective inhibition of tumor oncogenes by disruption of super-enhancers. Cell 153, 320–334 (2013).
6. Muratani, M. et al. Nanoscale chromatin profiling of gastric adenocarcinomareveals cancer-associated cryptic promoters and somatically acquiredregulatory elements. Nat. Commun. 5, 4361 (2014).
7. Zhang, X. et al. Identification of focally amplified lineage-specific super-enhancers in human epithelial cancers. Nat. Genet 48, 176–182 (2016).
8. Herranz, D. et al. A NOTCH1-driven MYC enhancer promotes T celldevelopment, transformation and acute lymphoblastic leukemia. Nat. Med. 20,1130–1137 (2014).
9. Pasquali, L. et al. Pancreatic islet enhancer clusters enriched in type 2 diabetesrisk-associated variants. Nat. Genet 46, 136–143 (2014).
10. Hnisz, D. et al. Super-enhancers in the control of cell identity and disease. Cell155, 934–947 (2013).
11. Hnisz, D. et al. Convergence of developmental and oncogenic signalingpathways at transcriptional super-enhancers. Mol. Cell 58, 362–370 (2015).
12. Ooi, W. F. et al. Epigenomic profiling of primary gastric adenocarcinomareveals super-enhancer heterogeneity. Nat. Commun. 7, 12983 (2016).
13. Betancur, P. A. et al. A CD47-associated super-enhancer links pro-inflammatory signalling to CD47 upregulation in breast cancer. Nat.Commun. 8, 14802 (2017).
14. Fraser, M. et al. Genomic hallmarks of localized, non-indolent prostate cancer.Nature 541, 359–364 (2017).
15. van Groningen, T. et al. Neuroblastoma is composed of two super-enhancer-associated differentiation states. Nat. Genet. 49, 1261 (2017).
16. Lin, C. Y. et al. Active medulloblastoma enhancers reveal subgroup-specificcellular origins. Nature 530, 57–62 (2016).
17. Akhtar-Zaidi, B. et al. Epigenomic enhancer profiling defines a signature ofcolon cancer. Science 336, 736–739 (2012).
18. Ray, P. S. et al. FOXC1 is a potential prognostic biomarker with functionalsignificance in basal-like breast cancer. Cancer Res. 70, 3870–3876 (2010).
19. Wang, J. et al. FOXC1 regulates the functions of human basal-like breastcancer cells by activating NF-kappaB signaling. Oncogene 31, 4798–4802(2012).
20. Franco, H. L. et al. Enhancer transcription reveals subtype-specific geneexpression programs controlling breast cancer pathogenesis. Genome Res. 28,159–170 (2018).
21. Creyghton, M. P. et al. Histone H3K27ac separates active from poisedenhancers and predicts developmental state. Proc. Natl Acad. Sci. USA 107,21931–21936 (2010).
22. Huang, J. et al. Dissecting super-enhancer hierarchy based on chromatininteractions. Nat. Commun. 9, 943 (2018).
23. Gryder, B. E. et al. PAX3-FOXO1 establishes myogenic super enhancers andconfers BET bromodomain vulnerability. Cancer Disco. 7, 884–899 (2017).
24. Li, Q. L. et al. The hyper-activation of transcriptional enhancers in breastcancer. Clin. Epigenetics 11, 48 (2019).
25. Perez-Rico, Y. A. et al. Comparative analyses of super-enhancers revealconserved elements in vertebrate genomes. Genome Res. 27, 259–268 (2017).
26. Van Dongen, S. Graph clustering via a discrete uncoupling process. Siam J.Matrix Anal. A 30, 121–141 (2008).
27. Enright, A. J., Van Dongen, S. & Ouzounis, C. A. An efficient algorithm forlarge-scale detection of protein families. Nucleic Acids Res. 30, 1575–1584(2002).
28. Krishnaswamy, S. et al. Ethnic differences and functional analysis of METmutations in lung cancer. Clin. Cancer Res 15, 5714–5723 (2009).
29. Hanahan, D. & Weinberg, R. A. Hallmarks of cancer: the next generation. Cell144, 646–674 (2011).
30. Wang, Y. et al. CDK7-dependent transcriptional addiction in triple-negativebreast cancer. Cell 163, 174–186 (2015).
31. Margolin A. A. et al. ARACNE: an algorithm for the reconstruction of generegulatory networks in a mammalian cellular context. BMC Bioinformatics 7,S7 (2006).
32. Castro, M. A. et al. Regulators of genetic risk of breast cancer identified byintegrative network analysis. Nat. Genet. 48, 12–21 (2016).
33. Fletcher, M. N. et al. Master regulators of FGFR2 signalling and breast cancerrisk. Nat. Commun. 4, 2464 (2013).
34. Han, B. et al. FOXC1-induced non-canonical WNT5A-MMP7 signalingregulates invasiveness in triple-negative breast cancer. Oncogene 37,1399–1408 (2018).
35. Pan, H. et al. Forkhead box C1 boosts triple-negative breast cancer metastasisthrough activating the transcription of chemokine receptor-4. Cancer Sci. 109,3794–3804 (2018).
36. Shu, S. et al. Response and resistance to BET bromodomain inhibitors intriple-negative breast cancer. Nature 529, 413–417 (2016).
37. Fornes, O. et al. JASPAR 2020: update of the open-access database oftranscription factor binding profiles. Nucleic Acids Res. 48, D87–D92 (2020).
38. Huang, W. et al. Interleukin-8 induces expression of FOXC1 to promotetransactivation of CXCR1 and CCL2 in hepatocellular carcinoma cell lines andformation of metastases in mice. Gastroenterology 149, 1053–1067 (2015).e1014.
39. Xie, S., Duan, J., Li, B., Zhou, P. & Hon, G. C. Multiplexed engineering andanalysis of combinatorial enhancer activity in single cells. Mol. cell 66,285–299 (2017). e285.
40. Wilson, T. R. et al. The molecular landscape of high-risk early breast cancer:comprehensive biomarker analysis of a phase III adjuvant population. NPJBreast Cancer 2, 16022 (2016).
41. Magnusson, K. et al. ANLN is a prognostic biomarker independent of Ki-67and essential for cell cycle progression in primary breast cancer. BMC Cancer16, 904 (2016).
42. Ciriello, G. et al. Comprehensive molecular portraits of invasive lobular breastcancer. Cell 163, 506–519 (2015).
43. Xi, Y. et al. Histone modification profiling in breast cancer cell lines highlightscommonalities and differences among subtypes. BMC Genomics 19, 150(2018).
NATURE COMMUNICATIONS | https://doi.org/10.1038/s41467-021-22445-0 ARTICLE
NATURE COMMUNICATIONS | (2021) 12:2242 | https://doi.org/10.1038/s41467-021-22445-0 | www.nature.com/naturecommunications 15

44. Raisner, R., Bainer, R., Haverty, P. M., Benedetti, K. L. & Gascoigne, K. E.Super-enhancer acquisition drives oncogene expression in triple negativebreast cancer. PLoS ONE 15, e0235343 (2020).
45. Hopkins, A., Mirzayans, F. & Berry, F. Foxc1 expression in early osteogenicdifferentiation is regulated by BMP4‐SMAD Activity. J. Cell. Biochem. 117,1707–1717 (2016).
46. Savage, J., Voronova, A., Mehta, V., Sendi-Mukasa, F. & Skerjanc, I. S.Canonical Wnt signaling regulates Foxc1/2 expression in P19 cells. Differ.;Res. Biol. diversity 79, 31–40 (2010).
47. Chung, S. et al. Identification of EGF-NF-kappaB-FOXC1 signaling axis inbasal-like breast cancer. Cell Commun. Signal.: CCS 15, 22 (2017).
48. Tkocz, D. et al. BRCA1 and GATA3 corepress FOXC1 to inhibit thepathogenesis of basal-like breast cancers. Oncogene 31, 3667–3678 (2012).
49. Lin, Y. J. et al. Tumor hypoxia regulates forkhead box C1 to promote lungcancer progression. Theranostics 7, 1177–1191 (2017).
50. Jia, Q., Chen, S., Tan, Y., Li, Y. & Tang, F. Oncogenic super-enhancerformation in tumorigenesis and its molecular mechanisms. Exp. Mol. Med 52,713–723 (2020).
51. Oegema, K., Savoian, M. S., Mitchison, T. J. & Field, C. M. Functional analysisof a human homologue of the Drosophila actin binding protein anillinsuggests a role in cytokinesis. J. Cell Biol. 150, 539–552 (2000).
52. Piekny, A. J. & Maddox, A. S. The myriad roles of Anillin during cytokinesis.Semin Cell Dev. Biol. 21, 881–891 (2010).
53. Lian, Y. F. et al. Anillin is required for tumor growth and regulated by miR-15a/miR-16-1 in HBV-related hepatocellular carcinoma. Aging (Albany NY)10, 1884–1901 (2018).
54. Zhou, W. et al. Knockdown of ANLN by lentivirus inhibits cell growth andmigration in human breast cancer. Mol. Cell Biochem 398, 11–19 (2015).
55. Suzuki, C. et al. ANLN plays a critical role in human lung carcinogenesisthrough the activation of RHOA and by involvement in the phosphoinositide3-kinase/AKT pathway. Cancer Res 65, 11314–11325 (2005).
56. Wang, D., Naydenov, N. G., Dozmorov, M. G., Koblinski, J. E. & Ivanov, A. I.Anillin regulates breast cancer cell migration, growth, and metastasis by non-canonical mechanisms involving control of cell stemness and differentiation.Breast cancer Res.: BCR 22, 3 (2020).
57. Langmead, B., Trapnell, C., Pop, M. & Salzberg, S. L. Ultrafast and memory-efficient alignment of short DNA sequences to the human genome. GenomeBiol. 10, R25 (2009).
58. Ramirez, F., Dundar, F., Diehl, S., Gruning, B. A. & Manke, T. deepTools: aflexible platform for exploring deep-sequencing data. Nucleic Acids Res 42,W187–W191 (2014).
59. Ernst, J. & Kellis, M. ChromHMM: automating chromatin-state discovery andcharacterization. Nat. Methods 9, 215–216 (2012).
60. Krueger, F. & Andrews, S. R. Bismark: a flexible aligner and methylation callerfor Bisulfite-Seq applications. Bioinformatics 27, 1571–1572 (2011).
61. Langmead, B. & Salzberg, S. L. Fast gapped-read alignment with Bowtie 2. Nat.Methods 9, 357–359 (2012).
62. Akalin, A. et al. methylKit: a comprehensive R package for the analysis ofgenome-wide DNA methylation profiles. Genome Biol. 13, R87 (2012).
63. Ritchie, M. E. et al. limma powers differential expression analyses for RNA-sequencing and microarray studies. Nucleic Acids Res. 43, e47 (2015).
64. Dobin, A. et al. STAR: ultrafast universal RNA-seq aligner. Bioinformatics 29,15–21 (2013).
65. Zhang, Y. et al. Model-based analysis of ChIP-Seq (MACS). Genome Biol. 9,R137 (2008).
66. Bailey, T. L. et al. MEME SUITE: tools for motif discovery and searching.Nucleic Acids Res. 37, W202–W208 (2009).
67. Miller, F. R., Santner, S. J., Tait, L. & Dawson, P. J. MCF10DCIS.comxenograft model of human comedo ductal carcinoma in situ. J. Natl CancerInst. 92, 1185–1186 (2000).
68. Debnath, J., Muthuswamy, S. K. & Brugge, J. S. Morphogenesis andoncogenesis of MCF-10A mammary epithelial acini grown in three-dimensional basement membrane cultures. Methods 30, 256–268 (2003).
69. Wang, X., Terfve, C., Rose, J. C. & Markowetz, F. HTSanalyzeR: an R/Bioconductor package for integrated network analysis of high-throughputscreens. Bioinformatics 27, 879–880 (2011).
AcknowledgementsThe authors thank members of the Chin and Wang laboratories for discussions. Funding:This study was supported by the National NatSural Science Foundation of China(81702728, 81972781 to Y.R.C., 81802384 to X.W.), Guangdong Basic and Applied BasicResearch Foundation (2019B030302012 to X.W.), Shenzhen Science and TechnologyInnovation Commission (JCYJ20170818095453642 to Y.R.C., JCYJ20170818104203065and JCYJ20180307124019360 to K.M.C., JCYJ20170413141047772, JCYJ2018050-7181659781 to L.Z.); the General Research Fund (11101517, 11103719 to Y.R.C,11102317, 11103718, 11103619 to X.W., 21100615, 11102118, 11101919 to K.M.C.,21101917, 11103318 to L.Z.), Collaborative Research Fund (C4041-17GF to X.W.,C7007-17GF to K.M.C.) and Research Impact Fund (R1020-18 to Y.R.C., and R4017-18to X.W.) from the Research Grants Council of the Hong Kong Special AdministrativeRegion, and the City University of Hong Kong (7200515 and 9610359 to Y.R.C., 9680252and 9678226 to X.W.).
Author contributionsH.H., J.H., and A.M. designed the experiments, performed the data collection and ana-lysis, and wrote the manuscript. Y.Z. and S.R. designed the experiments, and performedthe data collection as well as analysis. J.L., H.M., V.M., W.C. and W.W. performed thedata collection and analysis. Q.H., G.S, and W.C. collected clinical samples. L.Z., Q.H., andM.C. performed data analysis and interpretation. X.W. and Y.R.C. advised on theexperimental design, assisted with manuscript writing and supervised the study.
Competing interestsThe authors declare no competing interests.
Additional informationSupplementary information The online version contains supplementary materialavailable at https://doi.org/10.1038/s41467-021-22445-0.
Correspondence and requests for materials should be addressed to X.W. or Y.R.C.
Peer review information Nature Communications thanks Pedro Castelo-Branco, RogerGomis and the other, anonymous, reviewer(s) for their contribution to the peer review ofthis work. Peer reviewer reports are available.
Reprints and permission information is available at http://www.nature.com/reprints
Publisher’s note Springer Nature remains neutral with regard to jurisdictional claims inpublished maps and institutional affiliations.
Open Access This article is licensed under a Creative CommonsAttribution 4.0 International License, which permits use, sharing,
adaptation, distribution and reproduction in any medium or format, as long as you giveappropriate credit to the original author(s) and the source, provide a link to the CreativeCommons license, and indicate if changes were made. The images or other third partymaterial in this article are included in the article’s Creative Commons license, unlessindicated otherwise in a credit line to the material. If material is not included in thearticle’s Creative Commons license and your intended use is not permitted by statutoryregulation or exceeds the permitted use, you will need to obtain permission directly fromthe copyright holder. To view a copy of this license, visit http://creativecommons.org/licenses/by/4.0/.
© The Author(s) 2021
ARTICLE NATURE COMMUNICATIONS | https://doi.org/10.1038/s41467-021-22445-0
16 NATURE COMMUNICATIONS | (2021) 12:2242 | https://doi.org/10.1038/s41467-021-22445-0 | www.nature.com/naturecommunications