defining the structure - function horizontal meridian of
TRANSCRIPT

1
Defining the structure - function horizontal meridian of the human macula Daniel Lemor
M.B.,B.S.
A thesis submitted for the degree of Master of Philosophy at
The University of Queensland in 2014
School of Medicine

2
Abstract Purpose: To investigate the congruency of the retinal ganglion cell structure – function
relationship in the macular region of human subjects who manifest horizontal split fixation
due to glaucoma. Subjects with glaucoma who manifest asymmetric loss of retinal
ganglion cells across the horizontal meridian macula were examined using structural
measures provided by spectral domain optical coherence tomography (SD-OCT) and
functional measures using automated visual field perimetry (HVF). Using this data, the
horizontal meridian of the human macula was defined using structure – function linking
analysis of retinal ganglion cell integrity.
Methods: 26 stable glaucoma subjects who manifest split fixation on HVF 24-2 S/S testing
were identified and performed Heidelberg Spectralis® SD-OCT posterior pole asymmetry
analyses. The posterior pole asymmetry analysis image was oriented in a systematic
manner so that the macular thickness grid was centered on the fovea and its horizontal
meridian intersected the optic nerve head at five pre-selected equidistant locations along
the central vertical axis. The posterior pole asymmetry analysis for each optic nerve head
intercept generated average superior and inferior retinal hemifield and temporal quadrant
thicknesses and the superior to inferior thickness ratio calculated.
Results: The subjects had a Humphrey Visual Field 24-2 SITA Standard (HVF S/S)
average Mean Defect = 7.43 (SD = 4.58) and an average Pattern Standard Deviation =
9.60 (SD = 2.77). A one-way repeated measures ANOVA demonstrates a significant
difference between the optic nerve head intercept locations for the hemifield ratios [F(4,
26)=19.37, p<.0001], as well as for the temporal quadrant ratios [F(4,16)=13.3, p <.0001].
Tukey post-hoc pairwise comparisons of the hemifield and quadrant thickness ratios
demonstrate a significant difference between the superior and inferior poles (p<.01). The
SD-OCT thickness ratios for both the hemifield and temporal quadrants increase as the
horizontal meridian migrates towards the inferior pole of the optic nerve head.
Conclusions: We demonstrate that in order to maximize the hemifield ratio and the
congruency of the macular structure - function relationship in subjects with glaucoma, the
horizontal meridian of the posterior pole asymmetry grid should intersect the optic nerve
head near the inferior pole. This is in contradistinction to the conventional practice of
placing the horizontal median through the geometric center of the optic nerve head.

3
Declaration by author This thesis is composed of my original work, and contains no material previously published
or written by another person except where due reference has been made in the text. I
have clearly stated the contribution by others to jointly-authored works that I have included
in my thesis.
I have clearly stated the contribution of others to my thesis as a whole, including statistical
assistance, survey design, data analysis, significant technical procedures, professional
editorial advice, and any other original research work used or reported in my thesis. The
content of my thesis is the result of work I have carried out since the commencement of
my research higher degree candidature and does not include a substantial part of work
that has been submitted to qualify for the award of any other degree or diploma in any
university or other tertiary institution. I have clearly stated which parts of my thesis, if any,
have been submitted to qualify for another award.
I acknowledge that an electronic copy of my thesis must be lodged with the University
Library and, subject to the policy and procedures of The University of Queensland, the
thesis be made available for research and study in accordance with the Copyright Act
1968 unless a period of embargo has been approved by the Dean of the Graduate School.
I acknowledge that copyright of all material contained in my thesis resides with the
copyright holder(s) of that material. Where appropriate I have obtained copyright
permission from the copyright holder to reproduce material in this thesis.
4
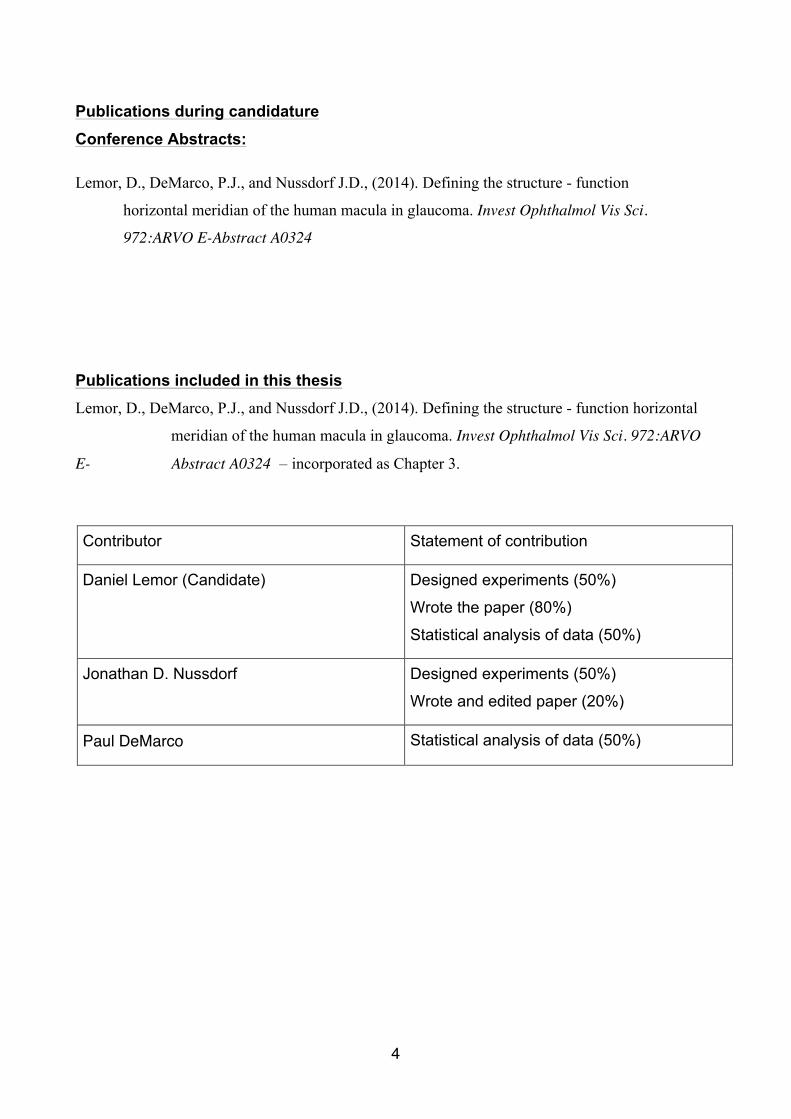
Publications during candidature Conference Abstracts:
Lemor, D., DeMarco, P.J., and Nussdorf J.D., (2014). Defining the structure - function
horizontal meridian of the human macula in glaucoma. Invest Ophthalmol Vis Sci.
972:ARVO E-Abstract A0324
Publications included in this thesis Lemor, D., DeMarco, P.J., and Nussdorf J.D., (2014). Defining the structure - function horizontal
meridian of the human macula in glaucoma. Invest Ophthalmol Vis Sci. 972:ARVO
E- Abstract A0324 – incorporated as Chapter 3.
Contributor Statement of contribution
Daniel Lemor (Candidate) Designed experiments (50%)
Wrote the paper (80%)
Statistical analysis of data (50%)
Jonathan D. Nussdorf Designed experiments (50%)
Wrote and edited paper (20%)
Paul DeMarco Statistical analysis of data (50%)

5
Contributions by others to the thesis Jonathan D. Nussdorf, MD - Assisted with original study conception and design.
Paul DeMarco, PhD - Assisted with statistical analysis and interpretation of the data.
Statement of parts of the thesis submitted to qualify for the award of another degree None.

6
Acknowledgements I would like to thank the following people for their support during the course of my candidature: Jonathan Nussdorf - For your invaluable help and guidance. Without you this thesis would
not have been possible.
Paul DeMarco - For your incredibly useful advice during every stage of my research.
Nigel Barnett - For being the first to introduce me to structure - function research and for
encouraging me to pursue this degree.
Di Eley - For helping me successfully navigate the requirements of candidature and
without whom this thesis would never have been submitted.
Ochsner Clinic Foundation - For allowing me to participate in research actives on their
campus and for their support in acquiring the equipment necessary to conduct my
research.
University of Queensland Graduate School - For providing me with a scholarship that
made it possible for me to pursue my research interests.

7
Keywords glaucoma, retinal thickness, OCT, structure - function, macula, retinal ganglion cell, visual
field
Australian and New Zealand Standard Research Classifications (ANZSRC) ANZSRC code: 111301, Ophthalmology, 80%
ANZSRC code: 111302, Optic Technology, 10%
ANZSRC code: 111303, Vision Science, 10%
Fields of Research (FoR) Classification FoR code: 1113, Ophthalmology and Optometry, 100%

8
Table of Contents
Abstract - 2
Declaration by Author - 3
Publications During Candidature - 4
Publications Included in this Thesis - 4
Contributions by Others to Thesis - 5
Acknowledgments - 6
Keywords, ANZSRC, FoR Classifications - 7
List of Figures and Tables - 9
List of Abbreviations - 10
Introduction - 12
Background - 13
Clinical Data to Date - 15
Study Objectives - 16
Protocol - 17
General Design - 18
Study Endpoints - 18
Subject Selection - 19
Statistical Plan - 19
Study Design - 20
Population - 20
Methods - 21
Results - 23
Discussion - 22
Conclusion - 24
Bibliography - 25
Appendices - 29

9
List of Figures & Tables
Figure 1 – 31
Figure 2 – 32
Figure 3 – 33
Figure 4 – 34
Figure 5 – 35
Figure 6 – 36
Figure 7 – 37
Figure 8 – 38
10
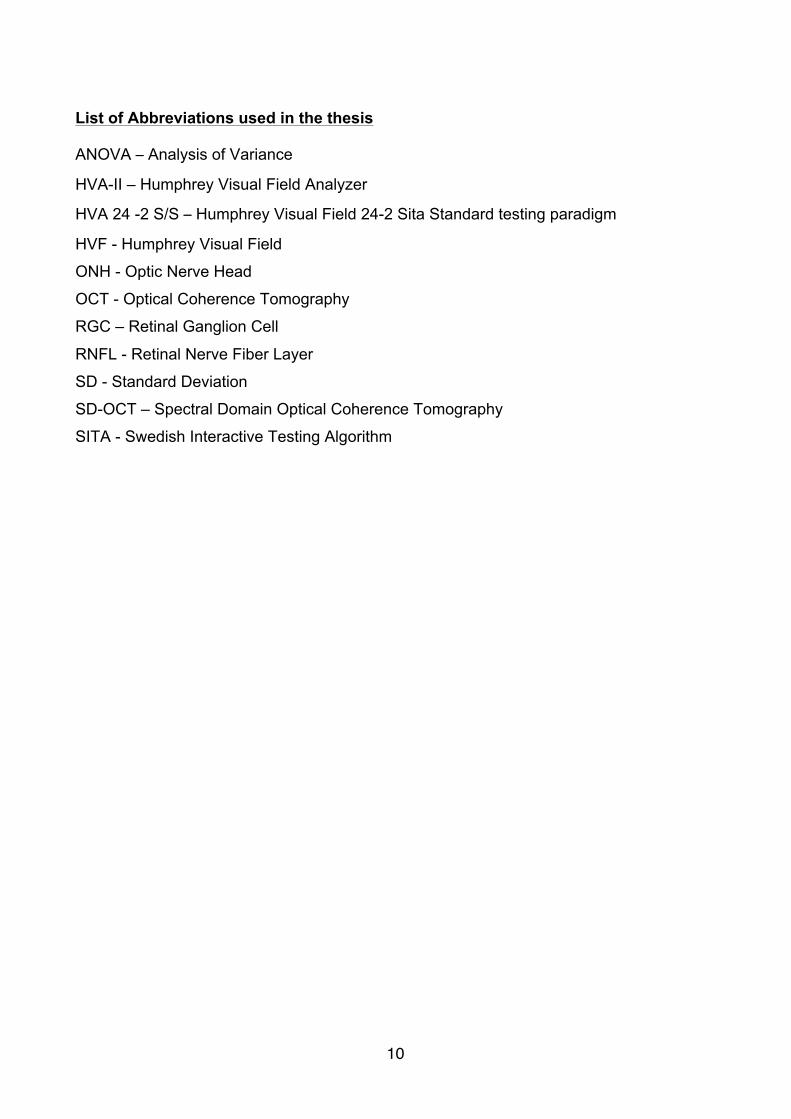
List of Abbreviations used in the thesis
ANOVA – Analysis of Variance
HVA-II – Humphrey Visual Field Analyzer
HVA 24 -2 S/S – Humphrey Visual Field 24-2 Sita Standard testing paradigm
HVF - Humphrey Visual Field
ONH - Optic Nerve Head
OCT - Optical Coherence Tomography
RGC – Retinal Ganglion Cell
RNFL - Retinal Nerve Fiber Layer
SD - Standard Deviation
SD-OCT – Spectral Domain Optical Coherence Tomography
SITA - Swedish Interactive Testing Algorithm
11
Introduction
Glaucoma is defined as a characteristic optic neuropathy with characteristic visual field
loss. 7-9 Glaucomatous optic neuropathy is due to the loss of retinal ganglion cell (RGC)
axons with subsequent loss of vision. Glaucoma is the second leading cause of blindness
worldwide and affects an estimated 60 million people in 2010.5,6
The loss of RGC activity leads to characteristic patterns of vision loss and blindness. The
visual field represents the functional correlate of glaucoma. 1, 12 Early in the disease
process the visual field may appear full and healthy. 13, 14 As the disease progresses with
continued loss of RGC activity, the visual field is degraded and this loss negatively impacts
the patient’s quality of life. 15-17
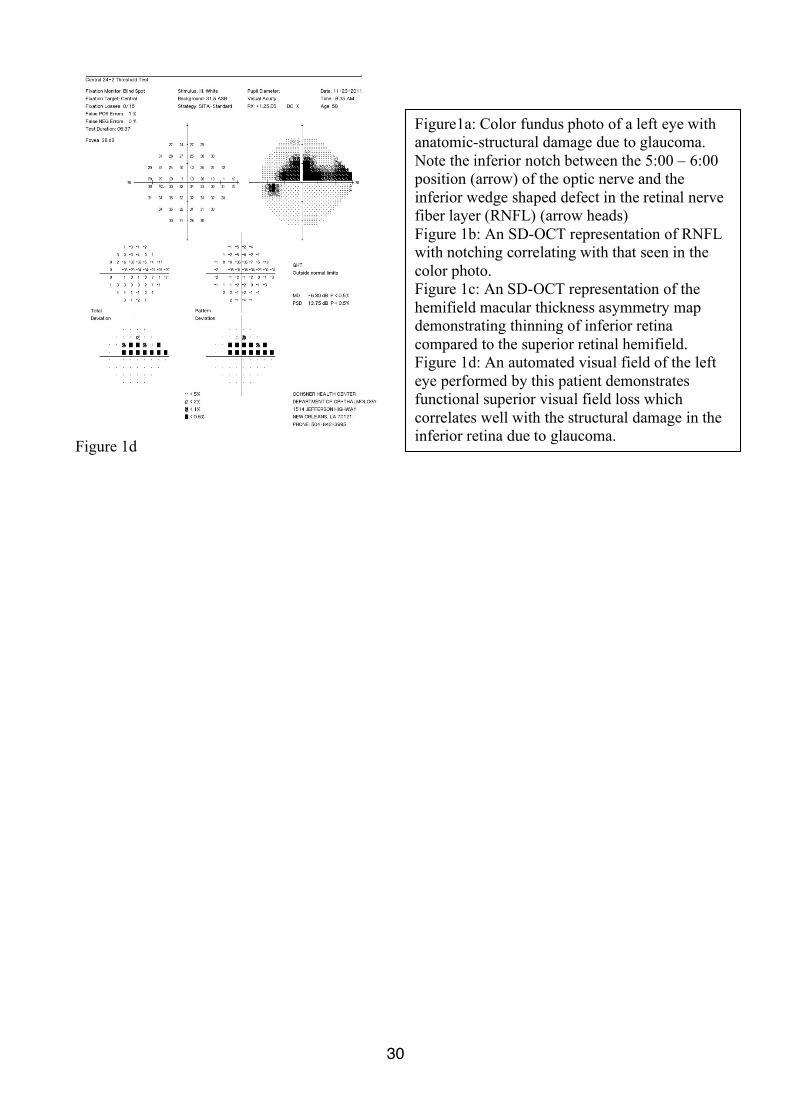
Please refer to Figures 1a-d that aid in describing the linkage between the anatomical-
structural changes at the optic nerve head, retinal nerve fiber layer and functional visual
field performance in a patient with glaucoma.
The anatomical correlates of RGCs are represented by the thickness of the 1) macular, 2)
retinal nerve fiber layer and 3) retinal ganglion cell layer as measured by optical coherence
tomography. These anatomical correlates are known to diminish in thickness and volume
as a result of glaucoma (monkey 18, 19, human 20-33). We used a Heidelberg spectral
domain – optical coherence tomography (SD-OCT, Spectralis®) device to quantitatively
measure these structures noninvasively in the living human eye. 34, 35(Figures 1b & 1c)
Retinal ganglion cells transmit visual signals from the retina through the optic nerve to the
higher brain centers, which provide for our perception of the visual world. The function of
retinal ganglion cells is represented by the subject’s performance on automated visual field
testing. Because retinal ganglion cell distribution is highly organized topographically
across the retina and within the optic nerve, the pattern of visual field sensitivity correlates
well with the presence and absence of retinal ganglion cell activity at a given location in
the retina. Thus, loss of retinal ganglion cells in a given region of the retina leads to a
representative loss of sensitivity in the visual field. (monkey36, human13, 14, 37) (Figures 1a &
1d) This forms the basis of the structure - function relationship between RGC location and
functional visual field performance.

12
The visual field is psychophysically measured using computer-assisted devices in an
automated, noninvasive fashion.38 We utilized the Humphrey Visual Field Analyzer (HVA-
II®, Carl Zeiss Meditec Inc, Dublin, CA, USA).
We conducted a structure – function analysis of human retinal ganglion cell (RGC)
integrity. This study is intended to provide a better understanding of the structure – function relationship between: (1) macular thickness (structural anatomy) and (2) visual
field performance (psychophysical function). We are evaluating the congruency of the
topographic alignment of RGCs across the human macula region with its functional,
psychophysically, derived visual performance. These topographic and psychophysical
measurements were performed on the same eye to minimize between inter-subject
confounding factors and enhance capture of meaningful data.
Background
Visual perception is the product of an intricate neuronal processing beginning in the retina
and proceeding to higher brain centers. Images enter the eye as photons of light and are
focused by the lens onto the retina where the photoreceptor cells transduce the capture of
photons into electrical signals. These signals are processed in the layers of the retina
resulting in transmission of bioelectrical signals to the brain through the optic nerve. The
optic nerve represents the final common pathway for visual information transmission from
the eye to the brain. The optic nerve is made up of bundles of retinal ganglion cell (RGC)
axons which originate from cell bodies in the retina and then coalesce and exit the back of
the eye to form the optic nerve. (Figure 2) Diseases of the optic nerve represent damage
to the retinal ganglion cell axons. When a critical number of retinal ganglion cell axons
become damaged or die, visual function can be degraded to the point of blindness and
thus negatively impact the quality of life for the patient.
Retinal ganglion cells in the inner retina and their axons in the optic nerve are
topographically distributed in a highly organized fashion and tightly linked with the
resultant visual space perceived by the individual.21 Thus, there is an organized linkage
between the structural distribution of retinal ganglion cell axons and the function of the
optic nerve itself 47. Visual field sensitivity correlates well with the presence and absence

13
of retinal ganglion cell activity at a given location in the retina. Damage to a specific region
of retinal ganglion cells in the retina or axons in the optic nerve head leads to a
representative loss of sensitivity in the visual field. The reverse is also true with the ability
to trace visual field loss to a specific portion of the optic nerve head. This relationship
between the location of RGCs and their axons with their visual field locations forms the
structure - function relationship we are exploiting in this study. Our goal is to examine this
relationship; questioning whether current assumptions of the topographic structure – function alignment is correct and to suggest necessary changes in order to improve the
congruency of the retinal ganglion cell structure – function relationship in the human
macular region.
Spectral domain optical coherence tomography (SD-OCT) provides non-invasive detailed
imaging of the structures of the retina. With the advent of SD-OCT we are able to obtain
high-resolution images of the retinal layers from the inner limiting membrane to Bruch’s
Membrane. SD-OCT uses near infrared light to acquire micrometer resolution three-
dimensional images of biological tissue2. The topographic correlates of RGC activity are
represented by the thickness of the macula, retinal nerve fiber layer, and retinal ganglion
cell layer as measured by optical coherence tomography (OCT)13. These anatomical
correlates are known to diminish in thickness and volume as a result of glaucoma27. In
this study, loss of RGCs due to glaucoma is measured using SD-OCT macular thickness
asymmetry across the horizontal raphe within a given eye.
Psychophysical testing, using a Humphrey visual field analyzer (HVA), is accomplished by
presenting the subject with standard white on white stimuli under standardized testing
conditions to measure visual field performance and provides the functional correlate of
RGC activity21.
This study examines macular structure and function for a variety of reasons. Chief among
them is that 80% of the RGCs in the human retina are located within the macular region.
Furthermore, there is variation of the RGC distribution in the retina among the human
population and the macula is strong candidate for the site of least variability50. In addition,
we chose to focus on total macular thickness because the current commercially available
software automatically calculates macular thickness with high reliability and low variability
from the inner limiting membrane to Bruch’s membrane.

14
In order to better correlate functional visual field loss to the structural loss seen on OCT
testing a more precise understanding of the structure function relationship between these
overlapping measures of RGC integrity is needed. We attempted to guide standardization
for the measurement and continued monitoring of RGC structural distribution in the human
macular region. We used glaucoma subjects as a model to investigate the RGC structure -
function relationship in the human macula. We hypothesized that the asymmetric visual
field loss across the horizontal raphe typical of the glaucomatous disease process will be
reflected in an SD-OCT macular hemifield difference and thus define the anatomic
horizontal meridian of the human macula (Figure 2a-d). We leveraged this presumed
asymmetric RGC loss by examining patients who manifest significant asymmetric visual
field loss within the macular characterized by split fixation. (Figure 2d)
Protocol
Clinical Data to Date
Much of the structure - function findings reviewed above is derived from cross-sectional
studies, examining groups of subjects at a single point in time during the disease process.
Few studies have utilized within-subject control design, measuring neighboring areas of
retina within the same eye as a control. Our study incorporates this design feature in order
to help mitigate experimental noise found in inter-subject comparisons. In addition, our
testing procedures are designed to capture same-eye control data during a single data
collection session.
We planed to measure various structural and functional correlates of retinal ganglion cell
integrity with special attention given to central macular function which is responsible for
fine acuity vision and tends to produce less variable results when measured.
In general, optic neuropathies tend to affect the entire optic nerve. However in specific
cases, we plan to leverage the asymmetric loss of RGCs found in the same eye. This
characteristic asymmetry is typically manifest by RGC loss and visual field depression
worse in one visual hemifield relative to the other and split along the horizontal meridian.
(Figures 2a-d) Our study design leverages this hemifield difference and we will analyze
the structure - function discrepancies across the horizontal meridian in a given eye using
two modalities 1) anatomical structure: SD-OCT, and 2) psychophysical function: HVA-II.

15
Few studies have leveraged this asymmetric loss of structure and function in the glaucoma
patient (macular hemifield thickness compared to visual field hemifield performance41, 42).
Performing these measurements in the same eye allows us to use each eye as its own
control and enhance our ability to detect meaningful differences in the anatomy and
psychophysical measurements that could otherwise be lost in sampling variability and
detecting signal from noise inherent in our data acquisition equipment. Collecting
comparison data in the same macula region will lessen the influence of inter- subject and
intra-ocular variability.
By utilizing the asymmetric damage within a given eye, we can better characterize the
interdependency between 1) macular thickness, and 2) visual field performance in the
macula region of the human.
Study Objectives Purpose
The study is designed to examine RGC structure and function in subjects with
glaucomatous optic neuropathy. We utilized noninvasive techniques and devices that are
not experimental in nature. We intended to:
1) Measure the RGC structure in the macula and nerve fiber layer utilizing the
Heidelberg SD-OCT Spectralis® device.
2) Measure central visual field function utilizing a standard HVA-24 Sita-Standard
automated perimetry testing paradigm.
The study design allowed for structure - function comparisons to be made:
1) Within the same study eye
2) Between eyes of the same subject and
3) Between eyes of separate subjects
This study provides for a foundation of future studies that are planned to characterize the
short and long term structure – function changes of retinal ganglion cell integrity in
subjects with various optic neuropathies.
General Design
This is a nonrandomized, prospective, observational study designed to correlate the
structural and functional surrogates of the retinal ganglion cell integrity in the human

16
retina. Subjects were provided the usual evaluation and care for their optic neuropathy
and any other underlying ocular conditions. When appropriate, both eyes of the subject
underwent examination and testing. The timing and frequency of exames and data
collection followed the usual care practice of the attending physician and were directed by
the degree and stability of the patient’s optic neuropathy. Care included standard imaging
of the optic nerve head region and macula using the Heidelberg SD-OCT Spectralis®
device and assessment of visual field performance utilizing the HVA 24-2 S/S testing
protocol. Each of these noninvasive clinical tests were performed by certified ocular
photographers adept at performing these studies. All studies were performed at the
Department of Ophthalmology, Ochsner Clinic, 1514 Jefferson Highway, New Orleans, LA,
USA.
Study Endpoints
Primary Study Endpoints
This study represents our initial attempt to systematically collect and follow correlates of
retinal ganglion cell structure and function in the human retina. Since subjects recruited
for this study have advanced glaucoma and are very familiar with the testing algorithms,
we anticipate that single exam sessions will be sufficient to capture SD-OCT images and
HVA 24-2 S/S performance. However, for some subjects, the reliability or quality of the
collected data may be such that a repeat of some or all of these tests will be required.
Repeated measures for unreliable clinic data are typical and usual for many
ophthalmology subjects.
Secondary Study Endpoints
With regard to optic neuropathies and glaucoma specifically, in general, visual field
performance is directly related to macula and retinal nerve fiber layer thickness; the thicker
the retina and nerve fiber layer the better visual field performance. However, this
relationship may not be strictly linear such that early in the glaucomatous disease process,
visual field performance tends to be better than that suggested from thinning of the retina
and RNFL. (monkey 18, 19, human 20-33) By the time visual field defects are detected, up to
30% of the optic nerve can be damaged.13, 14 It is unclear why visual field performance
tends to be more robust and resistant to change compared to optic nerve head structure in
some patients with glaucoma. 47, 48

17
In addition, later in the glaucoma disease process, the visual field performance is more
degraded than predictions based upon structural measure – given the thickness of the
retina and nerve fiber layer, the visual field should be better than observed. The
suggestion here is that the nerve fiber layer ceases to thin and is repopulated by glial cells
as the RGCs die. 46
Our study is a step in providing answers regarding the discrepancies in the linkage
between the structure and function of retinal ganglion cell integrity in the human retina.
Primary Safety Endpoints
Our study utilizes non-invasive techniques with low anticipated risks to the subjects. The
subjects in this study will undergo usual and accepted evaluations provided to subjects
with glaucoma. Should any adverse effect(s) be noted while undergoing these routine
clinical tests, the study will be suspended until such time as the cause of the adverse
effect(s) is identified and corrected.
Subject Selection and Withdrawal
Inclusion Criteria
Subjects diagnosed with glaucoma;
AND
Subjects with a best-corrected visual acuity of 20/40 or better in at least one eye
AND
Subjects are able to provide reliable visual field performance using the HVA 24-2 S/S
testing algorithms
AND
Subjects without significant ocular pathology affecting retinal thickness or retinal image
quality.
Exclusion Criteria
Poorly controlled ocular disease of any sort in either eye
OR
Subjects with a best-corrected visual acuity worse than 20/40 in the better eye
OR
Subjects unable to provide reliable visual field performance using the HVA 24-2 testing
algorithms

18
OR
Subjects with significant ocular pathology affecting retinal thickness or retinal image quality
Control subjects without ocular disease as determined by an experienced ophthalmologist
will also be included. These subjects must satisfy all inclusion and exclusion criteria except
those related to ocular disease.
Subject Recruitment and Screening
Following IRB approval, subjects who are to the patients of Dr. Jonathan D. Nussdorf, the
principle investigator, were recruited from the Department of Ophthalmology, Ochsner
Medical Center in New Orleans for consideration of inclusion to this study. The selection
of subjects were not be made in random fashion. Potential subjects were identified by the
principle investigator as those who have stable, well controlled glaucoma and would be
able to cooperate with the proposed non-invasive tests and who were likely to perform
reliably well on visual field testing. Subjects were identified and consented for
participation in this study prior to or at the time of their first study visit by the principle
investigator.
Early Withdrawal of Subjects
Subjects may withdraw from this study at any point in time.
When and How to Withdraw Subjects
Subjects will be withdrawn immediately and at any time at their request. Subjects will be
withdrawn if they exhibit a change in their underlying ocular pathology that would interfere
with the reliability of the data collected; in this case the decision to withdraw will be at the
discretion of the principle investigator.
Data Collection and Follow-up for Withdrawn Subjects
Subjects in this study will continue to receive the usual care provided to any patient with
glaucoma. Any data that may have already been accumulated will continue to be used
unless the subject specifically requests otherwise.
19
Statistical Plan
Sample Size Determination
We planned to have ongoing recruitment of subjects with various optic neuropathies over
the years. We planned to perform short term cross sectional studies and long term studies
to evaluate outcomes and risk factors for progression.
Statistical Methods:
Correlation data analysis
Least Squares Regression analysis
ANOVA
Subject Population(s) for Analysis:
Subjects with glaucoma were recruited from the Department of Ophthalmology, Ochsner
Clinic Foundation, New Orleans.

20
Study Design
This study was conducted according the tenets of the Declaration of Helsinki and was
approved by the Ochsner Clinic Foundation’s institutional review board. All subjects gave
informed consent to participate in the study.
Population
Twenty-six subjects with well controlled, stable glaucoma and who manifest central visual
field loss confined to a single retinal hemifield respecting the horizontal meridian (also
referred to split fixation). For the purpose of this study the visual field loss was defined as a
cluster of 3 or more points that were all worse than the .05 probability level on the total
and/or pattern deviation plots.
Subjects were recruited from the glaucoma service of a single provider (JD Nussdorf) at
Ochsner Medical Center in New Orleans. Subjects were selected for inclusion in the study
in a non-random manner at the discretion of the investigator. All subjects in the study
underwent a complete ophthalmic evaluation including, best corrected visual acuity
refraction, SD-OCT imaging, fundus photography, and a dilated fundus exam prior to
selection for inclusion in the study, and standardized Humphrey Visual Analyzer (HVA)
testing. Subjects were also required to have a best-corrected visual acuity greater than
20/40 in the better eye. Subjects were required to have well controlled glaucoma with
intraocular pressure near the target range and without evidence of progressive retinal
nerve fiber layer or visual field loss. Subjects were excluded if they had a history of retina
disease other than glaucoma including hypertensive changes, cystoid macular edema,
diabetic retinopathy, macular degeneration, epiretinal membrane, optic neuropathies other
than glaucoma, or any other disease affecting the macula. Subjects were excluded if they
had received treatment with any intravitreal injections or retina laser procedures. Subjects
with visually significant cataracts that could interfere with retinal imaging or HVA
performance were excluded. Subjects with prior cataract surgery were accepted if the
surgery was at least 6 months in the past with no ongoing complications, however any
other ocular surgery resulted in exclusion from the study. Subjects were required to be
non-naïve to HVA testing and were excluded if they were unable to provide reliable
performance on HVA 24-2 SITA standard testing algorithm. HVA testing was deemed
reliable using the guidelines set out by the ocular hypertension treatment study. Namely,
subjects were required to have less than 33% false positives, less than 33% false

21
negatives, and less than 33% fixation loses. HVA testing was conducted by trained
technicians who monitored and coached the subjects during testing. All study related
testing must have been completed within a period of 3 months to qualify for inclusion. In
subjects where both eyes met inclusion criteria a single eye was randomly chosen for
inclusion. Controls were recruited from among subjects and staff of Ochsner Medical
Center and met identical criteria as subjects except for the presence of glaucoma.
Methods
All subjects were imaged using the unmodified posterior pole asymmetry analysis protocol
of the Heidelberg Engineering Spectralis® SD-OCT (Heidelberg Engineering, Carlsbad,
CA). Subjects were asked to look at a blue fixation target in the camera that centered the
scan on their fovea. For the purposes of this study the fovea was defined as the center of
the foveal pit. The scan covered an area of the retina of 30 by 25 degrees centered on the
fovea. The scan provided 61 B-scans 120 um apart for each scan, with an optical
resolution of 7 um axially and 14 um laterally. The resulting image covers a 24 by 24-
degree retinal region and is divided into 64 cells with each cell representing the average
retinal thickness of a 3 by 3 degree region. The Spectralis® software provided auto-
segmentation of the retinal layers between the internal limiting membrane and Bruch’s
membrane. In 1 case where the software was unable to perform this task the investigator
segmented the layers manually.
The grid was then manipulated in a systematic manner such that it was centered on the
fovea and the horizontal meridian aligned with 5 predetermined intercepts through the
vertical axis of the optic nerve head (ONH). The locations of the intercepts were chosen to
encompass the entire breadth of the ONH, spanning from the superior pole and
progressing to the inferior pole of the ONH. The intercepts were: the superior pole of the
ONH, half way between the superior pole and the mid-point of the ONH, the mid-point of
the ONH, half way between the mid-point of the ONH and the inferior pole, and the inferior
pole of the ONH (Figure 6). For each alignment setting, the Spectralis® software

22
generated average macular thicknesses for the superior and inferior retinal hemifields.
These average thicknesses were then used to create a “hemifield ratio” of superior to
inferior average macular thickness when the inferior macular thickness was thinner than
the superior macular thickness. A “temporal quadrant ratio” was similarly calculated using
the average thicknesses of the superior temporal and inferior temporal quadrants of the
macular thickness grid. In cases when the inferior macular thickness was thicker than the
superior macular thickness then the ratio was flipped to produce a macular thickness
ration greater than one. When subjects exhibited inferior visual field loss, and thus
superior macular thinning, the calculation was inverted such that the ratio was calculated
as inferior retinal thickness over superior retinal thickness. This was to ensure the ratio
remained greater than one and congruent with the results of patients with superior visual
field loss.
Results
Twenty-six eyes of 26 subjects were tested and there were 20 females and 6 males with
an average age of 64 years old. The subjects had an HVA 24-2 S/S average Mean
Defect=7.43 (SD= 4.58) and an average Pattern Standard Deviation=9.60 (SD=2.77)
(Figure 5). The hemifield and quadrant ratios for the different ONH intercepts are listed in
figure 8. A one-way repeated measures ANOVA demonstrates a significant difference
between the intercept locations for the hemifield ratios [F(4, 26)=19.37, p<.0001] (figure 3),
as well as for the temporal quadrant ratios [F(4,16)=13.3, p <.0001] (figure 4).
Tukey post-hoc pairwise comparisons of the hemifield and quadrant thickness ratios
demonstrate a statistical significant difference between the superior and inferior poles
(p<.01) and the superior pole and halfway between the midpoint of the ONH and the
inferior pole (p<.01). The thickness ratios for both the hemifield and temporal quadrants
increase as the horizontal meridian migrates from the superior pole towards the inferior
pole of the ONH and reaches a maximum near the inferior pole. Tukey post-hoc
comparisons were used without the Bonferoni correction in an attempt to remain as
conservative as possible with our statistical analysis.
23
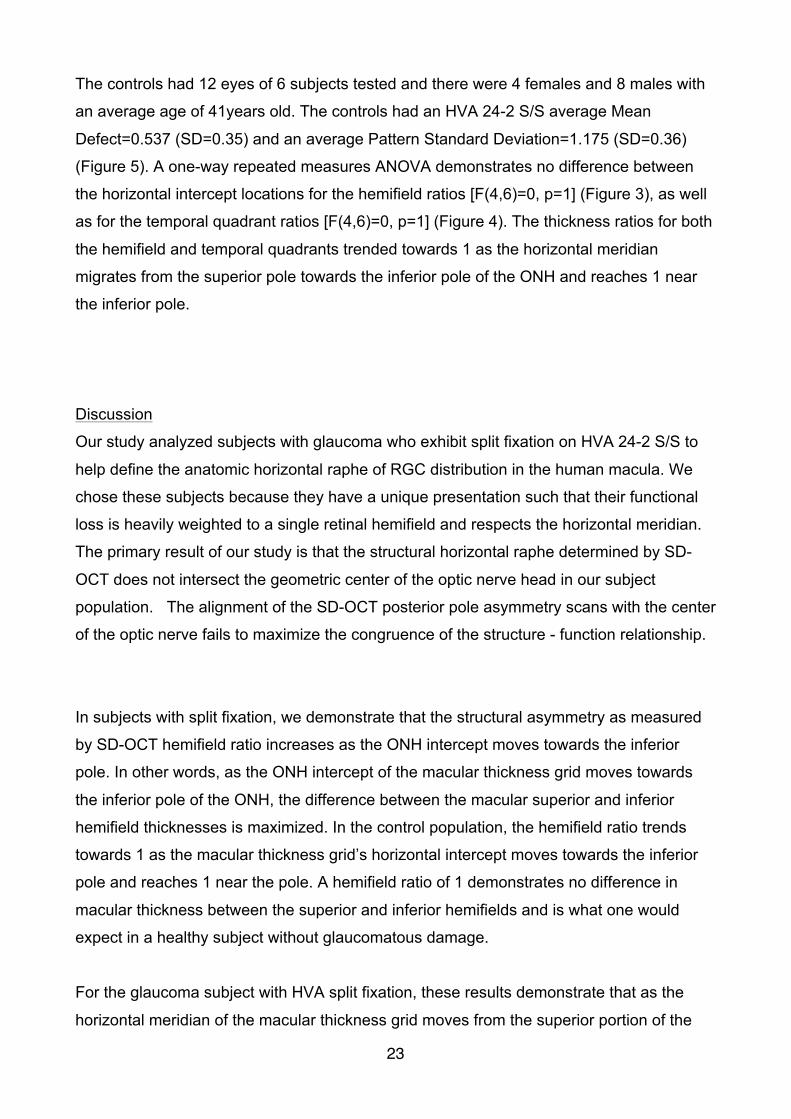
The controls had 12 eyes of 6 subjects tested and there were 4 females and 8 males with
an average age of 41years old. The controls had an HVA 24-2 S/S average Mean
Defect=0.537 (SD=0.35) and an average Pattern Standard Deviation=1.175 (SD=0.36)
(Figure 5). A one-way repeated measures ANOVA demonstrates no difference between
the horizontal intercept locations for the hemifield ratios [F(4,6)=0, p=1] (Figure 3), as well
as for the temporal quadrant ratios [F(4,6)=0, p=1] (Figure 4). The thickness ratios for both
the hemifield and temporal quadrants trended towards 1 as the horizontal meridian
migrates from the superior pole towards the inferior pole of the ONH and reaches 1 near
the inferior pole.
Discussion
Our study analyzed subjects with glaucoma who exhibit split fixation on HVA 24-2 S/S to
help define the anatomic horizontal raphe of RGC distribution in the human macula. We
chose these subjects because they have a unique presentation such that their functional
loss is heavily weighted to a single retinal hemifield and respects the horizontal meridian.
The primary result of our study is that the structural horizontal raphe determined by SD-
OCT does not intersect the geometric center of the optic nerve head in our subject
population. The alignment of the SD-OCT posterior pole asymmetry scans with the center
of the optic nerve fails to maximize the congruence of the structure - function relationship.
In subjects with split fixation, we demonstrate that the structural asymmetry as measured
by SD-OCT hemifield ratio increases as the ONH intercept moves towards the inferior
pole. In other words, as the ONH intercept of the macular thickness grid moves towards
the inferior pole of the ONH, the difference between the macular superior and inferior
hemifield thicknesses is maximized. In the control population, the hemifield ratio trends
towards 1 as the macular thickness grid’s horizontal intercept moves towards the inferior
pole and reaches 1 near the pole. A hemifield ratio of 1 demonstrates no difference in
macular thickness between the superior and inferior hemifields and is what one would
expect in a healthy subject without glaucomatous damage.
For the glaucoma subject with HVA split fixation, these results demonstrate that as the
horizontal meridian of the macular thickness grid moves from the superior portion of the
24
optic nerve towards the inferior pole, the difference between macular hemifield
thicknesses increases. However, in control subjects, a similar adjustment of the horizontal
meridian minimizes the hemifield ratio. These results demonstrate that the concordance
between the anatomic and functional correlates of RGC distribution in the human macula
increases as the horizontal raphe intersects the inferior portion of the optic nerve head.
In order to avoid the influence of the papillomacular bundle the temporal quadrant ratio
was determined. The temporal quadrant ratio demonstrated a similar pattern of results to
the hemifield ratio. In subjects with split fixation, the difference between the superior and
inferior temporal quadrant thickness increases as the horizontal meridian of the macular
thickness grid migrates toward the inferior pole of the ONH. In addition, for the control
subjects the temporal quadrant ratio approached 1 as the horizontal meridian of the
macular thickness grid moves towards the inferior pole of the ONH.
Together our findings demonstrate that the anatomic horizontal meridian of the human
macula lies in an alignment between the fovea and the inferior portion of the ONH. We
demonstrate that in both subjects with split fixation and control subjects normal SD-OCT
and HVA testing the accurate horizontal alignment of the SD-OCT macular grid is along a
line between the center of the fovea and intersecting near the inferior pole of the ONH.
While we would like to be more precise in our delineation of the horizontal meridian the
limitations imposed by examining only five ONH intercepts prevents this. However, we can
say with certainty that aligning the horizontal median through the geometric center of the
optic nerve is not anatomically sound. The structural correlate of the horizontal raphe of
the human macula intersects the inferior region of the ONH in contradistinction to the usual
clinical assumption that the RGC fiber distribution corresponds with the geometric center
of the ONH. 51
Conclusion
We demonstrate that in order to maximize the congruency of the macular structure -
function relationship in our subject pool, the horizontal meridian of the SD-OCT posterior
pole asymmetry grid centered on the fovea intersects the inferior pole of the optic nerve
head. This is in contradistinction to the usual practice of placing the horizontal median
through the geometric center of the optic nerve head. This alignment of the macular

25
thickness grid provides a more accurate anatomic representation of the RGC distribution in
the macula and will improve detection and monitoring progression of RGC loss.
Furthermore, an anatomically accurate alignment will improve our understanding of the
structure - function relationships present in the human macula.

26
Bibliography or List of References
1. Keltner JL, Johnson CA, Cello KE, et al. Classification of visual field abnormalities in the ocular hypertension treatment study. Archives of ophthalmology 2003;121:643-650. 2. Gabriele ML, Wollstein G, Ishikawa H, et al. Optical coherence tomography: history, current status, and laboratory work. Investigative ophthalmology & visual science 2011;52:2425-2436. 3. Monteiro ML, Cunha LP, Costa-Cunha LV, Maia OO, Jr., Oyamada MK. Relationship between optical coherence tomography, pattern electroretinogram and automated perimetry in eyes with temporal hemianopia from chiasmal compression. Investigative ophthalmology & visual science 2009;50:3535-3541. 4. Hood DC, Anderson S, Rouleau J, et al. Retinal nerve fiber structure versus visual field function in subjects with ischemic optic neuropathy. A test of a linear model. Ophthalmology 2008;115:904-910. 5. Romero RS, Gutierrez I, Wang E, et al. Homonymous hemimacular thinning: a unique presentation of optic tract injury in neuromyelitis optica. Journal of neuro-ophthalmology : the official journal of the North American Neuro-Ophthalmology Society 2012;32:150-153. 6. Sakai RE, Feller DJ, Galetta KM, Galetta SL, Balcer LJ. Vision in multiple sclerosis: the story, structure-function correlations, and models for neuroprotection. Journal of neuro-ophthalmology : the official journal of the North American Neuro-Ophthalmology Society 2011;31:362-373. 7. Foster PJ, Buhrmann R, Quigley HA, Johnson GJ. The definition and classification of glaucoma in prevalence surveys. The British journal of ophthalmology 2002;86:238-242. 8. Quigley HA. Glaucoma. Lancet 2011;377:1367-1377. 9. Weinreb RN, Khaw PT. Primary open-angle glaucoma. Lancet 2004;363:1711-1720. 10. Quigley HA. Number of people with glaucoma worldwide. The British journal of ophthalmology 1996;80:389-393. 11. Quigley HA, Broman AT. The number of people with glaucoma worldwide in 2010 and 2020. The British journal of ophthalmology 2006;90:262-267. 12. Harrington DO. Differential diagnosis of the arcuate scotoma. Investigative ophthalmology 1969;8:96-105. 13. Quigley HA, Dunkelberger GR, Green WR. Retinal ganglion cell atrophy correlated with automated perimetry in human eyes with glaucoma. American journal of ophthalmology 1989;107:453-464. 14. Kerrigan-Baumrind LA, Quigley HA, Pease ME, Kerrigan DF, Mitchell RS. Number of ganglion cells in glaucoma eyes compared with threshold visual field tests in the same persons. Investigative ophthalmology & visual science 2000;41:741-748. 15. Patino CM, Varma R, Azen SP, et al. The impact of change in visual field on health-related quality of life the los angeles latino eye study. Ophthalmology 2011;118:1310-1317. 16. Ramulu P. Glaucoma and disability: which tasks are affected, and at what stage of disease? Current opinion in ophthalmology 2009;20:92-98. 17. Varma R, Lee PP, Goldberg I, Kotak S. An assessment of the health and economic burdens of glaucoma. American journal of ophthalmology 2011;152:515-522. 18. Harwerth RS, Vilupuru AS, Rangaswamy NV, Smith EL, 3rd. The relationship between nerve fiber layer and perimetry measurements. Investigative ophthalmology & visual science 2007;48:763-773. 19. Harwerth RS, Wheat JL, Fredette MJ, Anderson DR. Linking structure and function in glaucoma. Progress in retinal and eye research 2010;29:249-271.

27
20. Boling W, WuDunn D, Cantor LB, Hoop J, James M, Nukala V. Correlation between macular thickness and glaucomatous visual fields. Journal of glaucoma 2012;21:505-509. 21. Cho JW, Sung KR, Lee S, et al. Relationship between visual field sensitivity and macular ganglion cell complex thickness as measured by spectral-domain optical coherence tomography. Investigative ophthalmology & visual science 2010;51:6401-6407. 22. Grewal DS, Sehi M, Paauw JD, Greenfield DS, Advanced Imaging in Glaucoma Study G. Detection of progressive retinal nerve fiber layer thickness loss with optical coherence tomography using 4 criteria for functional progression. Journal of glaucoma 2012;21:214-220. 23. Hood DC, Anderson SC, Wall M, Kardon RH. Structure versus function in glaucoma: an application of a linear model. Investigative ophthalmology & visual science 2007;48:3662-3668. 24. Kanadani FN, Hood DC, Grippo TM, et al. Structural and functional assessment of the macular region in subjects with glaucoma. The British journal of ophthalmology 2006;90:1393-1397. 25. Kim NR, Lee ES, Seong GJ, Kim JH, An HG, Kim CY. Structure-function relationship and diagnostic value of macular ganglion cell complex measurement using Fourier-domain OCT in glaucoma. Investigative ophthalmology & visual science 2010;51:4646-4651. 26. Lederer DE, Schuman JS, Hertzmark E, et al. Analysis of macular volume in normal and glaucomatous eyes using optical coherence tomography. American journal of ophthalmology 2003;135:838-843. 27. Raza AS, Cho J, de Moraes CG, et al. Retinal ganglion cell layer thickness and local visual field sensitivity in glaucoma. Archives of ophthalmology 2011;129:1529-1536. 28. Schuman JS, Hee MR, Puliafito CA, et al. Quantification of nerve fiber layer thickness in normal and glaucomatous eyes using optical coherence tomography. Archives of ophthalmology 1995;113:586-596. 29. Shafi A, Swanson WH, Dul MW. Structure and function in subjects with glaucomatous defects near fixation. Optometry and vision science : official publication of the American Academy of Optometry 2011;88:130-139. 30. Sung KR, Kim JS, Wollstein G, Folio L, Kook MS, Schuman JS. Imaging of the retinal nerve fibre layer with spectral domain optical coherence tomography for glaucoma diagnosis. The British journal of ophthalmology 2011;95:909-914. 31. Sung KR, Wollstein G, Kim NR, et al. Macular assessment using optical coherence tomography for glaucoma diagnosis. The British journal of ophthalmology 2012;96:1452-1455. 32. Tan O, Li G, Lu AT, Varma R, Huang D, Advanced Imaging for Glaucoma Study G. Mapping of macular substructures with optical coherence tomography for glaucoma diagnosis. Ophthalmology 2008;115:949-956. 33. Wollstein G, Kagemann L, Bilonick RA, et al. Retinal nerve fibre layer and visual function loss in glaucoma: the tipping point. The British journal of ophthalmology 2012;96:47-52. 34. Leite MT, Rao HL, Weinreb RN, et al. Agreement among spectral-domain optical coherence tomography instruments for assessing retinal nerve fiber layer thickness. American journal of ophthalmology 2011;151:85-92 e81. 35. Zeimer R, Shahidi M, Mori M, Zou S, Asrani S. A new method for rapid mapping of the retinal thickness at the posterior pole. Investigative ophthalmology & visual science 1996;37:1994-2001. 36. Harwerth RS, Carter-Dawson L, Shen F, Smith EL, 3rd, Crawford ML. Ganglion cell losses underlying visual field defects from experimental glaucoma. Investigative ophthalmology & visual science 1999;40:2242-2250. 37. Harwerth RS, Quigley HA. Visual field defects and retinal ganglion cell losses in subjects with glaucoma. Archives of ophthalmology 2006;124:853-859. 38. Jampel HD, Singh K, Lin SC, et al. Assessment of visual function in glaucoma: a report by the American Academy of Ophthalmology. Ophthalmology 2011;118:986-1002.
28
39. Ventura LM, Sorokac N, De Los Santos R, Feuer WJ, Porciatti V. The relationship between retinal ganglion cell function and retinal nerve fiber thickness in early glaucoma. Investigative ophthalmology & visual science 2006;47:3904-3911. 40. Garway-Heath DF, Holder GE, Fitzke FW, Hitchings RA. Relationship between electrophysiological, psychophysical, and anatomical measurements in glaucoma. Investigative ophthalmology & visual science 2002;43:2213-2220. 41. Um TW, Sung KR, Wollstein G, Yun SC, Na JH, Schuman JS. Asymmetry in hemifield macular thickness as an early indicator of glaucomatous change. Investigative ophthalmology & visual science 2012;53:1139-1144. 42. Zeimer R, Asrani S, Zou S, Quigley H, Jampel H. Quantitative detection of glaucomatous damage at the posterior pole by retinal thickness mapping. A pilot study. Ophthalmology 1998;105:224-231. 43. Wheat JL, Rangaswamy NV, Harwerth RS. Correlating RNFL thickness by OCT with perimetric sensitivity in glaucoma subjects. Journal of glaucoma 2012;21:95-101. 44. Jacob M, Raverot G, Jouanneau E, et al. Predicting visual outcome after treatment of pituitary adenomas with optical coherence tomography. American journal of ophthalmology 2009;147:64-70 e62. 45. Kanamori A, Nakamura M, Matsui N, et al. Optical coherence tomography detects characteristic retinal nerve fiber layer thickness corresponding to band atrophy of the optic discs. Ophthalmology 2004;111:2278-2283. 46. Garway-Heath DF, Caprioli J, Fitzke FW, Hitchings RA. Scaling the hill of vision: the physiological relationship between light sensitivity and ganglion cell numbers. Investigative ophthalmology & visual science 2000;41:1774-1782. 47. Hood DC, Kardon RH. A framework for comparing structural and functional measures of glaucomatous damage. Progress in retinal and eye research 2007;26:688-710. 48. Redmond T, Garway-Heath DF, Zlatkova MB, Anderson RS. Sensitivity loss in early glaucoma can be mapped to an enlargement of the area of complete spatial summation. Investigative ophthalmology & visual science 2010;51:6540-6548. 49. Curcio, CA, Allen KA. Topography of ganglion cells in human retina. J Comp Neurol 1990;300(1):5-25 50. Alluwimi, MS, Swanson, WH, Malinovsky, VE. Between-subject variability in asymmetry analysis of macular thickness. Optometry and Vision Science 2014;91(5)484 51. Chauhan, BC, Sharpe, GP, Hutchison, DM. Imaging of the temporal raphe with optical coherence tomography. Ophthalmology 2014;121(11)2287-2288.

29
Appendices
Figure 1a Figure 1b Figure 1c
30
Figure 1d
Figure1a: Color fundus photo of a left eye with anatomic-structural damage due to glaucoma. Note the inferior notch between the 5:00 – 6:00 position (arrow) of the optic nerve and the inferior wedge shaped defect in the retinal nerve fiber layer (RNFL) (arrow heads) Figure 1b: An SD-OCT representation of RNFL with notching correlating with that seen in the color photo. Figure 1c: An SD-OCT representation of the hemifield macular thickness asymmetry map demonstrating thinning of inferior retina compared to the superior retinal hemifield. Figure 1d: An automated visual field of the left eye performed by this patient demonstrates functional superior visual field loss which correlates well with the structural damage in the inferior retina due to glaucoma.

31
Figure 2 Anatomic representation of the portion of the visual pathway within the human
retina

32
Figure 3 Graph of ONH intercept (x axis) vs Hemifield Ratio (y axis) demonstrating the increasing superior to inferior hemifield ratio as the ONH intercept moves towards the inferior pole. Position 1 is the intercept locations at the superior pole of the ONH, position 2 is the intercept located half-way between the superior pole and the mid point of the ONH, position 3 is the mid-point of the ONH, position 4 is half-way between the mid-point of the ONH and the inferior pole and position 5 is the inferior pole of the ONH. The red points represent the hemifield ratios of the subject from Figure 2.
R² = 0.03818
R² = 0.42777
0.85
0.95
1.05
1.15
0 1 2 3 4 5
Hem
ifiel
d R
atio
Position
Hemifield Ratio vs Position
Subjects
Controls
Linear (Subjects)Linear (Controls)

33
Figure 4 Graph of ONH intercept (x axis) vs Temporal Quadrant Ratio (y axis) showing the increasing superior vs inferior temporal quadrant ratio as the ONH intercept moves towards the inferior pole. Position 1 is the intercept locations at the superior pole of the ONH, position 2 is the intercept located half-way between the superior pole and the mid point of the ONH, position 3 is the mid-point of the ONH, position 4 is half-way between the mid-point of the ONH and the inferior pole and position 5 is the inferior pole of the ONH. The red points represent the quandrant ratios of the subject from Figure 2.
R² = 0.02154
R² = 0.4956
0.85
0.95
1.05
1.15
0 1 2 3 4 5
Qua
dran
t Rat
io
Position
Quadrant Ratio vs Position
Subjects
Controls
Linear (Subjects)Linear (Controls)

34
Subjects Controls
Average Age 64 41
Males 6 8
Females 20 4
Average Mean Defect 7.43 0.537
Average Pattern Deviation 9.60 1.175 Figure 5 Table of subject population demographics
35
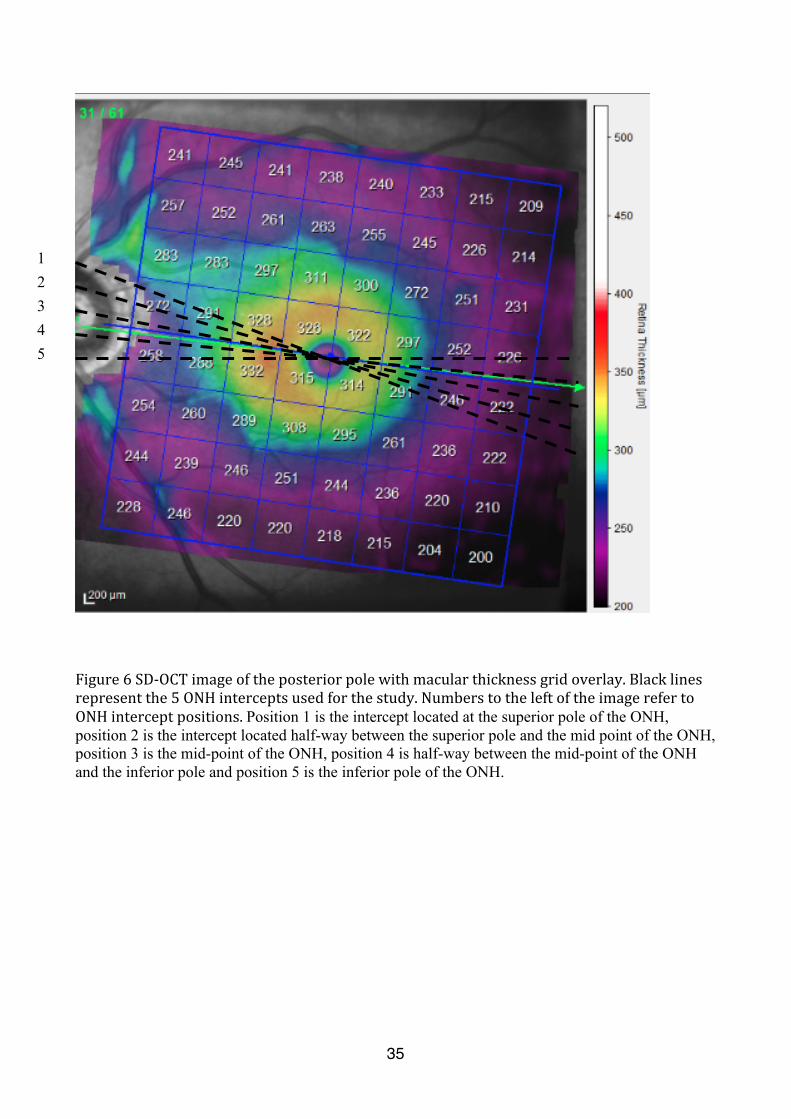
Figure 6 SD-‐OCT image of the posterior pole with macular thickness grid overlay. Black lines represent the 5 ONH intercepts used for the study. Numbers to the left of the image refer to ONH intercept positions. Position 1 is the intercept located at the superior pole of the ONH, position 2 is the intercept located half-way between the superior pole and the mid point of the ONH, position 3 is the mid-point of the ONH, position 4 is half-way between the mid-point of the ONH and the inferior pole and position 5 is the inferior pole of the ONH.
1 2 3 4 5

36
Figure 7 SPECTRALIS® SD-‐OCT image illustrating the different retinal layers
37
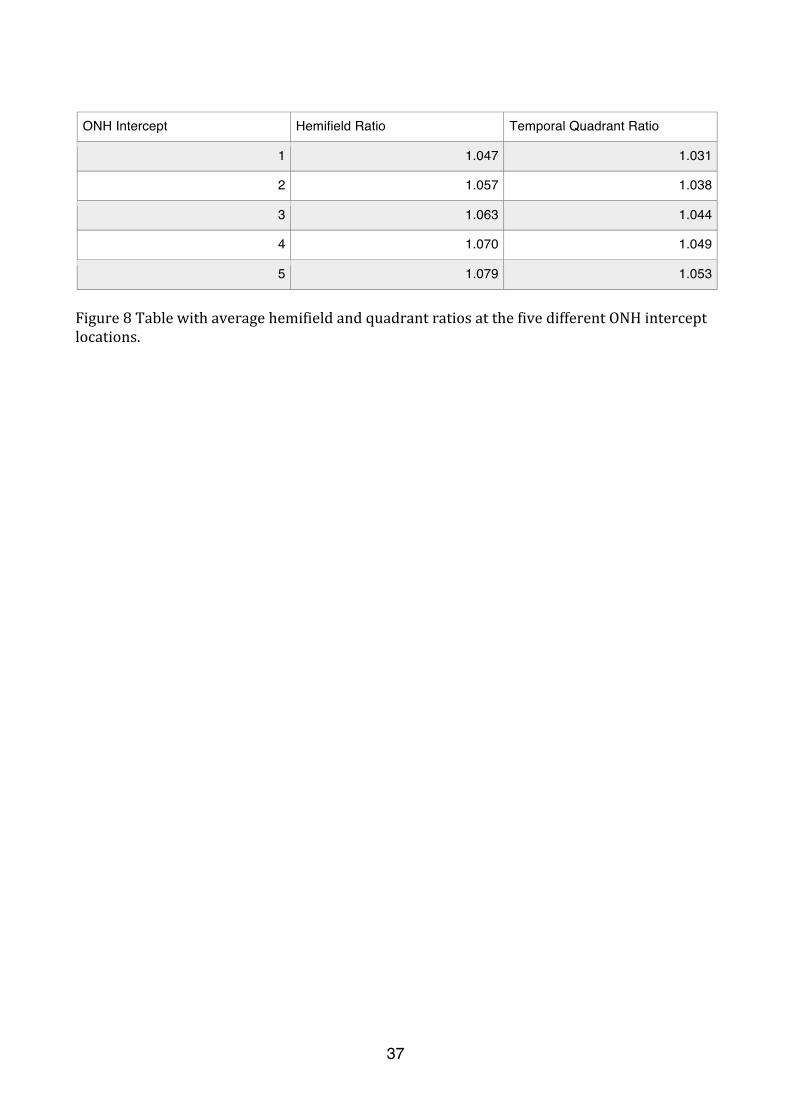
ONH Intercept Hemifield Ratio Temporal Quadrant Ratio
1 1.047 1.031
2 1.057 1.038
3 1.063 1.044
4 1.070 1.049
5 1.079 1.053
Figure 8 Table with average hemifield and quadrant ratios at the five different ONH intercept locations.